Social Vulnerability Indicators for Flooding in Aotearoa New Zealand - MDPI
←
→
Page content transcription
If your browser does not render page correctly, please read the page content below
International Journal of
               Environmental Research
               and Public Health

Article
Social Vulnerability Indicators for Flooding in Aotearoa
New Zealand
Kylie Mason * , Kirstin Lindberg, Carolin Haenfling, Allan Schori, Helene Marsters, Deborah Read
and Barry Borman

                                           Environmental Health Intelligence New Zealand, College of Health, Massey University, P.O. Box 756,
                                           Wellington 6140, New Zealand; k.lindberg@massey.ac.nz (K.L.); c.haenfling@massey.ac.nz (C.H.);
                                           A.schori@massey.ac.nz (A.S.); t.h.marsters@massey.ac.nz (H.M.); d.read@massey.ac.nz (D.R.);
                                           b.borman@massey.ac.nz (B.B.)
                                           * Correspondence: k.mason@massey.ac.nz

                                           Abstract: Social vulnerability indicators are a valuable tool for understanding which population
                                           groups are more vulnerable to experiencing negative impacts from disasters, and where these groups
                                           live, to inform disaster risk management activities. While many approaches have been used to
                                           measure social vulnerability to natural hazards, there is no single method or universally agreed
                                           approach. This paper proposes a novel approach to developing social vulnerability indicators, using
                                           the example of flooding in Aotearoa New Zealand. A conceptual framework was developed to guide
                                           selection of the social vulnerability indicators, based on previous frameworks (including the MOVE

                                    framework), consideration of climate change, and a holistic view of health and wellbeing. Using
                                           this framework, ten dimensions relating to social vulnerability were identified: exposure; children;
Citation: Mason, K.; Lindberg, K.;
                                           older adults; health and disability status; money to cope with crises/losses; social connectedness;
Haenfling, C.; Schori, A.; Marsters, H.;
                                           knowledge, skills and awareness of natural hazards; safe, secure and healthy housing; food and water
Read, D.; Borman, B. Social
Vulnerability Indicators for Flooding
                                           to cope with shortage; and decision making and participation. For each dimension, key indicators
in Aotearoa New Zealand. Int. J.           were identified and implemented, mostly using national Census population data. After development,
Environ. Res. Public Health 2021, 18,      the indicators were assessed by end users using a case study of Porirua City, New Zealand, then
3952. https://doi.org/10.3390/             implemented for the whole of New Zealand. These indicators will provide useful data about social
ijerph18083952                             vulnerability to floods in New Zealand, and these methods could potentially be adapted for other
                                           jurisdictions and other natural hazards, including those relating to climate change.
Academic Editors: Kimberley
R. Miner, Shaleen Jain and                 Keywords: social vulnerability; resilience; indicators; natural hazards; flooding; disaster; health
Anne Lausier

Received: 1 March 2021
Accepted: 1 April 2021
                                           1. Introduction
Published: 9 April 2021
                                                Natural hazards can have major impacts on people’s health and wellbeing, both in
Publisher’s Note: MDPI stays neutral
                                           the short and long term, and through both direct and indirect impacts from the hazard.
with regard to jurisdictional claims in
                                           Managing disaster risk, and protecting the health and wellbeing of populations from
published maps and institutional affil-    natural hazards, is becoming increasingly important in this changing world. Climate
iations.                                   change is likely to increase the frequency and severity of climate-related disasters such as
                                           floods in many regions of the world [1]. Additionally, population growth, urbanisation,
                                           and changing socioeconomic conditions can increase society’s exposure and vulnerability
                                           to natural hazards [2]. In this context, having a clear understanding of the likely impacts
Copyright: © 2021 by the authors.
                                           of disasters on people’s health and wellbeing, and who is the most vulnerable to these
Licensee MDPI, Basel, Switzerland.
                                           impacts, can help support the planning and targeting of interventions [3].
This article is an open access article
                                                In Aotearoa New Zealand, the most frequent and costly natural disaster is flooding.
distributed under the terms and            Approximately two-thirds of the New Zealand population live in flood-prone areas [4],
conditions of the Creative Commons         and many of New Zealand’s towns and cities are built on floodplains. On average, a major
Attribution (CC BY) license (https://      flood occurs every eight months in New Zealand [4], and the total costs of flooding in New
creativecommons.org/licenses/by/           Zealand are estimated to be more than $125 million per year [5]. In the ten year period
4.0/).                                     2009–2018, there were 28 flood-related events where insurance damages were more than

Int. J. Environ. Res. Public Health 2021, 18, 3952. https://doi.org/10.3390/ijerph18083952                     https://www.mdpi.com/journal/ijerph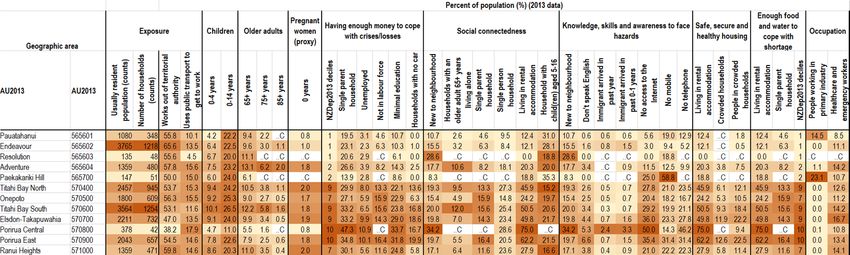
Int. J. Environ. Res. Public Health 2021, 18, 3952                                                                                 2 of 31

                                        $1 million (inflation adjusted) [6]. In New Zealand, floods have had substantial impacts
                                        on people’s lives, in both the short term (e.g., gastrointestinal illness), as well as longer
                                        term (e.g., psychological distress, displacement) [7–10]. Flooding is likely to increase in
                                        frequency and severity in New Zealand due to climate change [4], and is one of the key
                                        risks from climate change this century in New Zealand [11].
                                              Flooding can have a range of health impacts, including drowning, trauma injuries, hy-
                                        pothermia, and infections, as well as electrical injuries, burns and explosives injuries [12–16].
                                        Floods can also increase the risk of waterborne diseases such as gastrointestinal illnesses,
                                        hepatitis A and E, cholera, typhoid fever, leptospirosis, and vector-borne diseases [12,13,15]
                                        and can increase the risk of heart attacks and respiratory problems [14], poor pregnancy
                                        outcomes [12,17], poor mental health [17], and exacerbations of substance abuse issues [17].
                                        Longer term, flooding can impact on food supply, and lead to food insecurity and poor
                                        nutrition [12].
                                              Infrastructure breakdown and disruptions to essential infrastructure and services dur-
                                        ing and after floods can also have substantial health impacts [17]. Disruptions to transport
                                        systems can delay first responders, impact on evacuation, and prevent access to health
                                        services, which can affect people with physical and mental health issues [17], including
                                        those on opioid substitution treatment [18]. Power outages can lead to food-borne illnesses
                                        through lack of refrigeration, carbon monoxide poisoning from unventilated generators,
                                        and affect medically dependent people, the young, and the old [15,17]. Floodwaters can
                                        also cause property damage, which can lead to overcrowding and displacement, and
                                        respiratory issues from damp and mouldy housing [19,20]. Flooding can also lead to loss
                                        of employment, lack of access to childcare services and schooling, and increased domestic
                                        violence [21,22].
                                              The negative impacts of natural hazards such as floods on people’s health and well-
                                        being are not evenly distributed throughout society. People who are already struggling
                                        financially, who live in poor-quality housing, or who are socially isolated are more likely
                                        to experience significant adverse impacts from natural hazards [16,23,24]. Furthermore,
                                        not everyone in the population is able bodied, can hear, see and move, can understand the
                                        hazard, and can understand and carry out what they need to do to prepare or escape the
                                        hazard [25]. As a result, some population groups are more vulnerable to natural hazards
                                        and are less able to prepare for, cope with, and recover from natural hazards than others.
                                        Nonetheless, if community and government services are equitable and accessible before,
                                        during and after a disaster, more vulnerable people can have the same opportunity as
                                        others to be resilient [25]. Similarly, fully considering the needs of specific population
                                        groups in emergency management planning can reduce their vulnerability to natural
                                        hazards [23,26].
                                              The term ‘social vulnerability’ is broadly used to refer to pre-existing conditions,
                                        characteristics or circumstances of people that affect their ability to prepare for, respond
                                        to, and recover from natural hazards [27]. A similar concept is ‘resilience’, which refers
                                        to the ability to “anticipate and resist the effects of a disruptive event, minimise adverse
                                        impacts, respond effectively post-event, maintain or recover functionality, and adapt in a
                                        way that allows for learning and thriving” [28], which can occur at the level of individuals,
                                        communities, organizations and/or states [29]. Information on social vulnerability is useful
                                        for risk assessment, understanding where the greatest need may be before, during and after
                                        a natural hazard, and providing insight about the needs of the local people and the likely
                                        impacts that natural hazards may have [25]. Social vulnerability indicators can therefore
                                        inform disaster risk reduction, preparedness, mitigation plans, and response and recovery
                                        activities, for civil defence practitioners, health authorities, local authorities, emergency
                                        services, and community organizations.
                                              Several sets of social vulnerability indicators for natural hazards exist, including the
                                        Social Vulnerability Index (SoVI) [27,30], the Social Determinants of Vulnerability Frame-
                                        work [25], and the Social Vulnerability Index for Disaster Management [23] in the United
                                        States. Additionally, flood-specific social vulnerability indicator sets include the Urban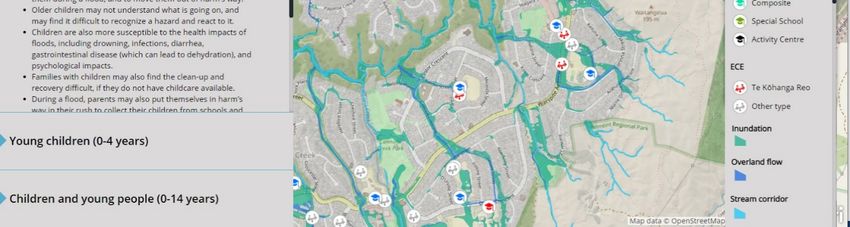
Int. J. Environ. Res. Public Health 2021, 18, 3952                                                                              3 of 31

                                        Municipality Flood Vulnerability Index in Brazil [31], the Social Flood Vulnerability Index
                                        in England and Wales [32], and the Cologne (Germany) flood indicators [33]. Populations
                                        groups identified as being most vulnerable to floods, and/or natural hazards more broadly,
                                        include children, older adults, women, people with pre-existing health conditions, people
                                        living in poverty, low-income households, low educational attainment, unemployment, sin-
                                        gle parents, disabled people, certain races or ethnic groups, institutionalised populations,
                                        nursing home residents, renters, people with shorter length of residence, housing stock,
                                        poor quality housing, non-car ownership, household crowding, living in rural commu-
                                        nities, and having English as a second language [7,23,25,27,31–35]. However, despite the
                                        numerous pieces of work on indicators of social vulnerability and resilience to floods and
                                        natural hazards more broadly, there is no definitive set of social vulnerability indicators or
                                        single approach to indicator development [34,36].
                                              There are several challenges in developing social vulnerability indicators for natural
                                        hazards. Existing indicator lists and data sources may be difficult to transfer to a different
                                        setting (e.g., country to country), as indicator sets need to be context specific and relate
                                        to the social environment within that country [3]. Consequently, using ‘off the shelf’
                                        indicator sets, or simply replicating indicator sets from other countries, may not work
                                        well in a country-specific setting. Furthermore, considering only a narrow set of impacts
                                        (e.g., only deaths and injuries) when scoping the social vulnerability indicators can miss
                                        important aspects such as housing, social connectedness, and economic wellbeing [35].
                                        Additionally, some statistical methods (such as principal components analysis) used to
                                        develop indices and/or indicator sets can be influenced by data availability and the
                                        weightings used, leading to certain types of indicators (such as economic factors) having
                                        greater influence [34]. These statistical methods can also be challenging for policymakers
                                        to understand, and problematic to replicate, as the outputs are only pertinent to the time
                                        period and geographical area covered by the analysis. While summarising indicators into a
                                        single index value can provide simplicity of interpretation, it can also hide the underlying
                                        reasons for vulnerability in a local area [34].
                                              In New Zealand, relatively few indicator sets relating to social vulnerability and natu-
                                        ral hazards have been developed. Studies have tested the use of an index of neighbourhood
                                        socioeconomic deprivation (NZDep) as a proxy for vulnerability to natural hazards [37],
                                        proposed a set of earthquake social vulnerability indicators [35], and explored potential
                                        vulnerability indices for flooding in the Hutt Valley, New Zealand [34]. However, no set of
                                        social vulnerability indicators for natural hazards or flooding has been fully developed
                                        and implemented in the New Zealand context. While emergency management organi-
                                        zations well understand the factors that shape social vulnerability to natural hazards,
                                        there is little quantitative information at the local level to help inform their emergency
                                        management activities.
                                              This study developed a set of social vulnerability indicators for flooding in Aotearoa
                                        New Zealand. These indicators aimed to provide a practical tool to inform local efforts
                                        in emergency management and health care, before, during and after a flood, and provide
                                        information to inform important risk reduction and emergency management activities.
                                              The specific aims of this study were:
                                        1.     To identify a set of social vulnerability indicators for flooding for New Zealand
                                        2.     To identify populations vulnerable to flooding, and important facilities and infras-
                                               tructure within flood zones, for a case study of Porirua City, New Zealand
                                        3.     To identify how indicators could potentially be used by emergency management,
                                               local councils and the health sector.

                                        2. Existing Vulnerability Frameworks and Indicators
                                        2.1. Conceptual Models for Vulnerability
                                            In natural hazards research, risk is generally conceptualised as the potential for loss,
                                        and is given as a function of hazard and vulnerability, where vulnerability refers to the
                                        propensity of exposed people to experience harm and suffer loss [33]. Disaster risk has also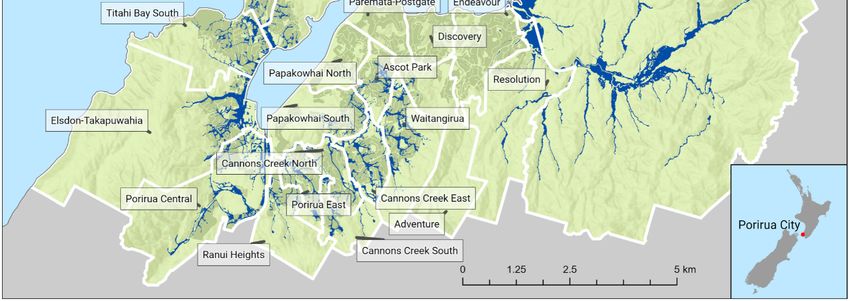
Int. J. Environ. Res. Public Health 2021, 18, 3952                                                                                 4 of 31

                                        been defined as a function of hazard, exposure, and vulnerability/capacity [38,39], while
                                        the Intergovernmental Panel on Climate Change (IPCC) has defined climate change risk as
                                        a function of hazard, exposure and vulnerability [40]. Thus, vulnerability is often a core
                                        component of disaster risk.
                                              Some models already exist for understanding and describing different aspects of
                                        social vulnerability to natural hazards. The Hazards-of-Place model focuses on how the
                                        geographic context interacts with the social characteristics of society to produce the overall
                                        place vulnerability [30]. The Pressure and Release model describes how vulnerability arises
                                        from inequalities in society, which create pressure in society [41]. The Access model focuses
                                        on the access that people have to capacities, assets and opportunities [41]. The Vulner-
                                        ability Framework frames vulnerability as having components of exposure, sensitivity
                                        and resilience, and being influenced by a range of contextual factors at the societal and
                                        environmental levels [42]. These models are not generally conflicting; rather, they describe
                                        vulnerability from different perspectives and have different focuses [33]. However, they
                                        generally do not explicitly consider the impacts of climate change.
                                              For climate change vulnerability, the IPCC describes how vulnerability and risk
                                        are influenced by the hazard, exposure, sensitivity, and people’s capacity to cope and
                                        adapt [43]. Similarly, the US Climate Change and Health framework for determinants
                                        of vulnerability of human health to climate change includes exposure, susceptibility and
                                        adaptive capacity [17].
                                              The Methods for the Improvement of Vulnerability Assessment in Europe (MOVE)
                                        framework has been developed as a generic conceptual framework for guiding vulnerability
                                        assessment and development of indicators [33]. The MOVE framework takes a holistic
                                        approach, being designed to work for not only natural hazards but also climate change.
                                        It incorporates the key elements of risk, hazard and vulnerability [33]. According to
                                        the MOVE framework, hazards (natural events or socio-natural events) interact with
                                        society (which includes vulnerability), to produce a risk (economic, social or environmental
                                        potential impact). In the MOVE framework, vulnerability has three components [33]:
                                        i.           Exposure: temporal and spatial;
                                        ii.          Susceptibility/fragility: the predisposition to suffer harm; can include physical,
                                                     ecological, social, economic, cultural, and institutional;
                                        iii.         Lack of resilience: lack of capacity to anticipate, cope and recover.
                                             The MOVE framework has been tested in a number of case studies, including for
                                        flooding in Cologne (Germany) [33], Tokyo (Japan) [44] and Côte d’Ivoire [45].
                                             The MOVE framework can be used to consider different types of vulnerability, includ-
                                        ing social, physical, ecological, economic, cultural and institutional. The social dimension
                                        of vulnerability in the MOVE framework refers to the propensity of people’s wellbeing to
                                        be damaged [33].

                                        2.2. Existing Indicators for Social Vulnerability to Flooding
                                             A range of social vulnerability indicators for natural hazards have been developed
                                        internationally. Some indicator sets or indices have been specifically developed for flooding,
                                        while others have been developed for natural hazards more generally (see Appendix A for
                                        more details).
                                             One of the first social vulnerability indices for natural hazards was the Social Vul-
                                        nerability Index (SoVI) [27,30]. The SoVI was based on the Hazards-of-Place model of
                                        vulnerability, and used statistical methods to reduce 42 variables to a key 11 variables.
                                        These variables were then weighted and combined to create the index, at the United States
                                        county level. The variables were a mix of demographic characteristics, built environment,
                                        and infrastructure characteristics.
                                             In the United States, the Social Determinants of Vulnerability Framework identified
                                        key social factors that resulted in people having disproportionate exposure to risk and a
                                        decreased ability to avoid or absorb potential losses [25]. A grounded theory approach was
                                        carried out, using a link analysis of social factors from existing literature, to investigate the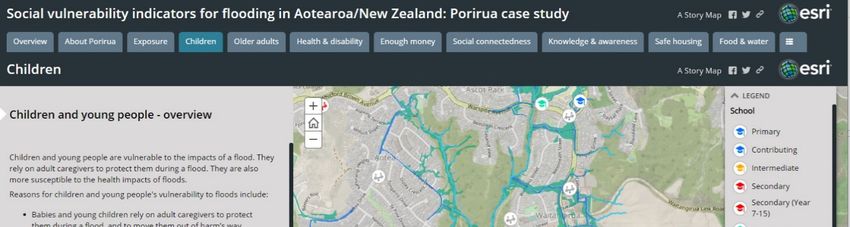
Int. J. Environ. Res. Public Health 2021, 18, 3952                                                                             5 of 31

                                        relationships between social factors. Seven key interrelated social factors were identified:
                                        children, older adults, people with disabilities, chronic and acute medical illness, social
                                        isolation, low-to-no income, and people of colour. Additional indicators that were also
                                        found to be important included women, lower educational attainment, limited English
                                        proficiency, renters, and a lack of a vehicle.
                                              Several sets of social vulnerability indices for floods exist. The Urban Municipality
                                        Flood Vulnerability Index identified key components of urban vulnerability to floods
                                        in Brazil, incorporating age, health status, education, income, work status, access to
                                        telecommunications, housing, flood preparedness, and access to services [31]. The Social
                                        Flood Vulnerability Index, developed in the United Kingdom, included indicators about
                                        financial deprivation, pre-existing health problems, single parents, and the elderly [32].
                                        The Social Vulnerability Index for Disaster Management created an index for the United
                                        States, based on 15 indicators across four social vulnerability domains: socioeconomic
                                        status, household composition and disability, minority status and language, and housing
                                        and transportation [23].
                                              In the New Zealand context, one study tested the use of the New Zealand Index
                                        of Socioeconomic Deprivation (NZDep) [46] to understand vulnerability due to limited
                                        financial resources, as a proxy for social vulnerability to natural hazards [37]. However,
                                        the study noted that NZDep did not tell the full story of vulnerability, and could not act as
                                        a proxy for all types of vulnerability, such as age or disability status. A comparison of po-
                                        tential vulnerability assessment methods for flooding in the Hutt Valley (in the Wellington
                                        region of New Zealand) identified 38 initial proxy indicators relating to vulnerability to
                                        flooding, in the broad groupings of demographic, social and economic indicators [34]. This
                                        study tested different methods for combining indicators into indices, and concluded that
                                        different methods gave different picture of vulnerability. They therefore recommended that
                                        a comprehensive vulnerability assessment was required to fully understand vulnerability
                                        to floods, rather than simply an index. Subsequently, Kwok identified potential social
                                        vulnerability indicators for earthquakes in New Zealand, using the SoVI index as a starting
                                        point for indicators [35]. The suggested indicators covered poverty, race and ethnicity,
                                        wealth, age, gender, and care dependency, medical disability and health care access. The
                                        final indicator set was not implemented, as the study did not identify any data sources
                                        or indicator definitions, or make an indicator dataset available. The study concluded
                                        that social vulnerability indicators need to be context sensitive, and that future indicator
                                        development work could consider community objectives, such as knowledge and skills,
                                        economic wellbeing, housing, health, safety, social connectedness, civic participation, and
                                        population dynamics. Other studies in New Zealand have investigated factors relating to
                                        resilience to natural hazards, including describing resilience factors among New Zealand’s
                                        indigenous people, Māori, after the 2011 Christchurch earthquake [47], developing a na-
                                        tional resilience index (incorporating system-level resilience factors) [48], and identifying
                                        resilience factors within selected communities, using qualitative research methods [49].
                                              In summary, there is currently no consensus on the specific variables to use when
                                        measuring social vulnerability to natural hazards. However, some key socio-demographic
                                        groups appeared across multiple indicator sets, including young children, elderly, people
                                        with chronic health conditions, people with disabilities, low income, access to transport or
                                        communications, housing (rental housing, housing quality, overcrowding), occupation, and
                                        race or ethnicity. Many international indicator sets were also context specific, for example
                                        including indicators on the presence of informal settlements (e.g., slums and mobile
                                        homes), which may not be relevant to all countries. Additionally, a variety of methods
                                        have been used to develop indicator sets, with few studies using a conceptual framework
                                        to understand the underlying reasons why people might be vulnerable to flooding, or
                                        to guide indicator selection. Of those that did, the MOVE framework was the most
                                        common, identifying indicator for exposure, susceptibility and lack of resilience [33,45].
                                        Other indicator sets used more generic dimensions, such as demographic, social and
                                        economic factors.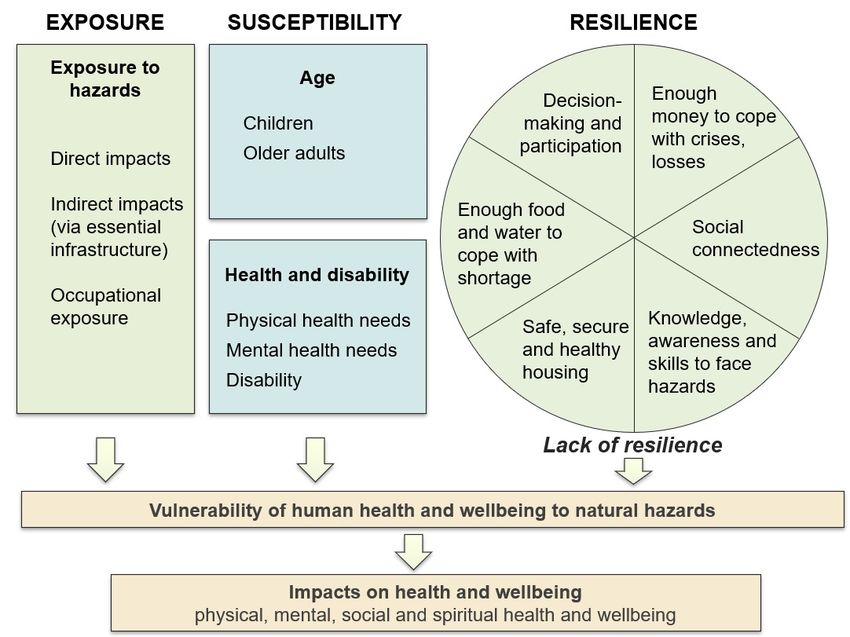
Int. J. Environ. Res. Public Health 2021, 18, 3952                                                                               6 of 31

                                              Given the scarcity of information and data about vulnerable populations in New
                                        Zealand, our study aimed to fill this gap by developing a set of social vulnerability in-
                                        dicators for flooding in New Zealand. Rather than attempting to replicate indicator sets
                                        developed in different jurisdictions and social contexts, which may not have been relevant
                                        for New Zealand, we chose to use a concept-driven approach for developing our indicator
                                        set. In addition, we chose to develop a set of indicators rather than an index, given the
                                        limitations of indices.

                                        3. Materials and Methods
                                            This study developed a set of social vulnerability indicators for flooding for New
                                        Zealand, then used a case study approach to test the indicators. An established indicator
                                        development process was used in the selection, design and implementation of the indicators.

                                        3.1. Study Area
                                             New Zealand is a geographically isolated island nation of approximately 5 million
                                        people, with many natural hazards, including floods, earthquakes, droughts and volcanoes.
                                             A case study area of Porirua City was used to test the social vulnerability indicators.
                                        Porirua City is a territorial authority of approximately 180 square kilometres in size, located
                                        approximately 25 kilometres north of the capital city of Wellington, in the lower North
                                        Island of New Zealand. Porirua had an estimated population of 56,800 people in 2018.
                                             Porirua has been affected multiple times by flooding, including in 2015 [50] and
                                        2016 [51], which led to road closures, school closures, and flooded properties. In particular,
                                        flooding has affected the low-lying neighbourhood of Takapūwāhia, which has a marae
                                        for the local Māori iwi, Ngāti Toa Rangatira, that has come close to flooding on multiple
                                        occasions. Figure 1 shows the Porirua area with flood zones, with the area units of Cannons
                                        Creek, Waitangirua, Elsdon-Takapūwāhia, Porirua East, Ascot Park, Porirua Central, and
                                        Titahi Bay particularly affected.

                                        3.2. Indicator Development Process
                                             A robust and well-tested process for developing indicators was used. This indicator
                                        development process was adapted from methods for developing environmental health
                                        indicators [52], based on the World Health Organization’s process for developing children’s
                                        environmental health indicators [53] and Statistics New Zealand guidance for developing
                                        indicators [54]. Methods for developing environmental health indicators are relevant for
                                        this work, given their focus on the impacts of environmental hazards on human health and
                                        wellbeing, and the social, economic and demographic context in which these impacts occur.
                                             The indicator development process followed three major stages: scoping, selection,
                                        and design and implementation (Figure 2). Stakeholder engagement was included through
                                        the indicator development process to gain the perspective of experts and potential end
                                        users, with the Porirua geographical area used as the focus. The stakeholder group com-
                                        prised representatives from the national emergency management agency, natural hazards
                                        researchers, as well as local Porirua representatives from the regional emergency manage-
                                        ment group, local council, public health service, and local health providers. Using this case
                                        study approach and engagement with stakeholders enabled identification of information
                                        needs of end users, feedback on the conceptual framework and proposed indicators, and
                                        identification of how the indicators would be used and best presented.

                                        3.2.1. Scoping Stage
                                             The scoping stage defined the information and data needs for the indicators, through
                                        identifying the end users, indicator purposes, and key issues that the indicators needed
                                        to cover. For this study, impacts of flooding on human health and wellbeing, and factors
                                        that increase people’s vulnerability to these impacts, were identified through reviewing
                                        background literature and key summary literature, expert opinions, and previous indicator
                                        sets. Previous conceptual frameworks for social vulnerability, and social vulnerability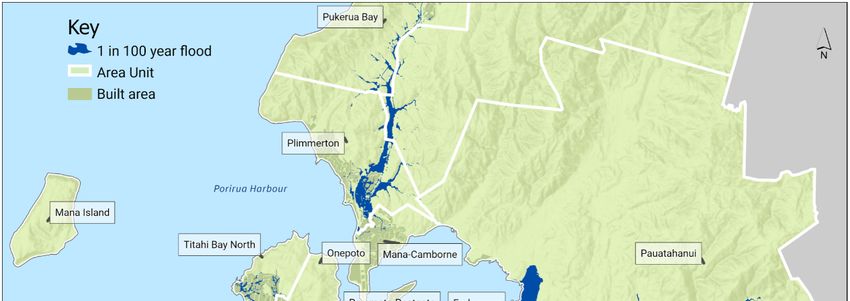
Int. J. Environ. Res. Public Health 2021, 18, 3952                                                                                7 of 31

                                         indicator sets, were also reviewed. This stage also defined the study scope, and the world
                                         view and understanding of the issues that the indicators needed to reflect. A public health
                                         perspective was used to guide the study, and a strengths-based approach was incorporated
                                         where appropriate. The study was limited to individual-level factors influencing social
                                         vulnerability, rather than system-level indicators.
                                                Potential end users of the indicators were also identified, including in the fields of
                                         emergency management, local and central government, and the health sector. Key needs
                                         for end users included having indicator data at the most detailed geographic level possible,
                                         to ensure that the vulnerability of local neighbourhoods could be understood. Data needed
                                         to be up-to-date, and relevant and meaningful to emergency management activities and the
                                         New Zealand context. Data were also needed about both the relative impact of vulnerability
                                         in an area, and the actual number of people affected. The policy context was also reviewed
Int. J. Environ. Res. Public Health 2021, 18, x FOR PEER REVIEW                                                                  7 of 33
                                         to identify how the indicators could be used within the existing emergency management
                                         structure in New Zealand.

      Figure 1.
      Figure   1. Map
                  Map of
                      of Porirua
                         Porirua City,  with flood
                                  City, with flood hazard
                                                   hazard zones
                                                           zones and
                                                                 and 2013
                                                                     2013 area
                                                                          area unit
                                                                               unit boundaries.
                                                                                    boundaries. Note:
                                                                                                 Note: Flood
                                                                                                       Flood hazard
                                                                                                             hazard zones  give the
                                                                                                                     zones give the
      flood  hazard  for a 1-in-100 year flood  event. These hazard zones account  for 100 year climate change impacts, in terms of
      flood hazard for a 1-in-100 year flood event. These hazard zones account for 100 year climate change impacts, in terms of sea
      sea level risk and increased rainfall. The models have used 1 metre sea-level rise and a 20% increased rainfall. The models
      level risk and increased rainfall. The models have used 1 metre sea-level rise and a 20% increased rainfall. The models were
      were prepared by Wellington Water. Sources: ESRI, NASA, NGA, USGS, OpenStreetMap, Statistics New Zealand, Wel-
      prepared by Wellington Water. Sources: ESRI, NASA, NGA, USGS, OpenStreetMap, Statistics New Zealand, Wellington
      lington Water, Porirua City Council.
      Water, Porirua City Council.
                                        3.2. Indicator Development Process
                                             A robust and well-tested process for developing indicators was used. This indicator
                                        development process was adapted from methods for developing environmental health
                                        indicators [52], based on the World Health Organization’s process for developing chil-
                                        dren’s environmental health indicators [53] and Statistics New Zealand guidance for de-
                                        veloping indicators [54]. Methods for developing environmental health indicators are rel-
                                        evant for this work, given their focus on the impacts of environmental hazards on human
                                        health and wellbeing, and the social, economic and demographic context in which these
                                        impacts occur.
                                             The indicator development process followed three major stages: scoping, selection,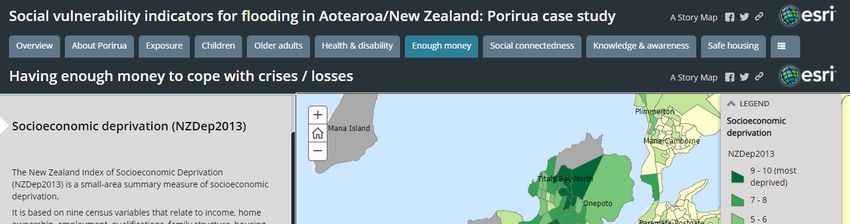
Int. J. Environ. Res. Public Health 2021, 18, 3952                                                                         8 of 31
  Int. J. Environ. Res. Public Health 2021, 18, x FOR PEER REVIEW                                                         8 of 33

                       Figure2.2.Social
                      Figure      Socialvulnerability
                                        vulnerability indicator
                                                       indicator development
                                                                 development process
                                                                             process (adapted
                                                                                     (adapted from
                                                                                              from Mason
                                                                                                   Mason et
                                                                                                         et al.
                                                                                                            al. [52]).
                                                                                                                 [52]).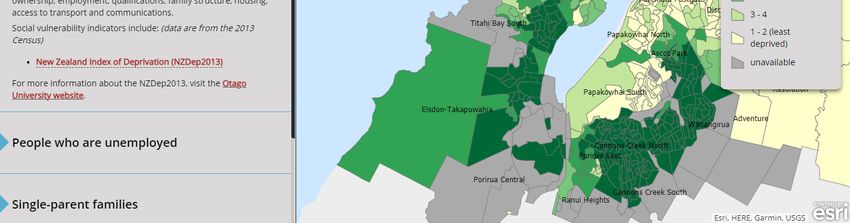
Int. J. Environ. Res. Public Health 2021, 18, 3952                                                                                          9 of 31

                                        3.2.2. Selection Stage
                                             The indicator selection stage identified a set of potential indicators that met the data
                                        and information needs found in the scoping stage. A fundamental approach for this
                                        stage was to use a conceptual framework to guide indicator selection [54]. Conceptual
                                        frameworks summarise concepts and how ideas are organized and relate to one another.
                                        Without a conceptual framework to guide indicator selection, indicator sets can be an
                                        eclectic mix of data-driven indicators, that make little sense together [54] and that are not
                                        balanced or relevant to the important underlying issues [53].
                                             Our conceptual framework was developed for social vulnerability to natural hazards,
                                        based on existing frameworks of social vulnerability and resilience to natural hazards and
                                        climate change [17,33,55]. The framework was designed to be practical, with dimensions
                                        that were measurable and able to be used for guiding indicator selection, as well as taking
                                        into account climate change. Potential indicators were identified to measure the different
                                        dimensions of the conceptual framework, based on previous indicator sets, expert advice,
                                        and available datasets. A public health perspective was incorporated in the indicator
                                        selection process, with indicators focusing primarily on those indicators relevant to the
                                        potential impacts on people’s health and wellbeing. The indicators were then evaluated
                                        against ten indicator selection criteria, based on previous statistical guides [54] and the
                                        EHINZ programme [52], and adapted to meet the specific needs of the end users (Table 1).

                                      Table 1. Selection criteria for selecting social vulnerability indicators.

                     Type                                    Selection Criteria              Details for the Social Vulnerability Indicators
                                                                                             Data need to be currently available; not too
                                                              Data availability
                                                                                             much work required to extract data
                                                                                             Data source needs to be reliable, accurate, and
                                                          Methodologically sound
                                                                                             representative of the population; minimal bias
                Data sources                                  measurement
                                                                                             and/or undercounting
                                                                                             Data need to be available at a local level
                                                          Able to be disaggregated
                                                                                             (neighbourhoods if possible)
                                                                                             Data need to be collected and reported
                                                                   Timely
                                                                                             frequently, so that data are not too out of date
                                                                                             Indicators should be not too complex to
                                                     Intelligible and easily interpretable   understand, and should be able to be understood
                                                                                             by a wide range of end users
                                                                                             Indicator definition and measurement needs to
                                                          Methodologically sound
                                                                                             be robust, and should measure some aspect of
                                                              measurement
                                                                                             the social vulnerability dimension
        Measurement of indicators
                                                                                             Indicators would ideally align with other
                                                      Consistent with other indicator
                                                                                             indicator datasets already being used by end
                                                              programmes
                                                                                             users
                                                                                             Indicators are sensitive to change, so that they
                                                             Sensitive to change
                                                                                             are measuring the current situation
                                                                                             Less of a priority for social vulnerability
                                                           Comparable over time              indicators, although ideally indicators can be
                                                                                             interpreted in similar ways over time
                                                                                             Robust evidence needed for why the indicators
                                                             Scientifically valid
                                                                                             are important (given the conceptual framework)
          Indicator relevance and
             appropriateness                                                                 Indicators need to relate to an issue of significant
                                                                                             public health impact for the country; if numbers
                                                            Public health impact
                                                                                             are too low nationally for an indicator, the
                                                                                             indicator may not be very helpful.
Int. J. Environ. Res. Public Health 2021, 18, 3952 10 of 31
The decision on the final set of indicators involved an iterative process of identifying
potential indicators, assessing the indicators against selection criteria, and testing the
indicators with stakeholders to ensure their usefulness.
3.2.3. Design and Implementation Stage
The design and implementation stage included defining the indicators in detail,
gathering and analysing the data, and preparing the final indicator outputs for end users.
Considerations included the type of data output (for example, counts, rates, or summary
indices) and geographical output (national, regional or local), depending on the needs of
end users. In this stage, we developed a draft set of indicators, which were then visualised
on maps for our case study area of Porirua, and assessed by stakeholders. Their comments
and feedback were incorporated, and a final indicator set was created for the whole of
New Zealand. Indicators were output at a range of geographical scales where possible,
including meshblock (approximately 100 people), area unit (approximately 2000 people),
territorial authority (of which there are 67 in New Zealand) and district health board (20 in
New Zealand). Indicator data were output as both percentages of the population (to show
relative impact) and counts of people (to show the number of people affected). In addition
to the indicators, point locations relating to vulnerable populations (such as schools, rest
homes and hospitals) were also identified through discussions with stakeholders, and
guided by the conceptual framework.
The presentation of indicator outputs was also highly important, as indicator data
needed to be accessible and meaningful to end users, and synthesise and communicate
information, ideally in an informative and lively way [53]. Indicator datasets were pro-
duced in Microsoft Excel, and a range of dissemination methods for the indicator data
were tested with stakeholders. As a result, ‘heatmaps’ were produced, by area unit for
each local council, to show indicators for each social vulnerability dimension, coloured
according to their relative value within the local council area. Online interactive maps
and data visualisations were also created for Porirua with ESRI ArcGIS Story Maps and
Tableau, showing maps of the indicators, as well as maps of point locations in relation to
local flood hazard zones (incorporating 100 year climate change impacts). Metadata were
also prepared for the final indicators, to provide detailed information about the indicators
for end users.
3.2.4. Stakeholder Engagement and Identifying Potential Uses for the Indicators
Stakeholders provided feedback and input at various stages throughout the indicator
development process, including on the study scope, their data needs, the conceptual frame-
work, draft indicators, and indicator data visualisations. Three stakeholder workshops
were held throughout the study, including one where stakeholders brainstormed ways
that indicators could be used in the local context. We also met with members of the local
Māori iwi (tribe), Ngāti Toa Rangatira, to discuss flooding impacts on their community and
vulnerabilities and barriers to feeling resilient to flooding, and received their input on the
study through an iwi representative and facilitator.
4. Results
4.1. Developing a Conceptual Framework for Social Vulnerability
We chose the MOVE framework as the basis for our conceptual framework to guide
indicator selection, given its generic and holistic approach, its applicability to both natural
hazards and climate change, and its proven utility as a framework to guide indicator selec-
tion. Therefore, our model incorporated the key elements of (i) exposure, (ii) susceptibility,
and (iii) lack of resilience (Figure 3), from the MOVE framework. These key elements can
be described as follows.
i. Exposure: Exposure refers to exposure to the hazard in both time and space, and
can include direct, indirect and occupational exposure.Int. J. Environ. Res. Public Health 2021, 18, 3952 11 of 31
ii. Susceptibility: We adopted the environmental health understanding, that people
who are susceptible have a higher likelihood (or severity) of health impacts due to
exposure to a hazard, compared with other people exposed to the same hazard [56].
Susceptibility can include innate susceptibility (largely due to genetic predisposition
or physiology, such as children not having a fully developed immune system) and
acquired susceptibility (through old age and/or illness) [56].
iii. Lack of resilience: In the context of social vulnerability, a ‘lack of resilience’ was
interpreted at the individual level, to consider people’s individual capacity to an-
ticipate, cope and recover. For this, we incorporated the ‘circle of capacities’ [55].
Capacities can be understood as the assets and resources that people have (and
are able to use), to prepare for, cope with, and recover from disasters [55]. The
circle of capacities model shows a circle with six components: enough money to
cope with crises/losses (economic resources), solidarity (social resources), strength,
knowledge and skills to face hazards (human resources), safe housing and infras-
tructure (physical resources), enough food and water to cope with shortage (natural
resources), and decision-making power (political resources) [55]. A lack of these
capacities or resources may increase a person’s vulnerability to natural hazards.
These dimensions also align with practical functions and focuses of emergency
management, such as providing financial assistance after a disaster. The circle of ca-
pacities was adapted for the New Zealand situation, with the input of stakeholders
nviron. Res. Public Health 2021, 18, x FOR PEER REVIEW 12 of 33
(Figure 3).
Figure 3. Conceptual
Figure 3. Conceptual frameworkframework for social vulnerability
for social vulnerability to natural
to natural hazards hazards
(own (own
figure, figure,
based based on models by
on conceptual
conceptual models by Birkmann et al. [33], USGCRP [17], Wisner et al. [46,55] and Durie [57]).
Birkmann et al. [33], USGCRP [17], Wisner et al. [46,55] and Durie [57]).
Table 2. Dimensions of social vulnerability to natural
To reflect the hazards, and their
risk to health andrationale
wellbeing[16,17,23–25,61,62].
risk from flooding, we used a holistic view
Social Vulnerability of health, based on the Māori indigenous model of health, ‘Te whare tapa whā’ (the house
Rationale
of four walls), which holds that hauora (wellbeing) is made of the four aspects of physical,
Dimension
mental, spiritual and social wellbeing [57]. This is similar to whole-life views of health
Includes of
population
indigenousgroups exposed
peoples through
in other directsuch
countries, impacts (such as[58]
as Australia living
andinCanada
a [59], as well
flood hazard zone), indirect impacts (such as through disruption to essential
Exposure
infrastructure and services, road transport networks, public transport, power
supplies), and occupational exposure.
Children rely on caregivers to protect them, and they may not understand theInt. J. Environ. Res. Public Health 2021, 18, 3952 12 of 31
as the World Health Organization’s definition of health as ‘a complete state of physical,
mental and social wellbeing, and not merely the absence of disease or infirmity’ [60].
Table 2 provides the rationale for each dimension of the framework, in terms of why
people are more vulnerable to natural hazards.
Table 2. Dimensions of social vulnerability to natural hazards, and their rationale [16,17,23–25,61,62].
Social Vulnerability Dimension Rationale
Includes population groups exposed through direct impacts (such as living in a
flood hazard zone), indirect impacts (such as through disruption to essential
Exposure
infrastructure and services, road transport networks, public transport, power
supplies), and occupational exposure.
Children rely on caregivers to protect them, and they may not understand the
Children hazard or how to best react to it. Children are also more susceptible to certain
health impacts, as they are still growing and developing.
Older adults often have pre-existing health conditions, and may be less mobile
Older adults
and/or have vision or hearing loss. They may also experience social isolation.
People with existing physical or mental health needs can be susceptible to the
stress and physical impacts of natural hazard events, and may also be
People with health needs and/or disability adversely impacted by disruptions to health services or medications. People
with disabilities may need others to help them, and may have difficulties
accessing emergency shelters.
People with low or no household income may not be able to afford
Enough money to cope with crises and losses preparedness measures (such as insurance, stockpiling food, medications and
other resources), or be able to replace items after a natural hazard.
Social isolation can leave people more vulnerable, as they may not have others
Social connectedness to help them when needed. By contrast, strong social connections and support
can provide resilience through networks and shared resources.
People are more vulnerable if they are not aware of hazards, not able to access
information, or do not know how to prepare or react during a hazard event.
Knowledge, skills and awareness to face hazards
Having knowledge, skills and awareness of hazards allows people to better
prepare for and cope during a natural hazard.
Shelter, warmth and security are basic human needs. People living in
substandard housing, or in overcrowded housing, have increased risk of
Safe, secure and healthy housing
experiencing negative impacts of natural hazards, and may find it difficult to
cope and recover.
Having sufficient food and water is a basic human need. After a natural
hazard, having access to these resources (e.g., through household
Food and water to cope with shortage preparedness) is an important source of resilience. Not having enough
emergency food (or enough food on a daily basis) or water (e.g., piped water)
leaves people more vulnerable after a natural hazard.
Good leadership and decision making are vitally important before, during and
after a natural hazard. Furthermore, people’s ability to access and participate
in decision making, and the inclusion of a diverse range of people in decision
making (especially vulnerable population groups and marginalised groups), is
Decision making and participation
important for ensuring their needs are met in emergency management
planning. Lack of involvement or inclusion in decision making can increase
people’s vulnerability, as it means their needs may not be met or planned for
through mitigation plans.
Comparing our framework to other sets of social vulnerability indicators suggested
that the dimensions aligned well with previous sets of social vulnerability indicators (see
Appendix A). Common indicator topics across the sets of social vulnerability indicators
included children, older adults, people with existing health conditions and/or disabilities,
poverty, housing issues, and social isolation.Int. J. Environ. Res. Public Health 2021, 18, 3952 13 of 31
Certain indicators from previous sets did not easily fit into the identified social vul-
nerability dimensions of our framework. Indicators about ‘race’ and ‘ethnicity’ [25,27]
are likely to represent marginalised groups who are more likely to lack political power
and experience social and economic racism [23], which can increase their vulnerability
via one or more of the dimensions in our framework. Similarly, while some indicator sets
included ‘women’ as an indicator, this depends on the context; women can experience
aspects of both vulnerability and resilience, therefore gender is not necessarily predictive of
vulnerability [16]. Additionally, some indicator sets included community-level, structural
or contextual factors in society, such as existence of early warning systems, single-sector
economic dependence, infrastructure dependence, hazard planning, and land use planning,
which did not refer directly to individuals or specific population groups.
4.2. Identifying Indicators and Data Sources
Potential social vulnerability indicators for flooding in New Zealand were then identi-
fied to represent all the dimensions of social vulnerability in the framework. A final set of
indicators were identified that measured the different dimensions of social vulnerability,
met the indicator selection criteria, and had data available (Table 3). Given the importance
of having local-level data for end users, the primary data source used was the 2013 New
Zealand Census of Populations and Dwellings.
For measuring exposure, indicators were included about the population and ethnic
groups, to provide context about the populations living in an area. Exposure indicators
were also included relating to indirect impacts (such as people relying on public transport)
and occupational exposure (such as people working in primary industries).
For some dimensions where no relevant data were available at the local level, proxy
indicators were used, to ensure that each dimension had at least one indicator. Instead of
using data on the number of pregnant women, the number of babies aged under 1 year
was used as a proxy. Due to a lack of specific data for the food and water dimension,
the following proxy indicators were used: households living in rental housing, single-
parent households, and neighbourhood deprivation (New Zealand Index of Deprivation
2013) [63]. In New Zealand, these population groups are less likely to have household
emergency preparedness [64], and are also more likely to experience household food
insecurity (whereby households do not have sufficient food on a regular basis) [65]. For
the decision-making dimension, no data were readily available at the very local level, so
voting participation at the local council level was used instead. Health indicators relating to
people with certain health conditions (such as cardiovascular disease, respiratory disease,
and mental health issues) were not able to be completed within the timeframes of this
study, but could be developed in the future.
For some dimensions, overlapping indicators were included (for example, 65+ years,
75+ years, 85+ years) in order to meet the varying data needs of end users. Additionally,
indicators were included in all the dimensions that they were relevant for, which meant
some indicators (such as NZDep) appeared in multiple dimensions.Int. J. Environ. Res. Public Health 2021, 18, 3952 14 of 31
Table 3. Social vulnerability dimensions and indicators for flooding for New Zealand.
Dimension of Social Vulnerability Social Vulnerability Indicators
Number of people
Number of households
Exposure (direct)
Ethnic groups (European, Māori, Pacific peoples, Asian, Middle
Eastern/Latin American/African)
People who commute outside of the area
Exposure (indirect) People who use public transport to get to and from work
People living in rural or remote communities
Health care workers and first responders
Exposure (occupational)
People working in the primary industries
Children aged 0–4 years
Children
Children aged 0–14 years
People aged 65+ years
Older adults People aged 75+ years
People aged 85+ years
Health and disability Pregnant women (proxy used of babies agedInt. J. Environ. Res. Public Health 2021, 18, 3952 15 of 31
- Marae, which are meeting houses for local Māori iwi;
- Visitor accommodation and temporary housing.
Other sites of social and/or spiritual significance to Māori were also included, such as
urupā (cemeteries). Appendix B contains a full list of point locations by social vulnerabil-
ity dimension.
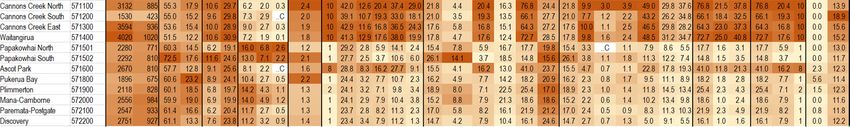
4.4. Design and Implementation of Indicators—Case Study of Porirua City
The social vulnerability indicators were tested using the case study of Porirua City,
with the heatmap of social vulnerability indicators highlighting some key geographic areas
of vulnerability (Figure 4). Cannons Creek and Waitangirua had a higher level of vulnerabil-
ity across multiple dimensions and indicators, including higher socioeconomic deprivation
(scoring a 10 on the NZDep2013 decile, signifying the highest decile of deprivation), and
higher levels of single-parent households, people not able to speak English, and households
with no access to the internet. Other flood-prone areas, such as Elsdon-Takapūwāhia, Titahi
Bay, Ascot Park and Porirua East also had higher levels of vulnerability across similar
indicators, including single-parent households, socioeconomic deprivation, living in rental
accommodation, and not having access to the internet. Porirua Central, while having a low
population count, had high levels of people being new to the neighbourhood, and having
no access to the internet, as well as higher levels of single-parent households and living
in rental housing. In these neighbourhoods, local residents may not be aware of the risks,
and, given their vulnerabilities, may have less capacity to prepare, cope and recover. Other
areas,
Int. J. Environ. Res. Public Health 2021, suchPEER
18, x FOR as Papakowhai,
REVIEW were vulnerable primarily due to the susceptible populations
16 of 33
(such as older adults) living there, and the higher percentage of people new to the area.
Figure 4. Social vulnerability indicators heatmap for Porirua City (2013 data by area unit (AU)) (more vulnerable areas are
Figure 4. Social vulnerability indicators heatmap for Porirua City (2013 data by area unit (AU)) (more vulnerable areas
coloured darker) (screenshot). Note: .C denotes suppressed values due to low numbers. For the social connectedness in-
are dicator
coloured darker) (screenshot).
of households Note:aged
with child(ren) .C denotes suppressed
5–16 years, values
higher values duelower
mean to low numbers. For
vulnerability, the social
so lower connectedness
values have been
indicator of households
coloured darker. with child(ren) aged 5–16 years, higher values mean lower vulnerability, so lower values have been
coloured darker.
The heatmap also allowed understanding of specific vulnerabilities. For example,
The heatmap
across most also
areas of allowed
Porirua, understanding
there of specific
is a high percentage vulnerabilities.
of working adults whoFor example,
commute
across most areas of Porirua, there is a high percentage of working adults who commute
outside of Porirua City for work, and/or use public transport to get to work. This infor-
outside
mationof Porirua
could City for
be useful forunderstanding
work, and/orimpacts
use public transport
of floods, to disruptions
such as get to work. This in-
to trans-
formation
portation could be useful for understanding impacts of floods, such as disruptions to
networks.
transportation
The socialnetworks.
vulnerability indicators for Porirua City were also published on an online
interactive map (Story Map), where individual indicators could be explored. For example,
the online map of neighbourhood deprivation (NZDep2013 deciles) showed that many of
the flood hazard zones were also areas with high deprivation, including Cannons Creek,
Waitangirua, Porirua East and Takapūwāhia (Figure 5).Int. J. Environ. Res. Public Health 2021, 18, 3952 16 of 31
The social vulnerability indicators for Porirua City were also published on an online
interactive map (Story Map), where individual indicators could be explored. For example,
the online map of neighbourhood deprivation (NZDep2013 deciles) showed that many of
the
Int. J. Environ. Res. Public Health 2021, 18,flood hazard
x FOR PEER zones were also areas with high deprivation, including Cannons
REVIEW Creek,
17 of 33
Waitangirua, Porirua East and Takapūwāhia (Figure 5).
Figure 5. Screenshot of the online interactive map (Story Map) of social vulnerability indicators for Porirua, showing
Figure 5. Screenshot
NZDep2013 of the online
at the meshblock level.interactive map (Story Map) of social vulnerability indicators for Porirua, showing
NZDep2013 at the meshblock level.
The social vulnerability indicators were complemented by maps of the flood hazard
zonesThe social
and vulnerability
locations of relevantindicators were complemented
point locations (such as schoolsby maps
and earlyofchildhood
the flood edu-
hazard
zones and locations of relevant point locations (such as schools and early
cation centres (ECEs)). Figure 6 gives the example of Waitangirua, and shows that floodchildhood edu-
cation centres (ECEs)). Figure 6 gives the example of Waitangirua, and
hazard zones affect much of the suburb, including several schools and early childhoodshows that flood
hazard
educationzones affectThe
centres. much of hazard
flood the suburb, including
and high several
levels of social schools and early
vulnerability in thischildhood
neigh-
education
bourhoodcentres. Thethis
highlighted flood hazard and
geographic areahigh levels of social
as important vulnerability
for future in this
risk reduction neigh-
activi-
bourhood
ties (suchhighlighted this geographic
as flood management areaand
systems) as important
emergencyfor future risk reduction
preparedness and planningactivities
in
(such
orderastoflood
meet management systems)
the diverse needs of thisand emergency preparedness and planning in order
neighbourhood.
to meet the diverse needs of this neighbourhood.
4.5. Identifying Potential Uses for the Social Vulnerability Indicators
In response to these indicator outputs, stakeholders identified numerous ways that the
social vulnerability indicators and data visualisations could be used. Firstly, the indicators
could provide a structured way of thinking about and understanding social vulnerability
to flooding, as well as objective measures of social vulnerability, before a flood event.
Understanding the specific needs of vulnerable population groups could allow planning
and readiness activities to be carried out in advance, to cater for these population groups.
This could help support an equitable response to emergency preparedness, planning,
response and recovery. The indicator data and data visualisations could also be used to
spark discussion and initiate further data gathering at the local level.
During a flood event, social vulnerability indicators could provide information about
the likely needs of the population for response activities, to help target and prioritise
resources and efforts to areas with the highest needs, without needing to rely first on
a ground survey. The indicators could also contribute to the development of shared
situational awareness across the civil defence and emergency management response. AfterInt. J. Environ. Res. Public Health 2021, 18, 3952 17 of 31
a flood, during the recovery phase, the indicators could help identify areas where people
may need more support (e.g., financial support). Public health services and primary health
care could also use the information to understand where socially vulnerable people live, to
Int. J. Environ. Res. Public Health 2021, 18, x FOR PEER REVIEW 18 of 33
support health care provision.
Figure 6. Screenshot of the online interactive map (Story Map) of flood hazard zones and school locations for Waitangirua,
Figure 6. Screenshot
Porirua. of the
Note: Flood online
hazard interactive
zones map (Story
show 1-in-100 Map)extents,
year flood of flood hazard zones
accounting for 100and
yearschool locations
climate for Waitangirua,
change impacts.
Porirua. Note:
Source: Flood hazard
Wellington Water,zones show
Porirua City1-in-100
Council. year flood extents, accounting for 100 year climate change impacts. Source:
Wellington Water, Porirua City Council.
4.5. Identifying Potential Uses for the Social Vulnerability Indicators
The indicators
In response couldindicator
to these also support important
outputs, up-stream
stakeholders risk
identified reduction
numerous waysefforts,
that includ-
ing
theinfrastructure upgrades,
social vulnerability hazard
indicators mitigation,
and data and provision
visualisations of resilient
could be used. housing
Firstly, the indi- in areas
cators
with could
large provideof
numbers a structured way of thinking
socially vulnerable about
people. Forand understanding
example, havingsocial vulner-
objective data about
ability
social to flooding, as
vulnerability well allow
could as objective measures
decision makers of social vulnerability,
to consider factorsbefore
other athan
floodeconomic
event. Understanding the specific needs of vulnerable population groups could allow
impacts when deciding stormwater infrastructure upgrades. An extension of this study
planning and readiness activities to be carried out in advance, to cater for these population
also identified how land use planning could mitigate the impacts of natural hazards for
groups. This could help support an equitable response to emergency preparedness, plan-
vulnerable populations,
ning, response and recovery. through restricting
The indicator development
data and in areas
data visualisations subject
could also betoused
natural haz-
ards, restricting the location of critical buildings and vulnerable
to spark discussion and initiate further data gathering at the local level. land uses (based on the
point locations identified
During a flood in this
event, social study) in areas
vulnerability subject
indicators couldtoprovide
natural hazards, and
information aboutrequiring
urban design
the likely that
needs of promotes resilience
the population (such activities,
for response as connectivity of routes
to help target and for evacuation)
prioritise re- [66].
sources and efforts to areas with the highest needs, without needing to rely first on a
5.ground
Discussion
survey. The indicators could also contribute to the development of shared situa-
tional
5.1. awareness
A New acrossVulnerability
Set of Social the civil defence and emergency
Indicators for New management
Zealand response. After a
flood, during the recovery phase, the indicators could help identify areas where people
This study has implemented the first national set of social vulnerability indicators for
may need more support (e.g., financial support). Public health services and primary health
flooding in New
care could Zealand.
also use These indicators
the information provide
to understand whereobjective measures of
socially vulnerable social
people vulnerabil-
live,
itytorelated to flooding to inform
support health care provision. disaster risk management activities for New Zealand civil
defence practitioners, local councils, and health professionals, and may also
The indicators could also support important up-stream risk reduction efforts, includ- be of interest
toing
local residents. upgrades, hazard mitigation, and provision of resilient housing in areas
infrastructure
withThe
large numbers align
indicators of socially
with vulnerable
similar setspeople. For example,
of social having
vulnerability objective data
indicators for flooding,
with indicators about children, older adults, health status, poverty, lowerthan
about social vulnerability could allow decision makers to consider factors other eco-of educa-
levels
tion, unemployment, lack of vehicle, single-parent households, rental housing,this
nomic impacts when deciding stormwater infrastructure upgrades. An extension of household
study also identified how land use planning could mitigate the impacts of natural hazards
crowding, and limited English proficiency, similar to previous sets [23,25,27,31,32,34,35].
for vulnerable populations, through restricting development in areas subject to natural
The New Zealand indicator set also included different, relevant indicators about single-
hazards, restricting the location of critical buildings and vulnerable land uses (based on
person households, recent immigrants, access to the internet, and people commutingYou can also read