Structural equation modeling of mental health in gentrifying neighborhoods in Austin, Texas - De Gruyter
←
→
Page content transcription
If your browser does not render page correctly, please read the page content below
Open Health 2021; 2: 21-39

Research Article

Ayodeji Emmanuel Iyanda*, Yongmei Lu

Structural equation modeling of mental health in
gentrifying neighborhoods in Austin, Texas
https://doi.org/10.1515/openhe-2021-0002
received October 4, 2020; accepted February 24, 2021
                                                                         1 Introduction
                                                                         The literature has highlighted the impact of a rapidly
Abstract: Having poor mental health can be life-threaten-
                                                                         changing environment on general health, includ-
ing, and problems tied to it are prevalent in communities
                                                                         ing mental health. Having poor mental health can be
across the United States (US). The city of Austin is one of
                                                                         life-threatening, and problems tied to it are prevalent in
the ten cities in the US undergoing rapid urban gentrifi-
                                                                         communities across the United States (US). The Centers
cation; however, there is insufficient empirical evidence
                                                                         for Disease Control and Prevention (CDC) estimates that
on the impact of this process on residents’ health. Con-
                                                                         more than 50 percent of Americans are diagnosed with a
sequently, this study explored the concept of weathering
                                                                         mental illness or disorder at some point in their lifetime
and life course perspective using data of 331 residents
                                                                         [1]. Based on empirical research, CDC rated mental health
recruited from two regions endemic with gentrification
                                                                         illness (MHI) such as depression, the third most common
to assess the health impacts of gentrification. We used
                                                                         cause of hospitalization in the US among adults aged
a triangulation method including univariate, bivariate
                                                                         18–44 years old, and adults living with serious mental
correlation, and multiple linear regression implemented
                                                                         illness die on average 25 years earlier compared to those
through the structural equation model to examine the
                                                                         without MHI [1]. Depression is defined by its symptoms:
complex pathways to three health outcomes—measured
                                                                         depressed mood (feeling blue), feelings of helplessness
stress, self-rated mental health, and depression symp-
                                                                         and hopelessness, feelings of guilt, worthlessness, loss of
toms. Bivariate Pearson’s correlation indicated a signifi-
                                                                         appetite, loss of sleep, and psychomotor retardation [2–4].
cant positive association between gentrification score and
                                                                         Some of the risk factors include female sex, divorced or
mental health symptoms and stress. However, the direct
                                                                         separated living situation, low socioeconomic status, poor
association between gentrification and depression disap-
                                                                         social support, recent adverse and unexpected life events
peared in the causal/path model. In support of the weath-
                                                                         (e.g., death, homelessness, or eviction), severe medical
ering hypothesis, this study found that stress score was
                                                                         illness with functional impairment, and chronic diseases.
directly related to the adulthood depression score. There-
                                                                         Moreover, accumulating evidence suggests significant
fore, this research builds on the accumulating evidence
                                                                         links between neighborhood stressors and mental illness
of environmental stress and mental health in the US’s
                                                                         symptoms such as anxiety and depression but with mixed
rapidly changing physical and sociocultural environment.
                                                                         results [4–12]. This present study examines the report of
Hence, implementing and guaranteeing social equity of
                                                                         mental health among residents in gentrifying neighbor-
resources will improve residents’ health and reduce the
                                                                         hoods identified by existing studies [13,14] to add to the
cost of health care spending at both the household level
                                                                         existing literature on the impacts of gentrification on
and the city government level.
                                                                         health.
                                                                              Gentrification, broadly defined, is a process that
Keywords: gentrification, environmental stressor, mental
                                                                         reverses the decline and disinvestment in the inner-city
health, depression, weathering hypothesis
                                                                         and the return of capital into neighborhoods leading to
                                                                         sociospatial rearrangement of the inner-city landscapes
                                                                         [15–17]. The definition of gentrification adopted in this
                                                                         study aligns with those that have been used widely by
*Corresponding author: Ayodeji Emmanuel Iyanda, Department of
Geography, Texas State University, San Marcos, Texas, United States,
                                                                         scholars, which is the movement of the higher-income
e-mail: aei11@txstate.edu                                                population into lower-income neighborhoods, thus
Yongmei Lu, Department of Geography, Texas State University, San         increasing property values, tax, and rents leading to the
Marcos, Texas, United States                                             voluntary and involuntary displacement of longtime res-

  Open Access. © 2021 Ayodeji Emmanuel Iyanda, Yongmei Lu, published by De Gruyter.         This work is licensed under the Creative Commons
Attribution 4.0 International License.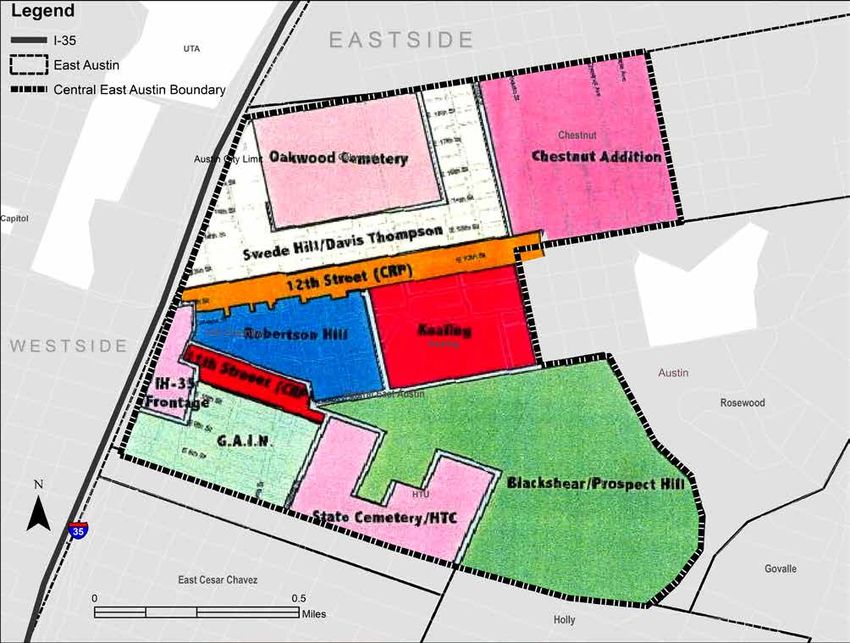
22 Ayodeji Emmanuel Iyanda, Yongmei Lu
idents (LTRs) [18–24]. Scholars like Neil Smith described AURD had to declare half of the structures as “dilapidated
gentrification as “a systematic, comprehensive policy beyond a reasonable rehabilitation” [28,31]. After facing
for city building,” which connotes inequality in many financial constraints to accomplish some of the projects
research arena [25]. On the other hand, urban gentrifica- in 1977, the agency’s central function was narrowed to
tion advocates argue that gentrification increases housing housing rehabilitation for low-income residents through
stock, restoration of neighborhood quality, dissolution of grants and loans on a case by case basis, according to the
poverty rate, new businesses and investors’ attraction, available information.
and tax revenues for municipal government. Conversely, Fast forward to 1996, the Austin Revitalization
gentrification is associated with the physical and cul- Authority (ARA) initiated the Central East Austin Master
tural displacement of vulnerable residents, including the Plan (CEAMP) targeted at redeveloping the 11th and 12th
elderly and lower-income groups, leading to or intensify- Street Corridors (henceforth, project area). The project
ing homelessness, landlord harassment, chronic health area comprises neighborhoods with buildings classi-
conditions, and psychological distress [20,26]. fied as blighting structural conditions, vacant land, and
The rest of the paper examines a brief history of urban tax delinquency (Appendix Figures 1 and 2). Alongside,
renewal in Austin, followed by the conceptualization of a Community Redevelopment Plan (CRP) for the target
health in the gentrifying neighborhood. The ‘Data and project area was commissioned. The city of Austin then
methods’ section presents the data source analyzed, and passed a resolution in support of the CEAMP project. Thus,
the findings are presented in the ‘Results’ section. The the target area was declared urban renewal areas, and the
penultimate and the ultimate sections discussed the find- CRP was translated into the East 11th and 12th Streets Urban
ings and concluded with a summary of the findings. Renewal Plan (URP). Through CEAMP, detailed land use
and zoning studies were recommended for other areas
outside the project area. The CEAMP provided a frame-
2 Background work for developing the Central East Austin Neighbor-
hood Plan (CEANP) later on. The CEANP, as presented in
Table 1, aimed to create an environment that is supposed
2.1 A brief examination of urban renewal in to protect the opportunities and assets for the benefit of
Austin all residents, including the traditional and recent res-
idents of these neighborhoods [31]. However, things did
East Austin, Texas, is a minority neighborhood that not go as expected, the traditional residents, instead
originally housed African American and Hispanic com- of reaping the improved neighborhoods’ outcome, are
munities following the 1928 zoning policy. Due to the being uprooted [13,32], and many were displaced due to
institutionalized segregation, the black and Hispanic increased property tax and rent [33,34]. The project area’s
neighborhoods, for long, were neglected and less devel- discussion is meaningful because it is pivotal for East
oped, which led to urban decay or blight [27,28]. Follow- and Southeast Austin’s gentrification process. According
ing World War II, African Americans were pushed out of to the key informant interview (KII) we conducted, we
suburbs by racial covenants and redlining “as the federal learned that the project area contributed to today’s gen-
government subsidized white out-migration to racially trification in East and Southeast Austin. In the word of
exclusive suburbs,” notably in 1949 [29]. In 1954, the the community leader, “gentrification spread like wildfire
Austin City Council started exploring urban renewal by from Central Austin” (McCarver February 25, 2020; per-
creating the Greater East Austin Development Committee sonal communication).
(GEADC). Initially, the idea was to study the needs of the
East Austin community and the housing conditions in an
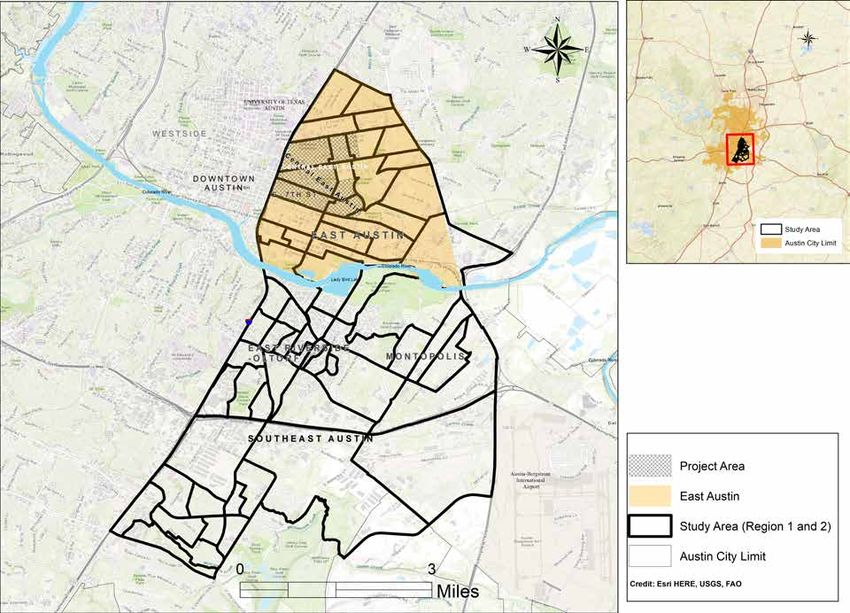
area defined by East 19th Street (Martin Luther King Boule- 2.2 Poverty, blight, and urban renewal
vard), Airport Boulevard, Springdale Road, the Colorado
River (Lady Bird Lake), and East Avenue/I-35 (Figure 1). Urban decay in the Eastside of Austin could be traced to
The GEADC birthed the Urban Renewal Program’s idea, the endemic poverty situation in the area compared to the
whose primary aim was to improve the built environment rest of the city. The poverty rate in the region increased
(BE) in general [30]. As a result, Austin Urban Renewal from 37.5% in 1970 to 52% in 1990 [28]. Following the
Department (AURD) was created. Urban renewal projects implementation of urban renewal programs that targeted
dramatically altered the Eastside landscape during the East Austin’s core—Central East Austin in Figure 1, the
1960s. For a neighborhood to be qualified for renewal, the demographic landscape shifted considerably. Between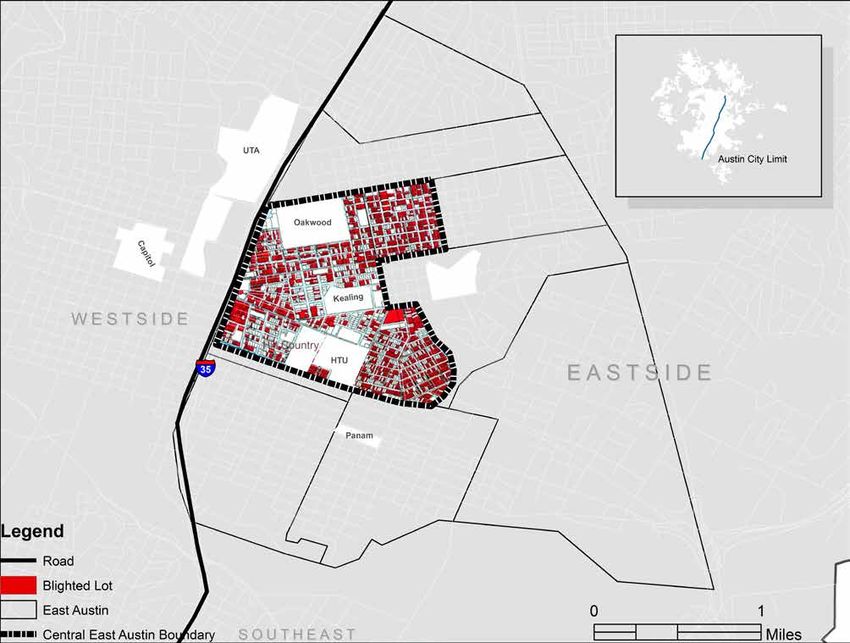
Mental health in a changing environment           23

Figure 1: Map showing the project area, study area covering East/Southeast Austin, and an inset map showing Austin city limit.

1970 and 1978, a particular neighborhood (Census Tract                 In recent times, the physical and demographic change in
8), which housed 97% minority, had lost 1,976 residents                East Austin neighborhoods has precipitated public out-
and 446 families, representing a 14.8% decline for both                cries and violent protests by anti-gentrification groups
categories [31]. Figure 2 shows the demographic change                 [36–39].
in Austin between 1990 and 2018. It is evident that the                     Previous studies that interviewed “those who left”
percent black population declined drastically between                  [33] and “those who stayed” [34] showed that increased
1990 and 2010 and peaked slightly in 2018 by less than                 tax forced longtime residents out of their long-lived
half percent (0.4%). Notably, in 2010, Austin attained a
majority-minority status.
     Combined with the historic preservation, which
started in 2004, the improvements to infrastructure and
streetscape on East 11th Street and the construction of
community parking lots in the target project area have
accelerated housing and demographic shifts. These shifts
were evident in the targeted project areas and diffused
to the adjoining communities in East Austin and South-
east Austin neighborhoods like Riverside and Montopolis
[13,35]. Population decline, then a resurgence of largely
white, higher-income residents as the urban renewal
policies improved physical conditions of East/Southeast
Austin. This transition pushed out many longtime res-                  Figure 2: Percent change in racial/ethnic composition in Austin
idents, and those who remain are struggling financially,               (Data Source: US Census Bureau, Decennial Census Total Popula-
and as this study shows, with their mental health as well.             tion, 2018 American Community Survey Population Estimate).
24 Ayodeji Emmanuel Iyanda, Yongmei Lu
Table 1: Central East Austin Neighborhood Plan Goals, 1999
s/n Proposed neighborhood plan
1 Preserve, restore, and recognize historic resources and other unique neighborhood features.
2 Create housing that is affordable, accessible, and attractive to a diverse range of people.
3 Promote new development for a mix of uses that respects and enhances the residential neighborhoods of Central East Austin.
4 Promote opportunities to leverage positive impacts and encourage compatibility from civic investments.
5 Create a safe and attractive neighborhood where daily needs can be met by walking, cycling, or transit.
6 Improve bicycle, pedestrian, and transit access within Central East Austin and to the rest of Austin.
7 Respect the historical, ethnic, and cultural character of the neighborhoods of Central East Austin.
8 Enhance and enliven the streetscape.
9 Ensure compatibility and encourage a complementary relationship between adjacent land uses.
Note: Adapted from the CEANP report, December 2001
community to neighboring towns (e.g., Manor, Pfluger- for health. Similarly, the erosion of social cohesion and
ville) and currently threatens the stayers who are mostly social capital has been cited as an additional mechanism
low-income earners, widow/widowers, elderly, and underlying the relation between socioeconomic disparity
low-income earners. However, how the process of urban and health outcomes. The following paragraph exam-
renewal affects residents’ health in this locale has been ined the weathering hypothesis and life course perspec-
overlooked. Consequently, this study applied weathering tive to explain the link between gentrification and health
hypothesis [40,41] to examine the impact of urban renewal outcomes in rapidly changing environments in East and
programs that had generated several debates on gentrifi- Southeast Austin, Texas.
cation in East Austin, Texas, to assess residents’ health The weathering thesis posits that repeated expo-
impact. This study is essential for two reasons: first, for sure to stressor without any intervention—medical or
intervention policies, and second, to respond to the need non-medical—deteriorates health [40,46]. Weathering
for continued research on the impact of urban renewal hypothesis was interpreted as the cumulative impact of
and development policies on health [40]. exposure to, and high-effort coping with, subjective and
objective stressors, that is, with psychosocial, economic,
and environmental stress [44]. The concept has been
2.3 Conceptualizing health in the changing applied in urban research, particularly in urban housing
environment and displacement [41,44,47]. Physiologically, environ-
mental stress can trigger stress hormones [48]—cortisol,
Gentrification, deprivation, segregation, and low socio- epinephrine, and norepinephrine—which can damage
economic position are known sources of environmental blood vessels and arteries, leading to elevated blood
stressors [42,43]. In health inequality research, material pressure (BP). Abnormal BP increases the risk of heart
deprivation and psychosocial mechanisms are used to attacks, stroke, and sudden death [49,50], while excess
explain this phenomenon. From the material depriva- cortisol increases obesity, hypertension, and hypergly-
tion viewpoint, scholars have argued that an individual’s cemia. Accumulating evidence suggests significant links
health tends to worsen in the absence of family and com- between neighborhood stressors and mental illness
munity resources (such as access to income, housing, or symptoms such as anxiety and depression [4–12]. What is
affordable health care) in addition to structural inequal- more is that the intensity of exposure, proximity to expo-
ity [44]. On the other hand, psychosocial interpretation of sure, duration of exposure, and frequency of stressors
health inequalities “ascribes the existence of health ine- determine the severity of health outcomes. It has been
qualities to the direct or indirect effects of stress stemming documented that the duration of exposure to these envi-
from either being lower on the socioeconomic hierarchy ronmental stressors increases the risk for chronic health
or living under conditions of relative socioeconomic dis- conditions, namely cardiovascular disease, asthma, meta-
advantage.” [45] The socioeconomic disparity has been bolic disorder, cancer, depression, extreme mood change,
argued to be a significant source of stress and a risk factor and isolation [4,51]. During the long weathering process,Mental health in a changing environment 25
the body is automatically prepared for pre-disease states California. Furthermore, extant literature suggests that the
[52–55]. Dysregulation in metabolism, mental functioning, health of people who witnessed chronic stress earlier in
autoimmune response, and the cardiopulmonary system childhood is worse compared to those who were exposed
can secondarily cause anxiety, change in body mass to stress later in life [3,56,66].
index, and bodily accumulated fat or visceral fat [53,56]. Scholars including Anguelovski et al. [67]; Gibbons
Curry, Latkin, and Davey-Rothwell [7], in their study and Barton [68]; Dragan, Ellen, and Glied [69]; and Izen-
in Maryland, US, employed pathway analysis to investi- berg, Mujahid, and Yen [70] have investigated the link
gate the impact of neighborhood effect on residents’ psy- between gentrification and health in the US. However,
chological distress. The study by Tran et al. [57] in Cali- these studies have shown mixed results. For example,
fornia indicated that living in a gentrified and upscaled Izenberg and colleagues [70] in California, after adjust-
neighborhood was associated with an increased likeli- ing for covariates in their model, found that individuals
hood of severe psychological distress relative to living in living in gentrifying neighborhoods did not have signifi-
a low-income and not gentrified neighborhood. Venzala cantly poor/fair self-rated health (SRH) compared to those
et al. [4] found that environmental chronic mild stress not living in a gentrifying neighborhood. However, they
(CMS) induced depressive-like profiles, including anhe- reported that living in a non-gentrifiable neighborhood
donia, helplessness, and memory impairment. In their was associated with reduced odds of fair or poor SRH.
study, Conway, Rutter, and Brown [6] showed that envi- The study also found higher odds of poor health among
ronmental stressors were associated with depression and blacks, an association not found among other racial/
panic disorder. In a case-control study, Brummett et al. ethnic groups, which is in line with other findings [71].
[5] examined the link between environmental stress and Earlier, Gibbons, Barton, and Brault’s [71] study
symptoms of depression among the stressor group and the indicated that residents of neighborhoods experiencing
non-stressor group. The study found that environmental gentrification reported overall better physical health out-
stress was significantly associated with depression scores comes than those living in neighborhoods that had not
among the stressor group for both female and male par- experienced gentrification, irrespective of the stage of
ticipants than the non-stressor groups. However, there gentrification. Studies that investigated children’s health
remain many opportunities for more studies to disentan- in New York showed that the experience of gentrifica-
gle the mixed results available on the impact of gentrifica- tion has no effects on children’s diagnoses of asthma or
tion and health [58,59]. obesity when children are assessed at ages 9–11, but that
In the social science research literature, several it was associated with moderate increases in diagnoses
studies have also applied life course perspective to under- of anxiety or depression [69]. A study that focused on
stand stress, mental health, social relationships (e.g., the older population based on validated questionnaires
social capital, social cohesion, social networking), and indicated that older adults in gentrifying neighborhoods
chronic health conditions [57,60–65]. Life course effect are more likely to experience symptoms of anxiety and
refers to how health status at any given age reflects the depression [10,11]. The study also reported that the symp-
current condition and the “embodiment of prior living toms tend to decrease over time in neighborhoods expe-
circumstances,” including previous neighborhood [45]. riencing increases in social cohesion and increased for
According to Kawachi, Subramanian, Almeida-Filho adults experiencing adverse neighborhood changes.
[45], the life course perspective has three dimensions: Despite the growing evidence between changing environ-
latent, pathway, and cumulative effects. The latent effect ment and health, limited research exists on whether the
is when the early-life environment (e.g., born and raised perception of gentrification has a direct or indirect rela-
in the social and economically deprived environment) tionship with mental health conditions (e.g., depression)
affects adult health regardless of intervening experience; using a complex model. Hence, we tested three research
pathway effect occurs when the early life environment hypotheses visualized in Figure 3.
sets individuals onto life trajectories (such as exposure
to traumatic situations) that, in turn, affect health status Hypothesis:
over time. Lastly, the cumulative effect is related to the
1. Residents’ perceived gentrification and sociodemo-
intensity and duration of exposure to unfavorable envi-
graphic characteristics are significant predictors of
ronments that adversely affect health status, according
stress and mental health symptoms.
to a dose-response. Tran et al. [57] used respondent age,
marital status, and parental status as proxies for life cycle 2. Historical childhood health is associated with self-
status to study gentrification and mental health illness in rated mental health, stress, and depression.26 Ayodeji Emmanuel Iyanda, Yongmei Lu
3. Neighborhood resources such as access to socioec- 3.2 Measure
onomic support, attraction, interaction, and cohe-
sion are associated with self-rated health, stress, and We used both validated and self-developed question-
depression. naires in this study. Questions related to mental health,
self-rated health, and stress were based on validated ques-
tionnaires. On the other hand, we developed our ques-
3 Data and methods tionnaires on the residents’ perception of neighborhood
change to determine the index of gentrification and access
to socio-economic support in this study.
3.1 Study area
This study focused on residents living in gentrifying 3.2.1 Measured depression and stress
neighborhoods in East and Southeast Austin, Texas. Six
zip codes fall within the areas delineated for this study. Seven items designed to measure depression symptoms
Based on the American Community Survey data between from the standardized scale for measuring the emotional
2009 and 2017, most of the neighborhoods in the Eastside state of Depression, Anxiety, and Stress Scale (DASS-
of Austin have gentrified while Southeast Austin is rapidly 21) were adapted in this study. The outcome variable
gentrifying. Our survey design delineated Austin’s city was depression measured by the depression scale and
into four regions, regions 1 and 2 in East Austin and South- assessed dysphoria, hopelessness, devaluation of life,
east Austin, formed the study area (Figure 1). A quantita- self-deprecation, lack of interest/involvement, anhedo-
tive structured questionnaire was then used to collect data nia, and inertia. The stress scale assessed difficulty relax-
in June 2020 through the Facebook campaign tool. Out of ing, nervous arousal, and being easily upset/agitated, irri-
the 1,338 survey link clicks, only 331 respondents finally table/over-reactive, and impatient, triggered by biosocial
took the survey, which formed our sample size. To ensure factors. Scores for depression and stress were calculated
that the sample size is well-represented of the underlying by summing the scores for the relevant items [72]. The
population characterized by race, we computed the pop- derived scores were then multiplied by 2 to obtain the final
ulation’s sampling weight (Appendix Table 1). Another score. Scores for depression and stress were calculated by
weight was also computed to adjust for the differences in summing the scores for the relevant items [72].
the gender subgroups.
Figure 3: Hypothetical pathways to depression. Note: SRMH is self-rated mental health; the ASR index is the access to socioeconomic
resources. Sociodemographic characteristics include neighborhood attachment, interaction, cohesion, duration of residence, age, educa-
tion, and household status.Mental health in a changing environment 27
3.2.2 Self-rated health 3.2.5 Access to socioeconomic support
Each respondent was asked to rate his/her health on a We constructed access to socioeconomic resources (ASR)
10-point Visually Analog Scale (VAS): “On a scale of 1–10, indicator from a set of eight items related to social and
‘1’ being the lowest and ‘10’ being the highest, rate your financial access. The items assessed individuals’ access to
overall health, physical health, mental health, health healthy food, health care services, employment, housing,
while growing up and parents; health while growing up.” child/adult school enrollment, mortgage/financing with
Following Tran et al. [57] approach, we used the last two a low rate, car financing/loan, and a bank loan at a low
questions as proxies for historical health on respondents’ rate. The responses were coded on a 5-Point Likert Scale: 1
current health and as life cycle status. = Extremely difficult and 5 = Extremely easy and summed
up to develop the ASR index. Before constructing the
index, we tested for internal consistency and reliability for
3.2.3 Perception of gentrification the eight items, which yielded an acceptable Cronbach’s
alpha of 0.866.
The perception of gentrification score (PGS) was devel-
oped based on some known impacts of urban renewal
on property and residents. It has been documented that 3.2.6 Covariates of health outcomes
gentrification is likely to lead to the physical, cultural,
and economic overturn, leading to increasing rent, prop- Other continuous variables included in the study are the
erty tax, homelessness, residential displacement, and respondents’ age, the number of years spent in school,
possibly increase spending on groceries and utility bills the number of people residing in the household, and the
[26]. The response to each of the five items was assessed duration of residence in a neighborhood. These are essen-
based on the 5-Point Likert Scale (Extremely unlikely to tial factors to be considered because they may be directly
Extremely likely). The five items were aggregated to form a or indirectly contributing to mental health outcomes and
gentrification index with a moderate Cronbach’s alpha of stress.
0.678. Our PGS is similar to the Neighborhood and Gentri-
fication Scale recently developed by DeVylyder et al. [73].
3.3 Analytical procedure
3.2.4 Measure of neighborhood tie and social cohesion The data were interpreted based on univariate descriptive,
bivariate correlation, and multiple regression analyses.
This study adopted Buckner’s [74] Neighborhood Cohe- We employed a t-test to determine the difference between
sion Instrument (NCI) to measure neighborhood ties and regions 1 (East Austin) and region 2 (Southeast). Based
social cohesion. The NCI has three dimensions: attraction on logic and prior empirical evidence, we developed the
to the neighborhood, neighboring/interaction, and psy- causal model to assess the pathway to depression. We
chological sense of community (PSC). Each of the dimen- used the univariate and multivariate analyses to examine
sions has 10, 15, and 15 items in the original instrument, the linearity and normality of all the variables. Hence, a
respectively. Attraction to the neighborhood is defined as structural equation model was developed in JMP® v15 to
the eagerness to remain a resident in the neighborhood, examine the complex factors for predicting depression
and it can be used to assess residents’ attachment to a among residents in gentrifying neighborhoods. The best
particular neighborhood. Neighboring, instead, measures model or model goodness-of-fit index (GFI) was deter-
the degree of interaction within the neighborhood. The mined based on some standard parameters such as the
third-dimension measures shared emotional connection low value of Root Mean Square Error of approximation
that people may experience toward others in their com- (RMSEA), the highest comparative fit index (CFI > 0.95),
munity. These three dimensions of NCI can be used to and the lowest value of corrected Akaike Information Cri-
weather the effects of gentrification among longtime res- teria (AICc) in cases of multiple models [75,76]. The model’s
idents. In this study, high scores were an indication that CFI value closed to the perfect model (CFI = 1) was finally
individuals had a strong sense of cohesion. selected. Besides, the Macro Process was used to test var-
iable interactions and determine the direct and indirect
effects of predictors on depression, as recommended by
a recent study on gentrification and health [58]. Lastly, we28 Ayodeji Emmanuel Iyanda, Yongmei Lu
computed the 95% confidence interval (CI) and standard the mean score was higher in Southeast Austin. The stress
error (se) of the effect based on a non-parametric 5000 score did not vary between the two regions, and the total
bootstrapped estimation [77,78]. mean score was 29.5 points but slightly higher in South-
east Austin. East Austin had a higher mean score of access
to socio-economic resources than Southeast Austin. The
4 Results mean score of neighborhood cohesion, attraction, and
interaction was lower in Southeast Austin than in East
Austin.
4.1 Descriptive results Table 2 further presents the correlation between
depression and other independent variables. All varia-
Table 2 presents the descriptive and bivariate correla- bles but cohesion and attraction were significantly asso-
tion analyses in the study area. The average age of the ciated with depression. Meanwhile, in East Austin, three
respondents was 49 years. The mean scores of gentrifica- variables were not significantly associated with depres-
tion, depression, measured stress, and self-rated mental sion, while four variables were not statistically associ-
health were 2.98, 23.95, and 29.5, and 7.5, respectively. ated with depression in Southeast Austin. This indicates
More women than men participated in the study (n = 222, that factors contributing to depression in the two regions
69.8%). Overall, a larger proportion of the respondents vary. However, perception of gentrification was positively
were married 146 (45.5%), 74 (23.1%) were identified as and significantly associated with depression in the total
being widowed/divorced/separated, and 101 (31.5%) of sample (r = 0.33, p < 0.001), in East Austin (r = 0.30, p <
the sample were not married or single. More than half of 0.001), and Southeast Austin (r = 0.35, p < 0.001). The last
the respondents self-identified as white (n = 181, 56.7%), column in Table 2 shows the result of the t-test, which
few were black (n = 23, 7.2%), 59 (18.5%) were Hispanics/ indicates the significant variation by region for the per-
Latino, 46 (14.4%) were Asian, and only ten (3.1%) were ception of gentrification, stress, interaction, attraction,
identified as other race/ethnicity. About one-third (36%) childhood health, and self-rated mental health.
had lived in the study area for more than ten years, and
264 (91%) were aware of neighborhood change (gentrifi-
cation). The majority of the respondents (73.2%) did not 4.1.2 Difference between longtime and recent residents
plan to move out of their neighborhood anytime soon,
20% were not sure, and only 7% declared they wanted Based on analysis of variance, Table 3 indicates that the
to move. Among those who said they were aware of the mean scores of perceived gentrification, depression, and
changing neighborhood, 40.3% said that change in their stress were not statistically and significantly different
neighborhood threatens them. between longtime and recent residents but stress scores
Gentrification score was positively associated with vary significantly. Longtime residents are more likely to
depression score, stress score, and neighborhood attrac- feel stressed (MD = 2.52, p = 0.047) compared to recent res-
tion but was negatively associated with self-rated mental idents.
health, socioeconomic support, and childhood health
(Table 2). The correlation supports the first hypothesis of
an association between gentrification and the three health 4.2 Multivariate regression analysis
outcomes—depression score, stress score, and self-rated
mental health. Perceived gentrification score was positively related to
depression in a simple bivariate linear regression (B
= 0.453, p < 0.01, 95% CI 0.168–0.738) in model 1 (Table
4.1.1 Variation by region 4); however, its association disappeared in the multi-
ple linear regression in model 2. Only ASR, neighboring,
Table 2 also shows that the study area differs by region. SRMH, and measured stress were significantly associated
For example, respondents from East Austin were younger with depression (Table 4). However, because there are
compared to respondents from Southeast Austin. The complex pathways to health outcomes such as depres-
ground score of depression was 24 points and did not vary sion, we examined all the 12 variables specified to predict
by region—East Austin and Southeast Austin. Gentrifica- the end-point outcome (i.e., depression) in the SEM.
tion scores vary between the two regions (p < 0.05), andMental health in a changing environment 29
Table 2: Mean scores, correlation, and t-test results for depression and predictors by region
Total East Austin Southeast Austin T-test a
Mean (r) Mean (r) Mean (r) (sig.)
Depression 23.95 23.22 24.71 ns
Gentrification (PGS) 2.98 (0.329***) 2.86 (0.300***) 3.10 (0.353***) *
Stress 29.5 (0.523***) 29.43 (0.517***) 30.05 (0.530***) ns
Cohesion 20.92 (-0.068) 21.36 (-0.023) 20.43 (-0.133) ns
Interaction 16.71 (-0.148*) 17.27 (-0.236***) 16.05 (-0.003) **
Attraction 15.20 (-0.104) 16.01 (0.033) 13.96 (-0.257***) ***
Socioeconomic resources (ASR) 26.75 (-0.313***) 28.67 (-0.225***) 25.21 (-0.406***) ***
Age (years) 48.8 (-0.201***) 46 (-0.189*) 48.61 (-0.228*) ns
Duration of residence 11.59 (-0.137*) 11.19 (0.183) 10.06 (-0.171) ns
Childhood health 6.46 (-0.278**) 8.72 (-0.318**) 8.19 (-0.219*) *
Self-rated mental health 7.5 (-0.723**) 7.70 (-0.685**) 7.24 (-0.765) *
*** p < 0.001; ** p < 0.01; * p < 0.05; ns is not significant
Values in the ( ) is the correlation coefficient of association between depression and other factors
a
Equal variance not assumed
Table 3: Mean difference of gentrification, stress, depression, mental health by residence status
t-test a df MD Std. Error (MD) 95% CI (MD)
Lower Upper
Gentrification -1.539 283 -0.154 0.100 -0.350 0.043
Stress Score 1.993* 258 2.515 1.262 0.030 4.999
Depression Score 1.000 247 1.371 1.371 -1.329 4.072
SRMH -0.188 264 -0.043 0.231 -0.498 0.411
* p < 0.05; MD mean difference between the longtime and new residents. CI (MD) is the confidence interval for the mean difference. Note:
residence status was coded as longtime residents (1) and recent residents (0).
a
Equal variance assumed
4.2.1 Pathway model of mental health 0.981), Tucker-Lewis index (TLI = 0.930), and the adjusted
revised GFI (AGFI = 0.962). It is important to mention that
The causal model was tested in the JMP Pro program using the structural model produced seven endogenous1 varia-
a maximum likelihood (ML) structural equation model. bles with associated R2: Depression (R2 = 44.77%), SRMH
Note that the RMSEA statistic measures the average (R2 = 21.147%), stress (R2 = 17.04%), childhood health (R2
remaining error per individual in the data where a good = 1.80%), PGS (R2 = 23.19%), cohesion (R2 = 1.54%), and
fit model is indicated by smaller RMSEA values, while the ASR (R2 = 4.96%). Note that depression is the end-point
CFI compares the poorest model with the hypothesized variable in the SEM model.
model and assesses fit. RMSEA values < 0.05 and CFI Figure 4 shows the pathway of the predictors of
values of at least 0.95 indicate a good model fit. Table 5 depression. As seen in Table 5, stress and self-rated mental
presents the parameters used in selecting the best model.
Model 1 was a better choice compared to others in the
table because of the low RMSEA (0.049) and compara- 1 Endogenous variables are variables in a statistical model that are
determined by their relationships with other variables within the
tive fit index (CFI = 0.953), revised goodness-of-fit (RGFI =
model. They are synonymous with a dependent variable.30 Ayodeji Emmanuel Iyanda, Yongmei Lu
Table 4: Multivariate linear regression for depression
t Sig. 95% CI
Model 1 B Std. Error Lower Bound Upper Bound VIF
(Constant) 15.309 2.318 6.603 0.000 10.742 19.875
gentrification 0.453 0.145 3.131 0.002 0.168 0.738 1
Model 2
(Constant) 33.805 5.406 6.253 0.000 23.155 44.456
gentrification 0.11 0.117 0.941 0.348 -0.121 0.341 1.375
Duration -0.044 0.034 -1.271 0.205 -0.112 0.024 1.863
Age -0.022 0.043 -0.5 0.618 -0.107 0.064 1.767
YrSCHL -0.127 0.096 -1.324 0.187 -0.316 0.062 1.137
ASR 0.125 0.059 2.124 0.035 0.009 0.241 1.523
Stress 0.434 0.082 5.282 0.000 0.272 0.595 1.811
Cohesion -0.65 0.462 -1.405 0.161 -1.56 0.261 1.231
Attraction -0.527 0.454 -1.16 0.247 -1.422 0.368 1.152
Neighboring -0.91 0.429 -2.124 0.035 -1.755 -0.066 1.062
Household member 0.139 0.305 0.456 0.649 -0.462 0.74 1.212
SRMH -2.721 0.332 -8.205 0.000 -3.375 -2.068 1.838
Childhood Health -0.189 0.283 -0.667 0.505 -0.746 0.369 1.429
SRMH self-rated mental health; ASR access to socioeconomic resources; YrSCH number of years in school.
health (SRMH) are directly linked to depression. Contrary hood health on adulthood depression was 41% (IE = 0.410,
to the hypothesized association, the perceived gentrifi- Bootstrap se = 0.022, 95 CI 0.046–0.911).
cation score, ASR, neighborhood cohesion, attraction,
and neighborhood interaction had no direct association
with depression (Table 6). Five variables, including the
perception of gentrification, a total year spent in school
5 Discussion
(TrSCHL), historical childhood health, age, and ASR,
This study examined the direct and indirect pathways to
were directly linked to self-rated mental health and stress
depression in a sample of two communities undergoing
scores. Attraction and ASR were significantly associated
gentrification in Austin, Texas. The theoretical formula-
with gentrification, while total years spent in school,
tion developed in this study revealed a causal association
neighborhood attraction, and interaction were associated
of depression. Two theoretical perceptions guided this
with ASR in the causal model. Age was a significant deter-
study—weathering hypothesis and life course perspective.
minant of neighborhood cohesion (Table 6).
Based on all the parameters used to measure the model’s
Further, the interactions between gentrification,
goodness-of-fit, all the variables included in the model
stress, and SRMH were tested in Macro Process [77,78].
specified a correct model. Hence, the findings of the spe-
The interaction between gentrification and stress was
cific relationships uncovered in the study warrant discus-
not significant, but the interaction between SRMH and
sion.
gentrification was significant (p = 0.008). The total effect
The bivariate analysis showed that perceived gentrifi-
explained by the model was 0.472. The distribution of the
cation (or neighborhood change) was positively and signif-
effect indirectly via stress was 0.133 (Bootstrap se = 0.45,
icantly associated with depression before introducing the
95% CI 0.05–0.23); via SRMH was 0.237 (Bootstrap se =
causal analysis. This, in part, confirms the first hypothesis
0.077; 95% CI 0.101–0.401); and through stress and SRMH
and is supported by the work of Tran et al. [57] in California;
was 0.101 (Bootstrap se = 0.031; 95% CI 0.046–0.168). In
living in gentrified neighborhoods was significantly asso-
addition, the indirect effect of gentrification via child-
ciated with an increased likelihood of severe psychologi-Mental health in a changing environment 31
Figure 4: Final model and structural pathways to depression through self-rated mental health and stress. Note that the standardized coef-
ficients are presented in the figure. Legend: PGS perceived gentrification score, ASR access to socioeconomic resources, CHDH self-rated
childhood health, YrSCHL total number of years in school, HMem number of household members, and duration is years of residence in a
neighborhood.
cal distress among adult residents. Here, the positive asso- direct association between gentrification and depression
ciation indicates that as the perception of gentrification was not supported. The failure to find a direct effect of per-
increases, the report of depression increases. However, ceived gentrification on adulthood depression may arise
the relationship disappeared when measured stress and due to the more comprehensive modeling of predictors in
self-rated mental health were introduced in the model, the current study. We also found support for the second
suggesting a spurious relationship between gentrification hypothesis; perceived gentrification was associated with
and depression. This study showed that the relationship access to socioeconomic resources. Judging from the
between gentrification and health outcomes depends on dimension of the relationship between gentrification and
the context in which the relationship is being studied. As ASR, it can be inferred that increasing access to social and
shown in this study, gentrification was directly associated economic resources could reduce the negative perception
with health outcomes in a simple model, whereas its effect of gentrification. Community resources—in various forms
disappeared in a complex model. such as social capital, health care resources, and healthy
Our study uncovered several other relationships in the food—is an ideal that has been promoted in several other
pathway/structural model. We found a direct relationship research that examined the impact of the changing neigh-
between perceived gentrification, historical perception of borhood on health [58,80–82]. However, the perception of
childhood health, age, access to social and economic sup- the changing neighborhood on health could also be inter-
ports, the number of years spent in school, and measured preted that residents may perceive those changes as bene-
stress as an endogenous variable. The result on gentrifica- ficial even in changing neighborhoods. Consequently, res-
tion and stress indicated that as residents perceived phys- idents’ gentrification ratings as a negative outcome of an
ical and sociodemographic shifts in their neighborhoods, urban renewal policy may be influenced due to access to
their stress level significantly increased and aligned with social and economic resources. However, this assumption
other studies [10,12,79]. The hypothesis based on the32 Ayodeji Emmanuel Iyanda, Yongmei Lu
Table 5: Structural equation model diagnostic indices for the best model selection
Parameter Model 1 a Model 2 Model 3 Model 4
Index Index Index Index
-2 Log Likelihood 26,225.522 26,229.097 26,220.902 26,220.899
AICc 26,349.349 26,350.108 26,359.122 26,365.024
BIC 26,527.232 26,525.005 26,551.623 26,563.223
ChiSquare 94.022 97.597 89.402 89.399
DF 52.000 53.000 47.000 45.000
Prob>ChiSq 0.000 0.000 0.000 0.000
CFI 0.953 0.950 0.953 0.950
TLI 0.930 0.927 0.921 0.914
NFI 0.903 0.900 0.908 0.908
Revised GFI 0.981 0.980 0.981 0.980
Revised AGFI 0.962 0.960 0.957 0.953
RMSEA 0.049 0.050 0.052 0.055
Lower 90% 0.033 0.034 0.035 0.038
Upper 90% 0.065 0.066 0.069 0.071
RMR 3.818 3.988 2.028 2.028
SRMR 0.058 0.059 0.053 0.053
a
Preferred model
may not be the same for those who bear the brunt of the stress toward improving health and well-being [88–91].
changing environment’s effect. Following a recent systemic review of the impacts of gen-
As expected, residents who reported better child- trification on health [58], we found the mediating effect
hood health significantly had a lower score of measured of access to socioeconomic resources in the association
stress in adulthood (H2), supporting the life course effect between gentrification and health. In the context of this
on chronic health [60,63]. This study found that adult- study findings, access to socioeconomic support for res-
hood stress tended to decrease by a factor of 0.56, in line idents in the gentrifying neighborhoods will, to a greater
with other studies that found significant associations extent, reduce stress, which, in turn, will reduce depres-
between childhood health and adverse health outcomes sion. This finding reiterates the need to continuously
in adulthood [45,66,83–85]. Hence, this study contrib- provide welfare support to longtime residents who are
utes to research that has documented the accumulated most affected by gentrification. The most viable support
effect of adverse childhood experiences on adulthood would be in the form of reduced property tax for long-
health. On the other hand, the number of years spent in time homeowners who are probably retired, unemployed,
school increased stress by a factor of 0.45. This means that disabled, or with limited income to cope with the rapidly
advanced degrees contribute to increased stress. Like- changing environment. It has also been recommended for
wise, this study also found that the level of stress tends renters that rent-ceiling is a viable strategy for low-income
to reduce with increasing age. The plausible explanation earners in gentrifying neighborhoods.
for this observed relationship is that stress coping skills Like the factors related to stress as a risk factor for
among the study population increase with age, probably depression, those factors were also directly associated
due to past life experiences, and conformed with previous with self-rated mental health but with a different dimen-
findings [86,87]. sion of association. Gentrification was inversely associ-
In support of the third hypothesis (H3), improved ated with self-rated health, meaning that as perceive gen-
access to social and economic supports significantly trification increased, self-rated mental health decreased.
reduced stress as a risk factor for depression. Studies Participants might perceive gentrification as a malicious
had indicated that social supports buffer all kinds of process posing stress to them through several outcomesMental health in a changing environment 33 Table 6: Regression coefficients of the determinant of depression and other exogenous variables Regressions Estimate (β) Std. Error Wald Z Prob.>|Z| Depression SRMH -2.599*** 0.227 -11.452
34        Ayodeji Emmanuel Iyanda, Yongmei Lu

ceived gentrification and depression among residents              References
living in gentrifying neighborhoods in our complex model.
Our study also indicates that stress was directly related to      [1]    Center for Disease Control and Prevention. Mental Health:
depression among residents in gentrifying neighborhoods                  Data and Publications [Internet]. 2018 [cited 2020 Aug 31].
                                                                         Available from: https://www.cdc.gov/mentalhealth/data_
in East and Southeast Austin. These findings build on
                                                                         publications/index.htm.
the current evidence on environmental stress and mental           [2]    Beck DA, Koenig HG, Beck JS. Depression. Clin Geriatr Med.
health. It also supports the weathering hypothesis. There-               1998;14(4):765–86.
fore, it is essential to buffer stress sources by improving       [3]    Hammen C, Henry R, Daley SE. Depression and sensitization
access to social and economic resources, particularly for                to stressors among young women as a function of childhood
                                                                         adversity. J Consult Clin Psychol. 2000;68(5):782–7.
residents in gentrifying neighborhoods.
                                                                  [4]    Venzala E, Garcia-Garcia AL, Elizalde N, Tordera RM. Social
     Many scholars and policymakers believed that intro-                 vs. environmental stress models of depression from a
ducing the affluent population in low-income neighbor-                   behavioural and neurochemical approach. Eur Neuropsychop-
hoods improves the physical environment of disinvested                   harmacol. 2013;23(7):697–708.
neighborhoods. However, gentrification may not neces-             [5]    Brummett BH, Boyle SH, Siegler IC, Kuhn CM, Ashley-Koch
sarily improve access to community resources if the social               A, Jonassaint CR, et al. Effects of Environmental Stress and
                                                                         Gender on Associations among Symptoms of Depression and
status of low-income minority residents is not improved
                                                                         the Serotonin Transporter Gene Linked Polymorphic Region
to match that of the gentry. This study indicates that                   (5-HTTLPR). Behav Genet. 2008;38(1):34–43.
stress from the changing environments may increase poor           [6]    Conway CC, Rutter LA, Brown TA. Chronic Environmental
mental health considering other life stress sources from                 Stress and the Temporal Course of Depression and Panic
a relationship and work not covered in this study. Gentri-               Disorder: A Trait-State-Occasion Modeling Approach. J
                                                                         Abnorm Psychol. 2016;125(1):53–63.
fication plays a passive role, while stress plays an active
                                                                  [7]    Curry A, Latkin C, Davey-Rothwell M. Pathways to depression:
role in contributing to residents’ mental health status in               The impact of neighborhood violent crime on inner-city
this study. For gentrification’s benefits to be fully realized,          residents in Baltimore, Maryland, USA. Soc Sci Med.
factors causing stress such as displacement and increas-                 2008;67(1):23–30.
ing property tax should be addressed, particularly for            [8]    Gary TL, Stark SA, LaVeist TA. Neighborhood characteristics
low-income earners with a fixed income.                                  and mental health among African Americans and whites
                                                                         living in a racially integrated urban community. Health Place.
                                                                         2007;13(2):569–75.
Funding information: This study acknowledges the                  [9]    Latkin CA, Curry AD. Stressful neighborhoods and depression:
funding support by the Department of Geography, Texas                    a prospective study of the impact of neighborhood disorder. J
State University, through the Detlefsen Geography Schol-                 Health Soc Behav. 2003;44(1):34–44.
arship and Doctoral Research Support Fellowship by                [10]   Mair C, Diez Roux AV, Golden SH, Rapp S, Seeman T, Shea
                                                                         S. Change in neighborhood environments and depressive
Graduate College, Texas State University.
                                                                         symptoms in New York City: The Multi-Ethnic Study of Athero-
                                                                         sclerosis. Health Place. 2015;32:93–8.
Conflict of interest: The authors state no conflict of inter-     [11]   Mair C, Roux AD, Galea S. Are neighbourhood characteristics
est.                                                                     associated with depressive symptoms? A review of evidence.
                                                                         J Epidemiol Community Health. 2008;62(11):940–6.
Informed consent: Informed consent has been obtained              [12]   Weissman MM, Paykel ES. Moving and depression in women.
                                                                         Society. 1972;9(9):24–8.
from all individuals included in this study.
                                                                  [13]   Way H, Mueller E, Wegmann J. Uprooted: Residential
                                                                         Displacement in Austin’s Gentrifying Neighborhoods and
Ethical approval: The research related to human use has                  What Can Be Done About it. Report & Maps [Internet]. 2018
been complied with all the relevant national regulations,                [cited 2020 Jan 24]. Available from: https://sites.utexas.edu/
institutional policies and in accordance with the tenets of              gentrificationproject/..austin-uprooted-report-maps/.
                                                                  [14]   Su Y. Gentrification Transforming Neighborhoods in Big
the Helsinki Declaration, and has been approved by the
                                                                         Texas Cities [Internet]. 2019 [cited 2020 Jan 28]. Available
authors’ institutional review board or equivalent commit-                from: https://www.dallasfed.org:443/research/swe/2019/
tee.                                                                     swe1904/swe1904b.
                                                                  [15]   Freeman L. Commentary: 21st century gentrification.
Data availability statement: The datasets generated                      Cityscape. 2016;18(3):163–8.
during and/or analyzed during the current study are               [16]   Smith N. Gentrification and capital: practice and ideology in
                                                                         Society Hill. Antipode. 1979;11(3):24–35.
available from the corresponding author on reasonable
request.
Mental health in a changing environment 35
[17] Freeman L. Displacement or succession? Residential [36] Cantu T. Anti-Gentrification Protest Turns Violent In East
mobility in gentrifying neighborhoods. Urban Aff Rev. Austin [Internet]. East Austin, TX Patch. 2017 [cited 2020 Jan
2005;40(4):463–91. 24]. Available from: https://patch.com/texas/eastaustin/
[18] Atkinson R, Wulff M, Reynolds M, Spinney A. Gentrification anti-gentrification-protest-turns-violent-east-austin.
and displacement: the household impacts of neighbourhood [37] Rice R. Gentrification protest at Blue Cat Café in East Austin
change. AHURI Final Rep. 2011;160:1–89. turns violent [Internet]. Austin American-Statesman. 2017
[19] Atkinson R. The hidden costs of gentrification: Displacement [cited 2020 Jan 24]. Available from: https://www.statesman.
in central London. J Hous Built Environ. 2000;15(4):307–26. com/news/20170612/gentrification-protest-at-blue-cat-caf-
[20] Atkinson R. The evidence on the impact of gentrification: in-east-austin-turns-violent.
new lessons for the urban renaissance? Eur J Hous Policy. [38] Incendiary. AUSTIN: Defend the Defenders! A Timeline
2004;4(1):107–31. of the Struggle Against Gentrification on Riverside
[21] Atkinson RM. Does gentrification help or harm urban [Internet]. Incendiary. 2019 [cited 2020 Jan 24]. Available
neighbourhoods?: An assessment of the evidence-base in from: https://incendiarynews.com/2019/08/12/
the context of new urban agenda. Vol. 5. ESRC Centre for austin-defend-the-defenders-a-timeline-of-the-struggle-
Neighbourhood Research Glasgow; 2002. against-gentrification-on-riverside/.
[22] Freeman L, Cai T. White entry into black neighborhoods: [39] Jankowski P. Activists push anti-displacement earmark on eve
Advent of a new era? Ann Am Acad Pol Soc Sci. of city budget talks [Internet]. Austin American-Statesman.
2015;660(1):302–18. 2018 [cited 2020 Jan 24]. Available from: https://www.
[23] Rucks-Ahidiana Z. Racial composition and trajectories of statesman.com/NEWS/20180911/Activists-push-anti-dis-
gentrification in the United States. Urban Stud. 2020. doi: placement-earmark-on-eve-of-city-budget-talks.
10.1177/0042098020963853. [40] Geronimus AT. To mitigate, resist, or undo: addressing
[24] Brown-Saracino J. The gentrification debates: a reader. structural influences on the health of urban populations. Am J
Routledge; 2013. Public Health. 2000;90(6):867–72.
[25] Smith N. On ‘The Eviction of Critical Perspectives’. Int J Urban [41] Geronimus AT. Understanding and eliminating racial
Reg Res. 2008;32(1):195–7. inequalities in women’s health in the United States: the role
[26] Whittle HJ, Palar K, Hufstedler LL, Seligman HK, Frongillo EA, of the weathering conceptual framework. J Am Med Womens
Weiser SD. Food insecurity, chronic illness, and gentrification Assoc 1972. 2001;56(4):133–6, 149–50.
in the San Francisco Bay Area: an example of structural [42] Shmool JL, Yonas MA, Newman OD, Kubzansky LD, Joseph E,
violence in United States public policy. Soc Sci Med. Parks A, et al. Identifying perceived neighborhood stressors
2015;143:154–61. across diverse communities in New York City. Am J Community
[27] Busch A. City in a Garden: Environmental Transformations Psychol. 2015;56(1–2):145–55.
and Racial Justice in Twentieth-century Austin, Texas. UNC [43] Wilder V, Mirto A-L, Makoba E, Arniella G. The health impact
Press Books; 2017. of gentrification. J Gen Emerg Med. 2017;4:1981–91.
[28] Busch A. Crossing Over: Sustainability, New Urbanism, [44] Keene DE, Geronimus AT. “Weathering” HOPE VI: the
and Gentrification in Austin, Texas [Internet]. Southern importance of evaluating the population health impact of
Spaces. 2015 [cited 2020 Sep 11]. Available from: https:// public housing demolition and displacement. J Urban Health.
southernspaces.org/2015/crossing-over-sustainabili- 2011;88(3):417–35.
ty-new-urbanism-and-gentrification-austin-texas/. [45] Kawachi I, Subramanian S, Almeida-Filho N. A glossary
[29] Perez P, Pettit C, Barns S, Doig J, Ticzon C. An Information for health inequalities. J Epidemiol Community Health.
Management Strategy for City Data Hubs: Open Data 2002;56(9):647–52.
Strategies for Large Organisations. In 2020. p. 289–309. [46] Kinlein SA, Wilson CD, Karatsoreos IN. Dysregulated
[30] Austin History Center. Austin (Tex.). Urban Renewal Agency hypothalamic–pituitary–adrenal axis function contributes to
Board of Commissioners Records An Inventory of the altered endocrine and neurobehavioral responses to acute
Collection [Internet]. 2007 [cited 2020 Jan 18]. Available from: stress. Front Psychiatry. 2015;6:31.
https://legacy.lib.utexas.edu/taro/aushc/00462/ahc-00462. [47] Geronimus AT, Hicken M, Keene D, Bound J. “Weathering”
html. and Age Patterns of Allostatic Load Scores Among Blacks
[31] City of Austin. Neighborhood and Commercial Revitalization and Whites in the United States. Am J Public Health.
[Internet]. 1999 [cited 2019 Dec 27]. Available from: http:// 2006;96(5):826–33.
www.austintexas.gov/department/neighborhood-and-com- [48] Hill TD, Angel RJ. Neighborhood disorder, psycho-
mercial-revitalization. logical distress, and heavy drinking. Soc Sci Med.
[32] Williams JA. The effects of urban renewal upon a black 2005;61(5):965–75.
community: evaluation and recommendations. Soc Sci Q. [49] Frenneaux MP, Counihan PJ, Caforio AL, Chikamori T,
1969;50(3):703–12. McKenna WJ. Abnormal blood pressure response during
[33] Tang E, Falola B. Those Who Left: Austin’s Declining African exercise in hypertrophic cardiomyopathy. Circulation.
American Population. 2016. 1990;82(6):1995–2002.
[34] Tang E, Falola B. Those who stayed. 2017. [50] Karatsoreos IN, McEwen BS. Psychobiological allostasis:
[35] Mcghee FL. How Austin Gentrification Operates in My resistance, resilience and vulnerability. Trends Cogn Sci.
Neighborhood [Internet]. 2017 [cited 2020 Jan 24]. Available 2011;15(12):576–84.
from: http://www.fredmcghee.com/?p=320.You can also read