Social media metrics for new research evaluation0F - arXiv
←
→
Page content transcription
If your browser does not render page correctly, please read the page content below

Social media metrics for new research evaluation *                        0F

                         Paul Wouters, Zohreh Zahedi, Rodrigo Costas
                          CWTS, Leiden University, the Netherlands

Abstract
This chapter approaches, both from a theoretical and practical perspective, the most important
principles and conceptual frameworks that can be considered in the application of social media
metrics for scientific evaluation. We propose conceptually valid uses for social media metrics
in research evaluation. The chapter discusses frameworks and uses of these metrics as well as
principles and recommendations for the consideration and application of current (and
potentially new) metrics in research evaluation.

1. Introduction

Since the publication of the Altmetrics Manifesto in 2010 (Priem, Taraborelli, Groth, & Neylon,
2010), interest in alternative measures of research performance has grown. This is partly fueled
by the problems encountered in both peer review and indicator-based assessments, and partly
by the easy availability of novel types of digital data on publication and communication
behavior of researchers and scholars. In this chapter, we review the state of the art with respect
to these new altmetric data and indicators in the context of the evaluation of scientific and
scholarly performance.
This chapter brings together three different strands of literature: the development of principles
for good and responsible use of metrics in research assessments and post-publication
evaluations, the technical literature on altmetrics and social media metrics, and the literature
about the conceptual meaning of social media metrics.
The field of altmetrics has grown impressively since its inception in 2010. We now have regular
altmetrics conferences where academic and commercial data analysts and providers meet. A
number of non-profit and for-profit platforms provide altmetric data and some summarize these
data in visually appealing statistical presentations. Some of the resulting altmetric indicators are
now even incorporated in traditional citation indexes and are published on journal websites.
Notwithstanding this resounding success, we come to the conclusion that the term altmetrics is
a misnomer and is best abandoned. Based on the published research since 2010, we have to
conclude that no theoretical foundation or empirical finding justifying the lumping together of
such various measures under the same term. We therefore propose to disaggregate the various
datasets and indicators, in their use in research evaluation, as well as in their conceptual
interpretation and, last but not least, in their names. Many data and indicators (we use the term
metrics to denote both data and indicators) that make up the altmetric universe are actually data
about social media use, reception, and impact. We suggest that it would be wiser to adopt the

*
 Forthcoming in Glänzel, W., Moed, H.F., Schmoch U., Thelwall, M. (2018). Springer Handbook of
Science and Technology Indicators. Springer.

                                                 1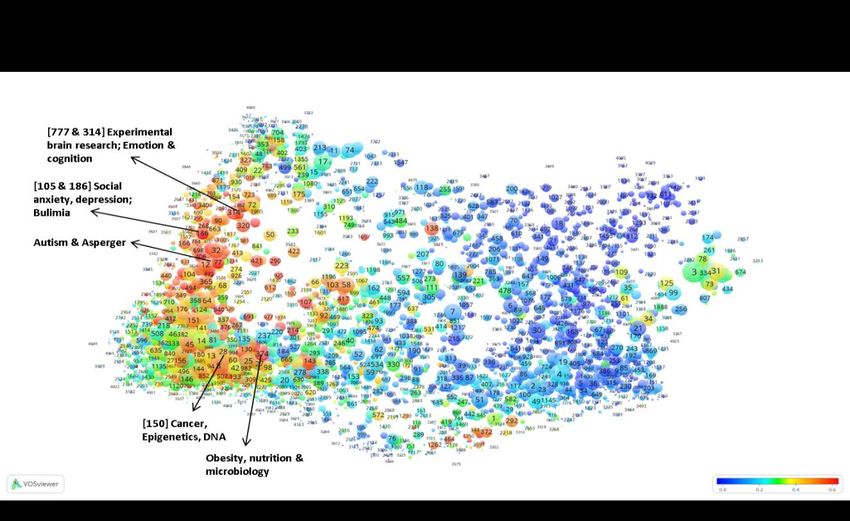
term social media metrics for these data and indicators, following a suggestion by Haustein,
Bowman, & Costas (2016). However, this is also not an umbrella term that can be used for all
data and indicators that are currently denoted as altmetrics. As Haustein, Bowman, & Costas
(2016) also indicate, some of these novel metrics are essentially web-based forms of traditional
library data. And some data, such as Mendeley readerships, can be seen as a hybrid between
bibliometric and social media data. Nevertheless, we think that introducing the term social
media metrics would be helpful to understand a large part of what is now just labelled as
altmetrics. We hope that this will stimulate the more accurate labelling of the remaining data
and indicators. In this chapter, we will therefore use the term social media metrics whenever
we refert to data and indicators about social media use, reception and impact. We will restrict
the term altmetrics to historically accurate references, since the term has been quite popular
since 2010, and we do not want to rewrite history from the present.
The chapter is organized in six sections. The next, second, section explores the recent history
starting with the Altmetrics Manifesto and puts this in the context of critiques of the traditional
forms of research evaluation. The section shows the development of guidelines and principles
in response to these critiques and mentions the concept of responsible metrics as one of the
outcomes. The third section gives an overview of the currently available social media tools
according to the data sources and discusses how they can characterize types of interactions as
well as users. The fourth section zooms in on issues and actual applications of social media
metrics. It reviews the technical characteristics of these data and indicators from the perspective
of their use, the research questions that they can address, and principles for their use in
evaluative contexts. In this section, we also spell out why the distinction between descriptive
and comparative metrics may be useful. The fifth section discusses possible future
developments including novel approaches to the problem of research evaluation itself. The last
and sixth section details the limitations of the chapter and specifically mentions the need for
more research on the use and sharing of data in the context of research evaluation. We end with
the bibliography that we hope will be especially useful for novel students and researchers as
well as for practittioners in the field of research evaluation.

2. Research Evaluation: principles, frameworks and challenges

2.1 Origins: the Altmetrics Manifesto
Altmetrics were introduced with the aim, among others, of improving the information used in
research evaluations and formal assessments by providing an alternative to "traditional"
performance assessment information. The Altmetric Manifesto called for new approaches to
fully explore the potential of the web in scientific research, information filtering and
assessments. It characterized peer review as "beginning to show its age" since it is "slow,
encourages conventionality, and fails to hold reviewers accountable". Citations, on the other
hand, are "useful but not sufficient". Some indicators such as the h-index are "even slower than
peer-review", and citations are narrow, neglect impact outside the academy and ignore the
context of citation. The Journal Impact Factor, which was identified by the Manifesto as the
third main information filter "is often incorrectly used to assess the impact of individual
articles", and its nature makes significant gaming relatively easy. Since new uses of the web in
sharing data and scholarly publishing created new digital traces, these could be harvested and

                                                2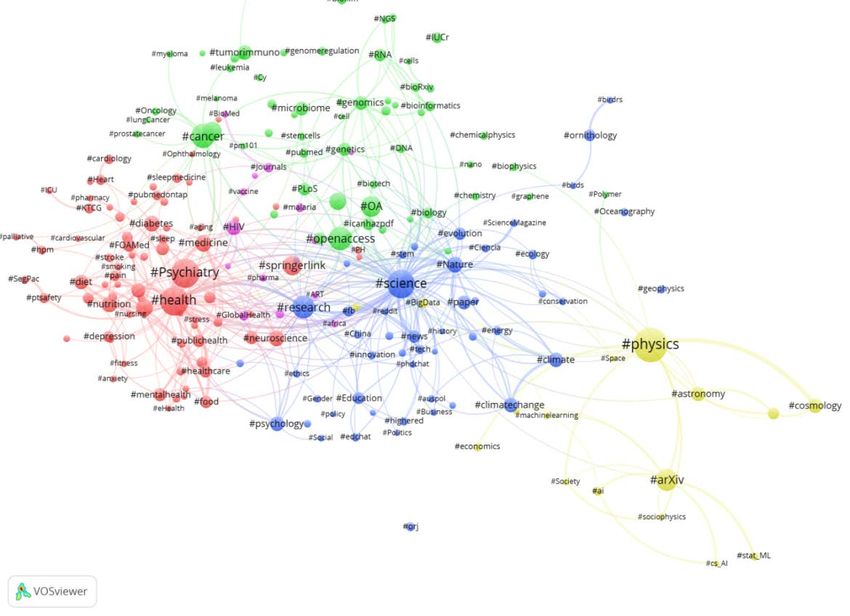
converted to new indicators to support researchers in locating relevant information as well as
the evaluation of the quality or influence of scientific work.
The idea that the web would lead to novel markers of quality or impact was in itself not new. It
had already been identified by scientometricians in the 1990s (Almind & Ingwersen, 1997;
Cronin, Snyder, Rosenbaum, Martinson, & Callahan, 1998; Rousseau, 1997). This did not
immediately change evaluative metrics, however, because data collection was difficult and the
web was still in its early stages (Priem, Piwowar, & Hemminger, 2012; Priem & Hemminger,
2010). Only after the development of more advanced algorithms by computer scientists did
social media metrics turn into a real world alternative in the area of scientometrics and research
evaluation (Jason Priem, 2013).
The emergence of social media metrics can thus be seen as motivated by, and a contribution to,
the need for responsible metrics. Its agenda included the study of the social dimensions of the
new tools while further refining and developing them. Possible perverse or negative effects of
the new indicators were recognized but they were not seen as a reason to abstain from
innovation in research metrics (Jason Priem, 2013). Experts in webometrics and scientometrics
tended to be a bit more wary of a possible repetition of failures that had occurred in traditional
scientometrics (Wouters et al., 2015; Wouters & Costas, 2012). As a result, the development of
tools like the altmetric donut did not completely satisfy the need for guidelines for proper
metrics in the context of research evaluation although they did open new possibilities for
measuring the process and outcome of scientific research.

2.2 Standards, critiques and guidelines
This lacuna was filled by two partly independent developments. From the altmetrics
community, an initiative was taken to develop standards for altmetric indicators and use in the
context of the US National Information Standards Organization (NISO) as a result of a breakout
session at the altmetrics12 conference (http://altmetrics.org/altmetrics12) (National
Information Standards Organization, 2016). In parallel, guidelines were developed as a joint
effort of researchers responsible for leading research institutions, research directors and
managers, metrics and evaluation experts, and science policy researchers (Wilsdon et al., 2015).
They mainly developed as a critique of the increased reliance on various forms of metrics in
post-publication assessments as in the San Francisco Declaration on Research Assessment
(DORA) and the Leiden Manifesto for Research Metrics (Hicks, Wouters, Waltman, Rijcke, &
Rafols, 2015; “San Francisco Declaration on Research Assessment (DORA),” 2013). It should
be noted that these initiatives did not come out of the blue, but built upon a long trajectory in
which the scientometric community had developed methodological standards and common
interpretations of what the various indicators represent in the context of research evaluation. It
led to a set of professional standards, some of them explicit, others more implicit, that guided
the work of the most important metric centres (Glänzel, 1996; Moed, 2005). In general, the
scientometric community had developed a consensus about the need to use bibliometrics as
complement, rather than replacement, of peer review, which is summarized in the concept of
informed peer review.
With the rise of the web and the wider availability of both traditional and novel metrics, the
scientometric professionals lost their monopoly and what was variously called amateur
scientometrics or citizen scientometrics started to take off (Glänzel, 1996; Leydesdorff,

                                                3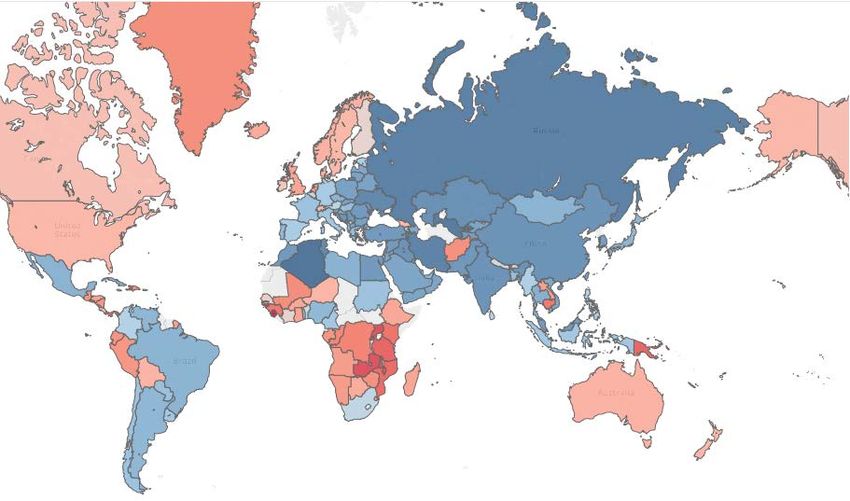
Wouters, & Bornmann, 2016; Thelwall, 2009; Wouters, Glänzel, Gläser, & Rafols, 2013). This
required a new approach and a more explicit non-technical development of guidelines, for
which the groundwork was laid at a series of conferences in the years 2013 - 2016 and in the
context of the debates about the role of metrics in national research assessments, especially in
Northwestern Europe.
The San Francisco Declaration on Research Assessment (DORA) (San Francisco Declaration
on Research Assessment (DORA), 2013) made 18 recommendations aimed at scholars, funders,
institutions and research metrics providers. The most important recommendation was not to use
the Journal Impact Factor to judge the merit of individual articles or authors. Instead article-
level metrics was recommended. It also emphasized the value of all scientific outputs including
datasets and software in addition to research publications. Openness about criteria in
assessments and transparency of data and indicators is also an important theme in the
recommendations.

2.3 Individual-level metrics
At the 2013 International Scientometric and Informetric Society (July 2013, Vienna) and at the
2013 Science and Technology Indicator / ENID Conference (September 2013, Berlin) another
set of recommendations was discussed, specifically aimed at the use of indicators to assess the
contribution of individual researchers (Wouters et al., 2013).
A year later, the EU funded project ACUMEN resulted in a more detailed evaluation guideline
for both researchers and evaluators (Wouters et al., 2014). The core component is the ACUMEN
Portfolio which consists of several pillars of evidence (Figure 1).

                 Figure 1: The ACUMEN Portfolio (Wouters et al., 2014).

The basic idea of the ACUMEN approach is that evaluation is a form of communication in
which the researcher herself should have a strong voice (and not only play the role of object of

                                               4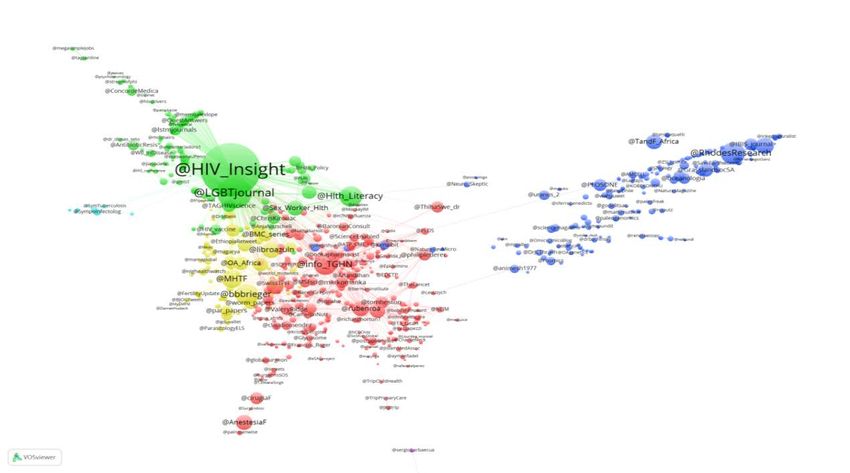
evaluation). The career narrative should be the main input for the assessment at the individual
level, and qualitative and quantitative indicators can provide evidence for particular elements
in the narrative. This supporting evidence is organized in three pillars: expertise, output and
influence which enables a more flexible and modular approach to the indicators that may be
used. An important component of the ACUMEN Portfolio are the evaluation guidelines which
entail detailed advice on the merits of particular indicators covering both traditional and
alternative metrics. The guidelines are specifically aimed at both researchers under assessment
and the evaluators providing an extra layer of transparency. It is also based on the fact that
researchers need to perform both roles.

2.4 Responsible Metrics
The Leiden Manifesto for Research Metrics was the result of the continuing discussion in the
community of indicator specialists and scientometricians. They drew the conclusion that a
public response in non-technical terms was useful to counteract the spreading of badly used
indicators in research evaluations (Hicks et al., 2015). The manifesto provides 10 principles
that should be taken into account while using metrics in research assessment. These principles
are not tied to a particular dataset or assessment type. Currently, 18 translations of the manifesto
have been published which may be an indication of the need for this type of guidelines and
information. Nevertheless, this does not prove that the principles are actually affecting research
evaluation practices since we may also witness symbolic adherence without changing the
criteria for research evaluations or career judgements.
An even more generic framework to guide the application of quantitative indicators was laid
down in the UK report The Metric Tide (Wilsdon et al., 2015). This was written at the request
of the Higher Education Funding Council for England (HEFCE) to inform the debate about a
possible replacement of the national research assessment process (which is mainly based on a
massive peer review operation by panels of experts) by a metrics based assessment. The report
is not the product of one specific community but the result of a truly interdisciplinary exercise
in which researchers from a variety of fields worked together with indicators and policy experts.
The report proposed to put central the concept of responsible metrics, echoing the notion of
responsible research and innovation from the European science policy discourse.
The notion of responsible metrics leads, together with the empirical research reported in the
Metric Tide to 20 recommendations to all stakeholders in the UK research system. They support
both DORA and the Leiden Manifesto and emphasize the need to put indicators in context. The
research community is advised to "develop a more sophisticated and nuanced approach to the
contribution and limitations of quantitative indicators". Transparency is also an important
theme, both of data and of processes and this should lead to a much improved research data
infrastructure. The latter still lacks crucial components especially in the area of indicators of
the research environment, scientific instruments and technical and institutional infrastructure.
The Metric Tide pays special attention to altmetrics, with the question whether they can
complement traditional performance indicators. The overall conclusion is that current altmetrics
cannot yet be used in most research assessments (Wouters et al., 2015).

More specifically to the context of altmetrics, an initiative to develop standards in altmetrics
started in 2013, resulting in the NISO Recommended Practice, Altmetrics Definitions and Use

                                                 5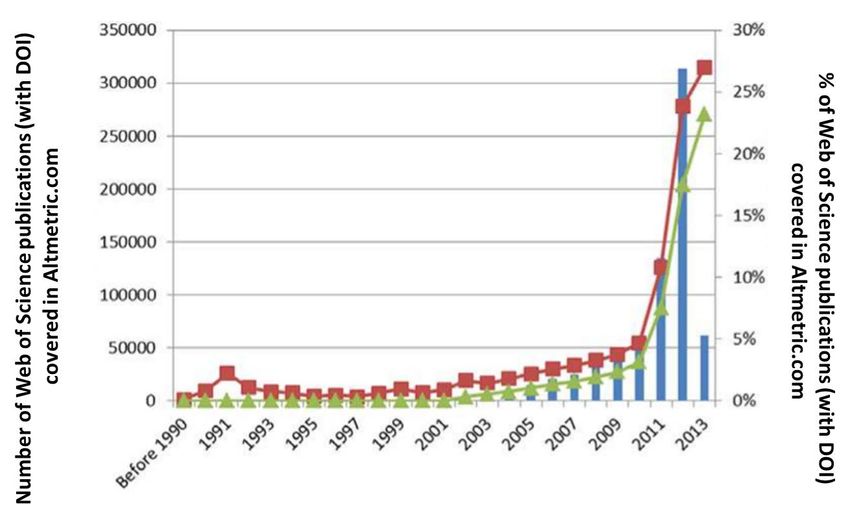
Cases in 2016 (National Information Standards Organization, 2016). The report comprises a
detailed set of use cases in which the possibilities and limitations of a variety of altmetric
indicators for particular purposes by specific stakeholders is discussed. The NISO report also
includes a code of conduct with respect to the responsible use of altmetric data which focuses
on transparency, replicability, and accuracy of indicators.

3. Social media data and indicators
The emergence of metrics of scholarly objects based on data from online social media platforms
opened the possibility of analyzing new forms of interactions between different audiences and
scholars (or scholarly products). These interactions are possible through the technical
affordances allowed by these social media platforms and have been conceived as “traces of the
computerization of the research process” (Moed, 2015), resulting in the availability of different
indicators based on user activity across the various online platforms. The NISO Recommended
Practice, Altmetrics Definitions and Use Cases (National Information Standards Organization,
2016) defined altmetrics as “online events derived from activity and engagement between
diverse stakeholders and scholarly outputs in the research ecosystem”. Social media metrics
have also been discussed as a potential source of evidence in research evaluation, particularly
in response to the quest for better metrics for measuring research performance (San Francisco
Declaration on Research Assessment (DORA), 2013).
Several advantages of social media metrics have been discussed, particularly over the more
traditional approaches of research evaluation (Wouters & Costas, 2012). Among these
advantages, speed, openness and diversity have been highlighted as some of the most important
ones (Wouters & Costas, 2012). However, Wouters & Costas (2012) also argued that for these
new indicators to be realistically used in research evaluation, transparency and consistency are
more important characteristics.
A theoretical framework for the use of altmetrics in evaluation was introduced by Haustein,
Bowman, & Costas (2016). Based on this framework, social media metrics can also be seen as
“events on social and mainstream media platforms related to scholarly content or scholars,
which can be easily harvested (i.e., through APIs), and are not the same as the more traditional
concept of citations” (Haustein et al., 2016). This framework categorizes online acts upon
research objects, including all forms of scholarly outputs (e.g. publications, but also data, code,
etc.) as well as scholarly agents (e.g., scholars, funding agencies, research organizations, etc.).
Thus, the realm of these new metrics wouldn’t be limited to the interactions with research
outputs, but would include interactions with (and among) different scholarly agents; and the
different forms of interactions can be characterized by the degree of engagement between the
users with the scholarly objects.
However, in spite of these more conceptual discussions on the nature and characteristics of
social media metrics, their strongly heterogeneous and ever changing nature (Haustein, 2016)
has made the development of robust theories for the interpretation and evaluation of the
activities and interactions captured by them very challenging.

3.1. Social media metrics tools
In this section the main characteristics of tools based on social media metrics are described.
The perspective is not to discuss these tools as evaluative devices, but rather as sources of

                                                6
information on the relationships and interactions between science and social media. Thus, we
take the approach that social media metrics are relevant sources to study the interactions and
relationships between science and social media, aligning more with what could be termed as
the Social Media Studies of Science (Costas, 2017), instead of sources of scientific recognition
or scientific impact. Moreover, our aim is not to focus on the currently available "altmetric
sources" but on the concepts behind these sources. Thus, although the current tools, sources and
platforms collecting an providing social media data may disappear or change in the future (in
what Haustein (2016) has labeled as the dependencies of altmetrics), many of the events and
acts currently captured by altmetric data aggregators could still be relevant in the future. For
example, if Mendeley disappears, the idea of an online reference manager would still be feasible
– with users from all over the world saving their documents – and counts on the number of
different users (and by types of users) saving these documents would still be possible should
other new platforms be created. Moreover, most common social media metrics tools usually
refer to online events that exist around scholarly outputs (usually journal articles), however
there are also tools that focus on the activities of scholarly agents, particularly individuals.
These tools and their main conceptual social media significance are described below :

 •   Online reference management, social bookmarking and tagging tools. Several online
     reference managers allow the counting of the number of times publications have been
     saved, bookmarked, or tagged by different users of the platform. For instance, the
     readership counts provided by Mendeley (http://www.mendeley.com) include total
     number of users who have saved (added) a document to their private libraries. Besides,
     Mendeley offers some statistics on the academic status (students, professors, researchers,
     librarians, professionals, etc.), discipline and country of the users, as well as tags assigned
     to the saved publications by them. Other tools such as BibSonomy
     (https://www.bibsonomy.org/), Zotero (https://www.zotero.org), and CiteULike
     (http://www.citeulike.org/) also offer information on the posted counts/users, tags, posting
     history and user’s info plus the bibliographic information of the bookmarked or saved
     documents, although their APIs are not yet fully developed (Haustein, 2016).
 •   Microblogging tools (such as Twitter (https://twitter.com), and Weibo
     (https://www.weibo.com), etc.) offer the possibility of disseminating information in small
     messages (e.g. the current 280 characters limit by Twitter, before 2017 it was 140). In
     addition, these tools are aimed at broadcasting, filtering and establishing interactions
     among their users. For example, through the use of symbols such as @, or # in Twitter, it
     is possible to target other Twitter users (tweeters) and create messages (tweets) that are
     easy to filter or re-disseminate (re-tweet) to other users by the use of specific tags (the #
     symbol for thematic tags or the @ symbol to target other users). These tools also offer
     possibilities for following other users and liking (or appraising) other users’ messages
     within the platform. Most microblogging tools offer the possibility of linking to external
     objects, which may be publications (e.g. through their DOI) or other scholarly agents (e.g.
     scholars’ websites, university websites, etc.). These technical options (i.e., affordances)
     open the possibility to generate multiple indicators (e.g. the number of (re)tweets, likes, or
     followers around any particular scholarly object). An advantage of these platforms is that
     they provide rich information on users, tweets, and locations through both their web

                                                7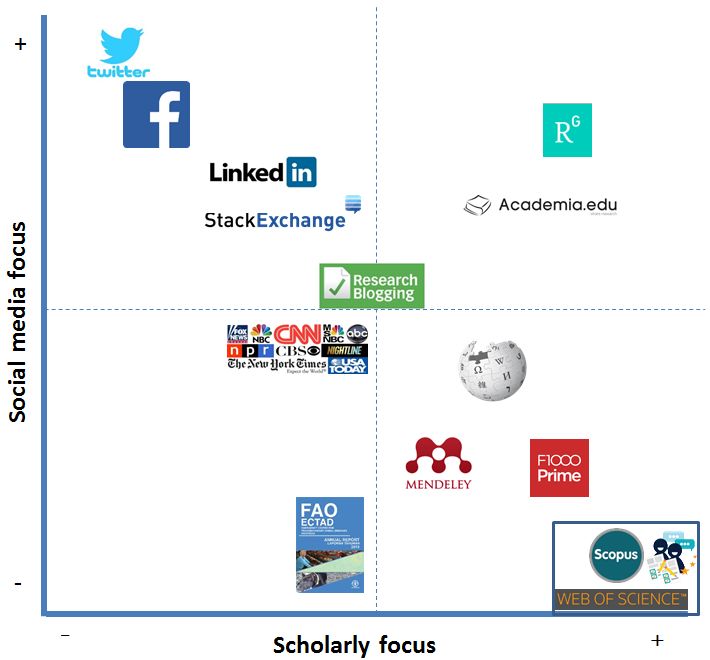
interfaces and their APIs (Twitter streaming API, REST API with rate limit, or the
    commercial GNIP API (https://dev.twitter.com/docs) or Weibo open API
    (http://open.weibo.com/wiki/API%E6%96%87%E6%A1%A3/en)), thus making their
    data accessible and analyzable (although the different platforms may impose restrictions
    in the amount of data obtained).
•   Blogs and blog aggregators. A number of blog platforms and blogging tools focus on peer
    reviewed research, for example ResearchBlogging.org or ScienceSeeker.org. Blogs, and
    particularly scientific blogs, are emerging means of disseminating discussions on scholarly
    materials (Shema, Bar-Ilan, & Thelwall, 2014) to other academics or the general public.
    Typical metrics that can be obtained from these platforms include blog mentions (e.g. the
    mentioning of a researcher or a university) or blog citations (e.g. citations to other
    scientific outputs). Information from blogging activities is usually available through their
    web interfaces or APIs.
•   Social recommendation, rating, and reviewing services. Here we find some scholarly
    oriented tools like F1000Prime (http://f1000.com/prime/about/whatis/how), which is a
    post-publication peer review service offering access to metrics such as views, downloads,
    as well as recommendation scores of biomedical literature, reviewed by their appointed
    users together with information (labels or tags) on their type of recommendation (e.g. for
    teaching, controversial, new findings, etc.). Other academic platforms include Publons
    (https://publons.com/home/), which has recently been acquired by Clarivate Analyitics or
    PubPeer (https://pubpeer.com/), which offer post publication peer comments and scores
    for scholarly biomedical or multidisciplinary publications. A more general platform is
    Reddit (https://www.reddit.com/dev/api), which provides information such as comments
    and votes to the posts provided by its users. Some of these tools offer open APIs (Reddit)
    while for others (Publons or PubPeer) access is available only on request.
•   Wikis and collaborative content creation. These platforms are seen as “collaborative
    authoring tool[s] for sharing and editing documents’ by users” (Rowlands, et al., 2011). A
    common metric available through these sources includes mentions of scholarly objects.
    For example, Wikipedia citations or mentions are available via its API
    (https://www.mediawiki.org/wiki/API:Main_page), enabling the analysis of the number
    of citations that scholarly publications have received in Wikipedia.
•   Social networking platforms (e.g. LinkedIn (https://www.linkedin.com/), Facebook
    (https://www.facebook.com/), etc.). These generalist platforms allow their users to
    connect, interact and communicate in many different ways (messaging, sharing,
    commenting, liking, etc.). Information on their users, activities and their geo-locations are
    typically available through their web interfaces or APIs (e.g., Facebook Graph and
    Facebook public feed APIs (https://developers.facebook.com/docs/graph-api) or LinkedIn
    API (https://developer.linkedin.com/docs/fields).
•   Social      networking       platforms       for     researchers       (e.g.    ResearchGate
    (https://www.researchgate.net/) and Academic.edu). These tools provide information on
    scholars and their outputs, affiliations, and offer different metrics at the individual,
    institutional or country levels. This type of platforms, inspired in the more generalist social
    networking platforms), aim at facilitating networking and communication among scholars,

                                               8
finding academic content, experts, or institutions, as well as sharing and disseminating
their research with peers. ResearchGate offers different indicators such as the RG score (a
measure of reception of a researcher’s publications and her participation on the platform),
RG reach (a measure of visibility of a researcher’s publications on the platform), together
with other indicators such as the number of citations, reads, downloads, h-index and profile
views. It seems that the RG score is influenced by a researcher’s academic and online
activities and hence it is suggested that it reflects a combination of scholarly and social
networking norms (Orduña-Malea, Martín-Martín, & López-Cózar, 2016 cited in Thelwall
& Kousha, 2017). Other platforms such as Academic.edu provide information on mentions
of a researcher’s name by others, on the readers (including views, downloads, and
bookmarks of a researcher’s publications), profile views and visitors per date, country,
cities, universities, job titles, etc., some of which are available by monthly subscription.
• Altmetric data aggregators. These are tools such as Altmetric.com, Lagotto
(http://www.lagotto.io/), PLoS ALM (https://www.plos.org/article-level-metrics), Plum
Analytics (http://plumanalytics.com/), and Impact Story (https://impactstory.org/) which
aggregate metrics for scholarly materials from different sources. Examples of the metrics
provided by these aggregators include views, saves, citations, recommendations, and
discussions around scientific publications by PLOS ALM and Lagotto; or those of usage,
captures, mentions, social media, and citations by Plum Analytics. Altmetric.com
provides a composite weighted indicator (Altmetric Attention Score) of all the scores
collected around scientific outputs (https://www.altmetric.com/about-our-data/the-donut-
and-score/). Although most of these aggregators are based on a similar philosophy (to
capture online events around scholarly objects), they often differ in the sources they track
(e.g. publications with DOIs, PMID, etc.), the methodologies they use to collect the data
(e.g. using public or commercial APIs, etc.) and the way they process and report the
metrics (e.g. raw vs. more aggregated indicators). Usually they also differ in terms of their
updates, coverage, and accessibility (Zahedi, Fenner, & Costas, 2015).
3.2. Characterizing interactions and users in social media metrics
The relationships between scholarly objects and social media users can be characterized from
two different perspectives: the typologies of social media users that interact with the scholarly
objects; and the typologies of social media interactions that are established between the social
media users and the scholarly objects.
• Typologies of social media users
The analysis of social media users has been approached from different perspectives, and a
general framework (unified Media-User Typology) has been suggested for unifying all media
user types based on user’s frequency, variety of use, and their content preference (Brandtzæg,
2010). According to (Brandtzæg, 2010), the term user typology is defined as the “categorization
of users into distinct user types that describes the various ways in which individuals use
different media, reflecting a varying amount of activity/content preferences, frequency and
variety of use”, which could be influenced by psychological, social and cross cultural factors
(Barnes, et al., 2007 cited in Brandtzæg, 2010).
9In the realm of social media metrics, different typologies of users have been identified in the
literature. For example, Mendeley users have been studied based on the information provided
by themselves on Mendeley (e.g. self-classified as students, researchers, professors, etc.)
(Haustein & Larivière, 2014; Zahedi, Costas, & Wouters, 2014a; Mohammadi & Thelwall,
2015). Tweeters have also been categorized as influencers/brokers, discussers/orators,
disseminators/bumblers, and broadcasters based on the combination of the number of followers
and their engagement with the publications (Haustein, Bowman, & Costas, 2015; Haustein &
Costas, 2015). Altmetric.com alos categorizes tweeters as researchers, science communicators,
practitioners, and general public, based on the tweeters’ descriptions. Other efforts have
focused on the study of scholars active on Twitter (Costas, van Honk, & Franssen, 2017; Ke,
Ahn, & Sugimoto, 2016).
• Typologies of social media interactions
How social media users interact with the scholarly objects can provide valuable information to
characterize the indicators based on them. boyd & Ellison (2007) argued that although social
media tools have some common features (such as creating a profile for making connections),
they differ in terms of the way users interact with the platform. For example, bridging and
bonding refers to different forms of ties established among different users in social media
(Putnam, 2000 cited in Hofer & Aubert, 2013), based on the following/followees model in
Twitter (Kaigo, 2012). Thus, according to Hofer and Aubert (2013) the use of Twitter is mostly
influenced by bridging ties (i.e., following users from different networks with the aim of
broadening the information flow) rather than bonding (i.e. following like-minded people for
gaining emotional support). This form of followers/followee interactions are also very central
in several science-focused altmetric platforms for example ResearchGate or Mendeley.
Moreover, Robinson-Garcia, Leeuwen, & Ràfols (2017) have proposed the analysis of the
relationship of follower/followees on Twitter as a means to identify potential traces of societal
interactions. Another example includes the analysis of interactions via other social media
platforms (e.g. like Facebook) between students and their instructors (Hank, et al., 2014). More
focused on the context of social media metrics, Haustein et al. (2015) established three main
categories of engagement (or interactions) between the users and the scholarly objects: access
(related to viewing, downloading, and saving), appraise (mentioning, rating, discussing,
commenting, or reviewing) and apply (using, adapting, or modifying) of the scholarly objects.
Typologies of blog posts have been discussed based on the content and motivations of the
bloggers (e.g. discussions, criticisms, advice, controversy, trigger, etc.) (Shema, Bar-Ilan, &
Thelwall, 2015).
104. Conceptualizing the uses of social media metrics for research evaluation and
management
In order to discuss potential uses of social media metrics we need to understand the reliability
and validity of social media indicators for evaluative purposes. Sub-section 4.1. discusses the
criteria that social media indicators should meet in order to be considered as valid indicators.
Sub-section 4.2 explains to what extent indicators should be homogenous in its composition
(Gingras 2014) . Finally, the dependencies of social media metrics on external data providers
and the technical quality of the data are discussed in sub-section 4.3.
4.1. Validity and reliability of social media metrics
In the discussion around the possibilities of altmetrics as new sources of indicators for research
evaluation Wouters & Costas (2012) suggested that altmetrics “need to adhere to a far stricter
protocol of data quality and indicator reliability and validity”. According to Gingras (2014)
indicators should meet three essential criteria to be valid: adequacy, sensitivity and
homogeneity. The concept of validity relates to an indicator's success at measuring what is
expected to be measured (Rice, et al., 1989). The notion of adequacy indicates how the indicator
captures the reality behind the concept intended to be measured. In a similar line, as suggested
by Nederhof (1988) regarding bibliometric indicators, the main question is to what extent social
media indicators are valid as measures of research performance. In scientometrics, citations
have been assumed to be imperfect proxies of intellectual influence or scientific impact. This
imperfection is derived from the fact that quite often this is not the case, citations may be
perfunctory, and the choice of citations involves a substantial degree of arbitrariness by the
authors, thus deviating from the idea of citations as measures of intellectual influence
(Bornmann & Daniel, 2008; MacRoberts & MacRoberts, 1989, 2017; Nicolaisen, 2007).
In the case of social media metrics this issue is more complicated, as it is not clear to what
extent these indicators are even remotely related to the concept of scientific impact. On the one
hand, indicators such as Mendeley readers or F1000Prime recommendations have a closer
relationship with scientific impact as they have a strong scholarly focus. Indicators derived from
platforms such as ResearchGate or Academia.edu can also be expected to have a closer
conceptual link to the traditional concepts of scholarly impact and performance. However, the
lack of studies based on these platforms makes any consideration of them only tentative. On the
other hand, social media indicators derived from Twitter, Facebook, etc. are more difficult to
relate to the concepts of scientific impact and scholarly activities. Usually these indicators are
considered to measure types of interactions that are not (directly) related to research
performance.
The second criteria pointed out by Gingras (2014) is sensitivity or inertia, understood as the
resistance to change of indicators. According to this idea, a good indicator should vary “in a
manner consistent with the inertia of the object being measured”. In the case of traditional
bibliometric indicators they usually have a slow inertia. They don’t usually suffer from sudden
and drastic changes, and although there are sources that may distort some of the indicators, most
of them respond to an inertia that seems to align with the common perceptions on how scientific
impact or performance also changes. Mendeley readership and F1000Prime recommendations
have a similar inertia as citations (Maflahi & Thelwall, 2016; Thelwall, 2017; Zahedi, Costas,
11& Wouters, 2017). However, the sensitivity and inertia of social media metrics can be
challenged by three main issues:
Speed. Traditionally considered one of the most important advantages of social media metrics,
as they tend to happen faster than citations, their speed is also one of their most important
limitations (Wouters & Costas, 2012). For example, indicators based on social media platforms
like Twitter can drastically change in a matter of hours by controversies triggered by the
publications, mistakes in the papers, or even jokes.
Superficiality. The faster nature of most social media metrics may indicate a lower engagement
of the users with the scholarly objects, which may be related to a higher level of superficiality
in the appraisal of the objects. For example, many Twitter users may massively (and suddenly)
(re)tweet a publication without any intellectual engagement with it.
Small changes. The fact that many of these indicators usually present low values (e.g. see
Haustein, Costas, & Larivière, 2015). Small changes in the values of the indicators could have
large effects. For example, a small increase in the number of (re)tweets, or a few additional
mentions in blogs, may cause substantial changes in the indicators (e.g. drastically increasing
their percentile value). Due to the strong skewness of most social media indicators (Costas,
Haustein, Zahedi, & Larivière, 2016), for most publications, just a few additional scores would
propel a publication from a lower percentile to a higher percentile. For example, the paper
https://www.altmetric.com/details/891951#score was tweeted by just 2 tweeters on the 15th
December 2017, which already classifyed the paper in the 54th percentile according to
Altmetric.com; while the paper https://www.altmetric.com/details/3793570#score was
mentioned by four tweeters (i.e. just two additional tweeters) and was already classified in the
top 25th percentile (also by 15th December 2017). These examples illustrate the strong sensitivity
to small changes of these indicators, somehow also illustrating the ease with which they can be
manipulated (Thelwall & Kousha, 2015; Wouters & Costas, 2012).
Reliability. The sensitivity notion described by Gingras (2014) can also be related to the
reliability of indicators. Reliability is the extent to which an indicator yields the same result in
repeated measurements. In the case of bibliometrics, the citation process is considered to be
stochastic (Nederhof, 1988). Papers of equal impact do not necessarily receive identical number
of citations since multiple random factors come into play (e.g., biases of the citers, publication
and citation delays, coverage issues, etc.). Social media metrics are generally less reliable due
to the stronger dependence on the consistency and accuracy of the methodologies of the data
collection (Zahedi, Fenner, & Costas, 2014), and the low coverage of publications by social
media sources (Costas, Zahedi, & Wouters, 2015a; Haustein, Costas, & Larivière, 2015).
4.2. Homogeneity (or heterogeneity) of altmetric indicators
This idea of homogeneity is especially important with respect to composite indicators that
combine different measurements into a single number, thus “transforming a multidimensional
space into a zero-dimension point”, although composite indicators are still possible when
important mathematical and conceptual limitations are met (see for example Nardo et al., 2005).
Research has shown the large heterogeneity of social media metrics (Haustein, 2016; Haustein
et al., 2016; Wouters & Costas, 2012) and the variety of relationships among them (Haustein,
Costas, et al., 2015). In general, citations and Mendeley readerships are the most closely related
indicators (Li & Thelwall, 2012; Zahedi, Costas, & Wouters, 2014b). Similarly, F1000Prime
12reviews are conceptually similar to peer review indicators (Haunschild & Bornmann, 2015;
Waltman & Costas, 2014). However, indicators based on Twitter, blogs or news media are both
conceptually and empirically different from citations (Costas et al., 2015a; Thelwall, et al.,
2013) and also differ among themselves. These indicators capture different types of impacts.
Therefore constructing composite indicators and mixing these indicators for research evaluation
should be discouraged. Keeping the different altmetric scores as separate entities is the best
choice for transparent approaches in assessments. Examples of altmetric composite indicators
include the Altmetric Attention Score or the RG score, which lump together fundamentally
different metrics (e.g. Twitter, blogs, views, etc.) (Haustein et al., 2016). Although the
calculation formula of Altmetric Attention Score is disclosed (which is not in the case of the
RG scores which has remained a black box), the validity and application of this composite
indicator for evaluative purposes is unclear.
In addition, we would like to call attention to the problem of internal homogeneity of many
social media indicators within the same indicator. Perhaps the clearest example is the inclusion
of tweets and re-tweets in the same indicator. Although both tweets and re-tweets come from
the same platform, they arguably have a different role and should therefore be valued differently
(Holmberg, 2014). Other examples include: the count of all Mendeley readership in the same
indicator, combining academic users (e.g. Professors, PhDs, etc.) with non-academic ones (e.g.
Librarians, professionals, students, etc.), or the aggregation of Facebook shares, likes and
comments in one single indicator (Haustein, 2016). Lack of internal homogeneity may have
dramatic effects on the comparison of metrics from different data aggregators (Zahedi, Fenner,
& Costas, 2014). Therefore, transparency on how the data providers handle and calculate the
indicators is fundamental for being able to judge the validity and replicability of social media
metrics (Haustein, 2016).
4.3. Data issues and dependencies of social media metrics
As pointed out by Haustein (2016), an important fundamental issue that any application based
on social media metrics needs to consider is the direct dependency on altmetric data
aggregators, which themselves are also dependent on other major social media data providers
(e.g. Twitter, Facebook, etc.). Thus, any application of social media metrics is potentially
limited by the decisions, strategies and changes of any of these actors (Sugimoto, Work,
Larivière, & Haustein, 2017). As a result, variations in their policies may imply the
disappearance of a data source (e.g. in the recent years of existence of Altmetric.com, sources
such as Sina Weibo or LinkedIn have stopped being covered and the online reference manager
Connotea has been discontinued (Haustein, 2016), the restriction of a type of analysis (e.g.
current data restrictions of dates in Mendeley impedes readership trend analysis) or the
complete modification of the concept of impact or activity being measured (e.g. the conflating
of posts, shares and likes from Facebook in one single indicator may confound the meaning of
the indicator). Regarding data quality issues, a critical limitation is the dependence on unique
identifiers of scientific publications (e.g. DOI, PMID, etc.). Publications without any of these
identifiers are excluded from the tracking algorithms of altmetric data aggregators. Mentions of
scientific publications also need to include a direct link to the scientific publication. Mentions
of publications using just their titles or other textual characteristics of the publication, as well
13as links to versions of the publication not covered by the altmetric data aggregators, will be
ignored.
5. Conceptualizing applications of social media metrics for research evaluation and
management
In this section we conceptualize some applications of social media metrics. Although most of
our examples are taken from actual practices, the aim is to provide a perspective that could
transcend current tools and databases. Thus, regardless of the future availability of the current
tools, we consider that most conclusions would remain relevant, should similar (or variations)
of the current tools still be in place and accessible.
In order to provide a comprehensive conceptualization of applications of social media metrics,
we need to discuss the main types of possible applications. In the field of bibliometrics, a
differentiation has been made between descriptive bibliometrics and evaluative bibliometrics
(Mallig, 2010; Narin, 1976; van Leeuwen, 2004). According to Van Leeuwen (2004),
descriptive bibliometrics is related to top-down approaches able to provide the big picture. This
more descriptive idea of bibliometrics is also related to the contextual perspectives recently
proposed in scientometrics (Waltman & Van Eck, 2016). We speak of evaluative bibliometrics
if bibliometrics is used to assess the research performance of a unit of analysis (i.e. research
teams, research organizations, etc.), often in a comparative framework. For example, different
units can be compared in terms of citations or publications, or a unit can be compared with a
specific benchmark (e.g. the average citation impact in the field(s), as done for field-normalized
indicators). The problem with the descriptive/evaluative dichotomy is that it is not always
possible to distinguish the two approaches clearly. In practical terms, any bibliometric
description can become an evaluative instrument. For example, the mere reporting of the
number of publications of a university department may turn into an evaluative indicator if
compared to other departments (or a benchmark) and used, for example, to allocate resources.
Therefore, we propose to make the distinction between descriptive and comparative
approaches. As descriptive approaches we consider those approaches that focus on the analysis
and description of the activities, production and reception of scholarly objects for different units
of analysis, together with the analysis of the dynamics and interactions among different actors
and objects. As comparative approaches we consider those approaches that are (mainly) focused
on the comparison of outputs, impacts, and actors, often in the context of evaluation. Simply
put, descriptive approaches are related to questions of who, when, how, and what, while
comparative approaches are concerned with questions of fast(er)/slow(er), high(er)/low(er),
strong(er)/weak(er) or just better/worse. Of course, comparative approaches are by definition
based on some form of descriptive input data. Both descriptive and comparative approches can
be used as tools in research evaluation, but they can also be used for other purposes (e.g.
knowledge discovery).
Social media metrics have usually been discussed in the light of their potential role as
replacements of citations for comparative and evaluative purposes (Priem, et al., 2010).
However, less research has been carried out in order to determine the potential value of social
media metrics from a more descriptive perspective. In Table 1 we summarize a general
framework of potential applications of social media metrics based on the
descriptive/comparative dichotomy.
14Table 1. Conceptualization of descriptive and comparative social media metric
approaches
Descriptive social media metrics Comparative social media metrics
- Descriptive social media indicators (non- - Normalized indicators, e.g.,
normalized), e.g., o Mendeley field-normalized indicators
o Total counts, coverage. o Percentile-based indicators (e.g. Altmetric
o Trend analyses. Attention Score).
- Social media metric landscapes. - Social media-based factors (e.g. Twimpact factor, T-
o Thematic landscapes. factor).
o Geographic landscapes. - Composite social media indicators (e.g. RG score,
- Network approaches: e.g., communities of Altmetric Attention Score).
attention, Twitter coupling, hashtag coupling, - Comparative network indicators (e.g. relative centrality).
etc.
5.1. Descriptive social media metrics
In Table 1 descriptive approaches use basic analytical indicators, like total counts summaries,
trend analysis, thematic landscapes, as well as network approaches of the dynamics and
interactions between different social media agents and scientific outputs. Similar to bibliometric
indicators, it is possible to calculate descriptive indicators with the objective of identifying
general patterns in the social media reception of scientific publications of a given unit. In Table
2 we present an example: basic descriptive indicators for three major datasets, publications
covered in the Web of Science (WoS) in the period 2012-2014 and with a DOI or a PMID from
Africa, the European Union (EU28) and the United States of America (USA).
15Table 2. Example of basic descriptive altmetric indicators for Web of Science publications (with a DOI or
PMID) from Africa, EU28 and USA (2012-2014)
1) Output
P
Unit P (doi/pmid)
Africa 125,764 104,008
EU28 1,605,393 1,305,391
USA 1,686,014 1,281,624
2) Total counts
Unit TTS TBS TNS TPDS TWS
Africa 190,737 6,126 11,291 886 2,154
EU28 2,034,833 67,262 118,568 4153 23,126
USA 3,461,227 136,682 263,517 4964 32,647
3) Averages
Unit MTS MBS MNS MPDS MWS
Africa 1.83 0.06 0.11 0.01 0.02
EU28 1.56 0.05 0.09 0.00 0.02
USA 2.70 0.11 0.21 0.00 0.03
4) Coverage
Unit PP(t1) PP(b1) PP(n1) PP(pd1) PP(w1)
Africa 27.0% 2.7% 2.1% 0.6% 1.2%
EU28 28.5% 2.7% 2.3% 0.2% 1.2%
USA 37.4% 5.1% 4.5% 0.3% 1.8%
(P: total publications of the unit; P(doi/pmid): n. of publications with a DOI or a Pubmed id; TTS: total Twitter
mention score; TBS: total blog citation score; TNS: total news media mentions score; TPDS: total policy
document citation score; TWS: total Wikipedia citation score; MTS: mean Twitter mentions score; MBS: mean
blogs citation score; MNS: mean news media mentions score, MPDS: mean policy documents citation score;
MWS: mean Wikipedia citation score; PP(t1): proportion of publications with at least one tweet mention;
PP(b1): proportion of publications with at least one blog citation; PP(n1): proportion of publications with at
least one news media mention; PP(pd1): proportion of publications with at least one policy document citation;
PP(w1): proportion of publications with at least one Wikipedia citation)
16We would like to emphasize that certain elements need to be taken into account when reporting
social media metrics. It is important to disclose the total output analyzed (indicator P in table
2) . In our case, as we have worked with data collected from Altmetric.com (until June 2016),
only publications with a DOI or a PMID have been tracked in this source. Thus, the dataset is
reduced to only publications with an identifier traceable by this data provider (indicator
P(doi/pmid) in Table 2).
In the second section of the table, we explore the total social media counts that are obtained for
each of the sets of publications. Thus, TTS counts all the Twitter mentions (in this case
combining both original tweets and re-tweets) to the publications. TBS is the total blog citation
score, TNS is the total news media mentions score, TPDS is total policy documents citation
score and TWS is the total Wikipedia citation score. There are other indicators that could have
been also calculated based on Altmetric.com, like those based on Facebook, Google Plus or
F1000Prime. For the discussion of some other social media metrics we refer here to Costas et
al. (2015b).
In the third part of the table, we calculate the averages of the different scores per publication.
Simply put, each of the total scores is divided by the number of publications that could be
tracked (P(doi/pmid)). Thus, we can talk about the mean Twitter score (MTS), mean Blog
score (MBS), etc. Obviously, the mean is not necessarily the only statistic we could have
calculated, other descriptive statistics could have been obtained such as the median, the mode,
min-max values, etc.
Finally, in the fourth section of the table, we present another possibility of basic social media
metrics. Given the strong skewness of most altmetric indicators (Costas, et al., 2016) as well as
their sparsity (Thelwall, 2016), mean values can be strongly influenced by outliers (e.g.,
extremely tweeted publications), an issue that is not uncommon among this type of indicators
(Costas et al., 2015a). In addition to the use of medians or percentile based indicators that could
help to reduce the problem, indicators of the coverage of the publications with a given degree
of metrics can be provided. In Table 2 we give the proportion of publications that have at least
one mention in each of the metrics (i.e. one tweet, one blog citation, etc.). Thus, we can see
how about 27% of African publications (with a DOI/PMID) have been tweeted at least once,
while 5.1% of all USA publications (with a DOI/PMID) have been cited at least once in blogs.
The use of the at least one mention option (that is represented by the value 1) coincides with
the absolute coverage of publications in each of the social media sources. However, this value
of 1 could have been easily changed by any other value (e.g. 2, 3, a particular percentile, the
number of only original tweets [i.e. excluding retweets], etc.). Moreover, coverage indicators
can also be subject of normalization (e.g. the Equalized Mean-based Normalised Proportion
Cited (EMNPC) indicator suggested by (Thelwall, 2016)), however such more complex
indicators introduce a more comparative nature, in which the coverage of units is compared to
a global reference.
Trend altmetric indicators
In addition to the basic indicators discussed above, it is possible to provide trend analysis
(Figure 2), giving social media time series data with properties different from bibliometric
indicators. However, data collected by most of the altmetric data aggregators is very recent, and
the application of trend analysis is therefore relatively limited. Moreover, uncertainties
17regarding methodological changes in the social media data collection should call for caution in
the interpretation of trend analysis. For example, trend analyses may be influeced by
improvements in the algorithms for the identification of mentions of scientific publications by
the altmetric data aggregators, thus not reflecting genuine trends in the indicators themselves.
Figure 2. Number and share of publications from Web of Science (DOI) with coverage in Altmetric.com –
1980-2013 (source: (Costas et al., 2015a)). Altmetric.com started their data collection in July 2011.
Although Mendeley data are conceptually close, albeit not identical, to citations, their time
series properties are very different (Maflahi & Thelwall, 2016; Thelwall, 2017; Zahedi et al.,
2017). This can be seen in Figure 3 below. In contrast to citations, that generally are always
higher (and never decrease) as time goes by, Mendeley readership values can decrease as
Mendeley users can delete publications from their libraries or fully erase their Mendeley
profiles.
18Figure 3. Distributions of Mean Readership Score (MRS) and Mean Citation Score (MCS) indicators for
the WoS publications overtime (x axis shows the publication years and y axis shows the mean scores of
citation and readership). (Source: Zahedi, Costas, & Wouters, 2017)
Longitudinal analysis – social media histories
Similar to citation analysis, in which it is possible to longitudinally study the impact of scientific
publications over time (in the so-called citation histories; Colavizza & Franceschet, 2016),
social media or reception histories are possible. Examples are the analysis of the accumulation
of Mendeley readership, blog citations or tweets over time for any set of publications. The time
stamps of the tracked events are usually highly accurate (e.g., the exact time a tweet has been
sent, or when someone has saved a document in her Mendeley library), thus enabling
longitudinal trend analysis. However, the following problems challenge the development of
longitudinal analysis of social media metrics:
- The lack of openly available diachronic information. In the case of Mendeley, the concrete
information on when the readership have been produced is not available through their public
API. This impedes the calculation of longitudinal readership analysis, as well as the
potential determination of readership windows (e.g. variable or fixed windows could also
be established similar to citation windows (Waltman & van Eck, 2015)). This lack of
diachronic information about Mendeley readership hinders the development of studies on
the potential predictive power of early Mendeley readership for later citations. A possible
solution is the repeated tracking of readership counts for publications over time, as done for
example in (Maflahi & Thelwall, 2017; Thelwall, 2017).
- Indetermination of the publication time of scientific outputs. Although in bibliometrics the
use of the publication year of scientific outputs is the most common approach to determine
the starting moment of a publication, there are important inconsistencies in the publication
dates of scientific articles (Haustein, Bowman, & Costas, 2015c). These inconsistencies are
caused by the gaps between the actual moment a publication becomes accessible to the
public (e.g. through the online first option of many publishers, or through its publication in
a repository) and the official publication in a scientific venue (e.g. a journal, conference,
book, etc.). These inconsistencies are even more challenging when working with social
media metrics. Given that social media interactions usually happen earlier and faster than
19You can also read