Environmental Indicators - Methods for the Mackay-Whitsunday 2016 Report Card
←
→
Page content transcription
If your browser does not render page correctly, please read the page content below
Methods for the Mackay-
Whitsunday 2016 Report
         Card

Environmental Indicators
                     Final Report

     Regional Report Cards Technical Working Group
                    September 2017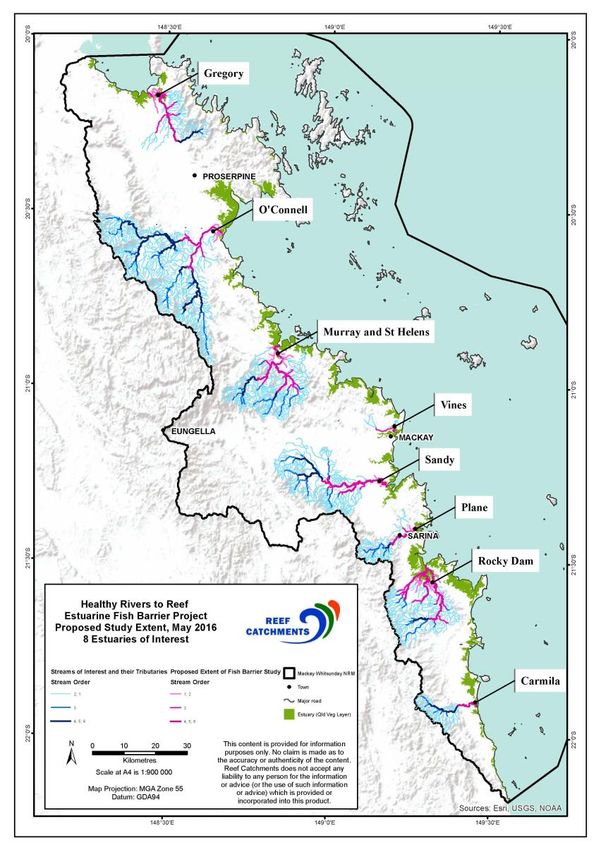
Table of Contents
Terms and Acronyms .............................................................................................................................. 5
1.     Introduction .................................................................................................................................... 9
1.1. Purpose of this Document .............................................................................................................. 9
1.2. General............................................................................................................................................ 9
1.3. Terminology .................................................................................................................................. 10
2.     Selection of Indicators .................................................................................................................. 10
3.     Freshwater Basins ......................................................................................................................... 12
3.1. Water Quality ................................................................................................................................ 12
3.1.1.         Indicator selection ................................................................................................................ 12
3.1.1.1. Sediment ............................................................................................................................... 12
3.1.1.2. Nutrients ............................................................................................................................... 13
3.1.1.3. Pesticides .............................................................................................................................. 13
3.1.2.         Data collection ...................................................................................................................... 14
3.2. Habitat and Hydrology Indicators ................................................................................................. 15
3.2.1.         Indicator selection ................................................................................................................ 15
3.2.1.1. In-stream Habitat Modification ............................................................................................ 15
3.2.1.2. Flow ....................................................................................................................................... 17
3.2.1.3. Riparian Extent ...................................................................................................................... 18
3.2.1.4. Wetland Extent ..................................................................................................................... 18
3.2.2.         Data collection ...................................................................................................................... 18
3.2.2.1. Habitat Modification/Instream Habitat ................................................................................ 18
3.2.2.2. Flow ....................................................................................................................................... 21
3.2.2.3. Riparian Extent ...................................................................................................................... 21
3.2.2.4. Wetland Extent ..................................................................................................................... 21
3.3. Fish …………………………………………………………………………………………………………………………………………21
3.3.1.         Indicator selection ................................................................................................................ 21
3.3.2.         Data collection ...................................................................................................................... 22
4.     Estuaries ........................................................................................................................................ 23
4.1. Water quality ................................................................................................................................ 23
4.1.1.         Indicator selection ................................................................................................................ 23
4.1.1.1. Physical-Chemical.................................................................................................................. 23

Methods for the Mackay-Whitsunday 2016 report card                                                                                          Page 2 of 94
4.1.1.2. Nutrients ............................................................................................................................... 24
4.1.1.3. Chlorophyll-a......................................................................................................................... 24
4.1.1.4. Pesticides .............................................................................................................................. 24
4.1.2.        Data collection ...................................................................................................................... 25
4.2. Habitat and Hydrology .................................................................................................................. 26
4.2.1.        Indicator selection ................................................................................................................ 26
4.2.1.1. Riparian Extent ...................................................................................................................... 26
4.2.1.2. Mangrove/Saltmarsh Extent ................................................................................................. 26
4.2.1.3. Flow ....................................................................................................................................... 26
4.2.1.4. Fish Barriers .......................................................................................................................... 26
4.2.2.        Data collection ...................................................................................................................... 27
4.2.2.1. Riparian Extent ...................................................................................................................... 27
4.2.2.2. Mangrove/Saltmarsh Extent ................................................................................................. 27
4.2.2.3. Flow ....................................................................................................................................... 28
4.2.2.4. Fish Barriers .......................................................................................................................... 28
4.3. Fish …………………………………………………………………………………………………………………………………………30
4.3.1.        Indicator selection ................................................................................................................ 30
5.     Inshore and Offshore Marine Environments ................................................................................ 31
5.1. Water Quality ................................................................................................................................ 31
5.1.1.        Indicator selection ................................................................................................................ 31
5.1.1.1. Inshore Marine Environment ................................................................................................ 31
5.1.1.2. Offshore Marine Environment .............................................................................................. 31
5.1.2.        Data collection ...................................................................................................................... 32
5.1.2.1. Inshore Water Quality ........................................................................................................... 32
5.1.2.2. Offshore Water Quality Data Collection ............................................................................... 34
5.2. Coral Indicators ............................................................................................................................. 34
5.2.1.        Indicator selection ................................................................................................................ 34
5.2.2.        Data Collection ...................................................................................................................... 36
5.2.2.1. Sampling programs and survey methods ............................................................................. 36
5.3. Seagrass Indicators ....................................................................................................................... 39
5.3.1.        Indicator selection ................................................................................................................ 39
5.3.2.        Data Collection ...................................................................................................................... 39

Methods for the Mackay-Whitsunday 2016 report card                                                                                      Page 3 of 94

5.3.2.1. Marine Monitoring Program ................................................................................................. 39
5.3.2.2. Queensland Ports Seagrass Monitoring Program ................................................................. 40
5.4. Fish Indicators ............................................................................................................................... 41
6.     Development of Condition Assessments Scoring Methods .......................................................... 43
6.1. Freshwater Basins and Estuaries .................................................................................................. 44
6.1.1.        Water quality ........................................................................................................................ 44
6.1.1.1. Nutrients, sediments and phys-chem ................................................................................... 44
6.1.1.2. Pesticides .............................................................................................................................. 49
6.1.2.        Habitat and Hydrology .......................................................................................................... 49
6.1.2.1. Habitat Modification/Instream Habitat modification (Freshwater Basins) .......................... 49
6.1.2.2. Fish Barriers (Estuaries) ........................................................................................................ 51
6.1.2.3. Riparian, wetland and mangrove/saltmarsh extent (freshwater basins and estuaries) ...... 51
6.1.3.        Fish ........................................................................................................................................ 52
6.2. Inshore and Offshore Condition Assessment ............................................................................... 53
6.2.1.        Inshore Water Quality ........................................................................................................... 53
6.2.1.1. Nutrients, chlorophyll-a and water clarity ............................................................................ 53
6.2.1.2. Pesticides .............................................................................................................................. 57
6.2.2.        Offshore Water Quality ......................................................................................................... 59
6.2.3.        Coral ...................................................................................................................................... 60
6.2.4.        Inshore Seagrass ................................................................................................................... 63
6.2.4.1. Marine Monitoring Program ................................................................................................. 63
6.2.4.2. Queensland Ports Seagrass Monitoring Program ................................................................. 63
6.2.4.3. Combined display approach for MMP and QPSMP seagrass indicators ............................... 64
7.     Development of progress to targets scoring methods ................................................................. 65
7.1. Calculating progress to targets ..................................................................................................... 65
8.     Confidence, limitations, and recommendations........................................................................... 66
8.1. Confidence associated with results .............................................................................................. 66
8.1.1.        Methods ................................................................................................................................ 66
8.1.2.        Scoring................................................................................................................................... 68
8.1.2.1. Scoring confidence criteria in the Mackay-Whitsundays report card .................................. 68
8.1.2.2. Final confidence scores for presentation in the Mackay-Whitsundays report card............. 69
8.2. Limitations and recommendations ............................................................................................... 71

Methods for the Mackay-Whitsunday 2016 report card                                                                                            Page 4 of 94
References ............................................................................................................................................ 72
Appendix …………………………………………………………………………………………………………………………………………77

Terms and Acronyms
Adopted middle thread                     The distance in kilometres, measured along the middle of a
distance                                  watercourse, that a specific point (in the watercourse) is from the
                                          watercourse’s mouth

AIMS                                      Australian Institute of Marine Science

AM                                       AM is annual median or mean of measured indicator

Basin                                     An area of land where surface water runs into smaller channels, creeks
                                          or rivers and discharges into a common point and may include many
                                          sub-basins or sub-catchments. Also known as river basin or catchment

Biodiversity                              The variability among living organisms from all sources (including
                                          terrestrial, marine and other aquatic ecosystems and the ecological
                                          complexes of which they are part). It includes diversity within species
                                          and between species, and diversity of ecosystems

Chl-a                                     Chlorophyll-a: A measure of overall phytoplankton biomass. It is
                                          widely considered a useful proxy to measure nutrient availability and
                                          the productivity of a system

Climate                                   In the context of the pilot report card, climate refers to both climate
                                          variability and climate change

DDL                                       Declared Downstream Limit

DIN                                       Dissolved Inorganic Nitrogen

DNRM                                      Department of Natural Resources and Mines

DO                                        Dissolved Oxygen

DPSIR                                     Driver, Pressure, State, Impact, Response

Driver                                    An overarching cause of change in the environment

DSITI                                     Department of Science Information Technology and Innovation
                                          Queensland

Ecosystem                                 A dynamic complex of plant, animal and microorganism communities
                                          and their non-living environment interacting as a functional unit

EC                                        An enclosed coastal (EC) water body includes shallow, enclosed waters
                                          near an estuary mouth and extends seaward towards deeper, more
                                          oceanic waters further out. The seaward cut-off is defined by GBRMPA

Methods for the Mackay-Whitsunday 2016 report card                                                                                        Page 5 of 94
(2010).
Fish (as a fauna Fish community health is assessed and included in the ecosystem
indicator) health assessments (coasters). Inclusion in the report card will
contributes to an assessment of the health of local fish communities
Fish Barriers (as an Fish barriers relate to any barriers which prevent or delay connectivity
indicator) between key habitats which has the potential to impact migratory fish
populations, decrease the diversity of freshwater fish communities
and reduce the condition of aquatic ecosystems (Moore, 2015a)
Flow (as an indicator) Flow relates to the degree that the natural river flows have been
modified in the Region’s waterways. This is an important indicator due
to its relevance to ecosystem and waterway health
FRP Filterable Reactive Phosphorus
GBR Great Barrier Reef
GBRCLMP Great Barrier Reef Catchment Loads Monitoring Program
GBR report card Great Barrier Reef Report Card developed under the Reef Water
Quality Protection Plan (2013)
GBRMPA Great Barrier Reef Marine Park Authority
GV Guideline Values
HEV High ecological value: the management intent (level of protection) to
achieve an effectively unmodified condition.
Impoundment (also An indicator used in the ‘in-stream habitat modification’ indicator for
impoundment length) freshwater basins in the Region. This index reports on the proportion
(%) of the linear length of the main river channel inundated at the Full
Supply Level of artificial in-stream structures such as dams and weirs
Index Is generated by indicator categories (e.g. water quality made up of
nutrients, water clarity, chlorophyll-a and pesticides)
Indicator A measure of one component of an environmental dataset (e.g.
particulate nitrogen)
Indicator category Is generated by one or more indicators (e.g. nutrients made up of
particulate nitrogen and particulate phosphorus)
In-stream Habitat This basin indicator category is made up of two indicators; fish barriers
Modification (as an and impoundment length
indicator)
ISP Independent Science Panel established under the Reef Plan, who have
independently reviewed the methodologies involved in the report card
assessments
Methods for the Mackay-Whitsunday 2016 report card Page 6 of 94JCU James Cook University
LAT Lowest astronomical tide
LOR Limit of reporting
LTMP Long Term Monitoring Program
Macroalgae (cover) An indicator used in part to assess coral health. Macroalgae is a
collective term used for seaweed and other benthic (attached to the
bottom) marine algae that are generally visible to the naked eye.
Increased macroalgae on a coral reef is often undesirable, indicating
reef degradation (Diaz-Pulido and McCook, 2008)
MD The management intent (level of protection) to achieve a moderately
disturbed (MD) condition.
Mid-shelf (water body) Mid-shelf water bodies begin 15 km from the enclosed coastal
boundary and extend to 60 km in the Mackay-Whitsunday Region
(GBRMPA, 2010).
MMP Marine Monitoring Program: the Great Barrier Reef Marine Park
Authority’s Marine Monitoring Program, which provided water quality
data for the Central and Whitsunday reporting zones in the report card
ms-PAF Multiple Substances-Potentially Affected Fraction
NOx Oxidised Nitrogen
NQBP North Queensland Bulk Ports
Offshore (reporting Offshore is a reporting zone in the Mackay-Whitsunday report card
zone) that includes mid-shelf and offshore water bodies.
Offshore (water body) Offshore water bodies begin 60 km from the enclosed coastal
boundary and extend to 280 km in the Mackay-Whitsunday Region
(GBRMPA, 2010).
OC Open coastal (OC) water bodies are delineated by the seaward
boundary of enclosed coastal waters to a defined distance across the
continental shelf. For the Mackay-Whitsunday Region, open coastal
waters extend from enclosed coastal waters to 15 km (GBRMPA,
2010).
Overall Score The overall scores for each reporting zone used in the report card are
generated by an index or an aggregation of indices
Pesticides (as an The PSII herbicides (Ametryn, Atrazine, Diuron, Hexazinone,
indicator) Tebuthiuron, Bromacil, Fluometuron, Metribuzin, Prometryn,
Propazine, Simazine, Terbuthylazine, Terbutryn) are included in
pesticides reporting. Up to 28 pesticides with different modes of
action will progressively be included in subsequent Mackay-
Methods for the Mackay-Whitsunday 2016 report card Page 7 of 94Whitsunday report cards.
Phys-chem The physical-chemical indicator category that includes two indicators:
dissolved oxygen (DO) and turbidity
PN Particulate Nitrogen
PONSE Proportion of Native (fish) Species Expected
Ports NQBP port authority
PP Particulate Phosphorus
PSII herbicides Photosystem II inhibiting herbicides (Ametryn, Atrazine, Diuron,
Hexazinone, Tebuthiuron, Bromacil, Fluometuron, Metribuzin,
Prometryn, Propazine, Simazine, Terbuthylazine, Terbutryn)
PSII-HEq Photosystem II herbicide equivalent concentrations, derived using
relative potency factors for each individual PSII herbicide with respect
to a reference PSII herbicide, diuron (Gallen et al. 2014)
QPSMP Queensland Ports Seagrass Monitoring Program
RE Regional Ecosystem
RIMMReP Reef 2050 Integrated Monitoring, Modelling and Reporting Program
Riparian Extent (as an An indicator used in the assessments of both basin and estuarine
indicator) zones in report card released to date. This indicator uses mapping
resources to determine the extent of the vegetated interface between
land and waterways in the Region
RPF Relative potency factors
SD The management intent (level of protection) to achieve a slightly
disturbed (SD) condition.
Secchi Secchi depth (m) – measure of water clarity
SF Scaling factor
SMART Specific, measurable, achievable, relevant, time-bound
SMD The management intent (level of protection) to achieve a slightly to
moderately disturbed (SD) condition.
TSS Total Suspended Solids
Methods for the Mackay-Whitsunday 2016 report card Page 8 of 941. Introduction
1.1. Purpose of this Document
The purpose of this document is to provide detailed information on the methods used to produce
the 2016 report card. This includes condition assessments of the environmental indicators in
freshwater basins, estuaries, inshore and offshore marine environments. Specifically, this document
describes:
The indicator selection process;
The data collection methods; and
The scoring methods.
Methods used to assess stewardship, social and economic context and cultural heritage associated
with the Region’s waterways for the previous (2015) report card can be found in the Development of
Methods for the Mackay-Whitsunday report card 2015: Stewardship and Cultural Heritage reporting
document1.
1.2. General
The Mackay-Whitsunday Healthy Rivers to Reef Partnership (Partnership) was established in October
2014. The primary focus of the Partnership was to produce an annual report card on the health of
the Region’s waterways.
The report card includes assessments of the freshwater environment, the estuarine environment
and the marine environment (to the eastern boundary of the Great Barrier Reef Marine Park).
Different indicators are assessed to provide the overall scores for the environmental zones
throughout the Mackay-Whitsunday-Isaac Region (herein the ‘Region’). Social, cultural and
economic information relevant to waterways and the marine environment is also provided, along
with an assessment of stewardship in relation to waterways. Stewardship is reported for the
agricultural, tourism, ports, heavy industry, aquaculture and urban sectors of the Region.
Significant review was undertaken between the release of the 2014 pilot report card and the first full
2015 report card. Further refinement has occurred since the release of the 2015 report card and this
has been incorporated in the 2016 report card, which now includes analyses and scoring methods
that are more aligned with other report cards in the Great Barrier Reef region.
For more detail on the Mackay-Whitsunday report card and Partnership, refer to the ‘Program
Design for the Mackay-Whitsunday 2016 report card’ document2.
1
http://healthyriverstoreef.org.au/report-card/technical-reports/
2
http://healthyriverstoreef.org.au/report-card/program-design/
Methods for the Mackay-Whitsunday 2016 report card Page 9 of 941.3. Terminology
The report card assesses different indicators of ecosystem health to report on overall condition.
Scores for indicators are aggregated together depending on the aspect of the environment they are
assessing, such as water quality, coral or fish. The terminology used in this document for defining the
level of aggregation of indicators is as follows:
Overall score is generated by the aggregation of indices or by a single index score;
Index/indices (e.g. water quality) are generated by the aggregation of indicator categories;
Indicator categories (e.g. nutrients) are generated by one or more indicators; and
An indicator is measured (e.g. particulate nitrogen).
In the report card, overall scores and scores for indices are represented in the format of a coaster
(Figure 1). Presentation of the coasters can be with or without the outer ring (i.e. indicator
categories).
Figure 1. Terminology used for defining the level of aggregation of indicators and how they are displayed in coasters in
the report card.
2. Selection of Indicators
The sections below include an outline of the process and final outcomes of determining the most
appropriate indicators used for environmental assessments for the report card. The indicators
needed to be relevant to the Region and be directly linked to pressures occurring within the Region
(refer to the ‘Program Design for the Mackay-Whitsunday 2016 report card’ document3 and the
conceptual model specifically developed for the report card).
All potential indicators were shortlisted based on the following questions:
Is the indicator clearly linked to an objective of the report card?
Can the indicator easily be used to provide a report card score?
Do other programs and report cards use this indicator?
3
http://healthyriverstoreef.org.au/report-card/program-design/
Methods for the Mackay-Whitsunday 2016 report card Page 10 of 94Additionally, it was identified that indicators needed to be:
Indicative of what the Partnership is trying to protect (or a good ‘proxy’);
Sensitive to change;
SMART (specific, measurable, achievable, relevant, time-bound);
Of strong scientific and conceptual basis - i.e. indicators based on well-defined or validated
cause-and-effect chains linking human-related pressures to ecosystem response if possible;
Signals that can be measured in simple, cost-effective ways with available resources, and
analysed in a fashion that allows unambiguous interpretation;
Well-established, with links to specific management objectives and responsive to related
management actions; and
Easily communicated and understood by stakeholders and/or the target audience.
Methods for the Mackay-Whitsunday 2016 report card Page 11 of 943. Freshwater Basins
3.1. Water Quality
3.1.1. Indicator selection
Freshwater basin water quality indicators used in the report card are: Total suspended solids (TSS),
dissolved inorganic nitrogen (DIN), filterable reactive phosphorus (FRP) and pesticides reported as
multisubstance-Potentially Affected Fraction (ms-PAF).
The water quality indicators included in the report card for the freshwater basins were selected
through an analysis of the range of monitoring programs (historical, current, and planned) that
collect water quality data in the freshwater environment and consider the general requirements for
indicators that are outlined in Section 2 above and the ‘Program Design for the Mackay-Whitsunday
2016 report card’ document4.
The parameters for water quality were also chosen because of their linkages to land management
practices and their potential to impact on waterway and ecosystem health.
In addition to the selected indicators, other indicators were investigated, but these were not
considered the most relevant to specific regional freshwater issues, or the most representative
(examples listed below). Consideration was also given to the relevance of the sampling frequency to
the indicator (i.e. if the indicator was measured once a month in a grab sample, does that actually
provide useful information?). Some indicators were determined to be less useful for incorporating
into a report card, but instead would be useful to explain any anomalies or provide further detail on
results obtained. Finally, selected water quality indicators needed to have scheduled guideline
values available that are used in the assessment scoring.
The other considered indicators included:
Biochemical oxygen demand;
pH;
Dissolved oxygen (DO);
Salinity;
Temperature;
Metals; and
Chlorophyll-a (chl-a).
Rationale and explanation on the selected indicators for the freshwater basin water quality indicator
category are described below.
3.1.1.1. Sediment
Elevated sediments in waterways can impact ecosystem health by changing light availability and can
cause silting of benthic environments (DEHP 2009b). The indicator selected to represent sediment
4
http://healthyriverstoreef.org.au/report-card/program-design/
Methods for the Mackay-Whitsunday 2016 report card Page 12 of 94was TSS, which measures small particles (soil, plankton, organic debris) suspended in water. This indicator is a common representative of sediment levels in freshwater systems (DEHP 2009b), and is very strongly linked to land management practices. Turbidity was also investigated (it is used in the estuary assessments), but in the freshwater system the availability of data for turbidity was more limited than for TSS. The preferred indicator was therefore TSS, as a guideline value exists for TSS in freshwater systems and there is a volume of data on TSS as it is currently included in the monitoring program suite (without additional cost). 3.1.1.2. Nutrients The relationship between land use and nutrient export is widely acknowledged. Nutrients such as nitrogen and phosphorus are critical in shaping biodiversity in waterways, however agricultural, industrial and urban development has led to increased nutrient inputs, which can lead to eutrophication and algal blooms (Brodie & Mitchell, 2005). Nutrient indicators were shortlisted from a large suite of parameters that are associated with the major land uses within the Mackay- Whitsunday freshwater basins. The nutrient indicators for the freshwater basins in the report card included: DIN (ammonia + nitrite + nitrate); and FRP. DIN and FRP are both highly bioavailable and typically are found in low concentrations in natural waters but in high concentrations where pollution through fertilisers or sewage is present (Rohde et al. 2006). Furthermore, DIN is considered the highest risk to Great Barrier Reef (GBR) ecosystems (Schaffelke et al. 2017) and as such is an important component to monitor in freshwater systems that feed into the GBR. In order to avoid doubling up on speciation of nutrients, the number of report card indicators was restricted to the minimum that were representative of the issues and pressures in the Region for freshwater waterways. In addition to the general requirements for indicators that are outlined in Section 2 above, and the ‘Program Design for the Mackay-Whitsunday 2016 report card’ document5, nutrient indicators were selected based on: Availability of freshwater guideline values for nutrients; Maintaining consistency where appropriate across environmental zones; Relevance to the freshwater environment; Availability of data (current and likely in future); One measure of each nutrient species selected to avoid double counting; and Inorganic forms, as they are often more biologically available. 3.1.1.3. Pesticides Up to 56 pesticides with different modes of action are detected in the GBR. The 2016 report card will move from reporting on just five PSII herbicides (ametryn, atrazine, diuron, hexazinone and tebuthiuron) previously identified as the pesticides of greatest concern to the health and the 5 http://healthyriverstoreef.org.au/report-card/program-design/ Methods for the Mackay-Whitsunday 2016 report card Page 13 of 94
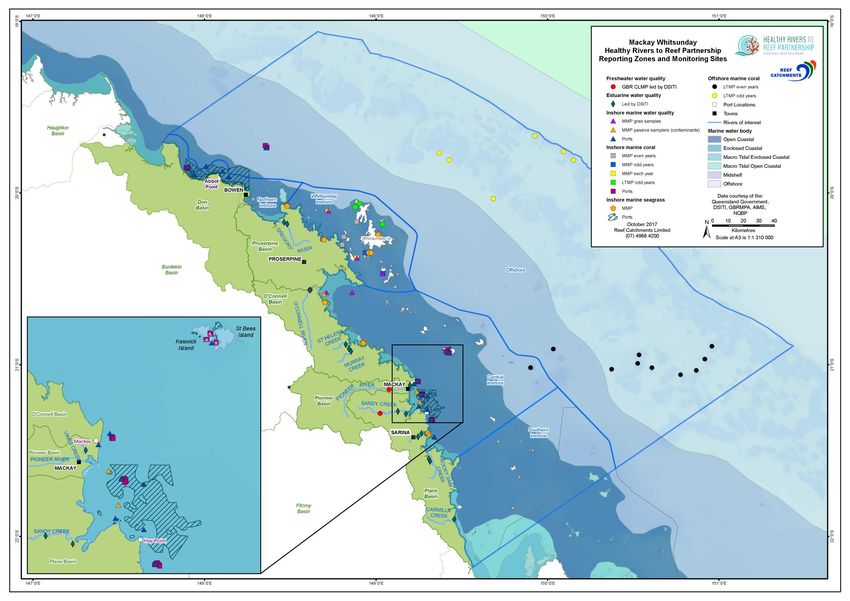
resilience of the Great Barrier Reef (DPC, 2013), to thirteen PSII herbicides detected in the GBR
(ametryn, atrazine, diuron, hexazinone, tebuthiuron, bromacil, fluometuron, metribuzin, prometryn,
propazine, simazine, terbuthylazine, terbutryn).

The report card uses the ms-PAF metric to report on pesticide risk. The ms-PAF method (Traas et al.
2002) estimates the impact (i.e. the percentage of species in an ecosystem likely to be affected) of
mixtures of pesticides with multiple modes of action. To date, only PSII herbicides have been
incorporated into the ms-PAF metric, however there are many other types of pesticides that are also
frequently detected in the Region’s catchments that need to be accounted for. Looking ahead, the
toxicity data required for the ms-PAF metric is expanding to include pesticides with other modes of
action, meaning that the range of pesticides included in the ms-PAF estimations will progressively
increase in future reporting. However, the ms-PAF estimate is limited to pesticides with guideline
values. Currently guideline values are available for 28 of the pesticides detected in the GBR.

Changes from 2015 report card

In the 2015 report card: The ms-PAF value for the pesticides score in freshwater basins and
estuaries was calculated using the five PSII herbicides (ametryn, atrazine, diuron, hexazinone and
tebuthiuron) identified as being of greatest concern to the health and the resilience of the Great
Barrier Reef (DPC, 2013).

2016 report card: This has moved to reporting on thirteen PSII herbicides detected in the GBR
(ametryn, atrazine, diuron, hexazinone, tebuthiuron, bromacil, fluometuron, metribuzin,
prometryn, propazine, simazine, terbuthylazine, terbutryn).
The impacts that incorporating 13 PSII herbicides into ms-PAF scores in the 2015 report card can be
seen in the Appendix.

 3.1.2. Data collection
The water quality data used in the Mackay-Whitsunday report card were collected through the DSITI
Great Barrier Reef Catchment Loads Monitoring Program (GBRCLMP). Sampling was conducted in
accordance with the Queensland Government’s Monitoring and Sampling Manual (DEHP 2009a).
Data were obtained through analysis of water samples collected by manual grab sampling and the
use of automatic samplers. Samples for sediments, nutrients and pesticides were collected
concurrently. For full details on sampling procedure, transport and laboratory analysis refer to
Huggins et al. (2017).

Data from samples collected between July 1st 2015 and June 30th 2016 were used to calculate water
quality condition scores for the 2016 report card. For this time period, data were available from only
three end-of-system GBRCLMP sites within the Region (Figure 4). These sites have been used to
provide water quality scores for three basins (i.e. one site is currently used to represent water
quality across the relevant basin):

Methods for the Mackay-Whitsunday 2016 report card                                        Page 14 of 94
O’Connell Basin: O’Connell River at the Caravan Park;
Pioneer Basin: Pioneer River at Dumbleton Pump Station; and
Plane Basin: Sandy Creek at Homebush.
Intensive sampling (up to hourly) occurred during high flow events and monthly sampling was
undertaken during ambient (low or base-flow) conditions.
The ms-PAF risk estimations were limited to a six-month period of the year to include the principle
exposure period (generally November – April, depending on the timing of the wet season). Exposure
to pesticides assessed as part of these estimations generally does not occur during the dry season
because residual soil concentrations are low and pesticides are predominantly transported during
rainfall run-off events (Devlin et al. 2015). During the dry season concentrations of pesticides in
streams are generally below detection limits (Devlin et al. 2015) and therefore the risk of pesticide
exposure to organisms is very low compared to the wet season. Because time plays a critical role in
the toxicity of a pesticide, in order to calculate the risk that pesticides pose to the ecosystem, a
measure of the exposure period is needed. This period must be standardised to allow comparison
between sites and over time. As exposure is low during the dry season, including dry season data
would only dilute the estimation of risk. For the purpose of calculating an ms-PAF risk metric, a
period of 182 days, generally starting from the 1st of November to the 30th of April (unless the first
run-off event containing pesticides occurred prior to 1st of November, from which the 182 day
period commenced), was used as a standardised exposure period; a period which, if contaminant
concentrations are high enough, exceeds the time required to cause adverse effects among
populations of aquatic species (Warne et al. 2015).
Future directions
Additional end-of-system water quality monitoring sites within the Mackay-Whitsunday report card
Region have been established since December 2016. This has occurred as part of the expansion of
the GBRCLMP. These additional sites are now monitoring water quality in the Don River, Proserpine
River, and Plane Creek. This will provide water quality data that will allow reporting in the Don and
Proserpine basins for the first time in the 2017 report card and will improve our understanding of
water quality in the Plane Basin, thus improving confidence in water quality results in these basins.
3.2. Habitat and Hydrology Indicators
3.2.1. Indicator selection
3.2.1.1. In-stream Habitat Modification
The in-stream habitat modification indicator category is made up of two indicators – impoundment
length and fish barriers. Whilst both indicators relate to artificial in-stream structures, the
impoundment length indicator is a measure of the proportion of artificially ponded habitat within a
basin and results from larger barriers, whilst the fish barrier indicator is a measure of the potential
impact on fish movement and includes smaller barriers that do not result in substantial ponding of
habitat.
Methods for the Mackay-Whitsunday 2016 report card Page 15 of 94Impoundment Length The basis for using this indicator is that impoundment of rivers and streams by the construction of artificial in-stream structures, including dams and weirs, has a profound impact upon stream ecology and connectivity (Agostinho et al. 2008). The purpose of constructing in-stream barriers is commonly to store water for later use, and impounded areas generally have increased water depth and decreased water velocities. Cycles of wetting and drying are disrupted, decreasing the occurrence of natural disturbance and altering the nutrient processing cycle. Increased sedimentation may occur and benthic habitats may become stratified and anoxic. This can also lead to eutrophication and algae blooms, including potentially toxic blue green algae. The spawning habitat of some aquatic organisms may be lost. The indicator was selected with the intention to describe how much “natural” channel habitat remained, compared with artificially ponded channel habitat which has relatively little diversity in terms of depth (benthic light availability, oxygen availability), flow rate, and wetting and drying cycles due to the river channel being filled by impounded waters. The length of impounded channel will vary according to attributes such as the height of the constructed in-stream barrier and landscape features such as gradient of the channel. In-stream barriers constructed to store water also disrupt the movement of aquatic organisms. Consequently the impoundment length indicator is likely to have some correlation with the indicator of fish barriers. However, the intended focus of the impoundment length indicator is on the ecological impact of the proportion of affected in-stream habitat and not the movement of organisms. Fish Barriers Fish barriers are an important indicator for inclusion in the Mackay-Whitsunday report card due to their links to ecosystem health and the value the local community places on the presence of freshwater fish species. The majority of freshwater fish species of the Mackay-Whitsunday Region migrate at some stage during their life cycle. Of the 47 freshwater fish species found to occur in the Mackay-Whitsunday Region, 27 (57%) require unimpeded access between freshwater and estuarine habitats to complete their life cycle and maintain sustainable fish populations (Moore 2016). Therefore, barriers that prevent or delay connectivity between key habitats have the potential to impact migratory fish populations, decrease the diversity of freshwater fish communities and reduce the condition of aquatic ecosystems (Moore 2015a). The amount of longitudinal in-stream habitat available to estuarine fish species in un-disturbed, connected habitats is determined by a number of naturally occurring factors, such as: habitat availability and condition, gradient, refuge areas, water temperature and food resources. However, anthropogenic factors such as man-made barriers to fish passage and habitat destruction often have a far greater impact in determining the amount of connected upstream habitat available to fish. One large low transparency barrier (barrier that is most difficult for fish to pass) close to the freshwater/estuarine interface has the potential to alter upstream fish communities (and particularly the number of diadromous fish species) more than any other naturally occurring factor. Thus, selected indicators were: Methods for the Mackay-Whitsunday 2016 report card Page 16 of 94
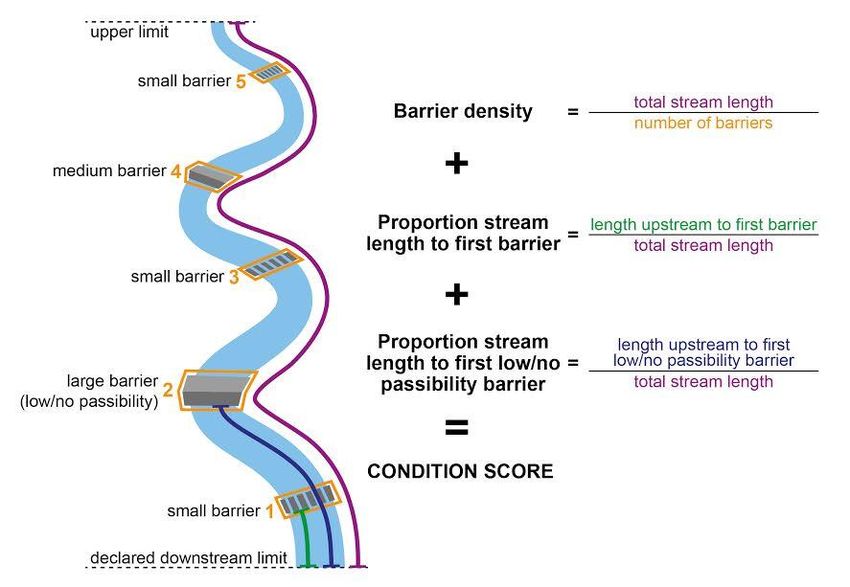
Barrier density (average length of stream per barrier). A measure of the average length of
stream available that is unimpeded by barriers, acting as an indication of connected habitat
availability.
Proportion of stream to first barrier (amount of stream to the first upstream barrier as a
proportion of total stream length). A measure of the average proportion of stream available
upstream of the interface between fresh and saline water that is unimpeded by any barriers.
Proportion of stream to first no/low ‘passability’ barrier (amount of stream to the first
upstream low passability barrier as a proportion of total stream length). A measure of the
average proportion of stream available upstream of the interface between fresh and saline
water that is unimpeded by barriers that do not allow fish to pass at any time (no passability) or
rarely allow fish to pass (low passability), thus having the greatest impact on fish passage.
Not all barriers on all streams have the same impact on fish community assemblage within aquatic
ecosystems. Streams that fall within ‘Major’ and ‘High’ impact categories are generally lower in the
catchment and are higher order streams with low gradients. These streams are categorised by
having a high diversity of species, often with weak swimming abilities. Barriers located on high
gradient, top of catchment ‘Moderate’ (Amber) and ‘Low’ (Green) impact streams (stream order 1 &
2) are still important, but are not as influential in determining fish community assemblage within
aquatic ecosystems as barriers on ‘Major’ (Grey and Purple) and ‘High’ (Red) impact streams (Table
1).
Because passage between the freshwater and estuarine environment is critical for the migration of
both freshwater and estuarine species, the same three barrier indicators will be used for the
freshwater basins and estuaries, however barrier assessments will be made at different scales
(different stream classifications) depending on which ecosystem is being assessed.
Table 1. Queensland Government classification of streams according to the risk of impact from barrier works on fish
movement and fish communities, including spatial data layer colour code and stream characteristics. Source:
‘Queensland waterways for waterway barrier works’ (DAFF 2013).
Risk of impact Stream classification Stream characteristics
(represented by colour
code)
Major Grey Estuarine habitats
Major Purple Strahler stream orders 4-7
High Red Strahler stream orders 2-3 with low gradient
Strahler stream order 3 with medium gradient
Moderate Amber Strahler stream order 3 with high gradient
Strahler stream order 2 low/medium gradient
Low Green Strahler stream order 2 with high gradient
Strahler stream order 1 within tidal waters
N/A N/A Strahler stream order 1 outside tidal waters
3.2.1.2. Flow
Flow is an important indicator to include in the report card due to its relevance to ecosystem and
waterway health. This indicator is intended to report on delivery of environmental flows compared
Methods for the Mackay-Whitsunday 2016 report card Page 17 of 94to expected natural flows on an annual basis and should provide transferability between basins and regions. It is proposed that the indicator category will assess attributes of flow that are linked to the key ecological values of the waterways identified using a Driver, Pressure, State, Impact, Response (DPSIR) model which will be adapted from the Pressure Stressor Response model as applied in the Environmental Flow Assessment Program in Queensland. Flow has not been included in the 2016 report card but work is currently underway to identify appropriate flow indicators and develop methodology for assessing these indicators annually. 3.2.1.3. Riparian Extent The extent of riparian vegetation was determined to be an important indicator to include in the report card due to the importance of riparian vegetation for ecological function, habitat provision and benefits to water quality including bank stabilisation and filtering of coarse sediment inputs into waterways as well as moderating stream water temperature from shading. 3.2.1.4. Wetland Extent Wetland extent was determined to be a relevant indicator to include within the freshwater basin assessments in the report card due to its importance in ecological function, provision of habitat for a range of species and benefits to water quality including sediment retention and nutrient cycling. Indicators for wetland values including function and condition of wetlands have been identified for inclusion in future reporting. 3.2.2. Data collection 3.2.2.1. Habitat Modification/Instream Habitat Impoundment All data for impoundment results was assessed in 2013-14. Impoundment is reported four yearly, thus results presented in the 2016 report card are repeated from the 2015 and 2014 pilot report card. The impoundment length indicator reports on the proportion (%) of the linear length of non-tidal streams of order three or higher that are inundated at the Full Supply Level of artificial in-stream structures such as dams and weirs. This is compared to the reference condition of no artificial impoundments (0 %). Impoundment locations and estimates of impounded lengths were derived from the Department of Natural Resources and Mines (DNRM) Queensland 1:100,000 ordered drainage network, Google Earth imagery, Queensland Globe spatial layers (Dams, Weirs and Barrages, Referable Dams and Reservoirs) and local knowledge, including from DNRM regional hydrographic staff. The proportion of impoundment length was calculated as a percentage of the total linear length of the river channel. Only streams of order three or higher within the freshwater basin were included in the assessment. Methods for the Mackay-Whitsunday 2016 report card Page 18 of 94
Fish Barriers
All data for fish barrier results were assessed in 2014-15. Fish barriers are reported four yearly, thus
results presented in the 2016 report card are repeated from the 2015 report card.

In the Proserpine, O’Connell, Pioneer and Plane basins, fish barriers were assessed utilising known
barriers identified using spatial imaging, local knowledge and ground truthing that were identified
and assessed for the Mackay Whitsunday Region Freshwater Fish Barrier Prioritisation (Moore
2015c).
In the Don basin, fish barriers were assessed using known barriers identified for the Burdekin Dry
Tropics Natural Resource Management group Region Fish Passage Study (Carter et al. 2007). There
was less confidence assigned to the results generated from this data due to the improvements of
satellite imaging since the collection of the data. A desk-top assessment of current satellite imaging
was used to cross-check identified barriers in the Don basin, however no/low passability barriers
could not be confidently confirmed with this process alone (lack of ground truthing). Expert opinion
was used to score this indicator for the Don basin.
Only barriers located on ‘Major’ (Strahler stream orders 4-7) and ‘High’ (Strahler stream orders 2-3
with low gradient; Strahler stream order 3 with medium gradient) risk category waterways were
included in the analysis (Table 1). Queensland waterways that fall within these two risk categories
were determined by Fisheries QLD based on the following criteria: stream order, stream slope, flow
regime, number of fish present, and fish swimming ability. The combined analysis of these
characteristics determined the classification, based on the risk of impact from fish barriers on fish
movement and fish communities.

For the freshwater basins all measurements were made upstream of the Declared Downstream Limit
(DDL). The DDL was selected because any potential barriers downstream of this point were clearly
allowing tidal movements and thus not preventing connectivity with this interface.
The ‘barrier density’ indicator was assessed by calculating the total stream length (km) of ‘Major’
and ‘High’ impact streams in a basin and dividing the total stream length by the total number of
barriers on these streams within this basin (Figure 2).
The ‘proportion of stream length to the first barrier’ indicator was assessed by quantifying the
distance (stream length) upstream from the DDL to the first barrier on all ‘Major’ and ‘High’ impact
waterways in a basin (Figure 2). The total basin stream length was divided by the overall connected
basin stream length to determine the proportion of stream length upstream of the DDL not
impacted by barriers.
The ‘proportion of stream length to the first low/no passability barrier’ indicator was assessed by
quantifying the distance (stream length) upstream from the DDL to the first low/no passability
barrier for ‘Major’ impact waterways only (Figure 2). The total basin stream length was divided by
the overall connected basin stream length to determine the proportion of stream length upstream
of the DDL not impacted by no/low passability barriers. A low passability barrier was defined as a
barrier that never or rarely drowns out (2m head loss, a

Methods for the Mackay-Whitsunday 2016 report card                                          Page 19 of 94
causeway >2 m high with pipe/culvert configuration 1 m.
For the Don basin, expert opinion was used to assess the ‘proportion of stream length to the first
low/no passability barrier’ indicator, due to the lack of confirmation of no/low passability barriers via
current satellite imaging in this area.

Figure 2. Diagram of the three fish barrier indicators and how they are calculated.

Methods for the Mackay-Whitsunday 2016 report card                                           Page 20 of 94
3.2.2.2.    Flow
Methodologies for collecting data for flow indicators are currently under development.

3.2.2.3.    Riparian Extent
The assessment of riparian extent follows the same methodology used for GBR report card assessed
in 2013-14. Riparian extent is reported four yearly, thus results presented in the 2016 report card
are repeated from the 2015 and 2014 pilot report cards.

This methodology first defines riparian areas using topographic drainage data and riverine wetlands
derived from the 2009 Queensland Wetland Mapping Programme data. The present extent of
riparian forest is defined by those areas with a foliage projective cover of at least 11% (Folkers et al.
2014) using the 2013 Landsat foliage projective cover data. This was then compared against the pre-
development extent of riparian forest regional ecosystems (based on regional ecosystem mapping
version 9) to estimate the amount of riparian forest remaining in the five basins. The method
assumes that the pre-development riparian forest regional ecosystems were 100% forested.

3.2.2.4.    Wetland Extent
The assessment of wetland extent uses similar methods to the GBR report card wetland extent
assessment. The source data is the same for both report cards, however with a focus on only
palustrine systems in the five reported basins for the Mackay-Whitsunday report card (the Don,
Proserpine, O’Connell, Pioneer, and Plane basins).

The condition of wetland extent was determined through a comparison of current extent against
pre-development extent of vegetated freshwater swamp (palustrine) systems with more than 30%
emergent vegetation cover, using the Queensland Regional Ecosystem (RE) mapping version 9.

All data for wetland extent results was assessed in 2013-14. Wetland extent is reported four yearly,
thus results presented in the 2016 report card are repeated from the 2015 and 2014 pilot report
card, though scores are based on revised scoring ranges.

    3.3. Fish

 3.3.1. Indicator selection
Assessments of fish community health were deemed important for the Mackay-Whitsunday report
card in terms of ecosystem health assessment and outcomes of water quality impacts. In addition,
the value the local community places on the presence of freshwater fish species was also
considered.

The aquatic ecosystems of the Mackay-Whitsunday Region have been significantly impacted by the
surrounding land use practices (Folkers et al. 2014). Impacts include (but are not limited to) poor
water quality runoff, degraded riparian and in-stream habitats, flow modification, and barriers to
fish migration (Folkers et al. 2014). The cumulative impacts of these modifications have led to
changes in the condition of the Region’s fish communities, adversely impacting fish abundance,
species richness, fish community composition and exacerbating the prevalence of pest fish species

Methods for the Mackay-Whitsunday 2016 report card                                           Page 21 of 94
(Moore 2015b). Significantly, where in-stream and terrestrial habitats persist undisturbed, healthy
fish populations remain (Moore 2015b).
The freshwater fish community condition indicator is based on two ecological indicators:
Native species richness; and
Pest fish abundance.
Assessment in the report card of the two identified fish indicators is an important step towards
understanding the health of the local freshwater fish communities. Inclusion of fish community
composition and abundance indicators is an aspiration of the report card but will depend on funding
research for developing appropriate methods to assess these indicators.
Changes from 2015 report card
In the 2015 report card: Macroinvertebrates were listed as an indicator for fauna in the 2015 report
card however were not reported in any of the basins in the 2015 report card.
2016 report card: Macroinvertebrates have been removed as an indicator for fauna in freshwater
basins. This is due to a lack of on-going monitoring in the Region and the decision from the
Partnership that monitoring for this indicator was unlikely to be established in the near future.
Macroinvertebrate reporting will be considered a long-term ambition for the report card. Removing
macroinvertebrates as an indicator means that the condition assessments for freshwater fish will
contribute to the overall basin scores for the first time.
The impact of incorporating freshwater fish condition scores into final basins scores in the 2015
report card can be seen in the Appendix.
3.3.2. Data collection
The two ecological indicators for fish are assessed by comparing observed data to modelled data:
Native species richness: Calculate a Native Species Richness indicator by dividing the number of
native fish species actually caught by the number expected to occur based on modelling
(Proportion Observed Native Species compared to Expected, PONSE); and,
Pest fish abundance: Calculate the proportion of the total number of fish caught that consists of
pest fish by dividing the number caught to the number expected to occur based on modelling.
The model developed for this calculation was reviewed by local experts to ensure validity. The model
provides a means to compare fish species richness and pest fish abundance across basins to a
reference. This reference was recent species richness at the ‘least disturbed’ site with available data,
which in the Mackay-Whitsunday Region was Repulse Creek. This approach does not compare to a
pre-development baseline, so can only be considered as a comparison of current fish community
condition between basins. Modelled data was compared with data from 2015-16. The results from
this data are repeated for the 2016 report card due to the three yearly reporting frequency of this
indicator.
Methods for the Mackay-Whitsunday 2016 report card Page 22 of 94You can also read