Review of available data for a South African Inventory of Inland Aquatic Ecosystems (SAIIAE) - (SciELO) SA
←
→
Page content transcription
If your browser does not render page correctly, please read the page content below
Review of available data for a South African Inventory of Inland
Aquatic Ecosystems (SAIIAE)
Heidi van Deventer1,2*, Lindie Smith-Adao1, Chantel Petersen1, Namhla Mbona3,
Andrew Skowno3 and Jeanne L Nel4,5
1
Council for Scientific and Industrial Research (CSIR), PO Box 395, Pretoria 0001, South Africa
2
School of Geography, Archaeology and Environmental Studies, University of the Witwatersrand, Private Bag 3, WITS 2050, South Africa
3
South African National Biodiversity Institute, Private Bag x101, Pretoria, 0001, South Africa
4
Institute for Environmental Studies, Faculty of Science, Vrije Universiteit Amsterdam, De Boelelaan 1087, 1081 HV Amsterdam, The Netherlands
5
Sustainability Research Unit, Nelson Mandela University, Private Bag X6531, George 6530, South Africa
ABSTRACT
The National Biodiversity Assessment of 2011 found freshwater ecosystems to be highly threatened and poorly protected.
However, a number of studies have shown that the National Wetland Map (NWM) Version 4 represents less than 54% of
wetlands mapped at a fine scale. A more comprehensive South African Inventory of Inland Aquatic Ecosystems (SAIIAE)
would greatly improve the assessment of wetland ecosystem types and their condition and conservation status, and is crucial
for monitoring trends to inform decision making and planning. In preparation for the third National Biodiversity Assessment
of 2018, a review was undertaken to identify possible data sources that could contribute to the SAIIAE. The objectives of
the study were to (i) assess which type of information is available for developing a SAIIAE; and (ii) list and understand the
availability of fine-scale wetland data for updating the NWM. A variety of data related to species occurrence and distribution,
extent and type of inland wetlands and rivers, as well as datasets which describe regional settings of inland aquatic
ecosystems, were found across a number of institutions. Fine-scale spatial data amounted to more than double the extent of
inland wetlands mapped by remote sensing at a country-wide scale. Nearly 5 million ha of fine-scale data were collected from
a diverse number of institutions, with the majority (73%) of these data mapped by Government (3 681 503 ha or 3% of South
Africa). It is estimated that < 8% of the sub-quaternary catchments of South Africa had complete wetland data sets, primarily
in the Gauteng, Mpumalanga and Western Cape Provinces. Accuracy assessment reports and confidence ratings were however
not consistently available for the wetland datasets. Inland wetlands in the majority of South Africa (84%) therefore remain
poorly represented. We recommend future steps to improve the SAIIAE, including improving the representation of inland
wetland ecosystem types and focusing on accuracy assessment.
Keywords: wetland inventory, National Wetland Map, river/wetland ecosystem types, inland aquatic ecosystems,
National Biodiversity Assessment
INTRODUCTION number of pressures, including an increased demand for water,
urbanisation, changes in climatic conditions, and invasive
South Africa is considered one of 17 megadiverse countries species. The NBA of 2011 (NBA 2011) found inland aquatic
in the world (Mittermeier et al., 1997). The diversity of inland ecosystems to be highly threatened and poorly protected,
aquatic ecosystem types in South Africa, formerly referred to and therefore the accurate inventorying of inland aquatic
as ‘freshwater ecosystems’ are recognised in a framework for ecosystems in South Africa is crucial for monitoring trends,
wetland types, titled the Classification System for Wetlands and informing decision making and planning (Nel et al., 2011).
and other Aquatic Ecosystems in South Africa (Ollis et al., The inventory of South African inland aquatic ecosystems
2013; SANBI, 2009), which was implemented through the has thus far focused only on the extent and types of rivers and
National Wetland Map (NWM) Version 4 (Nel et al., 2011). wetlands, which is often referred to as a National Wetland Map.
The biodiversity of river ecosystems of South Africa was first A wetland inventory is defined by Finlayson et al. (1999 p. 718) as
assessed in the National Spatial Biodiversity Assessment in ‘the collection and/or collation of core information for wetland
2004, while wetlands were included with the river ecosystems management, including the provision of an information base
in the National Biodiversity Assessments (NBA) of 2011 (Driver for specific assessment and monitoring activities’. Whereas a
et al., 2005; Nel et al., 2011; Driver et al., 2012). Inland aquatic wetland directory is considered to be a list of coordinates of
ecosystems support a high diversity of aquatic species which wetland location and possibly type, an inventory would consist
provide direct benefits in the form of water, food, building of core datasets which would support the typing of ecosystems,
material and medicine, as well as indirect benefits such as as well as additional information related to landuse, impacts,
water filtration and flood control (Darwall et al., 2009; Kotze conservation and management (Finlayson et al., 1999). A
et al., 2009). Inland aquatic ecosystems in South Africa, as wetland inventory therefore encompasses more information than
in many other countries, are however under threat from a the extent and type of wetland ecosystems, which are generally
included in a wetland map.
* To whom all correspondence should be addressed. The first directories of inland wetlands of South Africa
+27 12 841 2507; Fax: +27 12 841 3909; date to the early 1970s and of rivers to the 1980s (Noble
e-mail: HvDeventer@csir.co.za and Hemens, 1978; O’Keeffe, 1986). A more comprehensive
Received 25 August 2017; accepted in revised form 12 March 2018 inventory of priority wetlands was undertaken for the
http://dx.doi.org/10.4314/wsa.v44i2.05
Available on website http://www.wrc.org.za
ISSN 1816-7950 (Online) = Water SA Vol. 44 No. 2 April 2018
Published under a Creative Commons Attribution Licence 184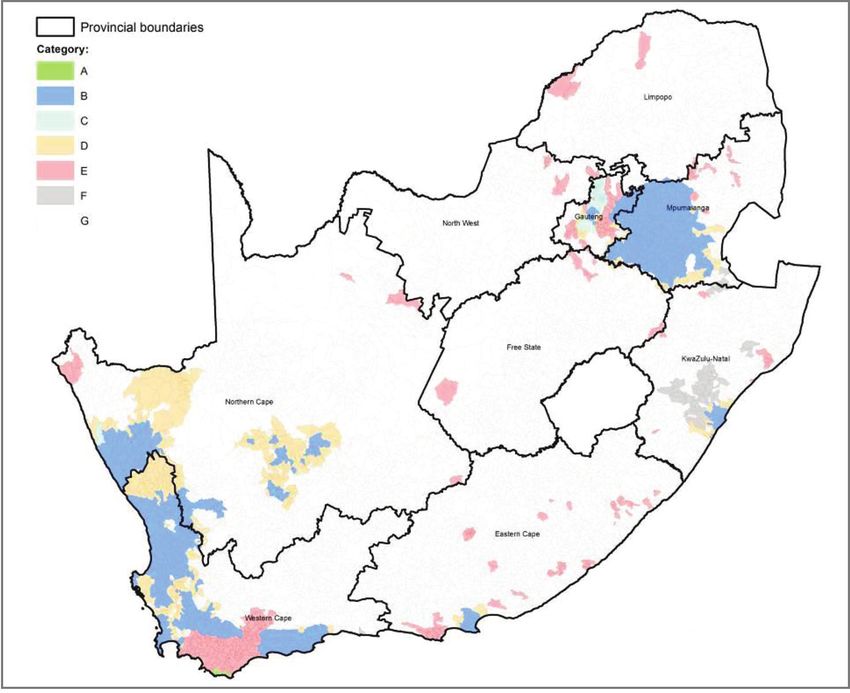
KwaZulu-Natal Province, mapping as far as possible the                        Methods for capturing the extent of inland wetlands are
historical extent and pressures on these systems (Begg,                  often scale dependent, ranging from field surveying at local scale
1988). The study showed that 58% of wetlands in the Mfolozi              to regional estimations using predictive modelling or remote
catchment had been altered or lost, reducing the extent of               sensing classification (GTI and WCS, 2012). Field surveying of
wetlands from 5% to 2.1% of the surface area of the catchment.           inland wetland ecosystems offers the most spatially accurate
Subsequent to these initial efforts, the Department of                   and detailed understanding of these ecosystems. Through field
Environmental Affairs and Tourism compiled a directory of                surveys, detailed information on the hydroperiod, soil and
wetland types in 1998 (Cowan and Van Riet, 1998). Efforts to             flow characteristics, functionality, condition and presence of
update these initial wetland directories extended to mapping             species can be recorded. Field surveying becomes costly and
the spatial extent of rivers and inland wetlands at a national           impractical for regional to country-wide extents. In contrast, the
scale for the NBAs, and formalising the framework for                    use of remote sensing has enabled mapping and monitoring of
the Classification System. South Africa defines an aquatic               ecosystems at a regional level, though compromising on detail
ecosystem as ‘an ecosystem that is permanently or periodically           and accuracy. Remote sensing also added the benefit of frequent
inundated by flowing or standing water, or which has soils               revisit times which could inform wetland characteristics across
that are permanently or periodically saturated within 0.5 m of           multiple seasons and years. The availability of remote-sensing
the soil surface’ (Ollis et al., 2013:1). Three broad systems are        imagery since the Second World War furthered the ability to
recognised, including marine, estuarine and inland systems,              capture and record geospatial information of inland wetland
of which the latter is the focus of this work. The South African         ecosystems across the world. Remotely-sensed images are
NWM has seen three iterations of improvements, with the                  generally used in two ways: either for visual interpretation, or
last version, NWM4, including inland wetlands and estuaries.             image classification. In South Africa, both of these methods
Inland wetlands and rivers are collectively referred to as inland        have been used. In the early 1990s, the South African Surveys
aquatic ecosystems. Regardless of the effort to continuously             and Mapping Directorate of the Department of Land Affairs
improve the representation of inland wetlands, a number of               supported manual mapping of topographical features, including
studies have showed that the total surface extent of wetlands            wetland and river data, from aerial photography, which was
is poorly represented, with the accuracy of the map estimated            later vectorised and converted to shapefile formats (DLA, 2000).
at below 54% compared to finer-scale data (Mbona et al., 2015;           Updates to these topographical features are still being done
Schael et al., 2015; Van Deventer et al., 2016; Melly et al., 2016).     through visual interpretation of imagery and distributed by the
The extent of the rivers is based on large quaternary mainstem           National Department of Rural Development and Land Reform:
rivers at a scale of 1:500 000, of which a number of parameters          Directorate National Geo-Information (DRDLR:NGI). During
such as seasonality of flow and geomorphic type, are measured            the compilation of South African’s first National Land Cover
(DWAF, 2006; Moolman, 2008; Nel et al., 2011). Internationally,          (NLC) datasets of 1996, land-cover classes. which included
inventories of wetland ecosystems include attributes of the              water bodies and wetlands, also used heads-up digitising from
associated floral and faunal species, condition of ecosystems,           Landsat Thematic Mapper images (Thompson, 1996; Fairbanks
as well as land ownership, in addition to the ecosystem types            et al., 2000; Van den Berg et al., 2008). Further divisions of the
(Finlayson and Spiers, 1999). In the NWM4, the presence of               original NLC water bodies and wetlands classes have also been
a few faunal species (fish, waterbirds and wetland-dependent             dependent on visual interpretation of multi-season imagery into
frogs) were included for the country’s first inland aquatic              subclasses (GTI, 2016).
conservation plan, i.e., the National Freshwater Ecosystem                    The use of image classification for the mapping of wetlands
Priority Areas (NFEPA) Atlas (Nel et al., 2011; Van Deventer et          in South Africa dates back to soon after the vectorisation of
al., 2016; Nel et al., 2016). In order to create a complete South        the hydrological datasets from the topographical maps. The
African Inventory of Inland Aquatic Ecosystems (SAIIAE)                  space-borne Satellite Pour l’Observation de la Terre-5 (SPOT)
for better assessment and planning, improvements to the                  and Landsat multispectral imagery were assessed for their
representation of the inland wetland ecosystem types would be            ability to map small-scale detailed wetland extents, but were
essential, as well as the inclusion of species and other associated      found unsuitable owing to the low spatial resolution of the
information (Margules and Pressey, 2000; Nel et al., 2009; Nel           imagery (Thompson et al., 2002). Regardless of the increase in
et al., 2011).                                                           the spatial resolution of many space-borne sensors since this
     The inventorying of inland wetland ecosystems remains               study, international literature persists in stating that the spatial
a challenge in many countries for a number of reasons.                   and spectral resolutions remain deficient for proper mapping
In semi-arid countries such as South Africa, for example,                and monitoring of inland aquatic ecosystems (Ozesmi and
inland wetlands are usually smaller in extent and only a                 Bauer, 2002; Thompson et al., 2002; Wang et al., 2004; Adam
limited number of visibly identifiable indicators can assist in          et al., 2010; Hestir et al., 2015). The more recent space-borne
the detection of these systems compared to rivers or inland              sensors, such as WorldView, RapidEye and Sentinel 2A, have
wetlands with permanent large open water bodies. It has also             increased the ability for detecting and monitoring many aspects
been previously recognised that South Africa shows a diverse             of wetlands other than extent. These sensors include a band in
range of climatic zones, from arid to sub-tropical, which result         the red-edge region of the electromagnetic spectrum which is
in a diverse range of water, aquatic species and soil chemistry          expected to enhance the monitoring of the essential biodiversity
indicators for the identification of inland aquatic ecosystems           variables of inland aquatic ecosystems, such as floral species
(Ellery et al., 2009; Ollis et al., 2013). Relative to the terrestrial   discrimination, biomass and biochemicals as surrogates of
ecosystems domain, inland aquatic ecosystems have received               condition (Cho and Skidmore, 2006; Mutanga and Kumar, 2007;
less attention in the assessment and planning domains (Nel et            Cho et al., 2008; Turak et al., 2016; Van Deventer et al., 2017). In
al., 2007). Increasing concern about the tremendous losses and           addition to the optical sensors, space-borne radar technology
degradation of inland aquatic ecosystems in the past 15 years            has been successfully applied in monitoring soil moisture and
has however supported improved inventorying and monitoring               biomass, which can potentially be used as indicators of wetland
of these ecosystems.                                                     functionality and health (Hess et al., 2003; Klemas, 2013; Brisco,

http://dx.doi.org/10.4314/wsa.v44i2.05
Available on website http://www.wrc.org.za
ISSN 1816-7950 (Online) = Water SA Vol. 44 No. 2 April 2018
Published under a Creative Commons Attribution Licence                                                                                   185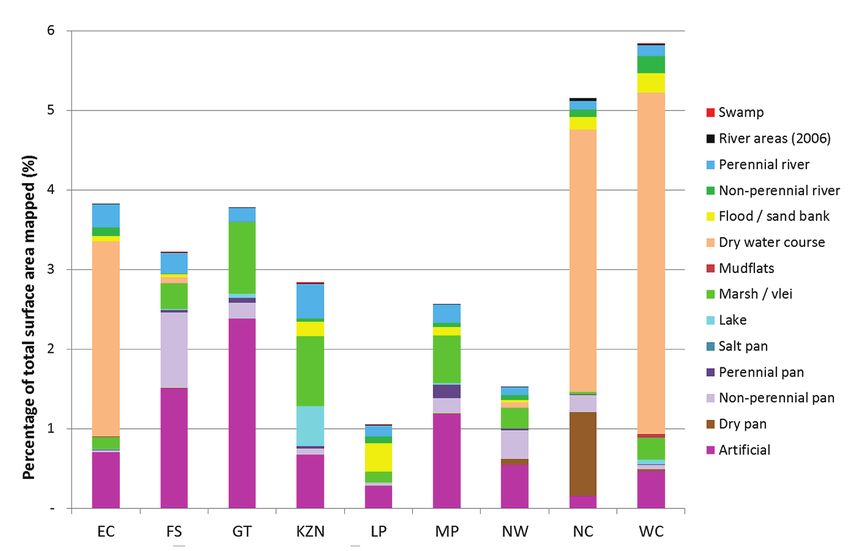
2014). Radar sensors such as C-band sensors (e.g. the Sentinel       parties (I&APs) for inland aquatic ecosystems, including
1A sensor), are able to sense sub-surface soil moisture up to        the Freshwater Ecosystem Network (FEN), attendees of the
5 cm deep, whereas the L-band sensors (e.g. the Soil Moisture        National Wetlands Indaba, the Wetland Society (society.
Ocean Salinity or SMOS sensor) could sense up to 30 cm in            wetlands.za.net), provincial wetland forums, the Southern
the plant’s root zone (NASA, 2014). The coarse scale of space-       African Society of Aquatic Scientists (SASAqS) and a list
borne radar imagery of > 10 km spatial resolution, as well as        administered by Rhodes University (wetlands@lists.ru.ac.za).
the expensive nature of airborne imagery, has however limited        In addition, a workshop was held at the National Wetlands
the application of this technology in the monitoring of inland       Indaba of 2015 to discuss the availability of data. Between
aquatic ecosystems. The use of remote sensing in the mapping         October 2015 and December 2016, organisations and
and monitoring of different aspects of inland aquatic ecosystems     individuals known to be involved in inland aquatic work and
should therefore be pursued in future, to assess the benefits        research were also contacted to obtain more recent related data,
thereof for South Africa.                                            reports or associated information. Where reports or metadata
    The use of digital elevation models (DEMs), derived from the     were lacking or incomplete, follow-up discussions were held to
topographical contours and spot heights, has also enabled the        allow for a more informed assessment of the data.
use of DEM derivatives in calculating the likelihood of wetlands         Information was evaluated according to the following two
occurring in the landscape. The earliest work in South Africa was    categories:
done by Thompson et al. (2002), who compared the ability of the      • Diversity of information available for inclusion in the
Landscape Wetness Potential, the Topographic Position Index              SAIIAE:
and the Topographic Relative Moisture Index for predicting               • Wetland and associated features, including rivers, lakes,
the occurrence of wetlands for a number of study sites in South          artificial wetlands, springs and estuaries (Ollis et al., 2013)
Africa (Thompson et al., 2002). The availability of radar-derived        • Faunal and floral species information including
DEMs across the world, such as the Shuttle Radar Topography              information on invasives
Mission (SRTM), has likely contributed to an increase in similar         • Environmental setting, including information related
studies, by expanding the ability to model wetlands using GIS            to geology, pedology and geomorphic features
and DEM derivatives to a provincial and country-wide scale               • Land ownership and level of protection
(Jarvis et al., 2008). Within the past 5 years, 4 studies in South   • Nature of the inland aquatic ecosystems datasets:
Africa have modelled wetland extent and types ranging from               • What was the contribution of river (km) and wetland
a metropolitan municipality scale to a country-wide scale                (ha or % of surface area of the country) data across sectors?
(Rivers-Moore and Goodman, 2011; Rivers-Moore and Cowden,                • What was the approach used in mapping the extent and
2012a; Rivers-Moore and Cowden, 2012b; Hiestermann and                   type of wetlands:
Rivers-Moore, 2015; Van Deventer et al., 2016; Grundling et al.,            • What was the method used of capturing the data, for
2016; Melly et al., 2016; Collins, in prep.). Although many of the          example, heads-up digitising, image classification or
models did not achieve overall accuracies higher than 70%, the              modelling?
effort contributes to improved understanding and methods of                 • Which satellite imagery was used for mapping the
predicting wetlands in the landscape.                                       extent of the wetlands and what is the year and spatial
    In preparation for the third National Biodiversity                      resolution of the images?
Assessment of 2018, NBA 2018, a review of existing                          • Were the wetlands typed into sub-classes?
information, including a questionnaire-based survey, was                 • Was the data verified in any way (accuracy assessment)?
undertaken to assess whether a SAIIAE can be created building            • Have the wetlands been assessed for condition and if so
on the efforts of the NWM and river inventories. In particular,          was this done through modelling or in-field verification?
we aimed to establish South Africa’s first National Wetland              The scope of the survey focused on nationally available data
Inventory, with the objectives of this paper being to:               sets, although datasets at provincial and regional scales were
• Review which types of information are available for the            also considered.
    creation of a SAIIAE
• List and understand the availability of fine-scale wetland         RESULTS
    data for an update to the NWM
• Recommend future improvements of a SAIIAE for better               Diversity of spatial data available for the National
    representation of inland wetland ecosystem types                 Wetland Inventory
    The review focused primarily on the spatial data for the
SAIIAE, while a review of the methods for compiling such             The majority of the 85 records listed as relevant for the SAIIAE
datasets was not undertaken. It is our intention that the            were related to inland aquatic ecosystems (74%) of which 60%
resulting information informs not only the creation of South         mapped the extent of inland wetlands at national, provincial
Africa’s first SAIIAE, but also future funding and research          and municipal scales (Table 1; Appendix 1). The extent of
teams in devising strategies to improve wetland inventorying in      sub-national data ranged from sub-district to provincial levels
South Africa.                                                        with the most datasets (10) received for the KwaZulu-Natal,
                                                                     followed by the Northern Cape (8) and the Western Cape (6)
METHODS                                                              Provinces. Of all the provinces, the Free State and North West
                                                                     had the lowest number of datasets (1), consisting primarily of
A review of the literature and available data was done,              modelled inland wetlands, except for those listed at a national
including an electronic questionnaire, a workshop and targeted       scale. For the South African islands, only coordinates were
enquiries to a number of organisations and individuals to            listed in a report (Hänel and Chown, 1998). Riverine wetlands
obtain information about available data for the SAIIAE.              are primarily mapped as line features at a scale of 1:500 000 and
An electronic survey was circulated between October 2015             1:50 000 (DWA, 2006; DLA:CDSM, 2006). Springs (7 312 point)
and February 2016 to more than 500 interested and affected           data, primarily from DRDLR:NGI, complement the extent

http://dx.doi.org/10.4314/wsa.v44i2.05
Available on website http://www.wrc.org.za
ISSN 1816-7950 (Online) = Water SA Vol. 44 No. 2 April 2018
Published under a Creative Commons Attribution Licence                                                                             186
of the inland wetland and river datasets for inland wetland development within wetlands, for example, the extent of canals
ecosystem types, though this would require mapping and (Environomics, 2007). At a local scale, data are therefore less
typing of the wetland at the location of the spring. Thermal consistent compared to those captured at national scale by
springs have also been mapped for South Africa (Olivier and DWS and DRDLR:NGI.
Jonker, 2013). The extent of estuary (polygon) data enables the Of the species data, more vegetation relevé data from
correct mapping of the extent of wetlands and was used in national databases (Sieben et al., 2014; Dayaram, 2017) were
NWM4 to align wetlands to estuaries. received compared to faunal species information, though we
A number of features which indicate the modification of acknowledge that we may not have received all available data
inland wetlands were also mapped, including dams where for South Africa. These relevé datasets are crucial for the
terrestrial or inland wetlands were converted to aquatic inventorying of wetlands since the alluvial vegetation was not
ecosystems. Dams were mapped both by the Department of mapped consistently in the National Vegetation Map of South
Water and Sanitation (DWS) and DRDLR:NGI at national Africa (Mucina and Rutherford, 2006). The National Vegetation
level (DLA:CDSM, 2006). Infrastructure, such as canals and Database has collated a number of relevés from historical and
roads, contribute to the understanding of the modifications of more recent studies (Dayaram, 2017). Although few datasets
inland wetlands and rivers, though the consistency and severity were collected on the faunal diversity of inland wetlands,
of impact are not thoroughly documented. The location of SANBI’s species programme collates a variety of datasets
wastewater treatment works (WWTW) and water treatment related to the distribution of species, from which information
works (WTW) has been partially mapped by DRDLR:NGI on wetland-dependent species can be extracted. In addition,
and complemented by the CSIR (CSIR, 2016b), though still a number of research projects and volunteer atlasing projects
considered to be incomplete. In a recent study, the location provide access to fish, bird and frog data for South Africa
of aquaculture farms is in the process of being mapped by (Minter et al., 2004; UCT, 2010; Botts et al., 2011; SAIAB, 2016).
the Department of Agriculture, Forestry and Fisheries and Records on aquatic invertebrates are curated by the Albany
the Department of Environmental Affairs (DAFF, 2012; Museum in the National Freshwater Invertebrate collection
Kellerman and Snyman-Van der Walt, 2017; DAFF and DEA, whereas the distribution of the habitat of these invertebrates
in prep.). The hydrology of the Ekurhuleni Municipality has has been modelled at a national scale (Thirion, 2016). Red Data
been mapped, with inclusion of detailed data of infrastructure assessments of inland water-dependent species including fish,
Table 1
Number and types of spatial datasets received for the South African National Wetland Inventory
Grouping of datasets National EC FS GT KZN LP MP NC NW WC Islands
Number of datasets related to the extent of inland wetland types
Springs 2 1 1
Rivers 3 1 1
Wetlands 8 4 1 5 10 4 3 8 1 6 1
Artificial/transformed 3
Number of datasets related to species
Fauna
Flora 4
Invasives 2
Number of datasets related to regional divisions
Climatic regions 2
Drainage boundaries 3
Ecoregions 2
Geomorphological regions 1
Water source priority regions 1
Substrate 2
Number of datasets related to other aspects of inland wetlands
Water quality 2
Monitoring points 1
Ownership 1
Protected areas 1
EC = Eastern Cape; FS = Free State; GT = Gauteng; KZN = KwaZulu-Natal; LP = Limpopo; MP = Mpumalanga; NC = Northern Cape; NW = North
West; WC = Western Cape. Islands = Marion and Prince Edward Islands of South Africa. Municipal and sub-provincial data sets are grouped into
provinces.
http://dx.doi.org/10.4314/wsa.v44i2.05
Available on website http://www.wrc.org.za
ISSN 1816-7950 (Online) = Water SA Vol. 44 No. 2 April 2018
Published under a Creative Commons Attribution Licence 187insects, molluscs, crustaceans, reptiles, amphibians, water- regions (Rowntree and Wadeson, 1999; Partridge et al., 2010).
birds, mammals and aquatic plants were done by freshwater Two landform datasets were previously used for the landscape
ecoregion of southern Africa by the International Union for setting classification of inland wetlands at Level 3, and have
Conservation of Nature (IUCN) (Darwall et al., 2009; Holland previously been included for consideration in NFEPA and
et al., 2012). For many of the faunal assessments, the geographic NWM4, and have not been listed in this data audit. These
sampling bias remains to be assessed and Red Data list include the landforms modelled by the Agricultural Research
assessments completed for the NBA 2018. Council (ARC) and CSIR (Land Type Survey Staff, 1972–2006;
Two databases of invasive floral species have been collated Van Deventer et al., 2014), which both require refinement.
in South Africa, including the Southern African Plant The availability of other substrate data has been noted in the
Invaders Atlas (SAPIA) and the Kotzé database (Henderson, data audit too, though many of these datasets are mapped at
1979–1998; Kotzé et al., 2010). These collections have mapped too broad a scale for the purpose of inland wetlands (≥ 1:250
invasive floral species for all ecosystems at a 1:50 000 scale 000). These include the land types and soils data from the ARC
and, although not limited to inland wetlands, could provide as well as alluvial geology data (Soil Survey Staff, 1972–2010.;
information on the likelihood of occurrence of invasive species Land Type Survey Staff, 1972-2006; FAO ISRIC, 2004; Council
within a certain region. A number of projects are also under for Geoscience (CGS), 2017).
way for mapping invasive species at regional scale, using remote In addition to the site-specific and regional characterising of
sensing by the South African National Space Agency and wetlands, a number of datasets are important for the assessment
universities on agricultural weeds (Parthenium hysterophorus of the headline indicator ‘Protection Level’ of the NBAs as well
weed in KZN; Lantana camara in LP) and Prosopis glandulosa as general management and planning (Nel et al., 2011; Driver
(mesquite) which invades wetland habitats. WorldView-2 et al., 2012). These include the South African Protected Areas
imagery has shown promise for mapping mesquite in the Database (SAPAD) and conservation areas in the South African
NC (Adam et al., 2017). In terms of invasive faunal species, Conservation Areas Database (SACAD) that is maintained at
comprehensive records at national scale for invasive faunal a national level by the Department of Environmental Affairs
species in the inland aquatic domain are deficient. The South (DEA, 2017). Land parcel information is freely available through
African Institute for Aquatic Biodiversity (SAIAB) is custodian the Chief Surveyor-General (http://csg.dla.gov.za) and land
of the records of invasive fish species in the country (SAIAB, ownership information can be obtained through the Registrar of
2016). Research on invasive faunal species in the inland aquatic Deeds (www.deed.gov.za), but requires payment.
domain remains dispersed and dependent on researchers or
institutions with interest in this domain (Faulkner et al., 2015). Nature of the river datasets of South Africa
Other than the datasets which contribute site-specific
information and data to inland wetlands, datasets of the broad A rivers network GIS layer is required in order to map and
environmental setting within which inland wetlands occur classify the different river ecosystem types across the country.
contribute to the understanding of the context of the wetlands. The Department of Water Affairs (now the Department of
These include datasets related to climatic regions (Midgley et Water and Sanitation) 1:500 000 river network was used as
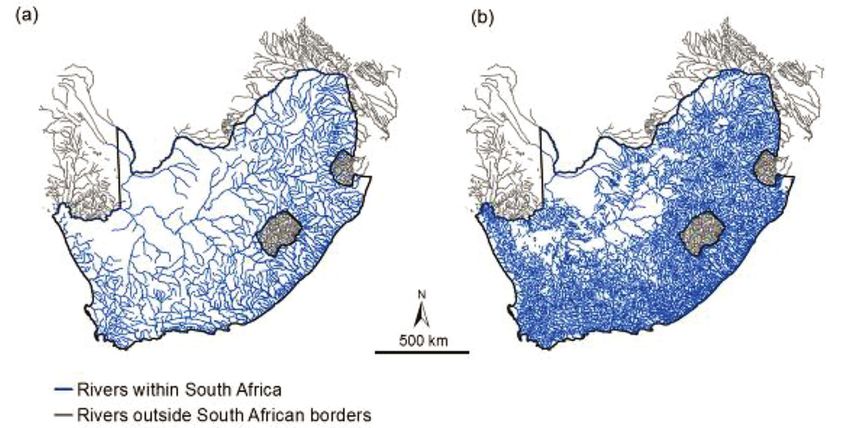
al., 1994; Schulze et al., 1997; Schulze, 2007; Middleton and a base dataset for the NFEPA project (DWA, 2006) (Fig. 1).
Bailey, 2008), drainage regions (Nel et al., 2011; Weepener et al., Ninety-seven coastal rivers which were associated with the
2012; Maherry et al., 2013), and strategic resource areas (Colvin NFEPA estuaries were also added from the 1:50 000 rivers
et al., 2013; Nel et al., 2017), as well as geomorphological dataset (DLA:CDSM, 2006). A combination of the NFEPA
Figure 1
South Africa’s 1:500 000 river network showing (a) main rivers and (b) main rivers and their tributaries. Rivers in grey are shared
rivers in neighbouring countries
http://dx.doi.org/10.4314/wsa.v44i2.05
Available on website http://www.wrc.org.za
ISSN 1816-7950 (Online) = Water SA Vol. 44 No. 2 April 2018
Published under a Creative Commons Attribution Licence 188and additional 1:50 000 rivers which flow into estuaries is with macro-estuaries and will make use of the NFEPA river
in the process of compilation. This dataset was coded to type dataset (Nel et al., 2011), longer-term priorities beyond this
distinguish quaternary catchment mainstems (77 538 km) and national assessment will include research on an improved river
tributaries (95 716 km). Mainstems are rivers that pass through ecosystem type classification map.
a quaternary catchment into a neighbouring quaternary
catchment. In situations where no river passes through the Extent and nature of mapping approaches for inland wetlands
quaternary catchment, the longest river system was chosen as
the mainstem. All other rivers on the 1:500 000 rivers GIS layer Between 2009 and 2017 four datasets which depict the extent
were considered tributaries. Typically, tributaries nest within a of inland aquatic ecosystems were generated in South Africa
single quaternary catchment (Nel et al., 2011). at a country-wide scale (Table 2). Two of these were generated
The 1:500 000 river network is classified into 223 subtypes from Landsat imagery for 1990 and 2014 (GTI, 2015; GTI,
for the NBA 2011 (Nel et al., 2011). These river ecosystem types 2016), one using heads-up digitising from fine-scale colour
can be regarded as coarse-filter surrogates of biodiversity, orthophotography of the years 2012 and 2013 (DRDLR:NGI,
conserving the diversity of many common and widespread 2016) and the NFEPA wetlands which combined wetlands
species, and their associated habitats. They are components of from various sources, including remote sensing, modelled and
rivers with similar physical features such as climate, flow and fine-scale mapped data (Nel et al., 2011; Van Deventer et al.,
geomorphology. Under natural conditions, river ecosystem 2016). The extent of the datasets shows the fine-scale mapped
types are expected to share similar biological response wetlands and the combined NFEPA wetlands dataset to contain
potential. They are comprised of distinct combinations of more than double the extent of wetlands derived through
Level 1 ecoregions (Kleynhans et al., 2005), flow variability image classification of Landsat data. This can be ascribed to
descriptions and slope categories (Rowntree and Wadeson, the differences in spatial resolution of Landsat at 30 m spatial
1999; Rowntree et al., 2000; Moolman, 2008). Specifically, resolution, compared to the 50 cm spatial resolution images
delineation included 31 Level 1 ecoregions and four slope used by the DRDLR:NGI in heads-up digitising. The remote-
categories (mountain streams, upper foothills, lower foothills sensing products provide information on historical extent and
and lowland rivers). Flow variability was broadly described seasonality of wetlands, as well as an indication of whether the
using two categories: permanent (perennial and seasonal rivers) wetlands are natural or artificial in nature. The fine-scale data
and not permanent (ephemeral rivers) from the DRDLR:NGI. from the DRDLR:NGI also provides information on whether
Whilst NBA 2018 will update the NFEPA rivers network GIS wetlands are natural or artificial, though seasonality and
layer with additional 1: 50 000 river types that are associated historical extent are not provided.
Table 2
Extent of inland wetlands (ha) contributed per institution type to the National Wetland Map 5
Percentage of
Dataset Sub-class Surface area (ha)
South Africa (%)*
NLC 2013/4 Water seasonal 63 152.19 0.05
Water permanent 391 955.49 0.32
Wetlands 1 018 745.82 0.83
Total: 1 473 853.50 1.21
NLC1990 & 2014 Man-made water 1990 only 68 474.88 0.06
Man-made water 2014 only 62 871.03 0.05
Man-made water 1990 and 2014 237 753.63 0.19
Mining water 1990 only 8 430.12 0.01
Mining water 2014 only 6 353.19 0.01
Mining water 1990 and 2014 3 734.37 0.00
Natural water (including shadows) 1990 only 178 384.59 0.15
Natural water (including shadows) 2014 only 33 655.14 0.03
Natural water (including shadows) 1990 & 2014 105 400.98 0.09
Total: 705 057.93 0.58
Artificial 528 188.00 0.43
NFEPA wetlands (NWM4) Natural 2 152 118.00 1.76
Total: 2 680 306.00 2.20
Artificial 529 252.70 0.43
DRDLR:NGI, 2016 Natural 3 152 249.92 2.58
Total: 3 681 502.63 3.02
*Calculated from a shapefile totalling 122 081 147.5 ha for South Africa
http://dx.doi.org/10.4314/wsa.v44i2.05
Available on website http://www.wrc.org.za
ISSN 1816-7950 (Online) = Water SA Vol. 44 No. 2 April 2018
Published under a Creative Commons Attribution Licence 189At a sub-national scale, the approaches to wetland data Snaddon and Day, 2009). South African National Parks
capturing were similar to the national-scale approaches, (SANParks) have contributed > 6 000 ha of wetland data, of
including remote-sensing image classification as well as fine- which the majority was mapped and typed based on in-field
scale mapping of wetlands at various scales (Appendix 1). Few verification (> 90 % of the dataset) (Hayes et al., 2016; Job et
datasets classified wetlands based on image classification other al., 2016; Fisher et al., 2017a; Fisher et al., 2017b; Fisher et al.,
than those generated by GeoTerraImage (Pty) Ltd (GTI) for 2017c; Fisher et al., 2017d).
provincial and municipal departments (GTI, 2010). Only one Firstly, the fine-scale mapped inland wetlands from
study assessed the occurrence of wetlands in the Maputaland institutions other than the DRDLR:NGI were assessed in more
Coastal Plain of the KZN Province (Grundling et al., 2013a; detail. Of the non-DRDLR:NGI wetland data received, more
Grundling et al., 2013b). Similar to the Land Cover data for than half of the GT Province (64%) and nearly half of the MP
2013/4, the image classification of the Maputaland Coastal (47.2%) and WC Provinces (47.2%) were mapped by institutions
Plain resulted in an 80% overall accuracy, using stratified- other than the DRDLR:NGI (Fig. 2; Fig. 3). Wetlands mapped
random sampled points in an error matrix. at a fine-scale for other provinces covered less than 12% of their
The wetland datasets generated through predictive surface areas.
modelling from DEMs ranged in extent from municipal to Very few sub-quaternary catchments (SQ4s) were mapped
provincial and country-wide scales. Although initial work in full, with wetlands typed to categories which could be
focused on predicting occurrence or extent of wetlands or fully translated to the HGM types of the recent Classification
the probability thereof, recent advances showed interest System, and of which the extent and types were verified
in typing wetlands to hydrogeomorphic units, or Level in-field (Fig. 2; Fig. 3). The WC was the only province with
4A of the Classification System. Many of the studies were nearly 35 000 ha (< 1% of the country) of wetlands falling
primarily dependent on the 90 m SRTM DEM and other into this category (Category A). For 7.1% of the country, the
course-resolution data related to environmental variables full extent of the SQ4 was mapped and typed, though in-field
(Hiestermann and Rivers-Moore, 2015; Van Deventer et al., verification was not done or only partly done (Category
2016; Melly et al., 2016). The wetland occurrence modelled B). Of the remaining, 8.2% of the country had partially
for KZN showed a 0.853 area under the curve accuracy, mapped SQ4s of which the typing was partially to fully done
whereas those modelled for the semi-arid Nelson Mandela Bay (Categories C, D and E), whereas < 1% of the surface area of
Metropolitan Municipality were 0.68 (Hiestermann and Rivers- the country had SQ4s where wetlands were mapped but not
Moore, 2015; Melly et al., 2016). The comparison between the typed (Category F). For the majority of the country (84%), the
NFEPA wetlands and wetlands mapped at a fine scale for two wetlands mapped by the DRDLR:NGI are the only available
districts showed < 50% agreement on the extent of wetlands dataset for wetland representation and inland aquatic
(1.2% and 42.2%) and that fine-scale mapping contributed ecosystem typing.
46% of wetlands to the City of Cape Town Metropolitan About half of the sub-national datasets (excluding
Municipality not mapped by the NFEPA project. DRDLR:NGI) received had reports associated with the project
and less than a third had metadata information associated with
Extent and nature of fine-scale wetland data for South Africa the shapefile. Very few reports and metadata contained detailed
information about the wetland data capturing process and the
Over five million hectares of fine-scale mapped wetland type, scale, date and sources of images used. Metropolitan
data were received from various governmental, research and municipalities often had orthophotography available for
private institutions (Table 3). The largest contribution to the
wetlands map (73%) was received from the DRDLR:NGI,
of which a total of 1 552 195 ha of natural wetlands were
Table 3
mapped in 2006 and 3 152 250 ha in 2016 (DLA:CDSM,
Total amount of fine-scale mapped wetlands (ha) received
2006; DRDLR:NGI, 2016). The second-largest contribution from various South African institutions
was received from other research institutions (594 089 ha or
Percentage
12%), including the Mpumalanga Highveld Wetlands Project
Institution type ha* of total
(590 391 ha or 99% of the data received from other research received (%)
institutions) (Mbona et al., 2015), the Nelson Mandela
Bay dataset (Schael et al., 2015), the project on peatlands National Government
3 681 502.6 72.8
(Grundling et al., 2017) and research in progress (Rebelo, (DRDLR:NGI)
2017). Other national, provincial and local municipalities Research institutions and
594 089.0 11.7
added almost 250 000 ha of wetland data, which included, related projects
inter alia, the Working for Wetlands data from SANBI Private companies 308 371.5 6.6
between 2004 and 2013 and the Square Kilometre Array (SKA)
project (CSIR, 2016a). Wetland data from private companies Provincial and local
221 800.3 4.4
amounted to more than 300 000 ha of wetlands mapped at a governments
fine scale. Other than the Mpumalanga Highveld project, the CAPE programme 181 875.6 3.6
Cape Action for the Protection of the Environment (CAPE)
Metropolitan municipalities 64 623.2 1.3
programme was the single project with the second-highest
area of mapped wetlands, of 181 876 ha in the WC Province. SANParks 6 016.8 0.1
Five of the eight South African metropolitan municipalities Total amount excluding
contributed a total of 64 623 ha of inland wetlands, including 1 376 776.5
DRDLR:NGI
City of Cape Town, City of Johannesburg, City of Tshwane,
City of Ekurhuleni and eThekwini (Grundling, 2005a; Total 5 058 279.1
Grundling, 2005b; Environomics, 2007; Batchelor, 2009; *Values rounded to the first decimal
http://dx.doi.org/10.4314/wsa.v44i2.05
Available on website http://www.wrc.org.za
ISSN 1816-7950 (Online) = Water SA Vol. 44 No. 2 April 2018
Published under a Creative Commons Attribution Licence 190Figure 2
Contributions from institutions to natural inland wetlands. See Fig. 3 for a description of the legend key
Figure 3
Categorisation of sub-quaternary (SQ4) catchments of South Africa according to the extent, typing and in-field verification of wetland data received for
the national wetland map, given as a percentage of the surface area of each province
http://dx.doi.org/10.4314/wsa.v44i2.05
Available on website http://www.wrc.org.za
ISSN 1816-7950 (Online) = Water SA Vol. 44 No. 2 April 2018
Published under a Creative Commons Attribution Licence 191wetlands mapping (Grundling, 2005a; Snaddon et al., 2009; four provinces, the DRDLR:NGI mapped between 2 and 3% of
Batchelor, 2009), whereas other studies relied on SPOT and the surface area of the province as wetlands in 2006 (FS, GT,
Google Earth. Google Earth imagery has been released since KZN and NC), whereas about 1.6% of the surface area of MP
June 2001 and offers historical images for South Africa dating was mapped as wetlands in 2006, and approximately 1% for
back to approximately 1984 (Europa Technologies United the EC, NW and WC Provinces. The LP Province showed the
States Department of State Geographer, 2010). The SKA project lowest percentage of its surface area mapped as wetlands (1%).
indicated, however, that the SPOT 2011 mosaic was used for In three of the nine provinces, the DRDLR:NGI mapped more
mapping wetlands (CSIR, 2016a). The appropriateness of the than 2% of the surface area as wetlands in 2016, in addition to
season during which the image was taken was not assessed in the wetlands mapped in 2006 (Fig. 5). Although the percentage
any study for wetland mapping. surface area per province mapped as wetlands in 2016 was
The scale used in heads-up digitising, where indicated, lower for the remaining provinces, all provinces showed an
often ranged from 1:5 000 to 1:20 000. None of the reports increase in the number of wetlands mapped. The extent of
indicated the method and type of verification done during wetlands mapped in 2016 for the WC contributed the most to
in-field visits, except for the City of Tshwane and City of Cape the 2006 data. The surface area of the LP Province mapped by
Town, of which the latter reports the accuracy of presence and the DRDLR:NGI in both 2006 and 2016 totalled nearly 1%, the
type (75 and 95% respectively) (Grundling, 20 05a; Snaddon lowest of all the provinces.
et al., 2009). The method (GPS or auger) used by SANParks For most of the provinces, the ‘dam’, ‘dry water course’,
in collaboration with Cape Nature and other organisations, ‘pans’ and ‘vlei’ categories dominated the feature type classes
added to the improvement of the NWM4 through in-field visits mapped by the DRDLR:NGI in 2006 and 2016 (Fig. 6). A
and updates of the extent and types of the NFEPA wetlands large number of these feature types can be translated to
for three SQ4s (IDs 9428, 9433, 9434) of the Agulhas National hydrogeomorphic types of the Classification System at Level 4A
Park as well as the Mountain Zebra and Bontebok National (Table 4) and therefore form an important base dataset to the
Parks (Job et al., 2016; Fisher et al., 2017a; Fisher et al., 2017b; wetland data contributed by the DRDLR:NGI to the NWM.
Fisher et al., 2017c). SANParks is pursuing further work in the
remainder of their national parks as well as the SQ4’s in which Condition indices of rivers and inland wetlands
they reside.
Secondly, the DRDLR:NGI fine-scale wetland dataset was Two comprehensive national assessments of the ecological
explored in more detail. The DRDLR:NGI hydrological polygon condition of South Africa’s rivers have been undertaken
datasets (wetlands) are issued at 3-year intervals and data for by the DWS, the first in 1999 (Kleynhans, 2000) and the
the country were available for the years 2006, 2009, 2012 and second in 2011 (DWS, 2014). In each case, an ‘aggregated
from 2016. For the purpose of the NBA 2018 project, only the ecological condition category’, called Present Ecological
2006 and 2016 data were used as these were readily available State (PES), was developed based on an expert assessment
as merged and cleaned data sets (Fig. 4). Some of the natural of a set of 6 underlying indicators of ecological condition.
hydrological data mapped by DRDLR:NGI were however river Four of these (flow, water quality, instream habitat and
extents and not wetlands and would require evaluation before stream bank/riparian habitat) were consistent across the
use in the NWM. 1999 and 2011 assessments. The aggregated ecological
The hydrological data mapped by the DRDLR:NGI in 2006, condition category reflects the degree of modification from
covered up to 3% of the surface area of a province (Fig. 5). In a reference condition of natural, and ranges from natural
Figure 4
Extent of artificial and natural wetlands mapped by DRDLR:NGI in 2006 and 2016
http://dx.doi.org/10.4314/wsa.v44i2.05
Available on website http://www.wrc.org.za
ISSN 1816-7950 (Online) = Water SA Vol. 44 No. 2 April 2018
Published under a Creative Commons Attribution Licence 192Figure 5
Percentage surface area of each province mapped by the DRDLR:NGI in 2006 and 2016, respectively
Figure 6
Percentage feature types per province mapped by the DRDLR:NGI (combined data set of 2006 and 2016). Feature types were
consolidated for display purposes.
(A) to critically modified (F). The reference condition Wetlands that were associated with riverine systems in a poor
is the ecological condition that existed before major condition (D, E or F) were assigned the PES category of the
human modifications to the water resource (the river) and river, whereas condition of a non-riverine wetland and the
surrounding landscape. For the purposes of NBA 2018 the remaining riverine wetlands were ranked primarily based
2011 PES dataset (i.e. flow, water quality, instream habitat, on the percentage of transformed land within a number of
stream bank/riparian habitat and, longitudinal and lateral buffer distances from the wetland (Nel et al., 2011; Driver et
connectivity) will be supplemented with modelled data. This al., 2012). The method allows for a practical implementation of
dataset will then be used to assess the degradation of rivers condition ranking at a national scale, and allows back-casting
across the country. where historical land cover data becomes available, such as the
In the NFEPA and NBA projects of 2011/2, the PES 1990 land cover data set, generated by GTI. The availability
categories were used not only for the rivers, but also for the of the 1990 and 2013/4 data allows furthermore for change
wetlands as a relative index of the condition of wetlands. analysis in condition of the surrounding landscape, although
http://dx.doi.org/10.4314/wsa.v44i2.05
Available on website http://www.wrc.org.za
ISSN 1816-7950 (Online) = Water SA Vol. 44 No. 2 April 2018
Published under a Creative Commons Attribution Licence 193coordination and availability of all datasets related to other
Table 4
components of the inventory, including species, condition,
Translation of DRDLR:NGI hydrological feature types to HGM
regions and monitoring points, is crucial for the improvement
wetland types of the Classification System
of the inventory at all levels. Of these, the extent and the
DRDLR:NGI feature type Possible HGM type representation of land-use impacts for condition modelling are
Closed reservoir (Artificial) considered the top priorities.
River ecosystem types were used by the NBA 2018 to
Dam (Artificial)
represent the diversity of river ecosystems across the country.
Dry pan Depression They are components of rivers with similar physical features
River or valley-bottom (e.g. climate, flow and geomorphology) and under natural
Dry water course conditions they are expected to share similar biological
wetland
response potential. Ideally, those inland aquatic ecosystems
Fish farm (Artificial) that are currently considered to be in good condition should
River or valley-bottom be selected for the purposes of conserving biodiversity.
Flood bank
wetland These natural ecosystems tend to be more self-sustaining,
thus requiring less conservation management. The cost of
Lake Floodplain
rehabilitating rivers in good condition is also lower than the
Large reservoir (Artificial) cost of rehabilitating modified rivers, and the likelihood of
Marsh Natural – to be determined success is greater (Nel et al., 2011).
The 1:500 000 river coverage is now almost stable following
Marsh/vlei Natural – to be determined years of editing procedures, consistency checks, network
Mudflats Natural – to be determined and name verification and a consolidation process. Users do,
Non-perennial pan Depression however, occasionally report minor errors that are related to
shortcomings in the dataset. For example, the reach codes are
Non-perennial river River (channel) not stable (i.e. the Arc Macro Language or AML script currently
Open reservoir (Artificial) clears the code tables each time it runs). The reach code is a
unique identifier for each reach in the stream network. Ideally,
Perennial pan Depression
the reach codes should remain attached to the same reach except
Perennial river River (channel) in the case of additions and splits. In addition, it is necessary
Pool (Artificial / Natural) to check all arcs for errors related to the river names. It must
be noted though that most of the unnamed arcs do not have
Purification plant (Artificial) names on the original 1:50 000 maps. In NBA 2018 certain river
River area (2006) River (channel) names will be corrected to reflect the relevant estuary name. The
greatest discrepancy is in the classification of rivers as perennial,
Salt pan Depression
non-perennial or dry: only 84% of all the SA arcs are the same as
River or valley-bottom the 1:50 000 classes. Recommendations to improve this dataset
Sand bank
wetland include working towards stable reach codes and a comprehensive
Sewerage works (Artificial) hydrological dataset (e.g. include variables such as channel
elevation, stream velocity, connectivity and smoothed river-run
Slimes dam (Artificial) elevation). This would necessitate migrating from ArcInfo to
Swamp Natural – to be determined an ArcGIS geodatabase with vertical topology recorded within
Tailings impoundment (Artificial) the rivers network as well as between the rivers network and
other datasets. Future developments should also include digital
Vlei Natural – to be determined elevation model analysis and applying the updated 1:500 000
Water tank (Artificial) verification and reach allocation procedures to the 1:50 000
coverages (DWAF, 2006).
The use of remote sensing for predicting the occurrence
not the extent of wetlands. The CAPE programme also of wetlands and sub-types in South Africa has to date been
modelled the condition of inland wetlands based on the PES limited to Landsat images. Wetlands modelled using Landsat
categories (Snaddon et al., 2008). A few sub-national, fine-scale and SPOT data in the land cover products of South Africa
wetland datasets have also used the PES scoring for condition compare poorly to inland wetlands mapped through heads-up
assessments of wetlands, and in many cases desktop or rapid digitising. Subsequently this study concurs with existing
assessments were completed (Grundling, 2005a; Snaddon et al., literature that the spatial and spectral resolution of these
2009; Batchelor, 2009). sensors are not optimised for mapping the extent of wetlands
well (Ozesmi and Bauer, 2002; Thompson et al., 2002; Wang
DISCUSSION et al., 2004; Adam et al., 2010; Hestir et al., 2015; Grundling
et al., 2016). Of the literature studied and cited in this work,
Spatial data related to the SAIIAE originate from a multitude to our knowledge no studies have investigated the use of the
of institutions using a variety of approaches, at a range of more recent satellite sensors such as RapidEye, WorldView
spatial scales. National-scale datasets of rivers and wetlands and the Sentinel series for the mapping and typing of
and the monitoring of these are primarily maintained by wetlands. Remote-sensing sensors do provide a broad regional
national government departments (DWS and DRDLR:NGI). overview of attributes of wetlands at regular time intervals
A diverse range of organisations contribute to the mapping of and although the extent of wetlands cannot be mapped well,
regions, species, ownership and protection of wetlands. The regional to global monitoring of open water extent and quality
http://dx.doi.org/10.4314/wsa.v44i2.05
Available on website http://www.wrc.org.za
ISSN 1816-7950 (Online) = Water SA Vol. 44 No. 2 April 2018
Published under a Creative Commons Attribution Licence 194as well as biophysical parameters of biomass and nutrients Our study was limited in the review of available data
would be able to contribute a broader view of inland aquatic for the SAIIAE and did not include an extensive review and
ecosystem state. The use of the more recently-launched data capturing of historical inland wetland data. A number
optical sensors as well as radar and radiometry sensors should of resources exist in the form of hard-copy documents
therefore be investigated to assess whether the red-edge band with coordinates of inland wetlands, which would require
and finer spatial resolution characteristics of these sensors digitising, for example those of Noble and Hemens (1978),
outperform the traditional SPOT and Landsat sensors. Begg (1988), Cowan and Van Riet (1998) and Dely et al. (1999),
The DRDLR:NGI forms a significant base dataset for to name but a few. In addition a wealth of greyscale satellite
the inland wetlands, contributing approximately 73% of the imagery is available from the war period (1940) for parts of
available inland wetlands datasets that were received for the South Africa and curated by the DRDLR:NGI. Mapping the
NWM5 within the past year. Categories of the DRDLR:NGI historical extent of inland wetlands could contribute a better
hydrological data can be translated to the HGM types. In understanding of the amount of wetlands lost or degraded in
addition, the DRDLR:NGI is already registered as a data parts of South Africa. To our knowledge, Begg (1988) is one of
custodian of the topographic core datasets under the South the most comprehensive assessments done at a regional scale,
African Spatial Data Infrastructure (SASDI) Act (RSA, 2003), quantifying the loss of wetlands in the Mfolozi catchment.
with standards for the capturing of data and obligations to The use of multi-seasonal imagery across various annual
correct errors noted by users. Many other institutions do, hydroperiod cycles should be used for visual interpretation
however, also contribute to the fine-scale mapping of inland when capturing inland wetlands. Single-season imagery
wetlands across South Africa. Inconsistencies in mapping does not always offer a view of the maximum extent of a
methods, sources of imagery and typing of wetlands may wetland, following a peak rain season, which may be once
result in differences in extent and type of wetlands which in several years for arid systems. Thus far, the updates of the
will be challenging and time-consuming to resolve. The National Wetland Map had insufficient time to investigate
diversification of inland wetlands work across institutions, multi-season imagery to ensure that the maximum extent of
however, optimises cost-expenditure, and would be a wetland was captured. These issues remain to be resolved in
particularly valuable for accuracy assessments and monitoring future strategies and standards for either heads-up digitising
which will be ineffective through a national institution. and/or monitoring. The improvement of both the spatial
Quality and assurance of wetland extent and HGM type, resolution, time-series data from multiple seasons and years,
however, remain a concern when sourced from multiple as well as accuracy of environmental data and space-borne
sources, particularly when no wetland expertise was involved. sensors offer new opportunities to investigate modelling and
This study has shown that about 8% of the country has been remote-sensing classification as alternative methods to fine-
mapped and typed to HGM units by wetland specialists (Figs scale mapping in data-poor areas. The approaches should
2 and 3, Categories A and B). The involvement of wetland complement one another in a well-developed strategy for
specialists in the mapping and reviewing of the NWM would updating the National Freshwater Inventory and National
be key for future updates. Lateral collaboration between Wetland Map within a regular seasonal or annual cycle. Rules
DWS, DRDLR:NGI and SANBI for the updates of the NWM for integration of the datasets should be documented with
would be crucial, while vertical collaboration between the choices of updating some parts of the data and integrating
national institutions and other organisations is essential for these in future updates.
verification and monitoring. Since the NFEPA and NBA 2011 projects, a number
Heads-up digitising of wetlands remains the preferred of datasets have been generated which can be used for the
approach at the moment to updates of the National Wetland confirmation or classification of a relative condition index
Map when compared to the remote-sensing modelling for riverine and non-riverine wetlands. These include the
methods. The method of heads-up digitising is more location of WTW, WWTW and aquaculture pond as artificial
accurate, particularly for inland wetlands of smaller extent, wetlands, but also the prevalence of alien invasive species
palustrine wetlands and certain inland wetland types (arid and water pollution. The completeness of these datasets for
systems in particular), compared to modelling or data use at a national level, as well as their appropriateness of use
derived from remote-sensing classification methods. Fine- for modelling condition, should be assessed in future. In
scale mapping of inland wetlands remains an expensive and addition, methods to better represent the temporal variation
time-consuming approach, and a prioritisation strategy and intensity of land-use impacts on wetlands should be
would be required to sequentially and continuously investigated. Although a number of research projects have
update data-poor areas across the expanse of South Africa. investigated the ability of the new space-borne sensors for the
Inland wetlands of 9 municipalities have been mapped classification of invasive species (e.g. Adam et al., 2017), this
for the update of the National Wetland Map 5 during the paper has not attempted to provide a comprehensive review
course of 2016-17, in preparation of NBA 2018. Following of the available literature or datasets in this regard. Further
the completion of NWM5, the data-poor areas should be effort should be made to compile a spatially coherent dataset of
assessed and wetland mapping considered for these areas. pressures on the inland aquatic ecosystems.
Catchments with gaps of inland wetland data falling in the In conclusion, the diversity of information and datasets
Strategic Water Source Areas (SWSA) of South Africa or related to inland wetlands for a South African National
where development pressure is high should be prioritised Wetland Inventory remains dispersed and uncoordinated.
for fine-scale heads-up digitising of inland wetlands (Nel et Effort should be directed toward the collaboration at national
al., 2017). Accuracy assessments should also be prioritised government level needed to coordinate the collation and
within the SWSA and areas of development pressure to curation of wetland data-sets. While a greater amount of
ensure these ecosystems receive proper protection and the funding was allocated within the past 10 years towards
appropriate management strategies. the ecosystem type mapping and improvements thereof, the
http://dx.doi.org/10.4314/wsa.v44i2.05
Available on website http://www.wrc.org.za
ISSN 1816-7950 (Online) = Water SA Vol. 44 No. 2 April 2018
Published under a Creative Commons Attribution Licence 195You can also read