Trade & Investment into Africa 2019 - Cape Town and the Western Cape - Invest Western Cape
←
→
Page content transcription
If your browser does not render page correctly, please read the page content below
Cape Town and the Western Cape
Trade & Investment
into Africa 2019
Contents

1.    Introduction to Trade                                                                           4
2.    South African Trade with Africa                                                                 5
3.    Western Cape Trade with the rest of Africa                                                      9
4.    Western Cape Inward FDI: Sept 2018 capex value reaches USD702m                                 13
5.    Western Europe is the largest source region for FDI                                            14
6.    Services sector attracts 53% of FDI projects                                                   15
7.    46% of companies indicated expansion into Africa at motive for FDI                             16
8.    Cape Town is the 2nd largest destination for inward FDI among South African Cities             17
9.    Western Cape is 2nd largest province for South African FDI to Africa                           18
10.   Africa is the largest destination region accounting for 54% of Western Cape FDI		              19
11.   Western Cape FDI to Africa: Food and Beverages the largest sector by project and real estate the
      largest sector by Capex		                                                                       20
12.   Western Cape FDI to Africa: Retail was the largest activity accounting for 50%                 22

Summary of Survey: Western Cape Companies Business Strategy into the Rest of Africa                  23

Western Cape: A Competitive Place for Business                                                      29
1.    Flight connections: Regional and International                                                 29
2.    Rail Infrastructure                                                                            30
3.    Port Infrastructure                                                                            31
4.    Road Infrastructure                                                                            32
5.    ICT Infrastructure                                                                             32
6.    Proximity to key clients or markets and suppliers                                              33
7.    Presence of embassies/consulates/chambers of commerce                                          34
8.    Trade & tax agreements                                                                         34
9.    Quality of life & Cost of living                                                               35
10.   Electricity cost and access                                                                    36
11.   Economic and political stability                                                               37
12.   Legal protection/enforcement of contracts                                                      38
13.   Financial infrastructure/regulations                                                           38
14.   Availability of incentives                                                                     39

                                                                                                                            3
                                                                                                           Trade and Investment
1.      Introduction to Trade
The Western Cape exported USD9.33bn worth of goods globally and imported USD13.9bn worth of
goods in 2017. The trade deficit is mainly due to the large import of petroleum products, that when
excluded, results in the trade balance reverting to a surplus. The strategic location of the Western Cape,
being home to three important South African ports, makes it the second largest province in terms of
total trade after Gauteng. The Western Cape’s total share of South African exports was 10.46% in 2017.

The Western Cape has advantageous access to world markets through preferential trade agreements
between South Africa and other major markets such as Europe and the United States. South Africa
is also a member of the Southern Africa Development Community (SADC), the Trade Development
and Cooperation Agreement (TDCA) and the Southern African Customs Union (SACU) among other
agreements. The international trade regime has certainly seen some reorganisation of late. To the
North, Brexit has cast widespread uncertainty across almost every aspect of cross-border trade and
investment involving the UK. To the West, global supply chains have been unsettled by the renegotiation
of NAFTA (now the USMCA) and US tariffs on steel and aluminium. To the East, China’s escalating trade
war with America will have far-reaching economic repercussions.

The potential showstopper, however, is happening right here on the doorstep of the Western Cape, with
the signing of the African Continental Free Trade Area (AfCFTA) Agreement earlier in 2018. The AfCFTA
aims to establish a free trade area spanning the 55 Member States of the African Union (AU). It was
launched in March 2018 and has been signed by 49 countries. The AfCFTA includes undertakings by
Member States to progressively eliminate tariffs and non-tariff barriers to trade in goods and liberalise
trade in services; cooperate on investment; intellectual property rights; competition policy; customs
matters; and to establish a dispute settlement system.

The AfCFTA is aspirational by nature; it is a framework agreement that will systematically be implemented
by building upon existing Regional Economic Communities (RECs) and preferential trade arrangements.
The Agreement establishes an agenda by which further technical alignment and trade liberalisation will
take place. The Agreement enters into force once ratified by 22 countries. Although South Africa is said
to ratify the AfCFTA by the end of 2018, most of the details are only set to be negotiated over the coming
years. Once in force and ratified the Agreement will become legally binding for South Africa.

Successful implementation of this agreement holds the potential to change the face of intra-African
trade and facilitate enormous investment into the Continent. The AfCFTA will cover a market of 1.2
billion people, projected to reach 2.5 billion by 2050, and a combined gross domestic product (GDP) of
more than USD3.4 trillion. The economy of Africa as a whole is the second fastest growing region in the
world; however intra-Africa trade remains low (Afdb, 2017). In 2016 intra-Africa trade constituted only
18% of Africa’s total trade with the globe (Tralac, 2018). The United Nations Economic Commission
for Africa therefore estimates that the AfCFTA has the potential to boost intra-Africa trade by 52% by
eliminating tariffs. They also predict that the figure would double through the elimination of non-tariff
barriers.

In Africa, the North South Corridor is the busiest transport network in the Tripartite Area, stretching from
Durban to Dar es Salaam. At the Beitbridge border crossing between South Africa and Zimbabwe delays
with documentation frequently last two or more days. This illustrates why successful implementation
of the AfCFTA is so crucial to boosting intra-African trade. Tariff liberalisation matters, but of equal
importance are those measures included in the agreement that ease the movement of goods across
borders. The AfCFTA holds immense potential for economic development on the Continent. The
realisation of this potential depends on implementation and political will.

South Africa is seen to be a geographic gateway to the African market and the Western Cape is
strategically positioned for African market access. The province also offers opportunities for oil and gas
service providers to the West African markets. Africa is still the largest opportunity for Western Cape
exports, with the Continent overtaking Europe as the number one destination for Western Cape exports
in recent years. To give this context, Africa was the destination region for the largest share of Western
Cape exports (USD3.35bn) in 2017, with SACU (USD1.8bn) and SADC (USD973m) being the second
and third largest sub regions for Western Cape exports after the European Union (USD2.48bn). The rest
of Africa is also the largest destination for investment by Western Cape companies, accounting for 54%
of outward FDI investment from 2008 – September 2018. In addition, an estimated 46% of international
companies investing in the Western Cape indicated that they intended on using the Western Cape as a
springboard into Africa.

4
Trade and Investment

Out of the top fifteen Western Cape destination markets, graphed below, almost half of them (7) are
       African markets. The African market with the highest growth in 2017 was Swaziland with 28% growth,
       followed by Kenya (24.1%) and Zambia (15.1%). The largest increase in USD value terms out of the
       African countries was Kenya, with a growth of USD42.8m from 2017, followed by Swaziland with a
       growth of USD40.6m.

       FIG 1. WESTERN CAPE EXPORT MARKETS, 2016 & 2017

                                                    Namibia                                                                              3.3
                                          United Kingdom                                                                                 8.2
                                               Netherlands                                                                              23.9
                                              United States                                                                              4.5
Country (2016-2017 growth rate %)

                                                  Botswana                                                                               7.7
                                                   Germany                                                                              -0.6
                                                         China                                                                          44.7
                                    United Arab Emirates                                                                                30.0
                                                       Kenya                                                                            24.1
                                                     Zambia                                                                             15.1
                                                    Lesotho                                                                             14.6
                                                      Angola                                                                            14.4
                                                  Swaziland                                                                             28.0
                                                Hong Kong                                                                               13.1
                                                      Russia                                                                            49.1
                                                                 0,0      200,0   400,00 600,0    800,0 1000,0 1200,0 1400,0 1600,0 1800,0

                                                                                            2016 (USDm)      2017 (USDm)

       Source: Quantec, 2018

       2.                                 South African Trade with Africa
       The figure below illustrates the trend in South Africa trade with the rest of Africa from 2013 to 2017.
       South Africa was a net exporter of goods from 2013 to 2017. In 2017, exports to the rest of the African
       nations totalled USD23.27bn, some 9% higher than that seen in 2016, while imports fluctuated at
       an increasing rate from 12.25% in 2013, reaching a maximum of USD13.27bn in 2014 and finally
       declining to USD8.5bn in 2017. The decline in exports is mainly due to a decline in the value of exported
       motor vehicles.

       FIG 2. SOUTH AFRICAN TRADE WITH THE REST OF AFRICA, 2013-2017

                                                    30
                                                    25
                                                    20
      Value (USDbn)

                                                    15
                                                    10
                                                     5
                                                     0
                                                                  2013               2014            2015              2016     2017
                                    Total exports (USDbn)         27,3              27,59            21,72             21,35   23,27
                                    Total imports (USDbn)         12,25             13,27            10,41             8,03     8,54
                                    Trade balance (USDbn)         15,10             14,32            11,30             13,32   14,72

       Source: Trademap, 2018

                                                                                                                                                                5
                                                                                                                                               Trade and Investment
In 2017, the largest exports to the rest of Africa were refined petroleum oil (USD1.5bn), motor vehicles
for the transport of goods (USD826m), and electrical energy (USD645m). The largest imports from
the rest of Africa was crude petroleum oil (USD3.3bn), mixtures of scented essence (USD381m), and
gold (USD300m).

     TOP 10 SOUTH AFRICAN EXPORTS TO THE REST         TOP 10 SOUTH AFRICAN IMPORTS FROM THE REST
                  OF AFRICA, 2017                                   OF AFRICA, 2017
                             VALUE                                             VALUE
                                       % GROWTH                                           % GROWTH
 RANK       COUNTRY           2017                    RANK     COUNTRY          2017
                                       2013-2017                                          2013-2017
                            (USDm)                                            (USDm)
          Refined                                            Crude
 1                           1,542.5           -4.6    1                       3,321.2           -10.2
          petroleum oil                                      petroleum oil
          Motor vehicles
          for the
                                                             Mixtures
          transport of
 2                            825.5          -12.7     2     of scented          381.2             5.3
          goods, incl.
                                                             essence
          chassis with
          engine and cab
          Electrical
 3                            645.1            6.1     3     Gold                300.1
          energy
                                                             Petroleum
          Chromium
                                                             gas and other
 4        ores and            579.5          143.7     4                         286.9             6.3
                                                             gaseous
          concentrates
                                                             hydrocarbons
          Coal;
          briquettes,
                                                             Refined
 5        ovoids and          529.5           11.7     5                         210.8             -5.3
                                                             petroleum oils
          similar solid
          fuels
                                                             Cane or beet
                                                             sugar and
 6        Diamonds            519.7           15.1     6                         209.9            10.7
                                                             chemically
                                                             pure sucrose
          Motor cars
          and other                                          Coal;
          motor vehicles                                     briquettes,
 7        principally         380.7            -8.4    7     ovoid’s and         195.1            66.1
          designed for                                       similar solid
          the transport                                      fuels
          of persons,
          Parts suitable
 8        for moving          309.9            -2.6    8     Diamonds            166.6             0.0
          machinery
                                                             Electrical
 9        Maize or corn       275.2           15.5     9                         161.8             2.2
                                                             energy
          Flat-rolled
          products of
          iron or non-                                       Live bovine
 10                           266.3            -5.1    10                        149.6            52.2
          alloy steel, of                                    animals
          a width >= 600
          mm
 TOTAL EXPORTS               23,265            -2.8   TOTAL IMPORTS              8,542            -6.2

Source: Trademap, 2018

The top African destination countries for South African exports were Botswana (USD3.84bn), Namibia
(USD3.57bn) and Mozambique (USD2.89bn). Top source countries for South African imports from the
rest of Africa were Nigeria (USD1.71bn), Angola (USD1.34bn) and Swaziland (USD1.22bn).

6
Trade and Investment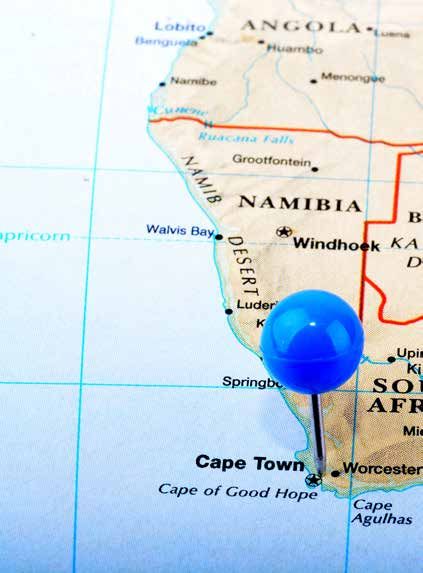
TOP 10 AFRICAN COUNTIRES FOR SA EXPORTS, 2017          TOP AFRICAN COUNTRIES FOR SA IMPORTS, 2017
                            VALUE                                               VALUE
                                         % GROWTH                                         % GROWTH
 RANK        COUNTRY         2017                      RANK       COUNTRY        2017
                                         2013-2017                                        2013-2017
                           (USDbn)                                             (USDbn)
1         Botswana         3.84        -4.9           1         Nigeria       1.71       -8.7
2         Namibia          3.57        -2.3           2         Angola        1.34       -11.3
3         Mozambique       2.89        6.2            3         Swaziland     1.22       2.0
4         Zambia           2.25        -2.8           4         Mozambique    0.90       -5.0
5         Zimbabwe         2.09        -2.2           5         Namibia       0.84       12.7
6         Lesotho          1.35        -2.4           6         Botswana      0.42       2.0
7         Swaziland        1.28        -2.5           7         Lesotho       0.31       4.1
          Democratic
8         Republic of      0.88        -9.0           8         Zambia        0.22       -9.0
          Congo
9         Kenya            0.71        1.1            9         Mauritius     0.17       -3.2
10        Angola           0.58        -8.2           10        Zimbabwe      0.17       -4.3
TOTAL EXPORTS              255.17      -2.8           TOTAL IMPORTS           339.71     -6.2

Source: Trademap, 2018

The top products (HS4) exported by South Africato the top five African export destination markets are
shown below:

Botswana
•       Refined petroleum oils (USD587m)
•       Diamonds (USD519m)
•       Motor vehicles for the transport of goods, (USD96m)
•       Motor cars and other motor vehicles principally designed for the transport of persons (USD83m)
•       Parts and accessories for tractors, motor vehicles for the transport of ten or more persons,
        (USD53m)

 Namibia
    •    Motor vehicles for the transport of goods, (USD212m)
    •    Refined petroleum oils (USD143m)
    •    Motor cars and other motor vehicles principally designed for the transport of person (USD141m)
    •    Electrical Energy (USD122m)
    •    Medicaments (USD92m)

Mozambique
•       Chromium ores and concentrates (USD572m)
•       Electrical energy (USD269m)
•       Copper ores and concentrates (USD175m)
•       Ferro-alloys (USD139m)
•       Coal (USD101m)

Zambia
•       Refined petroleum oils(USD110m)
•       Mineral or chemical nitrogenous fertilizers(USD86m)
•       Motor vehicles for the transport of goods, (USD69m)
•       Pumps for liquids, (USD63.4m)
•       Parts for moving machinery (56m)

                                                                                                                           7
                                                                                                          Trade and Investment
Zimbabwe
•    Electrical energy(USD126m)
•    Refined petroleum oils (USD72.8m)
•    Motor vehicles for the transport of goods, (USD66m)
•    Maize (USD63m)
•    Mineral or chemical nitrogenous fertilisers (USD47m)

The top products (HS4) imported by South Africa from the top five African source markets are shown
below:

Nigeria
•    Crude petroleum oil (USD1.7bn)
•    Refined petroleum oil (USD28m)
•    Natural rubber (USD9m)
•    Petroleum gas and other gaseous hydrocarbons (USD3m)
•    Human hair and wigs (USD1m)

Angola
•    Crude petroleum oil (USD1.3bn)
•    Diamonds (USD7m)
•    Petroleum gas and other gaseous hydrocarbons (USD4m)

Swaziland
•    Scented essence used in manufacturing (USD381m)
•    Cane or beet sugar (USD201m)
•    Prepared binders for foundry moulds or cores (USD138m)
•    Women’s or girls’ suits, ensembles, jackets, blazers, dresses (USD60m)
•    Wood sawn or chipped lengthwise (USD49m)

Mozambique
•    Petroleum gas and other gaseous hydrocarbons (USD264m)
•    Electrical energy (USD161m)
•    Refined petroleum oils(USD156m)
•    Coal (USD122m)
•    Aluminium wire (USD32m)

Namibia
•    Gold (USD299m)
•    Live bovine animals (USD149m)
•    Beer from malt (USD59m)
•    Frozen fish (excl. fish fillets) (USD38m)
•    Live sheep and goats (USD35m)

8
Trade and Investment
3.                  Western Cape Trade with the rest of Africa
 The figure below illustrates the trend in Western Cape trade with the rest of Africa from 2010 to 2017.
 The Western Cape was a net importer of goods from 2010-2014.As of 2015, the South African Customs
 Union (SACU) has been included in the data and therefore from then onwards, exports outweigh
 imports resulting in a trade surplus from 2015-2017. In 2017, Western Cape exports to Africa totalled
 USD3.4bn, increasing by 5.3% in 2017 while imports grew by 12.3% reaching a cost of USD2.8bn.
 Since 2015, Western Cape exports to the region have exceeded USD3bn. Africa is the largest destination
 region for Western Cape exports, followed by Europe.

 FIG 3. WESTERN CAPE TRADE WITH THE REST OF AFRICA, 2013-2017
                                   6
                                   5
                                   4
                                   3
                                   2
Value (USDbn)

                                   1
                                   0
                                  -1
                                  -2
                                  -3
                                  -4
                                           2010        2011          2012    2013      2014        2015     2016      2017
                Export (USDbn)             1,32        1,53          1,71    1,99      2,42        3,45     3,19      3,36
                Import (USDbn)             2,13        2,44          4,51    4,68      4,49        2,76     2,49      2,79
                Trade Balance (USDbn)   -0,82         -0,91          -2,80   -2,69     -2,07       0,69     0,70      0,56

 Source: Quantec, 2018

 In 2017, the largest exports to Africa were refined petroleum oil (USD558.98m), flat-rolled iron
 (USD185m) and tobacco (USD122m). The largest growth in exports were for refined petroleum oils
 (81%) and packaging goods (57%). The largest imports from Africa were crude petroleum (USD1.9bn),
 frozen fish (USD69m) and shirts (USD67m). The largest growth in imports were for beer, scents used
 in manufacturing and petroleum gases.

                                                                                 TOP 10 WESTERN CAPE IMPORTS FROM AFRICA,
            TOP 10 WESTERN CAPE EXPORTS TO AFRICA, 2017
                                                                                                   2017
                                                   VALUE                                                    VALUE
                                                              % GROWTH                                                % GROWTH
           RANK             COUNTRY                 2017                     RANK         COUNTRY            2017
                                                              2013-2017                                               2013-2017
                                                  (USDm)                                                   (USDm)
                        Refined
                                                                                      Petroleum oils
                        petroleum oils
                                                                                      and oils obtained
         1              and oils obtained         558.98      81.16          1                             1,998.50   -8.53
                                                                                      from bituminous
                        from bituminous
                                                                                      minerals, crude.
                        minerals
                        Flat-rolled
                        products of iron                                              Fish, frozen,
                        or non-alloy steel,                                           excluding fish
         2                                        184.82      0.14           2                             69.20      162.93
                        of a width of 600                                             fillets and other
                        mm or more,                                                   fish meat
                        hot-rolled
                        Cigars, cheroots,
                        cigarillos and                                                T-shirts, singlets
                        cigarettes, of                                                and other
         3                                        122.46      13.79          3                             67.39      27.15
                        tobacco or                                                    vests, knitted or
                        of tobacco                                                    crocheted
                        substitutes
                        Fruit juices and                                              Beer made from
         4                                        105.94      18.74          4                             58.53      228,795.55
                        vegetable juices                                              malt

                                                                                                                                                    9
                                                                                                                                   Trade and Investment
TOP 10 WESTERN CAPE IMPORTS FROM AFRICA,
 TOP 10 WESTERN CAPE EXPORTS TO AFRICA, 2017
                                                                            2017
                                VALUE                                                  VALUE
                                          % GROWTH                                                % GROWTH
 RANK          COUNTRY           2017                 RANK          COUNTRY             2017
                                          2013-2017                                               2013-2017
                               (USDm)                                                 (USDm)
                                                                 Men’s or boys’
                                                                 suits, ensembles,
                                                                 jackets, blazers,
           Apples, pears and                                     trousers, bib and
 5                             96.17      1.49        5                               53.87       19.90
           quinces, fresh.                                       brace overalls,
                                                                 breeches and
                                                                 shorts (other than
                                                                 swimwear).
                                                                 Women’s or girls’
                                                                 suits, ensembles,
                                                                 jackets, blazers,
                                                                 dresses, skirts,
           Wine of fresh
 6                             87.90      9.81        6          divided skirts,      40.05       45.86
           grapes
                                                                 trousers, bib and
                                                                 brace overalls,
                                                                 breeches and
                                                                 shorts
           Undenatured
           ethyl alcohol
           of an alcoholic                                       Scents used in
 7                             64.24      11.15       7                               39.97       91,366.95
           strength by                                           manufacturing
           volume of less
           than 80 % vol
           Sulphur of all
           kinds, other than
           sublimed sulphur,                                     Meat of bovine
 8                             48.84      -4.72       8                               34.41       -
           precipitated                                          animals, frozen.
           sulphur and
           colloidal sulphur
           Articles for the
                                                                 Refined
           conveyance or
                                                                 petroleum oils
           packing of goods,
 9                             41.55      56.74       9          and oils obtained    32.53       -37.00
           of plastics;
                                                                 from bituminous
           stoppers, lids,
                                                                 minerals
           caps etc.
           Other fermented                                       Petroleum
           beverages (for                                        gases and
 10                            39.37      10.98       10                              28.40       2,888.12
           example, cider,                                       other gaseous
           perry, mead)                                          hydrocarbons
 TOTAL EXPORTS                 3,358.38   15.73       TOTAL IMPORTS                   2,794.89    -7.25

Source: Quantec, 2018

The top African destination countries for Western Cape exports were Namibia (USD864m), Botswana
(USD518m) and Kenya (USD225m). Top source African countries were Angola (USD1.07bn), Nigeria
(USD678m) and Namibia (USD204m).

     TOP 10 AFRICAN COUNTRIES FOR WC EXPORTS,             TOP 10 AFRICAN COUNTRIES FOR WC IMPORTS,
                       2017                                                 2017
                                               %
                                  VALUE                                                  VALUE           %
                                            GROWTH
 RANK           COUNTRY            2017                   RANK         COUNTRY            2017         GROWTH
                                             2013-
                                 (USDm)                                                 (USDm)        2013-2017
                                             2017
 1         Namibia               864.0     84.8       1             Angola              1,066.9       -4.8
 2         Botswana              517.7     60.4       2             Nigeria             676.9         -13.9

10
Trade and Investment
TOP 10 AFRICAN COUNTRIES FOR WC EXPORTS, TOP 10 AFRICAN COUNTRIES FOR WC IMPORTS,
2017 2017
%
VALUE VALUE %
GROWTH
RANK COUNTRY 2017 RANK COUNTRY 2017 GROWTH
2013-
(USDm) (USDm) 2013-2017
2017
3 Kenya 224.6 7.3 3 Namibia 203.6 60.1
4 Zambia 210.4 0.4 4 Swaziland 186.3 75.1
5 Lesotho 193.1 70.1 5 Equatorial Guinea 87.9 47.5
6 Angola 187.8 -6.4 6 Mauritius 78.9 -1.0
7 Swaziland 184.8 75.0 7 Madagascar 65.6 12.0
8 Mozambique 143.5 11.5 8 Togo 60.6 38,149.5
9 Zimbabwe 124.7 1.0 9 Ghana 53.0 815.4
10 Mauritius 111.2 11.21 10 Mozambique 52.4 -26.63
TOTAL EXPORTS 3,358.4 15.7 TOTAL IMPORTS 2,794.9 -7.3
Source: Quantec, 2018
The top products (HS4) exported by the Western Cape to the top African markets are shown below:
Namibia
• Refined petroleum oils (USD102m)
• Wine (USD35m)
• Undenatured ethyl alcohol (USD29m)
• Cigars, cheroots, cigarillos and cigarettes, of tobacco or of tobacco substitutes (USD29m)
• Fruit juices and vegetable juices (USD20m)
Botswana
• Refined petroleum oils (USD207m)
• Fruit juices and vegetable juices (USD23m)
• Cigars, cheroots, cigarillos and cigarettes, of tobacco or of tobacco substitutes (USD14m)
• Sauces, mixed condiments and mixed seasonings (USD11m)
• Milk and cream, not concentrated nor containing added sugar or other sweetening matter
(USD10m)
Kenya
• Flat-rolled products of iron or non-alloy steel (USD2bn)
• Apples, pears and quinces, fresh (USD165m)
• Wine of fresh grapes (USD88m)
• Motor cars and other motor vehicles principally designed for the transport of person (USD51)
• Alkali or alkaline-earth metals; rare-earth metals (USD48m)
Zambia
• Sulphur of all kinds (USD29m)
• Refined Petroleum oils (USD7m)
• Fruit juices (including grape must) and vegetable juices (USD7m)
• Natural magnesium carbonate (magnesite) (USD6m)
• Dish washing machines (USD6m)
11
Trade and InvestmentLesotho
• Refined Petroleum oils (USD64m)
• Cigars, cheroots, cigarillos and cigarettes, of tobacco (USD19m)
• Other made up clothing accessories (USD10m)
• Other manufactured tobacco and manufactured tobacco substitutes (USD5m)
• Milk and cream(USD4m)
Agricultural products feature prominently in Western Cape exports to African markets. This is also
the trend globally with around 50% of the Western Cape’s total global exports made up of agricultural
products. agricultural products make up around 50% of the Western Cape’s total global exports. The
Western Cape is the 5th largest global exporter in Africa of agricultural goods with exports valued at
USD4.6bn in 2017. The table below shows the Western Cape’s share of Africa’s imports from the world
for certain products. These figures show what a prominent role we play in supplying the African market,
especially for ciders (49%), citrus (27%) and apples and pears (22%).
WESTERN CAPE SHARE OF AFRICAN GLOBAL IMPORTS, 2017
2017 VALUE 2017 SHARE
HS Code: Product
(USDm) (%)
HST2009: Fruit juices and vegetable juices, 105.7 20.44%
HST0808: Fresh apples, pears and quinces 95.8 22.02%
HST2204: Wine 87.5 20.74%
HST2206: Other fermented beverages (for example, cider, perry, mead) 39.3 49.06%
HST0805: Citrus fruit 16.4 26.65%
Source: Quantec, 2018
The top products (HS4) imported by the Western Cape from the top African source markets are shown
below:
Angola
• Crude petroleum oils (USD1.06bn)
• Petroleum gases and other gaseous hydrocarbons (USD2m)
• Machinery (other than machines of heading 84.50) for washing, cleaning, wringing, drying, ironing,
pressing (including fusing presses), bleaching, dyeing, dressing, finishing, coating or impregnating
textile(USD158,000)
Nigeria
• Crude petroleum oils (USD666m)
• Refined petroleum oils and oils (USD9m)
• Petroleum gases and other gaseous hydrocarbons (USD2m)
Namibia
• Beer made from malt (USD59m)
• Fish, frozen, excluding fish fillets (USD29m)
• Fish fillets and other fish meat (USD27m)
• Meat of bovine animals, frozen (USD15m)
12
Trade and InvestmentSwaziland
• Mixtures of scented essence used in manufacturing (USD40m)
• T-shirts, singlets and other vests, knitted or crocheted (USD32m)
• Women’s or girls’ suits, ensembles, jackets, blazers, dresses, skirts, divided skirts, trousers, bib and
brace overalls, breeches and shorts (other than swimwear) (USD24m)
• Other knitted or crocheted fabrics (14m)
• Prepared binders for foundry moulds or cores (USD14m)
Equatorial Guinea
• Crude petroleum oils (USD74m)
• Petroleum gases and other gaseous hydrocarbons (USD14m)
4. Western Cape Inward FDI: Sept 2018 capex value reaches
USD702m
From 2008 to September 2018 a total of 315 FDI projects were recorded into the Western Cape,
representing a total capital investment of USD8.3bn, with USD702m invested from January to September
2018. Western Cape inward FDI increased in 2017, the most recent full year under review, both in terms
of capex and projects compared to 2016. The most notable investments, raising the annual capex FDI,
were the Burgan Cape Terminus at the Cape Town port (Netherlands), IBC Solar (Germany) and Angola
Cables (Angola). Each of these three investments were worth more than USD150m.
The Western Cape’s services sector has consistently attracted FDI projects, accounting for 53% of
all inward FDI projects between 2008 to Sept 2018. This is demonstrated by the four largest sectors
for global inward FDI into the province over the decade, namely business services, software and IT
services, communications and the financial services sector. Companies have established a number of
services in the province from investment services; employment services; wireless communications
carriers; data processing; computer programming services as well as banking and legal services. The
growth in the services sector is an indication of the sophistication of the province and is indicative of
a developed local economy.
In terms of capex, the largest sectors in the province attracting FDI were alternative or renewable
energy, communications and real estate, accounting for a combined 62% of all inward FDI between
2008 and September 2018. Companies have established a number of manufacturing facilities in the
province ranging from photovoltaic manufacturing facilities, electronic components and fast moving
consumer goods. The province continues to establish itself as a services and manufacturing hub for
companies expanding into Africa.
The investment into the province indicates the competitiveness and strength of the Western Cape as an
investment location. The province has introduced a number of initiatives centred around infrastructure
development and inclusiveness. The zoning programmes such as the Atlantis Special Economic Zone
(SEZ) create an enabling environment for increased development and investment in the region.
13
Trade and InvestmentThe Western Cape is regarded as an attractive investment destination due to the following reasons:
• Strategic position as a springboard into Africa,
• Highly sophisticated infrastructure,
• 2nd busiest airport (Cape Town International airport) in South Africa and 3rd busiest in Africa,
• Three advanced ports catering for different sectors (Cape Town, Saldanha Bay and Mossel Bay),
• Designated oil and gas Industrial Development Zone,
• Green Special Economic Zone in Atlantis,
• Availability of skilled workforce, and
• A growing ICT and manufacturing hub.
FIG 4. WESTERN CAPE INWARD FDI 2008-SEPT 2018
1400 45
40
1200
35
100
30
800
Value (USDm)
Projects
25
600 20
400 15
10
200
5
2008 2009 2010 2011 2012 2013 2014 2015 2016 2017 2018
Capex (USDm) 1 161 675 1 191 821 926 618 291 632 327 973 702
Projects 19 24 31 35 35 40 34 32 24 25 16
Source: FDI Intelligence, 2018
The province has backed its dedication to assist business growth for both local and international
competitors by creating the Western Cape Government Red Tape Reduction Unit, aimed at facilitating
a business readiness and investor-friendly environment. The section 8 City of Cape Town Investment
Facilitation Unit has also initiated a number of financial and non-financial incentives to streamline
inward investment in the Atlantis Special Economic Zone in particular.
The Western Cape had an
annual average global inward
FDI growth of 17% p.a. between
5. Western Europe is the largest source region for FDI 2008 and Sept. 2018 (Capex).
Western Europe was the largest global source region for Western Cape inward FDI by both capex
(accounting for 58% valued at USD4.8bn) and projects (accounting for 60%) from 2008 to September
2018. The top countries investing into the Western Cape from Western Europe were the United Kingdom,
Germany, France and the Netherlands accounting for a combined 43% of total inward projects between
2008 and September 2018.
The top company investing from the United Kingdom into the Western Cape in terms of capex was
British Telecom (USD150m) in the communications sector, followed by Vodafone. The top company
from Germany investing into the province was IBC Solar (USD155m) in the alternative/renewable
energy sector, followed by Juwi.
The rest of Africa invested in eight projects into the Western Cape over the last decade, worth USD673m.
14
Trade and InvestmentFIG. 5 WESTERN CAPE INWARD FDI BY REGIONS, 2008-SEPT 2018
70,0
59,7 57,5
60,0
50,0
Share (%)
40,0
22,5 26,6
30,0
20,0 11,7 6,7
2,5 8,1
0,0 1,9 0,5 1,3 0,3 0,3 0,2
0,0
Western North America Asia-Pacific Africa Middle East Emerging Latin America
Europe Europe & Caribbean
% projects % capex
Source: FDI Intelligence, 2018
The United Kingdom (76 projects and USD1.08bn), the United States (66 projects valued at USD2.15bn),
Germany (26 projects valued at USD753m) and France (17 projects valued at USD664m) accounted for
59% of projects and 56% of capex into the Western Cape between 2008 and September 2018.
FIG. 6 TOP 10 MARKETS FOR INWARD FDI INTO THE WESTERN CAPE, 2008-SEPT 2018
30,0
25,0
20,0
Share (%)
15,0
10,0
5,0
United United
Germany France Netherlands China Switzerland Italy Spain Denmark
Kingdom States
% projects 24,1 21,0 8,3 5,4 4,8 4,4 4,4 3,2 2,5 1,9
% capex 13,0 25,8 9,1 8,0 4,4 2,1 1,6 8,6 3,2 0,5
Source: FDI Intelligence, 2018
6. Services sector attracts 53% of FDI projects
The best performing sectors in terms of inward FDI into the Western Cape by projects between 2008
and September 2018 were: business services accounting for a 20% share of projects; software and IT
services accounting for 18% of projects and communications accounting for 8.6% share of projects.
According to FDI Intelligence 2018, DHL Express South Africa MD said regarding their investment “We
believe in the economic and trading power of South Africa and still see the Western Cape as a key area
for investment.”
Software publishers, internet publishing and broadcasting and web search and all other electrical
equipment and components were the largest subsectors for the Western Cape in terms of inward
projects between 2008 and Sept 2018. Adglow and Oracle were the largest investors into the Western
Cape’s software publishers. iFlix and SMS Streamer were the two largest investors in terms of internet
publishing & broadcasting & web search FDI into the province.
15
Trade and InvestmentFIG 7. INWARD FDI INTO WESTERN CAPE BY SECTORS 2008-SEPT 2018
% capex % projects
Business Services 1,9
20,0
Software & IT services 4,2
17,5
Communications 1,1
8,6
Financial Services 24,9
7,0
Industrial Machinery, Equipment & Tools 0,9
5,1
Transportation 2,8
4,4
Electroninc Components 24,6
4,4
Alternative/Renewable energy 4,9
4,4
Textiles 5,6
3,5
0,0 5,0 10,0 15,0 20,0 25,0 30,0
Share (%)
Source: FDI Intelligence, 2018
7. 46% of companies indicated expansion into Africa as
motive for FDI
An estimated 46% of companies investing into the Western Cape indicated regional and sub-regional
motives for investing (FDIMarkets, 2018). These companies indicated setting up headquarters in the
Western Cape and using the province as a springboard fod doing business into the rest of Africa. The
Western Cape is beginning to become a recognised global hub for companies moving into Africa. This
is evidenced by companies such as Clyde and Co from the United Kingdom, Lleida.net from Spain,
Hisense from China, GE Capital Aviation Services from the United States and Wind Prospect from the
United Kingdom that have indicated their intentions to form bases in Cape Town and expand into Africa.
FIG 8. INWARD FDI INTO WESTERN CAPE BY MARKETS SERVED, 2008-SEPT 2018
Domestic 52,2
Regional 45,4
Global 2,2
Sub-regional 1,7
United States 1,1
0 10 20 30 40 50 60
% Share of FDI projects
Source: FDI Intelligence, 2018
16
Trade and Investment8. Cape Town is the 2nd largest destination for inward FDI
among South African Cities
Cape Town’s economy, which contributed 9.8% to national gross domestic product in 2016, is the
second-largest municipal economy in South Africa. Johannesburg attracted the largest inward FDI by
projects among South African cities accounting for 33% between 2008 and September 2018, followed
by Cape Town (18%) and Durban at 4%. These top three cities were also the largest source of outward
FDI from South Africa, with Johannesburg accounting for 57%, Cape Town (22%) and Durban (4%).
In 2017, Cape Town ranked 98th out of 3,770 global cities in terms of inward FDI by projects. Cape
Town received more investment projects in 2017 than cities such as Seattle, Glasgow, Auckland,
St Petersburg and Doha.
Cape Town ranked 4th in terms of inward FDI by projects among African cities between 2008 and
September 2018, while Johannesburg ranked as the top city in Africa for inward FDI. Cape Town ranked
2nd in terms of inward FDI by software and IT services projects and business services among African
cities between 2008 and September 2018, while Johannesburg ranked as the top city in Africa for these
sectors.
Cape Town attracted the largest amount of FDI projects for consumer electronics (33%), electronic
components (34%), real estate (36%) and alternative/renewable energy (36%) among South African
cities between 2008 and September 2018.
Some of Cape Town’s comparative-advantage factors are as follows:
• The second-busiest container port in South Africa,
• Good public transport linkages in the city,
• Servicing a vast agricultural hinterland, acting as a processing, trade and retail hub for agricultural
products and exporting beverages such a wines; fruits such as oranges, plums, apples; and juices,
• Established business culture and clustering of financial institutions,
• Scenic beauty and natural sights that attract international visitors and make Cape Town globally
recognised, and
• Three major universities within the metro region (among these, the top university in Africa in the form
of the University of Cape Town) and another highly regarded university (University of Stellenbosch)
just outside the metro boundaries.
17
Trade and InvestmentFIG 9. TOP SOUTH AFRICAN CITIES FOR INWARD FDI 2008 – SEPT 2018
21,17
Johannesburg 33,71
7,96
Cape Town 18,06
3,02
Durban 4,06
1,51
Midrand 2,98
Pretoria 1,42
2,79
Port Elizabeth 2,73
2,53
Centurion 2,28
1,01
East London 1,33
0,82
Rosslyn 1,28
0,57
Stellenbosch 0,32
0,51
0,00 5,00 10,00 15,00 20,00 25,00 30,00 35,00 40,00
Share (%)
% capex % projects
Source: FDI Intelligence, 2018
For the 12 months up to March 2018, Wesgro facilitated 18 investments worth R3,04bn, creating 2,426
direct jobs.
One of the success stories from the year was Pegas Nonwovens:
Pegas Nonwovens (Czech Republic) is the largest producer of spunmelt nonwovens in EMEA (Europe,
the Middle East and Africa). The company has two production facilities in the Czech Republic, one in
Egypt, and has recently invested in a greenfield project in Atlantis, which will employ more than 300
people. The project is an exciting endorsement of the business potential of the Western Cape, and
amounts to a FDI injection of more than R1.3bn in Phase I. The investment is another example of the
successful collaboration between Wesgro and Green Cape
The City of Cape Town has
in supporting inbound investment. Through the Service Level Agreement between the two entities, the introduced financial and non-
investor was provided with end-to-end support, alongside key interventions from the City of Cape Town financial incentives to attract
to facilitate the investment. In accordance with the SLA, the investment and job figures recorded were investments. The City has
split 50-50 between Wesgro and Green Cape. also introduced the Atlantis
Special Economic Zone for
manufacturing companies that
want to set up in the city.
9. Western Cape is 2nd largest province for South African FDI
to Africa
Gauteng is the largest source province for FDI into Africa among South African province’s accounting
for 68% of projects followed by the Western Cape and KwaZulu-Natal accounting for 25% and 5%
respectively between 2008 and September 2018. The largest sectors in terms of projects were financial
services (120 projects), communications (72 projects) and business services (60 projects).
In terms of capex the largest African sectors attracting FDI were coal, oil and natural gas; real estate;
and communications. Gauteng invested in 337 projects worth ZAR311bn over the decade and the
Western Cape invested in 126 projects worth ZAR46bn.
18
Trade and InvestmentFIG 10. SOUTH AFRICA’S FDI INTO AFRICA, BY PROVINCE 2008-SEPTEMBER 2018
70,08
Gauteng
7,54
10,34
Western Cape 25,25
1,49
KwaZulu-Natal 5,01
Not specified 17,79
1,20
0,17
North West
0,40
0,10
Eastern Cape 0,40
Free State 0,03
0,20
0,00 10,00 20,00 30,00 40,00 50,00 60,00 70,00 80,00
% capex % projects
Source: FDI Intelligence, 2018
10. Africa is the largest destination region accounting for 54%
of Western Cape FDI
Africa has been a headline on everyone’s agenda over the past 10 years and South Africa has been the
4th largest global investor into the rest of Africa, behind the United States, the United Kingdom, and
France (FDIMarkets, 2018). Local businesses are seeing opportunities for business in Africa and have
been harnessing these opportunities.
Africa is the Western Cape’s largest global destination region for outward FDI both in terms of projects
(54%) and capex (54%) between 2008 and September 2018. This was followed by Western Europe
accounting for 17% of projects and 17% capex. Over the past 10 years, outward FDI from the Western
Cape had an annual average growth of 95% in terms of capex and 54% in terms of projects (FDIMarkets,
2018).
In terms of cities, Johannesburg
Most outward FDI from the Western Cape into Africa in terms of projects were in the food and beverages was the largest South African
sector; followed by the software and IT sector; financial and business services sector; and consumer city investing into Africa,
products together accounting for 79% of all investments. The largest investing companies for outward accounting for 57%, followed by
FDI from the province by number of projects were Shoprite (27), Pick n Pay (10), Carrick Wealth (9), Cape Town (24%).
Naspers (9) the Foschini Group (7) and Woolworths (7). These companies made up 55% of outward
African investment from the province from 2008 – Sept 2018.
In terms of capex, the largest sectors for outward FDI from the Western Cape into Africa over the last
decade were real estate (ZAR17bn); consumer products (ZAR8.3bn) and food & tobacco (ZAR7.7bn);
accounting for a combined 72%. The largest investing companies by capex were Shoprite, Novare
Equity Partners, Woolworths, The Foschini Group and Distell accounting for 70% of total outward
capex into Africa from 2008 – September 2018. The outward investments and projects derived from
the province is indicative of its growing economy.
Around 10 of the biggest Western Cape based companies with annual turnover exceeding ZAR9bn have
expanded into Africa. These include amongst others Santam Ltd, Distell Group Ltd, The Foschini Group
Ltd, Truworths International Ltd and Shoprite Holdings Ltd.
19
Trade and InvestmentFIG 11. OUTWARD FDI FROM THE WESTERN CAPE TO AFRICAN COUNTRIES, 2008 – SEPTEMBER
2018
25,1
Nigeria 23,0
5,5
Kenya 12,7
Zambia 5,6
11,1
7,0
Angola 8,7
Mozambique 29,2
6,3
Namibia 8,9
5,6
4,1
Ghana
5,6
3,3
Mauritius
4,8
Tanzania 2,2
4,0
2,6
Botswana 4,0
1,8
Uganda
3,2
% capex % projects
Source: FDI Intelligence, 2018
11. Western Cape FDI to Africa: Food and Beverages the largest
sector by project and real estate the largest sector by Capex
The food and tobacco sector made up almost a third of all the Western Cape’s outward investment
into the rest of Africa from 2008 – September 2018.. Businesses investing in the most projects in the
rest of Africa in this sector were retailers, Pick n Pay and Shoprite, with one investment from Rainbow
Chicken. Financial Services (19%) and Consumer Products (13%) were the second and third largest
sectors in terms of projects for outward FDI into the rest of Africa. Nigeria is the Western Cape’s
largest African market for
outward FDI in terms of projects
accounting for 23% followed by
Kenya (13%), Zambia (11%) and
Angola (9%).
20
Trade and InvestmentFIG 12. WC FDI INTO THE REST OF AFRICA BY SECTOR (PROJECTS), 2008 – SEPTEMBER 2018
Other sectors
7%
Textiles 3%
Beverages 3% Food & Tobacco 29%
Real Estate 5%
Communications 5%
Business Services 7%
Software & IT services 9%
Financial Services 19%
Consumer Products 13%
Source: FDI Intelligence, 2018
The real estate sector made up 36% of all the Western Cape’s outward investment into the rest of Africa
from 2008 – September 2018. Businesses investing in this sector were Novare Equity Partners and
Shoprite. Consumer Products (17%) and Food and Tobacco (17%) were the second and third largest
sectors in terms of Capex for outward FDI into the rest of Africa.
FIG 13. WC FDI INTO THE REST OF AFRICA BY SECTOR (CAPEX), 2008 – SEPTEMBER 2018
Communications 2%
Other sectors 4%
Software & IT services 2%
Coal, Oil and Natural Gas 3%
According to FDI Intelligence, in
Metals 5% Real Estate 36% 2018 Carrick Wealth invested in
the city of Blantyre. The CEO,
Beverages 6% Craig Featherby was quoted
as saying “We believe that the
long-term growth projections for
Financial Services 8%
Africa, and especially those we
have targeted, such as Malawi,
are positive. All of them have
shown an increase in GDP over
the last five to seven years.
Consumer Products 17%
And combined with the political
Food & Tobacco 17%
stability in Malawi over the last
20 years, we believe this growth
bodes well for our new office.”
Source: FDI Intelligence, 2018
21
Trade and Investment12. Western Cape FDI to Africa: Retail was the largest activity
accounting for 50%
The largest business activity undertaken by Western Cape FDI into Africa was for retail (48% of
projects), followed by business services (24%) and sales, marketing & support (16%). The attraction
of the Sub-Saharan African retail market to potential investors is based on the region’s population size
and growth prospects. In addition, underdeveloped markets offer the potential for organised retail
sectors to emerge. However, poor physical infrastructure, inflationary outlooks and relatively high
country risks offset these factors somewhat.
FIG 14. WESTERN CAPE FDI TO AFRICA BY BUSINESS ACTIVITY, 2008 – SEPT 2018
34,6
Retail 47,6
8,0
Business Services 23,8
3,9
Sales, Marketing & Support 15,9
Construction 37,6
4,8
Manufacturing 12,4
4,0
Logistics, Distribution & Transportation 2,0
2,4
Headquarters 1,5
1,6
0,0 5,0 10,0 15,0 20,0 25,0 30,0 35,0 40,0 45,0 50,0
% capex % projects
Source: FDI Intelligence, 2018
The Western Cape, aside from being a major investor into Africa, is also one of Africa’s major source
markets for imported goods. Africa is a growing market with rising consumer incomes, more open
economies, increasingly more sophisticated consumers as well as the increased uptake of mobile
subscriptions and broadband.
The next section explores the results of a Wesgro survey conducted across 35 Western Cape based
companies and their business in the rest of Africa. The Crazy Store property
director, Carl van Rensberg said
of their investment in Botswana
in 2018 ““We were offered a
great site, in a prime location,
directly outside the entrance to
Shoprite, and we felt that we
had no choice but to take up
the offer.”
22
Trade and InvestmentSummary of Survey: Western Cape Companies Business Strategy
into the Rest of Africa
Companies surveyed
• Number of Total respondents doing business in Cape Town: 35
• Almost half of the companies surveyed primarily provide services, with 29% providing goods and services
• Almost half of all the respondents were large companies with more than 50 employees
• Namibia is the most popular destination with 24 companies doing business there, followed by Kenya (20
companies) and Mozambique (18 companies).
Where do you have business in the rest of Africa
24 20 18 17
Namibia Kenya Mozambique Botswana
14 13 11 11
Ghana Nigeria Angola Zimbabwe
9 7 6 5
Tanzania Uganda Zambia DRC
4 3
Ethiopia Rwanda
# respresents the number of companies surveyed doing business in that country.
23
Trade and InvestmentNumber of respondents with subsidiaries in the rest of Africa. Kenya is the most popular destination
with 6 companies there, followed by Nigeria (4) and Namibia (3).
Kenya
Nigeria
Botswana
2 4
Mozambique 4
2 6
Namibia
Angola
6
2 3
Ghana
3 3 1 1
Madagascar 2 3
Zimbabwe 3 3 1 1
Results
Cape Town as a base for doing business
Over half of companies surveyed said that Cape Town was the best or one of the best base cities for
doing business into the rest of Africa.
• Of these companies, some commented that their reason for Cape Town being a base city was that
trucking from Gauteng was more expensive than shipping from Cape Town
• Many of the respondents cited lifestyle as being a major pull factor. One company mentioned that
Cape Town was an attractive destination especially with regard to filming
• Many companies found the major drawback to be direct flight access into Africa particularly to
West Africa
1 in 5 company respondents said that Cape Town is not a prominent city relative to other cities to do
business in Africa. Sanlam Private Wealth CEO,
Daniel Kriel commenting on
their investment into Mauritius
in 2017 said the “the Mauritian
government has created an
Results internationally recognised
regulatory framework, and the
Africa Strategy: What motivates exporting or investing decisions into new African Markets? country’s focus on developing
the financial services sector has
• The most important motivating factors for choosing new African markets for export and investment
resulted in a highly skilled talent
were: interest expressed from people in the market; contacts and networks in the market; and
pool.”
visiting the market and recognising the opportunity.
• Other considerations not mentioned below were regional expositions and conferences in the
country and other multinational corporations (MNC’s) operating in the country of consideration.
24
Trade and InvestmentHow do you make your decision for exporting/investing into a new market in the
rest of Africa?
Interest expressed from someone in the market 68,75%
Contacts and networks in the market 68,75%
Visiting the market and recognising the opportunity 59,38%
Presence of other SA companies in that market 34,38%
Good Infrastructure and ease of doing business 21,88%
Sound economic and political outlook 18,75%
Regional preferential trade agreements e.g. SACU/SADC 15,63%
Research reports on Africa that inform strategy 12,50%
Language/Lifestyle or ease of doing business in that market 12,50%
0% 80%
Results
Africa Strategy: What are the top reasons for exporting or investing in a certain African market?
• Three quarters of respondents ranked “demand for your product in the market” as the top reason
for exporting or investing into a new African market
• Almost half of the respondents ranked “contacts and network” as the second most important
reason for exporting or investing
• Just over half of the respondents voted “domestic market possibilities” as the third most important
reason for exporting or investing.
The overall export/investment scores are shown below:
What are the top 3 reasons for exporting/investing in a certain market in the
rest of Africa?
Demand for your product in that market 6,5
Contacts and network 5,44
Distribution network in that market 4,94
Domestic market possibilities 4,87
GDP growth and economic factors 4,74
Ease of doing business 4,45
Language/Lifestyle 2,8
*the investment score is an index based on how many times a motive was ranked first, second or third
with descending values given to each.
25
Trade and InvestmentResults
Africa Strategy: What is your outlook for Africa in the next 5 years?
• Almost 100% of companies believe that good or great opportunities exist in Africa
• Four in five companies believe that great opportunities exist in Africa that must be taken advantage
of
What is your outlook for Africa in the next 5 years?
Great opportunities exist in Africa and
they must be taken advantage of
79,41%
Good opportunities exist but I’m investing
or trading with other regional partners in
the medium term
17,65%
Africa is not the palce to invest in the
medium term
2,94%
Results
Africa Strategy: What currency do you use for your work in Africa
Woolworths franchise head,
• Three quarters of the respondents use USD for their work in the rest of Africa John Fraser commenting on
the investment into Nigeria in
• Around one in five companies use the Rand for their work in the rest of Africa 2011 said “We are confident
• None of the companies recorded using cryptocurrency for their work in the rest of Africa about our investment in Nigeria
and we are very pleased with
the growth prospects of the
Nigerian market. The country
What currency do you use for your work in Africa has a large population with
significant and growing middle-
and-upper income groups. We
have found the right partner
100,00% in Chellarams to grow the
90,00%
76,47% Woolworths brand in Nigeria.”
80,00%
70,00%
60,00%
50,00%
40,00%
30,00% 17,65%
20,00%
5,88%
1,00%
$ R €
0,00%
CURRENCY
26
Trade and InvestmentResults
Key developments Respondents believe enable Cape Town as a business hub
• Innovation and creative implementation
• Green economy
• Tourism link and parallel link of tourism to other business
• We’re in the “creative” game (marketing & advertising), so with attractions like the Zeitz Mocaa, First
Thursdays and more emphasis on African art, the city becomes quite attractive
• Seen as innovative, environmentally conscious, additional air access, expansion of CTICC,
Technologically friendly
• Improved connectivity with new fiber networks
• Cape Town has a vision of Africa’s potential aligned with strategic initiatives and economic and
political stability with red tape reduction units
• The logistic opportunities and the possibilities for growth and the availability of human resources
• SEZ in Atlantis with targeted incentives
• Cape Town’s infrastructure is well developed with the potential of becoming the tech hub of the
continent. It has incredible beauty which lends itself to filmmaking
• The facilities needed for the export of perishables is of a very high standard
• 2nd busiest airport (Cape Town International airport) in South Africa and 3rd busiest in Africa.
According to FDI Intelligence,
in 2010 Chief executive officer
of Shoprite, Whittey Basson
said: “Nigeria has a population
of about 140 million people, so
quite obviously, it’s a massive
market it has by infrastructure.
It just doesn’t have the sort
of super market exposure or
shopping centre exposure
which South Africa has.”
27
Trade and InvestmentSurvey conclusion
Africa has been a headline on everyone’s agenda over the past 10 years mainly due to its high economic
growth and rising consumer market. Almost half of the companies investing into the Western Cape
have indicated regional and sub-regional motives for investing. Many companies indicated setting up
headquarters in the Western Cape and using the province and specifically Cape Town, as a springboard
into Africa (FDI Intelligence, 2018).
One of the questions Cape Town companies were asked was How would you rate Cape Town as a base
for doing business in the rest of Africa?
Of the thirty-five surveyed Cape Town based companies, 53% rated Cape Town as one of the best cities
to do business in Africa. A further 3% of the companies indicated Cape Town as the outright best city
within which to do business in Africa. Overall the results showed that 74% of the companies surveyed
had a positive perception of Cape Town as a base to do business in Africa. One of the key motives that
companies cited as a reason that Cape Town was attractive as a base to business in Africa was its highly
sophisticated infrastructure that made it easier for companies to expand into Africa.
Of the surveyed companies, 20.6% of the companies felt that although they would use Cape Town as
a base, it was not as prominent relative to other cities as a place to do business in Africa. Companies
expanding into Africa have indicated that it can be lucrative, but it is crucial that local businesses
understand the importance of implementing effective Africa expansion strategies in order to ensure
success.
How would you rate Cape Town as a base for doing business in
the rest of Africa?
Cape Town is one of the best cities
for doing business in Africa 52,94%
Cape Town is not prominent relative to other cities
as a place to do business in Africa 20,59%
Cape Town is one of the best cities for doing
business in Africa but it is becoming less attractive
compared to other African cities
17,65%
Cape Town is not an ideal city to do business in
Africa 5,88%
Cape Town is the best city within
which to do business in Africa 2,94%
0% 100%
28
Trade and InvestmentWestern Cape: A Competitive Place for Business
1. Flight connections: Regional and International
Cape Town International Airport is a world-class airport, and is the second largest in South Africa. In
2018, the airport was awarded the best Airport in Africa (Skytrax, 2019). It was also recognised as
the best airport globally that services between 5 and 10 mn passengers annually. In 2018, the airport
was rated as the 21st best airport in the world by Skytrax, improving 5 places from 2015. It is located
approximately 20km from the CBD, and is integrated with other city transport infrastructure. Cape Town
International Airport is undergoing upgrades of its domestic and international terminals, along with the
realignment of its runway, forming the bulk of Airports Company South Africa’s (ACSA) ZAR7.7-bn
expansion plans.
According to ACSA (2017), total passengers including domestic, international and unscheduled flights
in 2017 totalled 10.7 mn, growing by 6% from 2016. International passengers alone reached 2.4 mn in
2017, growing by 22%. This is not surprising as Cape Town came in at number 3 on the TripAdvisor Top
10 Africa Destinations in 2018. Cape Town International Airport offers direct flights to 25 international
hubs such as London, Paris, Amsterdam, Dubai, Qatar, Singapore, Hong Kong, etc., with an average
flying time of 10 to 11 hours. In terms of regional flight connections, Cape Town International Airport
offers the following direct regional flights:
• Johannesburg
• Kimberley
• Lanseria
• Durban
• Port Elizabeth
• East London
• George
• Plettenberg Bay
• Bloemfontein Airport
• Upington
• Sun City Pilanesberg
• Hoedspruit Airport
• Nelspruit
• Skukuza Airport
Cape Town serves as a key port of connectivity to other cities within Africa with:
• 7 times a week direct flight to Addis Ababa, Ethiopia
• 7 times a week direct flight to Maun, Botswana
• 3 times a week direct flight to Gaborone, Botswana
• 14 times a week direct flight to Walvis Bay, Namibia
• 42 times a week direct flight to Windhoek, Namibia
• 4 times a week direct flight to Livingstone, Zambia
• 4 times a week direct flight to Luanda, Angola
• 2 times a week direct flight to Port Louis, Mauritius
• 9 times a week direct flight to Victoria Falls, Zimbabwe
• 4 times a week direct flight to Harare, Zimbabwe
• 4 times a week direct flight to Kigali, Rwanda
• 12 times a week direct flight to Nairobi, Kenya
29
Trade and InvestmentRwandAir launched the four
times a week service, operated
Vienna, Austria Zurich, Switzerland Paris, France Amsterdam, London Gatwick, UK
by a Bombardier CRJ-900, on
Netherlands 16 May 2018, making it the
first airline to introduce a direct
London Heathrow, UK Frankfurt, Frankfurt, Germany
flight between the Zimbabwean
London Gatwick, UK Germany Munich, Germany capital and the Mother City.
Commenting on the success
of the route, Wesgro CEO,
Tim Harris, said: “This service
Dubai, UAE Singapore, Singapore
operated by RwandAir
demonstrates the benefits of a
Istanbul, Turkey
direct flight: Harare, previously
Hong Kong, China the largest unserved African
Doha, Qatar destination, saw a 46% growth
in two-way passengers between
June and July 2018, compared
Maun, Botswana Nairobi, Kenya to a 1% growth during the same
Addis Ababa, Ethiopia
Victoria Falls, Zimbabwe Livingstone, Zambia period in 2017. We look forward
Windhoek, Namibia Victoria Falls, Zimbabwe
to an increase in tourism, trade
and investment between Cape
Town, Harare and Kigali which
Luanda, Angola Gaborone, Botswana Windhoek, Namibia Kigali, Rwanda Port Louis, Mauritius
Walvis Bay, Namibia Harare, Zimbabwe we believe will be facilitated
through increased flight capacity
for both passengers and cargo.”
“The fact that there is already
such a demand on this newly
2. Rail Infrastructure launched route that it requires a
seasonal expansion, highlights
the potential for trade and
Transnet, a state-owned company, manages freight rail in South Africa. Metrorail, a subsidiary of the
tourism opportunities that
Passenger Rail Agency of South Africa (PRASA) is the major carrier of rail passengers in the Western
exists across Africa. This also
Cape. The current investment in rail in South Africa endorses South Africa’s ambition to accommodate
highlights the importance of
the fifth-largest railway system in the world by 2019.
a project like Air Access in
ensuring that Cape Town is
In March 2014, Transnet announced a ZAR50bn contract with four manufacturers to build a 1,064-strong easily accessible, connecting
locomotive suite. The Transnet rail investment was enable by an African Development Bank loan of people to those opportunities,”
USD250m, with the intention of enhancing cargo capability. By 2019 Transnet Freight Rail (TFR) plans added Beverley Schäfer,
to increase its market share of freight transport by increasing rail freight from around 200 mn tonnes Western Cape Minister of
to 350 mn tonnes. To this end ZAR201bn specifically has been invested into TFR to expand its rail Economic Opportunities.
infrastructure to create capacity and increase cargo volumes transported by rail. ZAR7bn is earmarked
for a rail corridor in Saldanha Bay, Western Cape, from 2015 to 2018, which would dovetail with other
infrastructure projects. The Sishen–Saldanha railway line, also known as the Ore Export Line, is an
861 kilometres (535 mi) long heavy haul railway line in South Africa. It connects iron ore mines near
Sishen in the Northern Cape with the port at Saldanha Bay in the Western Cape. In 2018 TFR tested
the world’s longest train to transport manganese to the ports. The September test with 375 wagons
in a 4km-long train proved the concept that TFR could haul manganese in this configuration, topping
the longest production train in the world, the 342-wagon iron-ore trains running on the same 861km
Sishen-to-Saldanha line.
The railway system is the backbone of public transport travel within Cape Town and equates to 55% of
the public transport market share with 620 000 rail passenger trips a day on Metrorail services (PRASA,
2018). There are 51 train sets, 489km of track and 123 stations, including halts in the Western Cape
(PRASA: 2018). The Khayelitsha–Cape Town corridor is one of the busiest railway corridors within
the Western Cape. Due to the importance of the railway system, the city has partnered with PRASA
to ensure its’ continual integrated upgrade and sustainable development. The City of Cape Town is
planning extensions to the rail network, such as the Blue Downs rail line and doubling the Strand rail
line etc. The Cape Town CBD station provides a world class central point providing safe, appealing
and efficient infrastructure to commuters with 24 platforms and other inter-modal transfers. Due to
the importance of specific railways stations that serve as interchanges, a number of stations have
been identified for development and or construction, for example the provision of a rail connection
to the Cape Town airport. This will be achieved by building a ±4,5km rail link between the airport
30
Trade and InvestmentYou can also read