Research Collection - ETH Zürich
←
→
Page content transcription
If your browser does not render page correctly, please read the page content below
Research Collection

 Journal Article

 Nature-Based Solutions for Urban Sustainability: An Ecosystem
 Services Assessment of Plans for Singapore’s First “Forest
 Town”

 Author(s):
 Tan, Beverley A.; Gaw, Leon Y.-F.; Masoudi, Mahyar; Richards, Daniel R.

 Publication Date:
 2021-04-30

 Permanent Link:
 https://doi.org/10.3929/ethz-b-000487124

 Originally published in:
 Frontiers in Environmental Sciences 9, http://doi.org/10.3389/fenvs.2021.610155

 Rights / License:
 Creative Commons Attribution 4.0 International

This page was generated automatically upon download from the ETH Zurich Research Collection. For more
information please consult the Terms of use.

ETH Library
ORIGINAL RESEARCH
                                                                                                                                          published: 30 April 2021
                                                                                                                                  doi: 10.3389/fenvs.2021.610155

                                           Nature-Based Solutions for Urban
                                           Sustainability: An Ecosystem Services
                                           Assessment of Plans for Singapore’s
                                           First “Forest Town”
                                           Beverley Anne Tan 1,2*, Leon Yan-Feng Gaw 1,2*, Mahyar Masoudi 2,3 and
                                           Daniel Rex Richards 1,2
                                           1
                                            Natural Capital Singapore, Singapore ETH Centre, ETH Zürich, Zürich, Singapore, 2Campus for Research Excellence and
                                           Technological Enterprise, Singapore, Singapore, 3School of Design and Environment, National University of Singapore,
                                           Singapore, Singapore

                                           Rapid urbanization in many parts of the world has increasingly put the environment under
                                           pressure, with natural landscapes cleared to make way for built infrastructure. Urban
                                           ecosystems, and the services that they provide, can offer nature-based solutions to the
                                           challenges of urbanization. There is increasing interest in better incorporating ecosystems
                           Edited by:      into urban planning and design in order to deliver greater provision of ecosystem services
                  Teodoro Semeraro,
            University of Salento, Italy
                                           and enhance urban liveability. However, there are few examples of built or proposed urban
                     Reviewed by:
                                           developments that have been designed specifically with ecosystem services in mind–partly
                        Weiqi Zhou,        because there are few modeling tools available to support urban planners and designers
          Research Center for Eco-
                                           by informing their design workflows. Through using Singapore’s latest nature-centric town
environmental Sciences (CAS), China
                   Chiara Cortinovis,      as a case study, this article assesses the impacts of nature-based solutions in urban
       Humboldt University of Berlin,      design on ecosystem services performance, through a spatially explicit modeling
                           Germany
                                           approach. The proposed future scenario for the nature-centric town was projected to
                 *Correspondence:
                  Beverley Anne Tan
                                           result in substantial declines in the provision of all ecosystem services, as a result of the
    beverley.annetherese@gmail.com         removal of large areas of natural vegetation cover. However, the future scenario compared
                Leon Yan-Feng Gaw
                                           favourably against three older towns that have been constructed in Singapore, showing
                  gaw@arch.ethz.ch
                                           the best performance for four out of six ecosystem services. This simulation exercise
                    Specialty section:     indicates that designing towns with ecosystem services in mind, and incorporating nature-
         This article was submitted to     based solutions into urban design, can help to achieve enhanced performance in providing
                  Land Use Dynamics,
                a section of the journal
                                           ecosystem services. The models developed for this study have been made publicly
   Frontiers in Environmental Science      available for use in other tropical cities.
     Received: 25 September 2020
                                           Keywords: natural capital, land cover, environmental modeling, urban planning, scenarios
          Accepted: 15 April 2021
          Published: 30 April 2021

                             Citation:     INTRODUCTION
 Tan BA, Gaw LY-F, Masoudi M and
   Richards DR (2021) Nature-Based         The world is urbanizing at an unprecedented rate, with the United Nations projecting that 68% of the
Solutions for Urban Sustainability: An
                                           world’s population will be living in urban areas by 2050 (United Nations, 2018). While urbanization
 Ecosystem Services Assessment of
           Plans for Singapore’s First
                                           has brought about significant benefits for humankind, it has also brought detrimental impacts to the
                       “Forest Town”.      environment and the ecosystem services provided (Seto et al., 2011). Urban areas face a range of
       Front. Environ. Sci. 9:610155.      pressing environmental and societal problems, such as the urban heat island (Arnfield, 2003;
    doi: 10.3389/fenvs.2021.610155         Richards and Edwards, 2017), poor air quality (Shi et al., 2020), elevated flood risk (Chadwick et al.,

Frontiers in Environmental Science | www.frontiersin.org                         1                                           April 2021 | Volume 9 | Article 610155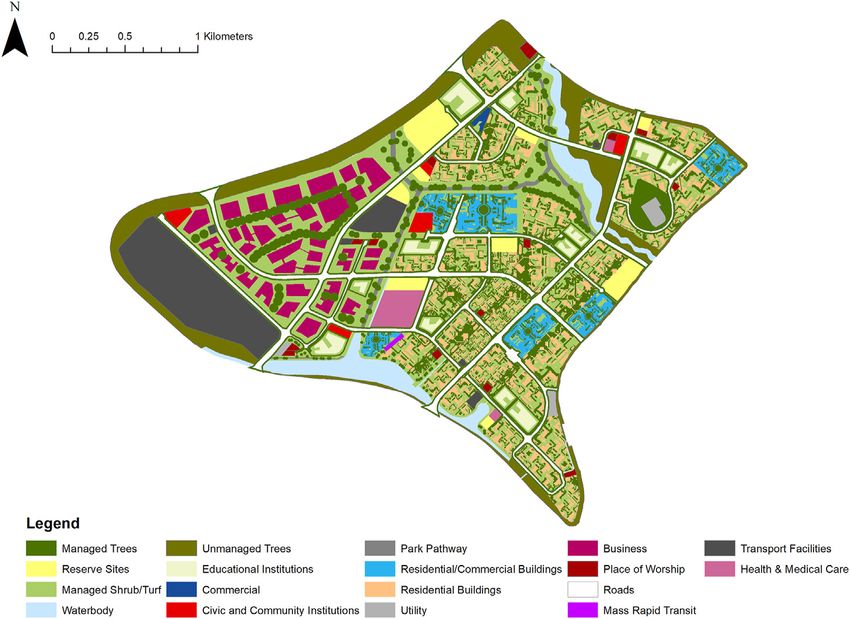
Tan et al.                                                                                           Nature-Based Solutions for Sustainable Towns

2006), and a lack of public access to nature (Cox et al., 2018).          services provided by waterbodies (Lim and Lu, 2016; Public
There is an increasing awareness that humans need to make                 Utilities Board, 2016).
better use of ecosystem services in order to regulate and sustain a          While Singapore is a pioneer in urban greening, the
healthy planet (Zhang et al., 2019), particularly in urban areas          incorporation of nature into built environments has also
(Bolund and Hunhammar, 1999; Gómez-Baggethun and Barton,                  been gaining interest worldwide. At the global policy level,
2013; Elmqvist et al., 2015; Richards and Thompson, 2019).                the Sustainable Development Goals refer to enhancing the
Through designing greener urban areas with contrasting types              vegetation of cities to enable sustainable and just future growth
of green spaces, it may be possible to provide nature-based               (United Nations Economic and Social Council, 2016). Specific
solutions to some of the challenges of urbanization (Depietri             examples of projects underway currently include the Hafner-
and McPhearson, 2017; Babí Almenar et al., 2021).                         Ring in Konstanz, Germany, which aims to embrace the
   Despite the significant impact that urban designs have on               existing conditions of the natural landscape and utilizes
the ecosystem services provided by a landscape, efforts to                natural green and blue features in an iconic “Green Ribbon”
design urban areas with ecosystem services performance in                 to enhance social cohesion and ecological resilience and
mind have often been inadequate or overlooked (Heyman                     functioning of the area (Rambol Studio Dreiseitl, 2019).
et al., 2019). Even in cases where urban designs have                     Similarly, the Jinga Eco-community is another urban
attempted to improve ecosystem services, a lack of                        planning and design proposal that uses nature-based
simulation tools has prevented quantitative feedback                      solutions in response to increasing urbanization in Abuja,
between ecologists and architects, to determine whether                   the capital city of Nigeria (Skidmore and Merrill, 2021b).
such designs are likely to perform as intended (Andreu and                The proposal aims to safeguard and enhance the existing
Oreszczyn, 2004). There is thus a need for iterative feedback             ecosystems in the site by proposing a development that is
loops to be instituted in order to ensure that urban designs can          lush green and connects the Usuma reservoir and an existing
meet local and global environmental sustainability needs                  city. Despite the increasing implementation of nature-based
(Richards et al., 2019). In addition, there is a need to                  solutions in urban design, little is known about the
evaluate the effectiveness of new, “nature-based” urban                   effectiveness of such designs in comparison to pre-
design scenarios in contributing to ecosystem services                    development natural ecosystems or older design paradigms.
performance (Richards et al., 2019).                                      The reason is twofold: 1) there are still relatively few large-
   Singapore is a world leader in urban greening (Construction            scale nature-centric urban design projects, and many of the
Climate Challenge, 2019), and over the past few years has                 existing development projects have not been built yet, and 2)
increasingly formulated urban designs with the intention of               there is a lack of analytical simulation tools to simulate the
increasing urban ecosystem services. Urban designers are now              ecosystem service performance of such projects.
adopting “nature-based solutions,” defined as interventions                   The aim of this study is to investigate the potential
that use nature to provide solutions to climate mitigation and            ecosystem service impacts of an urban design that is
adaptation challenges (Nesshov̈ er et al., 2017). In particular,          intended to enhance the provision of ecosystem services.
nature-based solutions that have been implemented in                      We use the case study example of Singapore’s forthcoming
Singapore include the implementation of green and blue                    Tengah town, which is the latest town to be designed under
infrastructures, which refer to “natural, semi-natural and                HDB’s Green Town Program. The Tengah development has
man-made green and blue features” (Nesshöver et al.,                     been marketed as “Tengah, the Forest Town,” highlighting its
2017), and ecological engineering techniques, which design                ecological design vision (HDB, 2016). The specific objectives of
systems that integrate the human environment into its natural             this study are to (1) compare the modeled ecosystem service
environment (Nesshov̈ er et al., 2017). Such nature-based                 provision of the proposed Tengah development against the
solutions have been adopted into planning frameworks                      current pre-development ecosystem services of this area, and
under several initiatives, for example the Green Towns                    (2) compare the ecosystem service provision of the proposed
Program initiated by the Housing and Development Board                    development with three older towns in Singapore that were not
(HDB). The HDB is Singapore’s major residential developer,                designed with a specific focus on urban greening or ecosystem
providing housing for around 80% of the population (Ng,                   services. We analyzed indicators of six ecosystem services
2017). The Green Towns Program is guided by a Biophilic                   using a spatially explicit modeling approach, and have
Town Framework that aims to increase the interconnectedness               released the six ecosystem service models as a publicly
between developments and nature, and sets targets for the                 available software package for the R programming language
quantity and quality of urban greenery that should be                     (Richards et al., 2021).
incorporated into developments (HDB, 2018). Another
example of an initiative that is aimed at encouraging the
uptake of nature based solutions is the “Active, Beautiful,               METHODS
Clean” Waters (ABC Waters) Program that is implemented
by Singapore’s Public Utilities Board (PUB). This program                 Tengah Town Project Description
aims to create aesthetic and functional blue spaces in                    Located in the western region of Singapore and spanning 700 ha
neighbourhoods, that regulate water supply and flow, and                   in size, Tengah town will be the next town to be developed in
allow residents to benefit from the cultural ecosystem                     Singapore (Heng, 2016). The region is currently dominated by

Frontiers in Environmental Science | www.frontiersin.org              2                                     April 2021 | Volume 9 | Article 610155
Tan et al. Nature-Based Solutions for Sustainable Towns
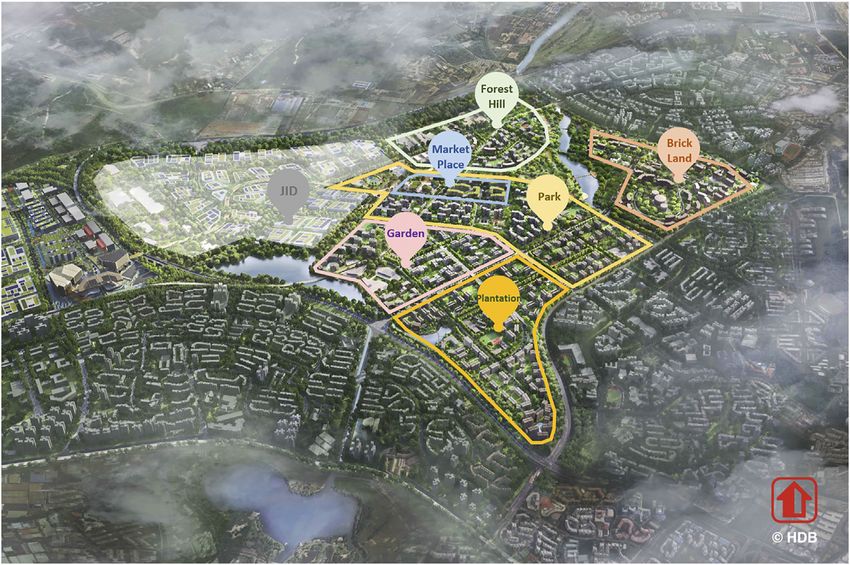
FIGURE 1 | Artist’s impression of the proposed Tengah Town, showing separate districts (HDB, 2020a).
secondary rainforest, which has been abandoned for several Running through the center of Tengah, green and blue
decades (Gaw et al., 2019; Yee et al., 2015). The design infrastructures can also be found–notably, a 20 ha large
concept for Tengah town was largely influenced by its history “Central Park” that will provide residents with a place for
as a former Kampung1 with abundant plantations and lush recreation, as well as feature ponds and canals to regulate
vegetation, thereby inspiring town planners to place greenery stormwater flow and grant residents easy access to blue spaces
as central to Tengah’s development (Heng, 2017). The (HDB, 2016).
development has also been guided by HDB’s Biophilic Town The Tengah town will be segmented into a business district
Framework, which aims to heighten the interconnectedness of called the Jurong Innovation District (JID), a Market Place
development and nature, and increase the benefits that District that features Tengah’s town center, as well as five
landscapes and residents can receive from natural ecosystems unique residential districts, each possessing a specific theme
(HDB, 2018; Wong, 2018). Following three years of planning, surrounding the concepts of community and nature, while still
HDB formally announced the official masterplan for Tengah in aligning closely with the overarching theme of a “Forest Town”
2016, dubbing Tengah as Singapore’s first ‘Forest Town’ that will (Choo, 2018; Figure 1). Plantation District, for instance, adopts
house around 42,000 new homes (HDB, 2016; Yeo, 2016). the theme of “Community Farming” and will feature Community
The new Tengah town features the adoption of several nature- Farmways, which are plots of land that are made available for
based solutions in its proposed development. Ecological community farming (Choo, 2018; HDB, 2020a). Facilities to allow
principles are featured in the design of the Tengah Nature for “farm-to-table” dining and farmers’ markets for residents to
Way, a 5 km long and 100 m wide forest corridor that is sell their own home-grown produce are also part of HDB’s plans
aimed at increasing ecological connectivity between the in developing the Plantation District (HDB, 2020a). The other
neighboring biodiversity hotspots of the Western Water four residential districts include the Garden District, Brickland
Catchment Area, Bukit Timah Nature Reserve and the Central District, Forest Hill District and Park District (Figure 1).
Catchment Nature Reserve (Chan, 2013; HDB, 2016). This
corridor will be landscaped using tropical rainforest trees to
create a rich forest habitat (HDB, 2016). Hiking trails have Current Urban Characteristics of Tengah
also been integrated to bring the community closer to nature and Comparison Towns
(HDB, 2016). A forest fringe is seen to run along the perimeter of To run spatially explicit urban ecosystem service models requires
Tengah, enveloping Tengah within a forest habitat (Heng, 2016). a number of data layers that describe key ecological, physical, and
social characteristics of the landscape (Schröter et al., 2014; Baró
et al., 2016). Singapore has a wealth of such datasets for the
1
The term “Kampung” is a Malay and Indonesian term for “village” and refers to current situation at a national scale, which were used to run the
urban informal settlements that were very commonly found in Singapore for early baseline ecosystem services assessment for Tengah, and the
settlers (Ministry of National Development, 2019; Akbar and Edelenbos, 2020). comparison assessments for older towns. Existing datasets for
Frontiers in Environmental Science | www.frontiersin.org 3 April 2021 | Volume 9 | Article 610155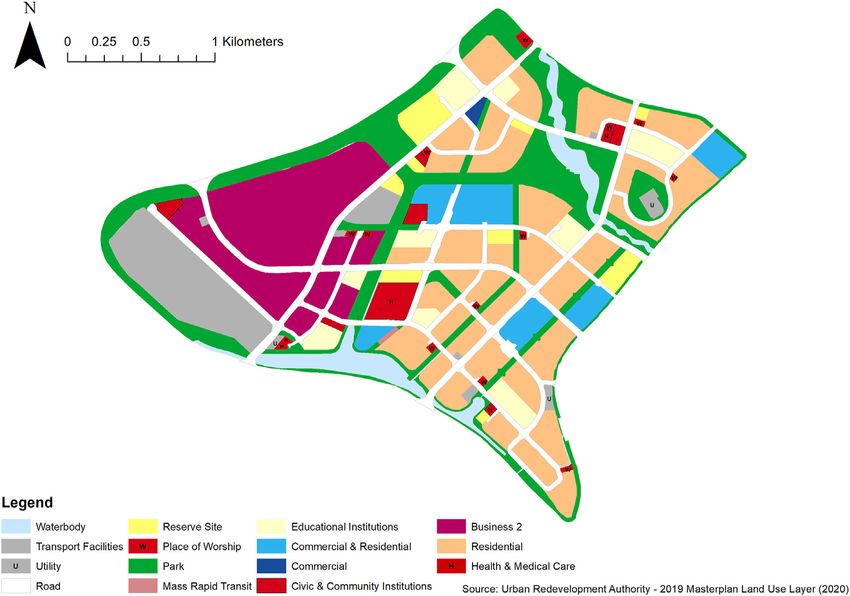
Tan et al.                                                                                              Nature-Based Solutions for Sustainable Towns

Singapore include maps of ecosystem cover (Gaw et al., 2019),              mapping of the current situation outlined in Current Urban
topography (Dissegna et al., 2019), vegetation height (Dissegna            Characteristics of Tengah and Comparison Towns. Hence, for
et al., 2019), leaf area index (LAI) (Richards and Wang, 2020),            the purposes of this study, placement of physical structures and
building locations and heights (Dissegna et al., 2019), the                landscape elements within the town was estimated with reference
locations of publicly accessible nature spaces (Richards et al.,           to limited available information, such as artists’ renderings, and
2020a), and the road network (OpenStreetMap, 2020).                        our interpretation of this available information. The results of this
    In addition to these data layers, we collated new data to fulfill       study therefore do not constitute an expectation of the final
other key parameters. The normalized-difference vegetation                 ecosystem service study provided in the Tengah Forest Town, but
index (NDVI) was mapped over the study area using satellite                an estimate based on a hypothetical scenario created from our
images from the Sentinel 2 satellite (Richards and Wang, 2020).            current understanding of likely future development at the site.
To remove artifacts due to cloud cover and temporal variation in           The following sections provide a brief overview of how the
NDVI, the median NDVI from all cloud-free Sentinel 2 images                ecosystem coverage and landscape parameters of Tengah town
taken between the 1st of January 2016 and 30th of March 2018               were estimated and simulated. For a more comprehensive
was composited in Google Earth Engine (Gorelick et al., 2017;              description of this process, the detailed methods can be found
Richards and Wang, 2020).                                                  in Section 1.1 and 1.2 of the Supplementary Material. An
    Population data for Singapore are available at the level of            overview of the workflow used to generate this potential
planning region sub-zones, which are equivalent to large                   scenario is given in Figure 2.
neighbourhoods (Tan and Samsudin, 2017). To estimate the
population at a finer scale of resolution, we combined the sub-             Projected Ecosystem Coverage for Proposed Tengah
zone population dataset with a dataset of building locations and           Development
volume. These two layers were combined using an approach                   The outline design of the main roads, parcels, and land uses was
similar to dasymetric mapping, which is a commonly used                    digitized from the Singapore Masterplan 2019, which outlines the
technique for increasing the resolution of population and                  expected development proposed over the next five years (URA,
other datasets (Mennis, 2003; Holt et al., 2004). Population               2020a). Land use categories found within the new Tengah town,
data of Singapore residents (Citizens and Permanent                        according to the updated 2019 Masterplan, can be found in
Residents) from June 2016 were downloaded from the data.                   Figure 3.
gov.sg archive (Singstat, 2016). Building data were taken from                 To simulate how Tengah might appear after development,
a dataset originally sourced from OpenStreetMap                            elements such as buildings, roads and vegetation were digitized
(OpenStreetMap, 2020), but with additional digitization to                 into the land use categories to create a simulated town plan. These
include all buildings in Singapore in approximately 2017                   elements were digitized with close reference to a range of artist
(Dissegna et al., 2019). This dataset also included the height of          impressions and site plans for each land use type to achieve the
all buildings, by cross-referencing with a high resolution digital         most accurate representation of Tengah town. The final digitized
surface model (Dissegna et al., 2019). To identify the likely              town map created can be found in Figure 4.
residential buildings in Singapore, we first cross-referenced the               The simulated Tengah town plans were reclassified to match
buildings dataset to include only those buildings that were located        the ecosystem land cover categories specified in Singapore’s
within “residential,” “residential with commercial at first storey,”        national ecosystem cover map (Gaw et al., 2019), to facilitate
and “residential/institution” land use classes as defined on the            comparable ecosystem service modeling. The various ecosystem
2008 Singapore Master Plan. Despite the older date of this dataset,        land cover types found in each land use type can be found in
it is expected that most regions have not changed in residential           Table 1.
land use. Within the buildings located in residential regions, we              With reference to Table 1, several assumptions were made
excluded very large buildings as these are unlikely to be                  during the categorization process. The first assumption was that
residential. Very large buildings were defined as those with a              all reserve sites would be classified as having only ‘Managed
building volume (area × height) greater than the 99th percentile           Shrub/Turf’ present, with little to no tree cover. This is in
(124910.1 m2). The population within each subzone was shared               accordance with what has been observed in other reserve sites
among all residential buildings falling within the subzone, in             in HDB New Towns. The second assumption is that the Tengah
proportion to the volume of each building. We therefore assume             Nature Way would be classified entirely as “Unmanaged Trees,”
that within each residential neighborhood, each resident occupies          despite Tengah Nature Way being classified as a “Park” in the
an equal living volume.                                                    2019 URA Masterplan. The rationale for this is attributed to
                                                                           HDB’s intention to transform the Tengah Nature Way into a rich
                                                                           forest habitat, planting it with rainforest tree species and designed
Projected Urban Impacts of Future                                          with the intention of “replicating the natural structure of forests
Development at Tengah                                                      as much as possible” (HDB, 2016; National Parks Board, 2020a,
At the time of the study, the exact plans for buildings and                para. 2). Tengah Nature Way would therefore, feature forest-like
infrastructure within the new Tengah town were yet to be                   vegetation instead of managed trees that are more commonly
finalized. We thus developed a systematic method to collate                 found in parks. The third assumption involves the Tengah Forest
the available information regarding this proposed                          Fringe, which runs along the perimeters of the entire Tengah
development, and integrate it into a format comparable to our              town. Although little information has been released on what

Frontiers in Environmental Science | www.frontiersin.org               4                                       April 2021 | Volume 9 | Article 610155
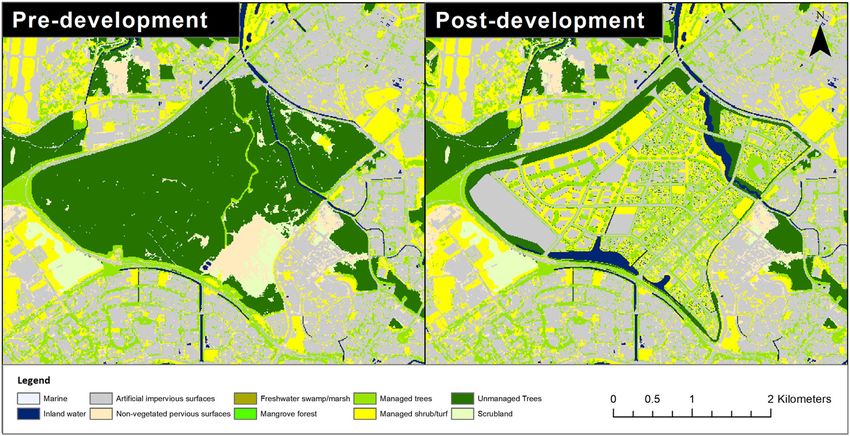
Tan et al.                                                                                                    Nature-Based Solutions for Sustainable Towns

  FIGURE 2 | Workflow Diagram briefly detailing the methods adopted in this study.

  FIGURE 3 | Land use categories in currently proposed Tengah Town development.

vegetation type the Forest Fringe would comprise of, its name                      category of “Artificial Impervious Surface” only. A comparison of
alludes to the presence of forest-like vegetation. Hence, it would                 Tengah’s pre-development land cover and simulated proposed
similarly be categorized under the “Unmanaged Trees” category                      development can be found in Figure 5.
rather than “Managed Trees”. The fourth and last assumption is
that the land cover categories of “Utility,” “Place of Worship,”                   Projection of Other Landscape Parameters for
“Civic and Community Institutions” and “Mass Rapid Transit”                        Proposed Tengah Development
would have little vegetation found within their premises.                          The supplementary layers required to run ecosystem service
Therefore, these land cover types were assigned an ecosystem                       models were first updated to include the proposed land cover

Frontiers in Environmental Science | www.frontiersin.org                      5                                      April 2021 | Volume 9 | Article 610155
Tan et al.                                                                                                        Nature-Based Solutions for Sustainable Towns

  FIGURE 4 | Digitized town map of potential scenario for Tengah Town under current proposals.

TABLE 1 | Land cover categories found in each land use.

Land Uses                                                                                                     Land Cover Types

Business 2                                                                         Artificial Impervious Surface
                                                                                   Managed Shrub/Turf
                                                                                   Managed Trees
Civic and Community Institutions                                                   Artificial Impervious Surface
Commercial                                                                         Artificial Impervious Surface
                                                                                   Managed Shrub/Turf
                                                                                   Managed Trees
Commercial & Residential                                                           Artificial Impervious Surface
                                                                                   Managed Shrub/Turf
                                                                                   Managed Trees
Educational Institutions                                                           Artificial Impervious Surface
                                                                                   Managed Shrub/Turf
                                                                                   Managed Trees
Parks                                                                              Artificial Impervious Surface
                                                                                   Managed Shrub/Turf
                                                                                   Managed Trees
                                                                                   Unmanaged Trees—Only for Tengah Nature Way and Tengah Forest Fringe areas
Place of Worship                                                                   Artificial Impervious Surface
Reserve Site                                                                       Managed Shrub/Turf
Residential                                                                        Artificial Impervious Surface
                                                                                   Managed Shrub/Turf
                                                                                   Managed Trees
Road                                                                               Artificial Impervious Surface
                                                                                   Managed Trees
Utility                                                                            Artificial Impervious Surface
Waterbody                                                                          Inland Water

changes at Tengah. Updated layers were created to simulate                         road network (see Current Urban Characteristics of Tengah and
NDVI, LAI, topology, maximum vegetation height,                                    Comparison Towns above). The following paragraphs briefly
accessibility of an area to the public, population, buildings and                  describe how each layer was updated, and a more detailed

Frontiers in Environmental Science | www.frontiersin.org                       6                                         April 2021 | Volume 9 | Article 610155
Tan et al. Nature-Based Solutions for Sustainable Towns
FIGURE 5 | Comparison of the Tengah Forest Town and surrounding regions in the pre-development and simulated proposed post-development situation.
TABLE 2 | Computation of residential population data.
Flat Type Estimated No. Estimated no. of
no. of occupants of flats available occupants in each
flat type
Plantation Village (Residential/Commercial)–15 Residential Blocks
2-room 2 426 852
3-room 3 112 336
4-room 4 484 1936
5-room 4 398 1592
3Gen 6 0 0
Total no. of residents 4716
Average no. per block 4716 /15 314.4
Plantation Grange (Residential)–10 Residential Blocks
2-room 2 346 692
3-room 3 91 273
4-room 4 406 1624
5-room 4 258 1032
3Gen 6 39 234
Total no. of residents 3855
Average no. per block 3855 /10 385.5
description of his process can be found in the Supplementary construction of buildings and incoming population. The
Material. building heights of all residential buildings within Tengah
For NDVI, LAI and vegetation height, the median values of were assigned a uniform number based on calculating the
these parameters were calculated for each ecosystem cover type average number of storeys residential blocks would have.
currently present in Singapore. These median values were then These calculations were performed separately for each
assigned to their respective ecosystem category type represented residential plot type (Residential and Residential/Commercial).
in the proposed post-development Tengah land cover map. New Building heights for other building types were estimated from
roads that were digitized in Tengah were merged with the original SLA’s 2014 elevation data of Punggol town, another town within
road layer to reflect the updated road networks. The accessibility Singapore that is in close proximity to an aerodrome, similar to
layer was also updated to amend the accessibility of the entire Tengah.
Tengah region from ‘inaccessible’ to “accessible” to the public. The number of people living in each residential block was
The population and building data layers, which contain assigned a uniform population number based on a set of
information on the location of residential buildings and all calculations that estimates the number of people living in each
buildings respectively (represented as point features), together residential block. Similar to calculations performed for estimating
with building height and the population residing in these building height, these calculations were also performed separately
buildings, were also updated to reflect the proposed for each residential plot type. An assumption of the approximate
Frontiers in Environmental Science | www.frontiersin.org 7 April 2021 | Volume 9 | Article 610155Tan et al. Nature-Based Solutions for Sustainable Towns
TABLE 3 | Building heights and population data for each building type found in 2021), population (Department of Statistics Singapore, 2019),
Tengah Town.
population density, and land use makeup. All information
Building Type Height (m) Population provided is based on data acquired from 2019.
(no. of people) Being developed earlier, the urban designs for these three
towns were conceived with a different focus, compared to the
Business 2 30 0
Civic and Community Institution 17 0 more nature-centric and environmentally sustainable designs
Commercial 24 0 used in the development of Tengah town. In the 1980s and
Educational Institutions 18 0 1990s, which coincided with Singapore’s early years
Place of Worship 10 0 independence and development, urban greening was
Residential Blocks 49.6 385.5
Residential/Commercial Blocks 49.6 314.4
functional and not designed with a specific focus on ecosystem
Utility 15 0 services (Neo, 2020). Urban designs during this period were
pragmatic and people-centric, with a focus on strengthening
town identities and communities (Neo, 2020). The identity of
Pasir Ris town was deeply anchored in its history as a recreational
number of people living in each flat type, (i.e. 2-room Flexi, 3- town, where early settlers had set up resorts and holiday
room etc.) was made and multiplied with the total number of each bungalows, as well as its location along the eastern coast of
flat type within each residential development. Table 2 presents Singapore (Choo, 2018). This led to planners centering Pasir
these assumptions and calculations. All buildings found in other Ris’s urban design around the theme of “a town by the sea” and its
land use parcels were assigned a population of zero. A summary identity as a resort-like recreational town, which explains the
of the building heights and population residing in each building sight of “seashell motifs” and “portholes” in many urban designs
type can be found in Table 3. throughout the estate (Choo, 2018; Lim, 2019). Similar to Pasir
Ris, Sengkang town was built around a theme that was inspired by
its history as well–in particular, its history as a fishing village and
Comparison of Ecosystem Services port (Chua, 2017). This led to planners designing Sengkang
Provided Between Tengah Town and Three around the theme of a “Town for the Seafarer” (Cornelius-
Other Older Towns Takahama, 2016). In the case of Bishan town, its design was
In addition to assessing the ecosystem service provision at Tengah inspired by its former history as a burial ground for the Chinese
under pre-development and proposed development scenarios, we community, where pavilions were commonly found throughout
compared ecosystem service provision against three other towns, (Lee, 2015). These iconic pavilions were the inspiration behind
namely Sengkang, Pasir Ris and Bishan. These three towns were the distinct pitched roofs on public housing buildings that
selected based on their maturity, with Sengkang being the newest Singaporeans closely associate Bishan with (Lee, 2015). Parks
estate, which completed its first phase of development in 1997 and open spaces were present throughout these urban designs for
(Tee, 2000). Pasir Ris and Bishan were completed in 1988 and recreation and inter-mingling (Neo, 2020), however, extensive
1985 respectively (Choo, 2018; Lee, 2015). Supplementary urban greening in buildings and other infrastructures were not
Figure S1 shows where these towns are located in Singapore prominent features. This explains the observations in Pasir Ris
and Table 4 briefly compares distinctions between these towns in and Bishan town, for example, where both towns feature flagship
relation to structural information such as land area (Data.gov.sg, parks such as the Pasir Ris Town Park and Bishan-Ang Mo Kio
TABLE 4 | Comparison of structural information between Tengah, Sengkang, Pasir Ris and Bishan towns.
Tengah Sengkang Pasir Ris Bishan
Year first built Still under construction 1994 1983 1983
Land area (ha) 700 1055 601 690
Population 112173 (estimated) 244600 148020 88010
Population 160.25 231.85 246.29 127.55
density (per ha)
(rounded up
to 2 d.p)
Land use Primarily residential with industrial, Primarily residential with Primarily residential with some Primarily residential with industrial,
commercial and recreational industrial, commercial and aquaculture, industrial and commercial and recreational
developments recreational, (e.g. malls) commercial developments developments
developments
Location Inland town found in the western region of Inland town found in the north- Coastal town found at the Inland town found in the central of
Singapore eastern fringe of Singapore eastern coast of Singapore Singapore
Green cover 58.88% total green cover. Features 43.34% total green cover 40.69% total green cover 42.54% total green cover
managed parks, inland water features Features managed parks and Features managed parks, Features managed parks and inland
such as waterways, and nature spaces inland water features such as beaches and inland water water features such as concretized
made up of secondary forests concretized canals features such as ponds canals and naturalized waterways
Frontiers in Environmental Science | www.frontiersin.org 8 April 2021 | Volume 9 | Article 610155Tan et al. Nature-Based Solutions for Sustainable Towns
Park respectively, but have an absence of rooftop gardens and rainfall event. It was assumed that this rainfall fell uniformly
other urban greening features that are prominently found in over the study region.
Tengah’s proposed development. The runoff per pixel from a 110 mm storm event was
By selecting these three more mature towns for comparison, a estimated using the curve number table provided in USDA.
comparison of results between these towns can provide an (1986), which assigns curve numbers to all ecosystem types
assessment of how effective nature-based solutions—that defined by USDA. The curve numbers used for different
underpin the “Forest Town” principles—allow for greener and vegetation cover types are given in Supplementary Table S1.
more sustainable towns, while also affirming if these solutions It was assumed that all urban area soils were of low quality (Grade
have any impact on improving urban ecosystem services. Data on D), and all forest soils were of high quality (Grade A). A more
the landscape structure of the three comparison towns were detailed explanation of the runoff retention model can be found
extracted from the national-level datasets outlined in Current in Section 2.4 of the Supplementary Material document attached
Urban Characteristics of Tengah and Comparison Towns. to this paper, or the R package documentation (Richards et al.,
2021).
Ecosystem Service Modeling
A series of ecosystem services models were run for each scenario Access to Nature Spaces
and case study to assess the impact on ecosystem service The accessibility that people have to nature spaces was modeled
provision. These models evaluated the different developments by cross-referencing population data at the building level against
for their impacts on the following aspects: local air temperature, the spatial extent of three types of nature spaces; (1) patches of
noise attenuation, removal of PM10 particulate matter, air green space larger than 1 ha in size, (2) high-quality natural
pollution, runoff retention, access to green and blue spaces for ecosystems, and (3) blue spaces. We defined nature spaces that
recreation and, soil erosion. These indicators were chosen to were within 300 m of the buildings housing each respondent as
cover a range of regulating, provisioning, and cultural services, “accessible,” based on a typical short walking distance for an
(Elmqvist et al., 2015), and correspond to services which have urban resident. This measure of accessibility thus characterizes
been recognized as important by the general public of Singapore neighborhood accessibility in the home surroundings of each
(Drillet et al., 2020). With the exception of the public access to person (Annerstedt Van Den Bosch et al., 2016; WHO, 2016;
outdoor spaces model, the ecosystem service models focused on Huang et al., 2017).
evaluating the supply of services to people, rather than Patches of green space larger than 1 ha have previously been
incorporating aspects of demand. This constraint to supply proposed as an indicator of green spaces of recreational
side modeling constrains the relevance of the indicators here, importance, and particularly relevant for positive health
because demand for ecosystem services is also required in order outcomes (Annerstedt Van Den Bosch et al., 2016; WHO,
for the benefits to be realized (Nedkov and Burkhard, 2012; Wolff 2016; Huang et al., 2017). We considered all types of green
et al., 2015). However, it is complex to develop models for spaces as eligible for inclusion in this parameter, including all
ecosystem service demand, particularly when projecting future types of managed and unmanaged vegetation, and wetlands (Gaw
scenarios, as human preferences and opinions can change et al., 2019). Accessibility and exposure to high-quality natural
unpredictably over time (Richards et al., 2020b). In the ecosystems may be important in improving people’s exposure to
context of urban planning, it may be sufficient for quantitative biodiversity and their feelings of connectedness to nature
models to provide information on ecosystem service supply for (Shanahan et al., 2017; Richards et al., 2020a). We defined
most services, as the magnitude and spatial variation in demand “high-quality natural” ecosystems as those terrestrial, coastal,
can be assessed qualitatively by designers and planners. The and freshwater that are generally less heavily managed by
urban ecosystem service models were implemented in the R humans, including unmanaged vegetation with and without
programming language (R Core Team, 2020), and have been tree canopy cover, freshwater marshes and swamps, and
made publicly available as an R package; the NCS2020 package mangroves (Gaw et al., 2019). Similar to the recreational green
(Richards et al., 2021). The following sections explain the spaces, a minimum patch size of 1 ha was applied to define high-
methods behind the creation of each ecosystem service model, quality natural ecosystems. We defined blue spaces as those that
with more details provided in the Supplementary Material and R had open water; including freshwater reservoirs, canals, and
package documentation (Richards et al., 2021). rivers, and the sea (Gaw et al., 2019). We did not set a
minimum patch size for the blue space indicator, due to the
Runoff Retention lower coverage of this ecosystem type across Singapore. For each
For the purpose of estimating the proportion of rainfall runoff scenario or town, we quantified the proportion of the total town
that is prevented by the presence of the ecosystem, we modeled population living with access to each outdoor space type as an
runoff under extreme precipitation conditions. In Singapore, indicator of overall access in the town. For mapping spatial
“large storm” events are defined as > 70 mm h−1 falling within variation in access to outdoor spaces within each scenario or
an hour (Chow et al., 2016). The frequency of such events, and town, we quantified the proportion of the town population that
their magnitude, has increased over time, with the modeled had access to each pixel of outdoor space. Higher values thus
annual maximum hourly rainfall in 2010 around 110 mm h−1 indicate outdoor spaces which are accessible to more people. A
(Chow et al., 2016). We therefore used 110 mm h−1 as the input more detailed explanation of the accessibility model can be found
rainfall for this model, to simulate an extreme but plausible in the R package documentation (Richards et al., 2021).
Frontiers in Environmental Science | www.frontiersin.org 9 April 2021 | Volume 9 | Article 610155Tan et al. Nature-Based Solutions for Sustainable Towns
Road Traffic Noise Attenuation 2016). Particulate matter concentration data are collected and
We modeled the potential of vegetation to attenuate road traffic noise reported by the National Environment Agency (NEA) of
by generating hypothetical noise sources as 30,000 points located Singapore on an hourly basis. We took the median of the
randomly along the road network within each study region. We annually reported 99th percentile daily (24 h) mean values
assumed that the source noise level at each point was 70 dB—an reported online between (NEA, 2020). This gave a value of 84 μg
intermediate-high value for traffic noise (Ma and Yano, 2004; Chin per m3 (Supplementary Figure S3), a relatively high exposure to
et al., 2019). Noise was modeled only at 1000 Hz, as this approximates PM10 in the Singapore context.
the dominant frequency of traffic noise (Can et al., 2010). Leaf area index was parameterized in tree-covered areas using
Noise attenuation was modeled using a simple 2-dimensional a national map of leaf area index developed using remote sensing
mechanistic model, following the methodology of the System for (Richards and Wang, 2020). We assigned all areas of unmanaged
the Prediction of Acoustic Detectability (SPreAD) model, which or managed vegetation without a tree canopy to have a minimum
is freely available as a package for ArcGIS (Reed et al., 2012). The leaf area index of 2 following the URA LUSH program guidelines
general approach and equations used to model the component (URA, 2014). Further details on the modeling of the PM10
forms of noise loss are similar to the International Organization removal ecosystem service can be found in Section 2.3 of the
for Standardization guideline on attenuation of sound during Supplementary Material document attached to this paper, or the
propagation outdoors (ISO 9613-2, 1996). Our model evaluates R package documentation (Richards et al., 2021).
four types of noise attenuation over space, including attenuation
due to spherical spreading loss, atmospheric absorption, Soil Erosion
topographic and barrier effects, and vegetation cover loss. The The ecosystem service of soil erosion was modeled using a variation
ecosystem service is quantified as the noise attenuated by of the Universal Soil Loss Equation (Wischmeier and Smith, 1978),
vegetation, after accounting for the other types of noise proposed by Guerra et al. (2014). This ecosystem service is defined as
attenuation. A more detailed explanation of how each type of the difference between the total actual soil loss and the potential soil
noise attenuation was modeled can be found in Section 2.2 of the loss estimated assuming that no vegetation was present. The results
Supplementary Material document attached to this paper, or the are presented as the proportion of the possible erosion that was
R package documentation (Richards et al., 2021). prevented by the presence of vegetation.
The Universal Soil Loss Equation requires data on the rainfall
Ambient Air Temperature Reduction runoff factor, topographic factor, soil erodibility factor, and vegetation
The impact of urban ecosystems on the ambient air temperature cover factor. The rainfall runoff factor was taken from a global
was modeled using a land cover regression approach. Data on air mapping of erosivity (Panagos et al., 2017). The topographic factor
temperature were collated from two existing weather station represents the propensity of the landform to soil erosion, and was
networks between the 1st of October 2015 and the 2nd calculated from the national digital elevation model using an
October 2018, covering 45 weather stations in different parts established equation (Moore and Burch, 1986). The soil erodibility
of Singapore (Supplementary Figure S2). Data were aggregated factor was modeled based on field data for soil particle size distribution
into hourly means for each weather station by taking the mean of and clay content, following a method previously proposed by the
all measurements within the hour, and modeled as a function of Universal Soil Loss Equation (Renard et al., 1997). Field samples were
vegetation cover explanatory variables at a range of distances collected from 24 locations for each vegetation cover type, with
from the weather station locations. The resulting model samples taken from the top 20 cm of soil. The median values for
coefficients were used to estimate the average ambient the five vegetation types were taken and applied to the corresponding
temperature reduction due to the presence of surrounding vegetation cover categories (Supplementary Table S2). The
vegetation at 3pm across the study regions. A more detailed vegetation cover factor was derived using satellite imagery, using a
description of the methods taken to model ambient air conversion from the normalized difference vegetation index (Van der
temperature reduction can be found in Section 2.1 of the Knijff et al., 2000). A more detailed explanation of the runoff retention
Supplementary Material document attached to this paper, or model can be found in Section 2.5 of the Supplementary Material
the R package documentation (Richards et al., 2021). document attached to this paper, or the R package documentation
(Richards et al., 2021).
Removal of PM10 Particulate Matter Air Pollution
The removal of PM10 particulate matter from the air by vegetation
over the course of 24 h was modeled under no precipitation and RESULTS
relatively high ambient PM10 conditions, using a model commonly
used in urban ecosystem service modeling studies (Zinke, 1967;
Nowak et al., 1998; Escobedo and Nowak, 2009; Manes et al., 2014;
Comparison of Modeled Ecosystem Service
Bottalico et al., 2016). This model requires data on spatial variation Provision in Tengah, Before and After
in the leaf area index, as well as information on the background Proposed Development
PM10 concentration, deposition flux of PM10, and resuspension The proposed Tengah redevelopment was modeled to result in
rate. Deposition flux and resuspension rates were parameterized reduced ecosystem service provision in relation to retaining
using commonly used global values (Lovett, 1994; Nowak et al., 1998; runoff, reducing air temperatures, absorbing PM10 particulate
Escobedo and Nowak, 2009; Manes et al., 2014; Bottalico et al., matter, reducing road traffic noise, and protecting soil from
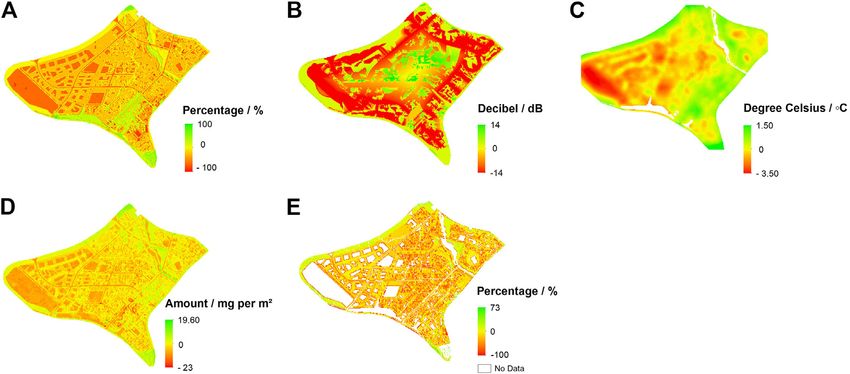
Frontiers in Environmental Science | www.frontiersin.org 10 April 2021 | Volume 9 | Article 610155Tan et al. Nature-Based Solutions for Sustainable Towns FIGURE 6 | Comparison of ecosystem service performance between modeled results for Tengah before and after the proposed development (A) Average percentage of rainfall retention by vegetation (B) Average noise reduction contributed by vegetation (C) Average reduction in air temperature contributed by vegetation (D) Average reduction in PM10 particulate matter by vegetation (E) Average proportion of soil protected from erosion. potential soil erosion (Figure 6). The magnitude of losses in provision in the post-development scenario. In particular, ecosystem service provision was estimated to be substantial; areas surrounding the edge of the proposed development ranging from 35% in the case of rainfall retention to 62% for region showed greater declines in the provision of this noise attenuation (Figure 6). It was not possible to compare the ecosystem services, most likely due to the removal of accessibility of nature spaces to the public quantitatively using the vegetation for urban development (Figure 7B). Conversely, models, because the region of Tengah is currently inaccessible to some areas toward the center of the site show projected the public and has been for several decades. Hence, while the increases in the provision of the road traffic noise accessibility model would not provide any valuable information attenuation service. This is due to the closer proximity of for our analysis, it is true that the opening up of the Tengah region roads to the center of the site under the proposed to the public will significantly increase people’s accessibility and redevelopment. Under the current scenario, the center of exposure to nature in the area. Tengah is too distant from any roads to experience the The average percentage of rainfall retained in Tengah before benefits of road traffic noise reductions. development was modeled to amount to an average of 69.24% for a Vegetation in Tengah before development was modeled to 110 mm rainfall event. Conversely, for the same rainfall event, the reduce air temperatures by an average of 3.03°C, while vegetation average percentage of rainfall retained in Tengah after development in Tengah after development was modeled to reduce air was recorded at 44.61 %—a 24.63% decrease from Tengah’s temperature by an average of 1.57°C. The temperature retention ecosystem service prior to development (Figure 6A). reduction ecosystem service provided by vegetation in Tengah There was considerable spatial variation in modeled changes in after development is thus evaluated to have decreased by 49%, rainfall retention capacity within Tengah post-development compared to the temperature reduction ecosystem service (Figure 7A). A large proportion of the eastern half of Tengah provided by vegetation in Tengah before development recorded either a slight decrease or increase in rainfall retention (Figure 6C). A significant contributor to the loss in capacity. These areas belong to mainly “Residential” and temperature reduction ecosystem services provision can be “Residential/Commercial” plots, as well as areas categorized as traced mainly to the “Business 2” and “Transport Facilities” “Unmanaged Trees” and “Parks.” Conversely, areas recording a land use regions that are situated in the western half of more significant decrease in rainfall retention capacity were found to Tengah, the loss of temperature reduction services was greater be congregated toward the western half of Tengah, belonging mainly (Figure 7C). These areas record a maximum loss of −3.43°C in to the “Business 2” and “Transport Facilities” land use cover sites. temperature reduction. Results from running the noise model also show expected The amount of PM10 particular matter removed per m2 in declines in road traffic noise attenuation ecosystem service post-development Tengah was modeled to be approximately half Frontiers in Environmental Science | www.frontiersin.org 11 April 2021 | Volume 9 | Article 610155
Tan et al.                                                                                                                  Nature-Based Solutions for Sustainable Towns

  FIGURE 7 | Maps depicting the change in ecosystem service provision for each Ecosystem Service Model, derived from performing a raster subtraction of Tengah
  after development from Tengah before development (A) Average percentage of rainfall retention by vegetation (B) Average noise reduction contributed by vegetation (C)
  Average reduction in air temperature contributed by vegetation (D) Average reduction in PM10 particulate matter by vegetation (E) Average proportion of soil protected
  from erosion.

of that of the pre-development scenario (Figure 6D). The spatial                         to the three older towns (Figure 8; Supplementary Table S3).
variation in the changes to the amount of PM10 particulate matter                        Overall, the proposed Tengah scenario leads in four out of six
removed post-development appears relatively homogeneous,                                 ecosystem services; runoff retention, access to nature, air
with most developments within Tengah recording a decrease                                temperature reductions, and PM10 removal (Figure 8).
in PM10 particulate removal ecosystem service (Figure 7D). A                                Vegetation was modeled to retain 44.61% of rainfall under the
significant decrease in PM10 particulate removal ecosystem                                simulated extreme event in Tengah, while Sengkang, Pasir Ris
service can be observed in the “Business 2” and “Transport                               and Bishan recorded rainfall retention values of 39.49%, 38.29%,
Facilities” site in the west, due to the lower vegetation cover in                       and 35.79% respectively (Supplementary Table S3). This places
these areas. The Tengah Forest Fringe region, as well as the                             Tengah at the forefront of providing the rainfall retention
Tengah Nature Way are the only few areas within Tengah to                                ecosystem service, followed by the towns of Bishan, Pasir Ris,
contribute to a net increase in PM10 particulate removal                                 and Sengkang.
ecosystem service, due to the high-quality unmanaged                                        The results of the accessibility to nature spaces model show the
vegetation that was simulated to grow in these areas in the future.                      strong performance of the proposed Tengah scenario in
    A general net loss in the soil erosion prevention ecosystem                          providing this ecosystem service to residents. In particular,
service provision was modeled in Tengah after development, with                          there was a marked increase in the proportion of residents
an average of 33.67 mg of soil no longer protected from potential                        who are within 300 m to both natural green spaces and green
erosion (Figure 6E). The spatial variation of changes in soil                            spaces of at least 1 ha in Tengah, with Tengah recording a
protection appears rather homogeneous, with a large proportion                           percentage of 32.51 and 98.41% for each category respectively
of land area within Tengah recording approximately −50 mg in                             (Supplementary Table S3). This is in contrast to the other towns,
soil erosion ecosystem service loss (Figure 7E). Areas that feature                      which in comparison to Tengah, record lower percentages in both
no net change in soil erosion ecosystem service provision are                            categories. Bishan is evaluated to have 6.78% and 96.08% of its
found in areas that are categorized under the “Unmanaged Trees”                          population within 300 m of natural green spaces and green spaces
ecosystem category. Considerable areas of the Tengah region                              respectively (Supplementary Table S3). This is lower than the
could not be modeled for soil erosion loss under the post-                               proportion of residents with access to green and natural green
development scenario, because they were simulated to be                                  spaces in Tengah. Sengkang is found to record percentages of
covered in impervious surfaces that would not experience                                 4.68% and 83.45% respectively (Supplementary Table S3), the
surface soil loss. These regions are mapped as “No Data”                                 lowest proportion of residents with access to natural green spaces
(Figure 7E).                                                                             and green spaces among the four towns. Pasir Ris, on the other
                                                                                         hand, records percentages of 16.10% and 86.96% respectively
                                                                                         (Supplementary Table S3). Evaluating residents’ access to blue
Comparison of Proposed Tengah Forest                                                     spaces, we find that Pasir Ris has the highest proportion of
Town Development Against Other Towns                                                     residents who have access to blue spaces compared to the four
A comparison of eight indicators derived from six ecosystem                              other towns, with 37.42% of Pasir Ris’s residents living within
service models reveal that the proposed Tengah development                               300 m from a waterbody (Supplementary Table S3). Bishan
would provide higher provision of five indicators when compared                           comes in second, with 35.12% of its residents living within

Frontiers in Environmental Science | www.frontiersin.org                            12                                              April 2021 | Volume 9 | Article 610155
Tan et al. Nature-Based Solutions for Sustainable Towns
FIGURE 8 | Comparison of ecosystem services performance for each town; Tengah Town, Sengkang Town, Pasir Ris Town and Bishan Town. Ecosystem
services include (A) average percentage of rainfall retention by vegetation (B) percentage of population with access to green spaces of at least 1 ha (C) percentage of
population with access to high-quality natural ecosystems of least 1 ha (D) percentage of population with access to blue spaces (E) average noise reduction contributed
by vegetation (F) average reduction in air temperature contributed by vegetation (G) average reduction in PM10 particulate matter by vegetation (H) average
proportion of soil protected from erosion.
300 m of a waterbody (Supplementary Table S3). Fewer human comfort given the magnitude of the background noise
residents in Tengah and Sengkang, on the other hand, are (Centers for Disease and Control Prevention, 2019). This is
found to live more than 300 m away from blue spaces and particularly likely to be the case when considering that other
therefore, recording 20.80% and 12.40% of its residents with forms of noise attenuation–such as attenuation over distance, and
access to blue spaces respectively. the effect of buildings in blocking sound waves, act to reduce
Results obtained from running the noise attenuation model noise levels in the urban environment. Attenuation from these
reveals that the new Tengah town does not provide the best noise non-vegetation mechanisms was modeled first in our approach.
abatement ecosystem service. Out of the four towns, Tengah is Results from the air temperature reduction modeling reveal
placed second, with the vegetation noise attenuation effect that Tengah provides among the highest levels of this ecosystem
averaged at 4.09 dB (Supplementary Table S3). Pasir Ris is service. Alongside Pasir Ris, vegetation within these two towns
found to have provided the best noise abatement ecosystem provide the best cooling effect among the other towns, reducing
service, with vegetation reducing noise levels by an average of air temperature by an average of 1.57°C (Supplementary Table
4.26 dB within the neighborhood (Supplementary Table S3). Bishan comes behind Tengah and Pasir Ris in its temperature
S3)–approximately 4% greater than that of Tengah. Sengkang reduction ecosystem service performance, modeling a
is found to come in third, with vegetation reducing noise by an temperature decrease of 1.55°C (Supplementary Table S3).
average of 3.66 dB. Conversely, Bishan was found to have This is followed by Sengkang, which models a temperature
provided the weakest noise abatement ecosystem service decrease of 1.52°C (Supplementary Table S3).
(Supplementary Table S3). Overall, however, the noise The mean amount of PM10 particulate matter removed by
abatement ecosystem service provided by vegetation in all four vegetation in Tengah was modeled to amount to 4.78 mg per m2,
towns are low; typically lower than 10 dB. While the decibel scale the highest value recorded among the four towns
is nonlinear, making it complex to assess the magnitude of effect (Supplementary Table S3). Bishan came in the second
for human well-being, a reduction of 10 dB from a 70 dB highest, modeling a removal of 4.14 mg per m2
maximum may not have a substantial impact on improving (Supplementary Table S3). This is followed by Sengkang and
Frontiers in Environmental Science | www.frontiersin.org 13 April 2021 | Volume 9 | Article 610155You can also read