An Overview of the Impacts of Land Use Land Cover Changes (1980-2014) on Urban Water Security of Kolkata - MDPI
←
→
Page content transcription
If your browser does not render page correctly, please read the page content below
land
Review
An Overview of the Impacts of Land Use Land
Cover Changes (1980–2014) on Urban Water
Security of Kolkata
Subham Mukherjee *, Wiebke Bebermeier and Brigitta Schütt
 Department of Physical Geography, Institute of Geographical Sciences, Freie Universität Berlin, Malteserstr.
 74-100, 12249 Berlin, Germany; wiebke.bebermeier@fu-berlin.de (W.B.); Brigitta.Schuett@fu-berlin.de (B.S.)
 * Correspondence: subham.m@fu-berlin.de; Tel.: +49-17622589370

 Received: 13 June 2018; Accepted: 27 July 2018; Published: 30 July 2018

 Abstract: Urban Water Security is essential in urban planning to manage cities’ water infrastructures
 and strengthen their water stress resilience and adaptive capacities. Decision making, governance and
 socio-economic factors play important roles in achieving Urban Water Security. Kolkata is a growing
 megacity in a developing country, which is facing rising pressures on water-environmental provisions
 due to the rapid population growth and urbanization and resultant governance and infrastructural
 issues. This review focusses on Kolkata, which is facing critical water issues, as a case study. The
 study presents an overview of the urban water (in)security and its dimensions in Kolkata city, such
 as water consumption and distribution in the city along with the changing land use-land cover of the
 city area, based on the results obtained from the satellite data-based land use-land cover classification,
 available literature, and documents from public institutions.

 Keywords: population growth; land use-land cover; image classification; change detection;
 water security

1. Introduction
     Urbanization is a human-induced process and results in land use-land cover (LULC) change and
concurrent alteration of the quantity and quality of surface and groundwater resources especially in
the peri-urban areas [1,2]. Land use is a combined result of human activities and natural factors. Land
cover, on the other hand, is either natural or the effects of land use changes due to, especially, human
activities [3,4]. Changing societal needs and priorities come along with the growing number of people
and housing densities [2,5] and in turn affect the environment [1]. Unplanned urbanization results in
sprawled regions within and outside of the city centers; these areas usually lack basic infrastructure
such as treated water supply, sanitation, and electricity [5,6]. In consequence, the resulting water
insecurity in the urban and peri-urban areas is either triggered directly by population increase,
demand-supply problems, problems regarding surface water bodies and availability, problems in
slums regarding sanitation and hygiene or indirectly by the environmental risk related issues (such as
floods) and preconditions (such as shrinkages of surface water bodies, impervious surface effect on
groundwater recharge, and urban heat islands) [7].
     “Water Security” is a conceptualized term, which ensures every citizen with the amount of quality
water required for his or her everyday life [8]. There is no universal definition (neither measurement
index) of Water Security as it varies with approaches and perceived with a different set of goals it
deals with. There is, rather, a range of published definitions of water security by different government,
non-government agencies, and scholars to date. Every definition is different from each other, but there
are a few common factors that integrate all of them. These are the goals that drive the approach to

Land 2018, 7, 91; doi:10.3390/land7030091                                           www.mdpi.com/journal/land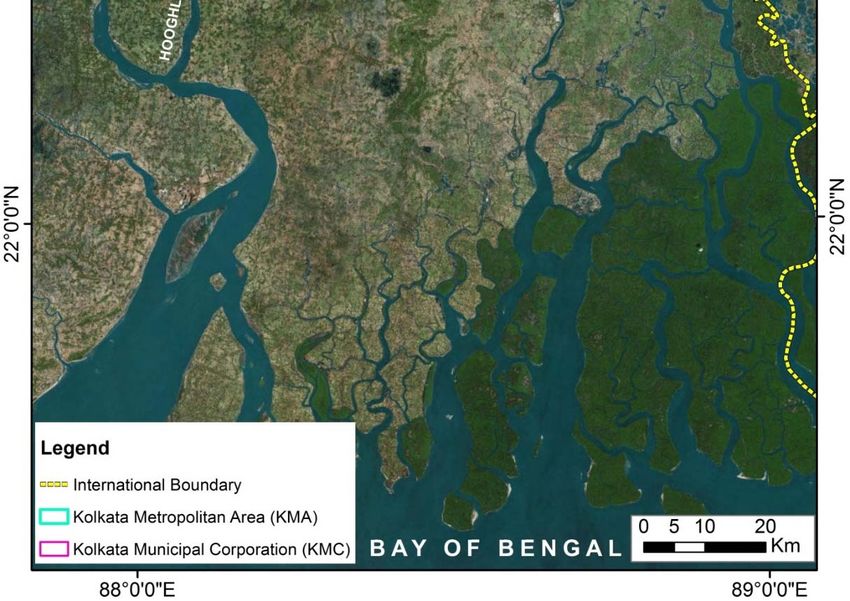
Land 2018, 7, 91                                                                                         2 of 25

reach water security in a region. The concept of urban water security emphasizes the availability and
accessibility of safe and enough water without harming the sustainability of ecosystems, focusing on
reducing the probability or risk of ecological disaster caused by human-induced stresses. Therefore, in
this article we adapted the Sustainable Development Goal 6, which refers to clean, accessible water
for all; however, the right to water security entitles everyone to sufficient, safe, acceptable, physically
accessible and affordable water for domestic uses [9]. Since the issues are huge and requires individual
attention to the details, for this article, the discussion is based on only three broader aspects; i.e., water
demand and supply, accessibility and the risks associated with flood, water-borne diseases, and waste
management—to get an overview of the study area in terms of water security. Water insecurity in
urbanized areas in general is based on various socio-economic factors: next to uncontrolled population
growth, for example, it is based on poor governance and mismanagement of the water supply system.
Parallel, physical processes like climate change must be considered as a catalyst. To establish a
sustainable urban water management system characters such as the ratio between availability and
required amount of drinking water supply, physical and virtual water demand, and the supply of
water are the major components that need to be considered.
      New or newly emerging countries can be characterized as being in a dearth of financial potentiality
to mitigate water-environmental issues. The most number of people who are affected by water related
problems in urban areas, such as water scarcity of required quality water, live in emerging countries [10].
Gaps between national and regional policies for water result in the lack of efficient management plans.
In consequence, management decisions regarding purification, distribution, and extraction facilities,
and to reduce problems associated to sewage disposal and related threats to the downstream areas, are
deficient due to missing governance structures [11].
      Kolkata is the capital of West Bengal state of India. Core Kolkata city spreads over around 200 km2
and has a population of 4.5 million people. The greater urban area includes 41 other cities and hosts
nearly 15 million inhabitants, making it the third largest city area in India. Since 1690, the approximate
year when the British founded Kolkata, it has been expanding randomly without having a proper
master plan [12]. Besides, Kolkata is blessed ecologically because it has, “the Ganga flowing beside its
western end, traditionally huge groundwater reserve and wide wetlands area in its eastern fringe which naturally
treats its waste water and turns that as raw water for fishery and agriculture.” [13]. Despite these advantages,
the city is at present increasingly running into water insecurity.
      The Ganga river system contributes significantly towards the transport of pollutants to the coastal
areas of the Bay of Bengal [14,15]. The river’s poor surface water quality is closely related to its
insufficient waste water treatment facilities [16,17]. In consequence, waterborne diseases are still an
important issue to deal with [14]. Beyond, Kolkata has recently received the ‘extreme risk’ tag as it
ranks 7th on the global list of cities most vulnerable to climate change [18]. It is assumed that until
2025 Kolkata frequently will be hit by storms, cyclones, and hurricanes alongside extreme temperature
and rainfall events. These weather extreme events will affect directly the existing water-environment
and socio-economic activities, bringing risks to human health and eco-system health [16,19].
      In this article, the linkages between LULC change and urban water security are explored for
the Kolkata Municipal Corporation (KMC) area. The focus is set on uncontrolled urbanization
processes and insufficient water management practices, which have their resultant combined effects
on water insecurity within the KMC area. Building on land use-land cover change detections and a
literature survey, the dynamic linkage between land use-land cover change and urban water security
is overviewed. The local scale of urban water security problems within the KMC area caused by land
use-land cover changes over the last four decades and the resulting impacts (direct and indirect) on
the existing infrastructure are addressed through the review of scientific literature and reports.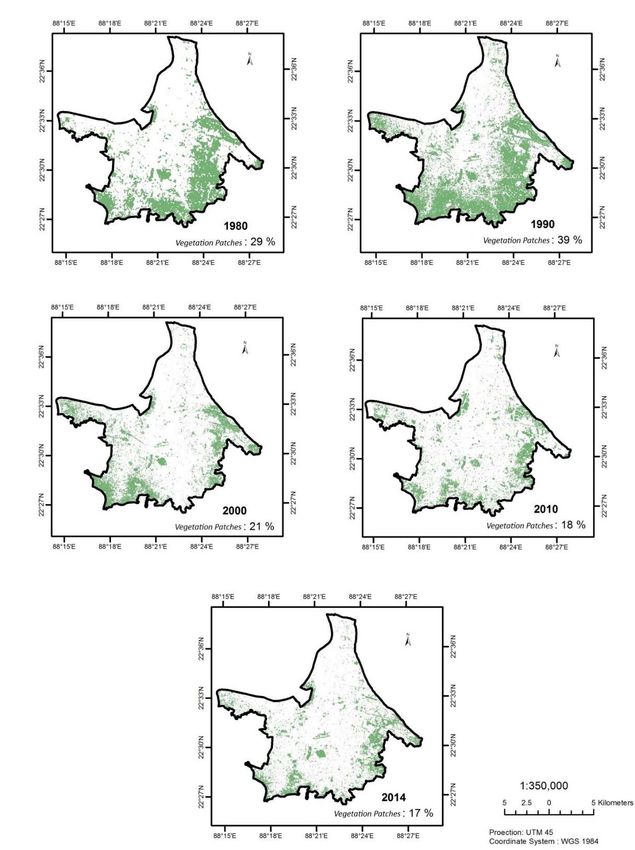
Land 2018, 7, 91 3 of 25
Land 2018, 7, x FOR PEER REVIEW 3 of 25
2.
2. Study
Study Area
Area
The
The study
study area
area encompasses
encompasses the the Kolkata
Kolkata Municipal
Municipal Corporation
Corporation area area (KMC),
(KMC), located
located at at the
the left
left
(eastern) ◦ 280 00”–22◦ 370 30” N
(eastern) bank
bank of of the
the river
riverHooghly
Hooghlyininthe thewestern
westernGangaGangadelta delta(Figure
(Figure1;1;2222°28′00″–22°37′30″ N
88 ◦ 0 ◦ 0
17 30”–88 25 00”E). E).The
The climate
climate of of Kolkata
Kolkata is is a tropical wet-and-dry
88°17′30″–88°25′00″ wet‐and‐dry climate (Aw according according to to
Köppen
Köppenclimate
climateclassification
classification system).
system). TheThe
citycity
experiences
experiences a hotapre-monsoon
hot pre‐monsoon seasonseason
from latefromMarch
late
to mid-June
March followed
to mid‐June by a monsoon
followed period from
by a monsoon period mid-June till mid-September
from mid‐June and lastly
till mid‐September anda slightly
lastly a
cooler
slightlydry season
cooler dry from
season mid-October
from mid‐Octoberuntil mid-March [20]. The
until mid‐March [20].annual
The annualtemperature
temperature averages 26.8
averages
◦ C with monthly mean temperatures ranging from 19 ◦ C in January to 30 ◦ C in May [18]. The hot
26.8 °C with monthly mean temperatures ranging from 19 °C in January to 30 °C in May [18]. The hot
pre-monsoon
pre‐monsoon season season in in Kolkata
Kolkata is is windy
windy inin the
the afternoon
afternoon and and often
often characterized
characterized by by violent
violent dust
dust
storms
storms that
that are
are brought
brought by by the
the convective ‘Kal Baishakhi’
convective ‘Kal Baishakhi’ winds
winds (Nor’westers),
(Nor’westers), accompanied
accompanied by by spells
spells
of
of thunderstorms
thunderstorms or or hailstorms
hailstorms andand heavy
heavy rains
rains with
with ice
ice pellets
pellets oror sleets.
sleets. During
During latelate pre-monsoon
pre‐monsoon
season ◦
season (May
(MayandandJune)June)maximum
maximumtemperature
temperaturerises toto
rises 3838C.°C.The Monsoon
The Monsoon season
season is characterized
is characterized by
heavy
by heavy rainfall, which
rainfall, especially
which is expected
especially in August
is expected (monthly
in August averageaverage
(monthly 306 mm). 306The mm).annual
The rainfall
annual
averages 1582 mm1582
rainfall averages (1971–2010), comprising
mm (1971–2010), average monsoon
comprising rainfalls of
average monsoon 1182 mm
rainfalls of (1971–2010)
1182 mm (1971– and
average
2010) and non-monsoon
average non‐monsoonrainfall of rainfall
365 mmof(1971–2010) [21]. The [21].
365 mm (1971–2010) annual Thesunshine hours in hours
annual sunshine Kolkata in
average
Kolkata 2528 h (1971–2010)
average with the maximum
2528 h (1971–2010) with thenumber
maximum of sunshine
numberhours occurringhours
of sunshine in March. Kolkata
occurring in
is located
March. approximately
Kolkata is located150 km upcountry
approximately 150from the Bay offrom
km upcountry Bengalthecoast,
Bay ofwhich
Bengal is coast,
still under
which the is
influence
still under of the
sea wind
influencemovement
of sea andwind close enough to
movement and make
close it highly
enoughhumid to make corresponding
it highly humid to air
moisture [20]. to air moisture [20].
corresponding
Figure
Figure 1. LocationofofKolkata
1. Location KolkataMunicipal
Municipal Corporation
Corporation areaarea (Source:
(Source: Kolkata
Kolkata Municipal
Municipal Corporation,
Corporation, 2016).
2016).
Kolkata Municipal Corporation area (KMC, area 205 Km2) forms the centroid of the Kolkata
Metropolitan Area (KMA,
Kolkata Municipal area 1886.67
Corporation Km(KMC,
area area 205 Km2 ) the
2) and corresponds to urban
forms theagglomeration
centroid of theofKolkata
the city
of Kolkata (Figure
Metropolitan 2). KMC
Area (KMA, areacurrently
1886.67 Km 2
is composed of 144 (including
) and corresponds the agglomeration
to the urban newly added three) wards,
of the city of
which are grouped into 16 boroughs or administrative blocks (Table 1; Figure 3) having
Kolkata (Figure 2). KMC currently is composed of 144 (including the newly added three) wards, which 21 assemblies
andgrouped
are 3 parliamentary constituencies.
into 16 boroughs Within the
or administrative KMC(Table
blocks area no so‐called
1; Figure “big industry”
3) having occurs;
21 assemblies andthe
3
majority is small scale industries that are mostly spread along the banks of the river
parliamentary constituencies. Within the KMC area no so-called “big industry” occurs; the majority Hooghly. The
Kolkata
is industrial
small scale hub isthat
industries a major market spread
are mostly in eastern India.
along theThe Kolkata
banks of theport functions
river Hooghly. as aThe
major entry
Kolkata
point for neighboring
industrial hub is a majorcountries
market inlike Nepal,India.
eastern Bangladesh, and Bhutan
The Kolkata as wellas
port functions asafor northeast
major India.for
entry point
neighboring countries like Nepal, Bangladesh, and Bhutan as well as for northeast India.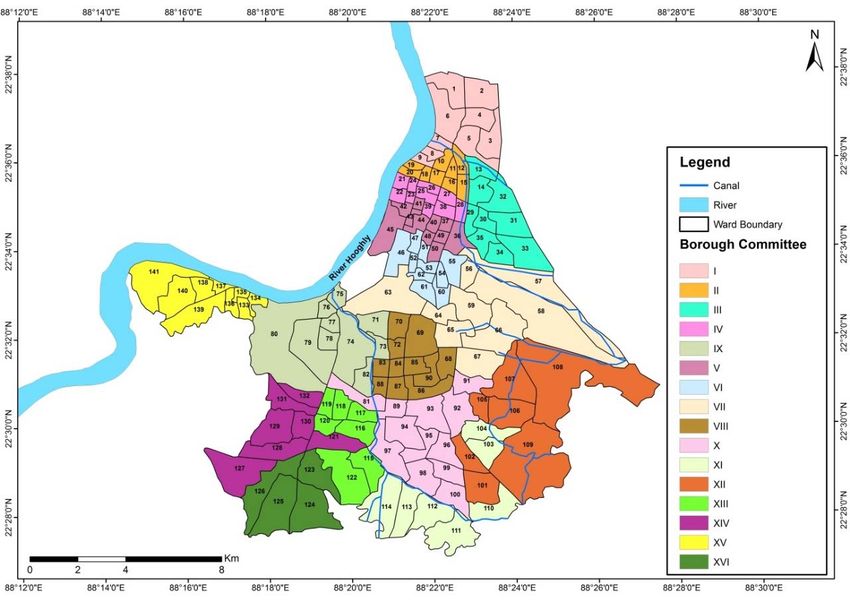
Land 2018, 7, 91 4 of 25
Land 2018, 7, x FOR PEER REVIEW 4 of 25
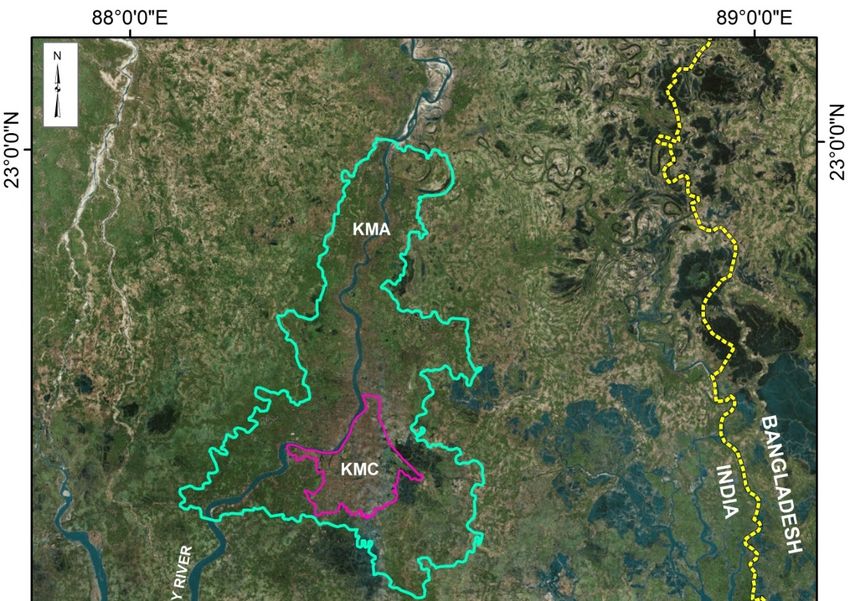
Figure 2. Map showing Kolkata Municipal Corporation area (KMC) and Kolkata Metropolitan Area
Figure 2. Map showing Kolkata Municipal Corporation area (KMC) and Kolkata Metropolitan Area
(KMA) located within the vicinity of the coast and close to the international border of Bangladesh
(KMA) located within the vicinity of the coast and close to the international border of Bangladesh
(Source: Kolkata Municipal Corporation, 2017, Google Map: Google Corporation Pvt Ltd, California,
(Source: Kolkata Municipal Corporation, 2017, Google Map: Google Corporation Pvt Ltd, California,
CA, United States., 2018).
CA, United States., 2018).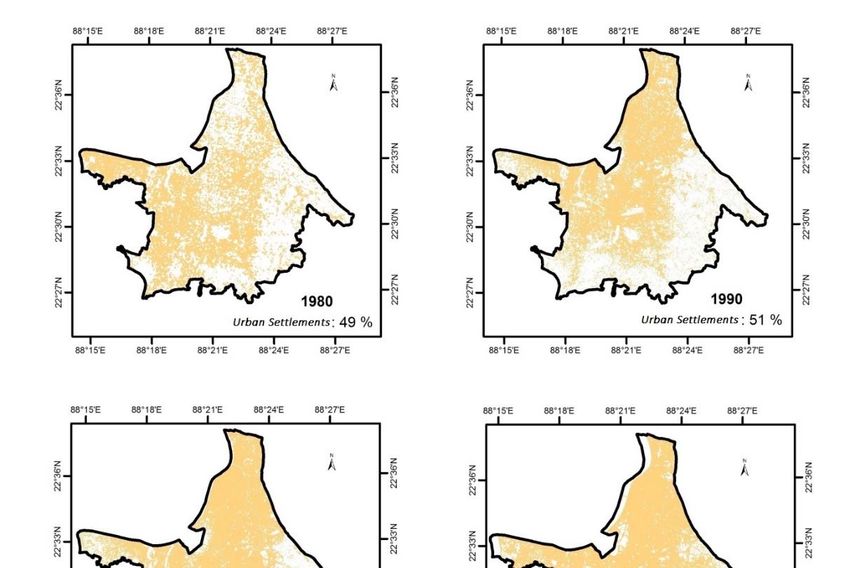
Land 2018, 7, x FOR PEER REVIEW 5 of 25
Land 2018,
Table7, 91
1. List of Boroughs and the associated wards of the Kolkata Municipal Corporation (KMC);5 of 25
(excluding the newly added three wards until 2016 annual report published by KMC; Kolkata
Municipal Corporation,
Table 1. List 2016).
of Boroughs and the associated wards of the Kolkata Municipal Corporation (KMC);
(excluding the newlyBorough
added three wards until 2016 annual
Wardreport
No. published by KMC; Kolkata Municipal
Corporation, 2016).
I 1, 2, 3, 4, 5, 6, 7, 8 & 9
II 10, 11, 12, 15, 16, 17, 18, 19 & 20
Borough Ward No.
III 13, 14, 29, 30, 31, 32, 33, 34 & 35
I
IV 21, 22, 23, 24, 1, 2,25,
3, 26,
4, 5,27,
6, 7,28,
8& 389 & 39
II 10, 11, 12, 15, 16, 17, 18, 19 & 20
IIIV 36, 37, 40, 13,41,
14,42,
29, 43, 44, 32,
30, 31, 45,33,
48,3449&&3550
IVVI 46, 47, 51, 52, 53, 54, 55, 60,
21, 22, 23, 24, 25, 26, 27, 28, 6138&&6239
VII
V 56,
36,57,
37,58,
40,59,
41, 63, 64, 44,
42, 43, 65,45,
6648,& 67
49 & 50
VI
VIII 46, 47, 51, 52, 53, 54, 55,
68, 69, 70, 72, 83, 84, 85, 86, 87, 88 & 60, 61 & 62
90
VII 56, 57, 58, 59, 63, 64, 65, 66 & 67
IX 71, 73, 74, 75, 76, 77, 78, 79, 80 & 82
VIII 68, 69, 70, 72, 83, 84, 85, 86, 87, 88 & 90
IXX 81, 89, 91,71,
92,73,93,
74,94,
75,95,
76, 96, 97, 79,
77, 78, 98,8099&&82100
XXI 103,
81, 89,104,
91, 110,
92, 93,111,
94, 112,
95, 96,11397,&98,
114
99 & 100
XI
XII 103, 104,
101, 102, 105,110,
106,111,
107,112,
108113
&& 114
109
XII
XIII 101, 102, 105, 106, 107,
115, 116, 117, 118, 119, 120 &122 108 & 109
XIII 115, 116, 117, 118, 119, 120 &122
XIV
XIV 121, 127, 128,128,
121, 127, 129,129,
130,130,131131
&132
&132
XV
XV 133, 134, 135, 136, 137, 138,
133, 134, 135, 136, 137, 138, 139,139, 140 &&141
140 141
XVI
XVI 123,123,
124,124,125,125,
126126
Figure
Figure 3.
3. Borough
Borough Map
Map ofof Kolkata
Kolkata Municipal
Municipal Corporation
Corporation area
area featuring
featuring all
all the
the associated
associated wards
wards for
for
each borough (source: Kolkata Municipal Corporation, 2016).
each borough (source: Kolkata Municipal Corporation, 2016).
Kolkata Municipal Corporation is in the lower deltaic plains of the Ganga‐Bhagirthi‐Hooghly
Kolkata Municipal Corporation is in the lower deltaic plains of the Ganga-Bhagirthi-Hooghly
river system; i.e., the southern (Indian) part of Ganga‐Brahmaputra Delta. The down‐stream channel
river system; i.e., the southern (Indian) part of Ganga-Brahmaputra Delta. The down-stream channel
of Bhagirathi Channel in the tidal stretch is called Hooghly. The elevations in this area range between
of Bhagirathi Channel in the tidal stretch is called Hooghly. The elevations in this area range between
3.5 to 6.0 m above mean sea level (amsl) and relief is flat [22]. Locally low‐lying depressions such as
3.5 to 6.0 m above mean sea level (amsl) and relief is flat [22]. Locally low-lying depressions such as
marshes and shallow lakes (Jhils) occur within the deltaic plain. Most of these formations represent
marshes and shallow lakes (Jhils) occur within the deltaic plain. Most of these formations represent
paleo‐river channels of the Bhagirathi. The main slope of the surface dips towards the south. Levees,
paleo-river channels of the Bhagirathi. The main slope of the surface dips towards the south. Levees,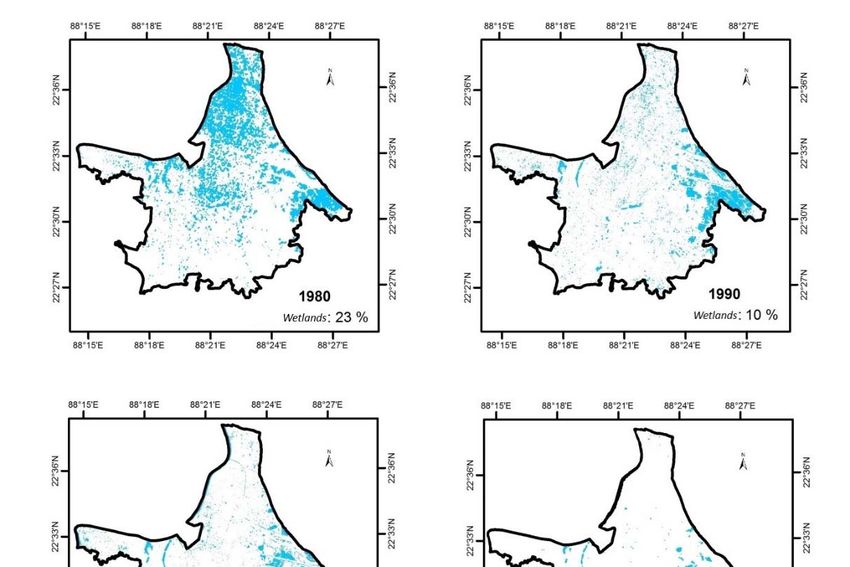
Land 2018, 7, 91                                                                                                                6 of 25

inter-distributary marsh, and paleo-channels are the most important geomorphological features in the
deltaic plain. The Hooghly River and several canals like Bagjola Khal (canal) in the north and Beleiaghata
and Circular Khal (canal) in the central part and Adi-Ganga canal along with Talli nala (canal) in the
southern part of the city drain the area. Presently these waterbodies are largely silted.
     The details of the Water Statistics of Kolkata Municipal Corporation (KMC) area are compiled in
Table 2. The data are primarily based on Census of India [23,24].

                    Table 2. Water Statistics of Kolkata Municipal Corporation (KMC) [12,23–27].

       Demography
       Kolkata Municipal Corporation (KMC) Area (2011)     205 Km2
       Population                                          4,496,694
       Floating Population                                 6,000,000 Per Day
       Total Water Demand (based on KMC)                   925 MLD (as per KMC); 952 (as per CPHEEO)
       Per Capita Demand                                   170 MLD
       Water Supply System
       Sources                                             Hooghly River and groundwater from deep and hand tube-wells
       Surface Water Contribution                          89%
       Groundwater Contribution                            11%
       Total Water Supplied                                1216 MLD
       Per Capita Supplied                                 224 LPCD
       Loss due to Leakage                                 35%
       Actual Supply (After Loss)                          790 MLD
       Per Capita Supply (After Loss)                      145%
       Population served by Water Supply System            92% [27]; 85% [12]
       Per Capita Water Supply Served                      134 LPCD [24]; 171 LPCD [12]
       Demand-Supply Gap (After Loss)                      135 MLD
       Continuity of Water Supplied (in Hours)             8
       Residual Pressure                                   3.6 PSI
       Number of Water Treatment Plants                    4
       Designed Capacity for water Production              1787 MLD
       Actual Capacity                                     1080 MLD
       Operational Capacity for Surface Water Production   1260 MLD
       Operational Capacity for Ground Water Production    114 MLD
       Reservoir Capacity                                  256 ML
       Hand Tube-wells                                     12,000
       Large Tube-wells                                    400
       Water Supply Distribution Pipes                     5687 Km
       Number of Piped Connections                         245,019 [27]
       Household with access to water                      79%
                                                           Unbilled for up to one connection/premise additional water supply:
       Water Price for Domestic Usage
                                                           US$0.15/m3
       Water Price for Commercial, Industrial and          Flat-rate between US$11.6 and US$66 (Monthly) Additional Water
       Institutional Usage                                 Supply: US$0.33/m3

3. Data and Methods

3.1. Data
     The study is primarily based on a literature review and analysis of secondary data from various
sources including data bases available at the Kolkata Municipal Corporation. In addition, satellite
images were analyzed to detect changes of the distribution of the major land cover classes surface
water bodies, building area, and vegetated area since 1980 in ten-year time steps. Satellite images with
their Date of Acquisition (DoA) applied are: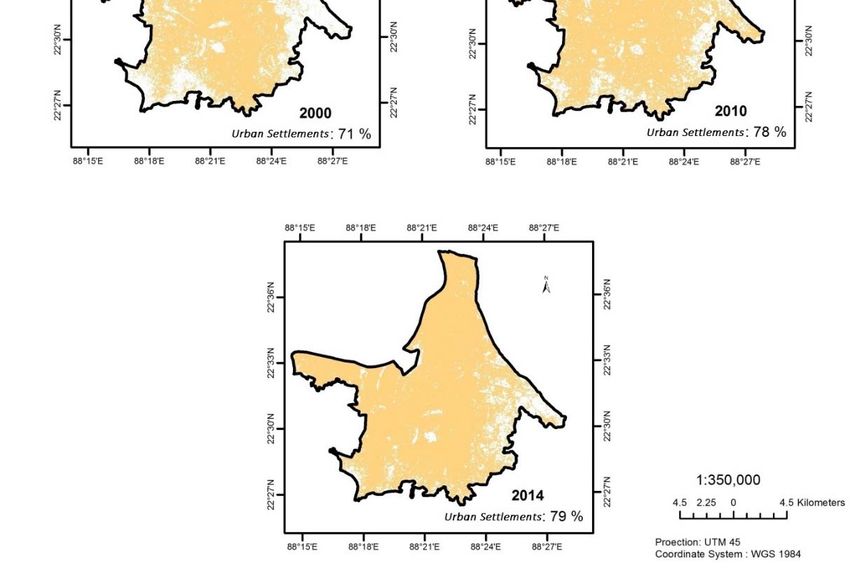
Land 2018, 7, 91                                                                                    7 of 25

(1)   Landsat Multispectral Scanner (MSS) image (path 148, rows 44 and 45) DoA: 16 January 1980;
(2)   Landsat Thematic Mapper (TM) image (path 138, row 44) DoA: 14 November 1990;
(3)   Landsat Enhanced Thematic Mapper Plus (ETM+) image (path 138, row 44) DoA: 17
      November 2000;
(4)   Indian Remote Sensing (IRS) Resourcesat-1 Linear Imaging Self-Scanning Sensor (LISS) III image
      (path 108, row 56) DoA: 3 February 2010;
(5)   Indian Remote Sensing (IRS) Resourcesat-1 Linear Imaging Self-Scanning Sensor (LISS) III image
      (path 108, row 56) DoA: 11 April 2014.

     The details of the spectral and spatial resolutions of the satellite imagery used are given in the
Appendix A. For all images exclusively, optical bands with 30 m × 30 m spatial resolution were
considered to analyze land use and land cover. In a first step, standard images were geometrically and
radiometrically corrected, thereupon images were co-registered to match the overlay with sub-pixel
accuracy (RMS errors ≈ 0.21). For resampling, nearest-neighborhood technique was performed for the
classification to retain the original pixel values.

3.2. Methods
      In a first step, geometrically and radiometrically corrected standard images were obtained;
thereupon images were co-registered to match the overlay with sub-pixel accuracy (RMS errors ≈
0.21). As imagers were taken from 4 different sensors (as well as satellites), the resampling technique
was performed to encounter the differences in spatial resolutions of the images used. Resampling
to change the pixel size can change the neighboring pixel values; images were kept to their original
pixel size despite varying accuracy levels of classification with different spatial resolution. Hence, for
resampling, the nearest-neighborhood technique was performed for the classification to retain the
original pixel values. A vector map of the KMC area was used for clipping and subsetting the imagery.
The classification was performed on the clipped part of each imagery.
      The supervised classification was employed to detect the changes in Land Use-Land Cover (LULC)
within the Kolkata Municipal Corporation area (KMC) from 1980 until 2014. Classification of land
use and land cover was performed on co-registered images using a non-parametrical feature-space
classifier using ERDAS Imagine software (v. 2015). Three broad classes representing urban areas
(associating all the urban settlements and impervious surfaces including roads and bare ground),
vegetated areas (including the road side trees and open fields with grasses) and surface waterbodies
(excluding the river Bhagirathi Hooghly in the west) were mapped. The application of the feature-space
classifier allowed extracting broadly classified classes with a non-normal distribution [28].
      For the assessment of the accuracy level of the classification procedure topographical maps (scale
1:50,000 surveyed in 1975–1976 by the Survey of India) for checking the accuracy for the image of 1980,
LULC maps of 1990 & 2000 (scale of 1:50,000; published by National Atlas and Thematic Mapping
Organization, India) for the image of 1990 & 2000, complemented by ground-truth data obtained
from field surveys (using a GPS device with 1 m accuracy) between 2008–2016 and the analysis of
secondary data (maps and other government reports) collected from the KMC within 2008–2016 were
then compared with the classified satellite imagery of 2010 & 2014. The overall accuracy obtained
is 71% (for 1980), 83% (for 1990), 81% (for 2000), 85% (2010), and 88.89% (for 2014). The review of
literature [29–34] suggests for the acceptance of the achieved accuracies. However, these accuracies
can be further improved with mixed pixel classification techniques [35]. Finally, data generated from
the classified imagery were integrated into spreadsheets to calculate the changes in each class for the
duration from 1980 to 2014. The areas of each class were calculated by clipping the classified imagery
for each class and then multiplying the number of pixels in each image by pixel size.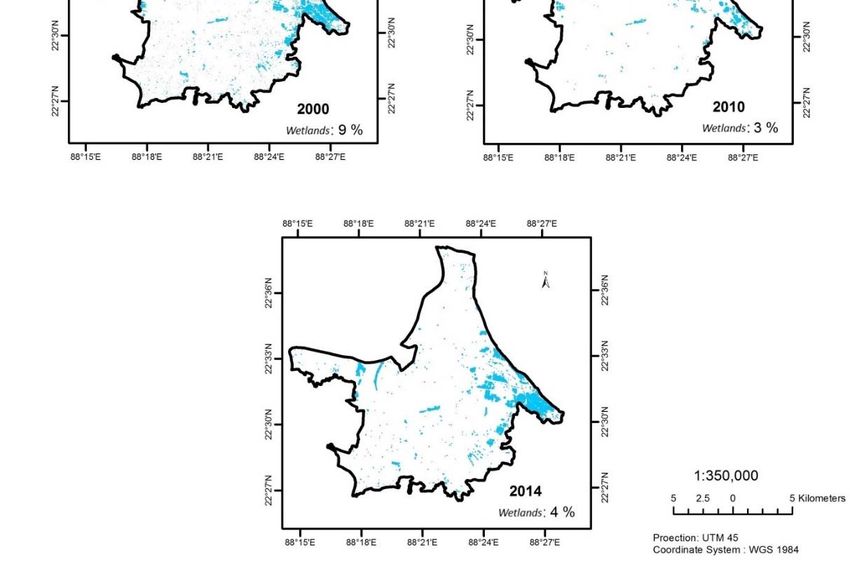
Land 2018, 7, 91                                                                                   8 of 25

4. Land Use-Land Cover Change in Kolkata Municipal Corporation Area Since 1980
      The supervised classification was applied to detect the changes in Land Use-Land Cover (LULC)
within the Kolkata Municipal corporation area (KMC) since 1980 until 2014. It reveals the spatial
patterns of the city showing the changes of the three major land use classes (1) urban settlements
including all the sealed areas such as roads, (2) vegetation patches including roadside tress and green
fields and (3) wetlands including all the ponds, lakes, and canals. Presentation of results follows at
first an overviewing analysis for the Kolkata Municipal Corporation area (KMC) and then continues with a
borough-wise analysis for the Kolkata Municipal Corporation area (KMC) to get detailed information.

4.1. Overviewing Analysis for the Kolkata Municipal Corporation Area (KMC)
      For the Kolkata Municipal Corporation area (KMC) the three major land use classes (1) urban
settlements, (2) vegetation patches, and (3) wetlands were mapped in five time slices covering the period
from 1980–2014. During this time the spatial patterns of these major land use classes show distinct
changes: In 1980 the urban settlements covered 49% of the total KMC area while in 2014 it almost
captured the whole KMC area covering 79% (161.91 Km2 ) of the total area (Figure 4). The urban
settlements area under the KMC only slightly increased (2%) between 1980 and 1990, transforming
from 100.17 Km2 to 103.89 Km2 . Between 1990 and 2000 the urban settlements area increased abruptly,
covering 71% (145.34 Km2 ) in 2000 followed by an additional increase of 7% until 2010 (78% or 162.08
Km2 of the total area of KMC; Figure 4). Within the whole study period (1980–2014) the space occupied
by the wetlands decreased from 47.15 Km2 to 8.70 Km2 and that covered by vegetation patches from 58.60
Km2 to 35.31 Km2 (Figure 5).
      Areas of vegetation patches comprising predominantly big trees in 1980 almost covered an area
of 29% (58.60 Km2 ) of the total KMC area and even expanded to 39% (81.12 Km2 ) until 1990. Since
then, the area covered by vegetation patches continuously shrank, covering 21% of the total KMC area
in 2000 and ultimately, 17% in 2014 (Figure 5). Between 2010 and 2014 the area covered by vegetation
patches increased slightly in the eastern part of Kolkata and in some scattered parts of southern Kolkata
in comparison to the other parts of the study area. Nevertheless, at the same time the areas covered
by wetlands reduced from 47.15 Km2 to 20.90 Km2 (Figure 6). This indicates that wetlands are not
necessarily transformed directly to urbanized areas but were desiccated and overgrown by vegetation.
The areas covered by wetlands decreased to more than half within the whole KMC area between 1980
and 1990 (23% in 1980 and 10% in 1990) (Figure 6). In the following decades the areas covered by
vegetation patches as well as those covered by wetlands constantly declined. In 2014, the percentage of
areas covered by wetlands accounted only 4% (8.7 Km2 ) of the total KMC area which, however, was 1%
more than in 2010 (7.42 Km2 ) (Figure 6).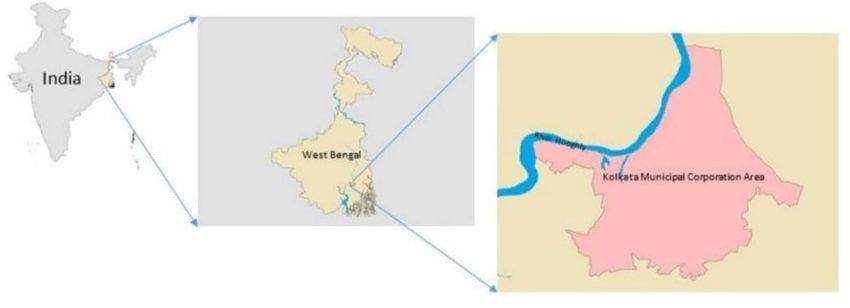
Land
Land       7, x7,FOR
        2018,
     2018,        91 PEER REVIEW                                                                                    9 of925
                                                                                                                          of 25

     Figure  4. Distribution
        Figure                of urban
                4. Distribution         settlements
                                  of urban           (brown
                                            settlements (brownpatches)  within
                                                                  patches)     Kolkata
                                                                           within       Municipal
                                                                                  Kolkata MunicipalCorporation
                                                                                                      Corporationarea
                                                                                                                    area
     (KMC)    in  time   slices  from    1980   to  2014  (decade‐wise)     (Data  base  courtesy:  Satellite  Image
        (KMC) in time slices from 1980 to 2014 (decade-wise) (Data base courtesy: Satellite Image interpretation
     interpretation
        from Landsat from   Landsat
                       (USGS)    and (USGS)      and LISS
                                      LISS III series      III series
                                                       (ISRO,   India)(ISRO,
                                                                       and theIndia)
                                                                                Govt.and the Govt.
                                                                                      of West       of India).
                                                                                              Bengal,   West Bengal,
     India).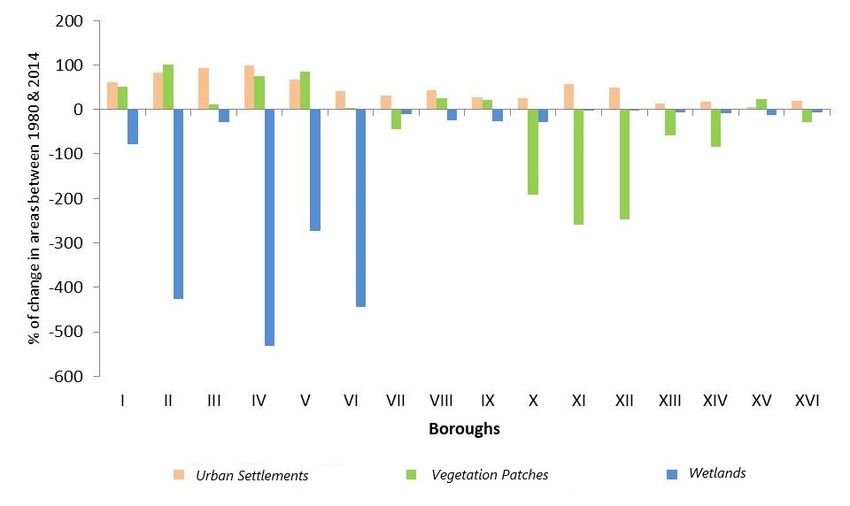
Land
Land       7, x7,FOR
        2018,
     2018,        91 PEER REVIEW                                                                              1025
                                                                                                           10 of of 25

     Figure 5. Distribution of vegetation patches (green patches) within Kolkata Municipal Corporation area
        Figure 5. Distribution of vegetation patches (green patches) within Kolkata Municipal Corporation area
     (KMC) in time slices from 1980 to 2014 (decade‐wise) (Data base courtesy: Satellite Image
        (KMC) in time slices from 1980 to 2014 (decade-wise) (Data base courtesy: Satellite Image interpretation
     interpretation from Landsat (USGS) and LISS III series (ISRO, India) and the Govt. of West Bengal,
        from Landsat (USGS) and LISS III series (ISRO, India) and the Govt. of West Bengal, India).
     India).
Land 2018, 7, 91 11 of 25
Land 2018, 7, x FOR PEER REVIEW 11 of 25
Figure 6. Distribution
Figure 6. Distribution of wetlands (blue
of wetlands patches)
(blue within
patches) Kolkata
within KolkataMunicipal Corporation
Municipal Corporationarea (KMC)
area (KMC)
area from
area 1980
from to 2014
1980 to 2014(decade‐wise)
(decade-wise)(Data base
(Data courtesy:
base Satellite
courtesy: Image
Satellite interpretation
Image from
interpretation Landsat
from Landsat
(USGS)
(USGS)and LISS
and LISSIII III
series (ISRO,
series India)
(ISRO, and
India) thethe
and Govt. of West
Govt. Bengal,
of West India).
Bengal, India).
4.2.4.2.
Borough‐Wise Analysis
Borough-Wise forfor
Analysis thethe
Kolkata Municipal
Kolkata Corporation
Municipal Area
Corporation (KMC)
Area (KMC)
ForFor
spatially
spatiallymore
more detailed analysesofofland
detailed analyses land use‐land
use-land cover
cover the wards
the wards were clustered
were clustered into
into boroughs.
boroughs. The results show borough‐wise the amount of increase and decrease of spatial
The results show borough-wise the amount of increase and decrease of spatial distribution of the distribution
of three
the three
broadbroad
landland use‐land
use-land cover
cover classes
classes throughout
throughout the study
the study period
period in percentage
in percentage (Figure
(Figure 7) in
7) and
andkmin km
2 2 (Figure
(Figure 8). The
8). The distribution
distribution of impervious
of impervious urban
urban areaarea covered
covered in 2014
in 2014 75%75% or more
or more of the
of the KMC
KMC (Figure 7). The variations in the spread of the three major land cover classes itemized by
boroughs clearly indicates that the spread of urban settlements took place by replacing areas allocatedLand 2018, 7, 91 12 of 25
(Figure
Land 2018,7).
7, x The
FOR variations
PEER REVIEWinthe spread of the three major land cover classes itemized by boroughs 12 of 25
clearly indicates that the spread of urban settlements took place by replacing areas allocated to vegetation
to vegetation
patches patchesThe
or wetlands. or wetlands. The results
results reveal reveal that
that boroughs boroughs
II, IV, II, which
V, and VI, IV, V, are
andmainly
VI, which are mainly
concentrated in
concentrated in the north and center of the KMC, lost major areas of wetlands
the north and center of the KMC, lost major areas of wetlands within 1980 to 2014. within 1980 to 2014.
Figure 7.
Figure Relativedistribution
7. Relative distributionof
ofmajor
majorland
landuse‐land
use-landcover
coverclasses
classesin
inKolkata
KolkataMunicipal
Municipal Corporation
Corporation
area (KMC) showed decade-wise since 1980. Major land use-land cover classes are differentiated
area (KMC) showed decade‐wise since 1980. Major land use‐land cover classes are differentiated into
into urban settlements, vegetation patches, and wetlands; also compare Figures 4–6. (Data base courtesy:
urban settlements, vegetation patches, and wetlands; also compare Figures 4–6. (Data base courtesy:
Satellite Image interpretation from Landsat (USGS) and LISS III series (ISRO, India) and the Govt. of
Satellite Image interpretation from Landsat (USGS) and LISS III series (ISRO, India) and the Govt. of
West Bengal, India).
West Bengal, India).
Borough-wise results
Borough‐wise resultsforforthethe
first decade
first studied
decade (1980–1990)
studied (Figure
(1980–1990) 8) depict
(Figure 8) that all the
depict that boroughs
all the
except boroughs
boroughs no. VII, IX,no.
except boroughs and XII
VII, IX,lost
andalmost thealmost
XII lost wetlands
entire the entireareas by 2014
wetlands areas(Figure
by 2014 8).(Figure
The most 8).
severe loss in wetlands is observed for borough II, where the area declined from
The most severe loss in wetlands is observed for borough II, where the area declined from 84% to 14%. 84% to 14%. In contrast,
within
In borough
contrast, II, urban
within boroughsettlements
II, urbanincreased fromincreased
settlements 16% to 84% frombetween
16% to198084%and 2014 (Figure
between 1980 and 8). In the
2014
decade of
(Figure 8).1990 to decade
In the 2000, theofdistribution
1990 to 2000, vegetation
of the patchesof
distribution and the areaspatches
vegetation covered and wetlands
bythe areas declined
covered
in almost
by wetlands all declined
the boroughs of KMC,
in almost all but
the the major declines
boroughs of KMC, were
butevident in boroughs
the major declines in the central
were evidentand in
northern part
boroughs in theofcentral
the KMC and(I,northern
III, VII, VIII,
part XI andKMC
of the XIII) (I, vegetation
forIII, patches
VII, VIII, XI andand borough
XIII) II in thepatches
for vegetation north
of the
and KMC for
borough II the spread
in the north wetlands.
of of the KMC Within the spread
for the decade of from 2010 urban
2000 toWithin
wetlands. settlements
the decade from continued
2000 to
spreading 2 2
2010 urban within the KMC
settlements covering
continued an areawithin
spreading of 162.08
the kmKMCincovering
2010 (2000: 145.33
an area ofkm ). Concurrently,
162.08 km in 2010
2
areas covered
(2000: 145.33 km by2).vegetation patches
Concurrently, continuously
areas covered bydeclined
vegetation from 41.96
patches Km2 (2000) declined
continuously to 36.43 Km from 2 (2010).
41.96
Even more pronounced the spread of wetlands declined from 18.62 Km 2 (2000) and 7.42 Km 2 (2010).
Km (2000) to 36.43 Km (2010). Even more pronounced the spread of wetlands declined from 18.62
2 2
These
Km trends
2 (2000) andstopped
7.42 Km or2 even
(2010).reversed between
These trends 2000 and
stopped or even when urban
2014reversed settlements
between 2000 andcovered
2014 161.91
when
2
Km (+8% compared to 2000), vegetationto patches Km2 (−4%
urban settlements covered 161.91areas
Km2 under
(+8% compared 2000),covering
areas under35.31vegetation compared
patches covering to
2000) Km²and wetlands coveredto8.70 Kmand 2 (−5% compared to 2000) of the KMC in 2014. to These changes
35.31 (−4% compared 2000) wetlands covered 8.70 Km 2 (−5% compared 2000) of the
became
KMC particularly
in 2014. apparentbecame
These changes in the particularly
southern part of the KMC
apparent in the(Figures
southern5–7),partwhich
of the gets
KMCespecially
(Figures
apparent
5–7), which by gets
the borough
especially wise break down
apparent by theofborough
the land use-land
wise break cover
down change
of the(Figures 8 and 9).cover
land use‐land
change (Figures 8 and 9).Land2018,
Land 2018,7,7,x 91
FOR PEER REVIEW 1313ofof2525
Figure 8. Borough-wise decadal distribution of the major land use-land cover classes (km2 ) in Kolkata
Figure 8. Borough‐wise decadal distribution of the major land use‐land cover classes (km2) in Kolkata
Municipal Corporation area (KMC) decade-wise since 1980 differentiated into (a) urban settlements
Municipal Corporation area (KMC) decade‐wise since 1980 differentiated into (a) urban settlements
(built-up and sealed areas), (b) vegetation patches and (c) wetlands. (Data base courtesy: Satellite Image
(built‐up and sealed areas), (b) vegetation patches and (c) wetlands. (Data base courtesy: Satellite Image
interpretation from Landsat (USGS) and LISS III series (ISRO, India) and the Govt. of West Bengal,
interpretation from Landsat (USGS) and LISS III series (ISRO, India) and the Govt. of West Bengal,
India).
India).Land
Land2018,
2018,7,
7,x91FOR PEER REVIEW 14
14of
of25
25
Figure 9.
Figure Boroughwise
9. Borough wisedifferentiated
differentiatedrelative
relative distribution
distributionof of major
major land
land use‐land
use-land cover
cover classes
classes in
in
KolkataMunicipal
Kolkata MunicipalCorporation
Corporationarea
area(KMC)
(KMC)in in1980
1980and
and 2014.
2014. Major
Majorland
landuse‐land
use-landcover
coverclasses
classesare
are
shown differentiated
shown differentiated by
by in
in (a) urban settlements,
(a) urban settlements, (b) vegetation patches,
(b) vegetation patches, and
and (c) wetlands. (Data
(c) wetlands. (Data base
base
courtesy: Satellite Image interpretation from Landsat (USGS) and LISS III series (ISRO, India)
courtesy: Satellite Image interpretation from Landsat (USGS) and LISS III series (ISRO, India) and the and the
Govt. of West Bengal, India).
Govt. of West Bengal, India).
The
The relative
relative change
change ofof the
the distribution
distribution of of each
each major
major land
land use‐land
use-land cover
cover class
class was
was calculated
calculated
dividing
dividingthe
thedifference
difference ininarea
area coverage
coverage between
between19801980and
and2014
2014by bythe
thearea
areacovered
coveredby bythe
therespected
respected
land
land use‐land
use-land cover
cover class
class in
in 2014.
2014. The
Thepositive
positiveresults
resultsof
ofaa class
class signify
signify the
the increase
increase whereas
whereas the
the
negative
negativeresults
resultsindicate
indicatethe
thedecrease
decreasein inareas
areas between
between19801980andand2014
2014 (Figure
(Figure 10).
10). Areas
Areascovered
coveredby by
wetlands
wetlands show
show the
the highest
highestrelative
relative decrease
decreasein in distribution;
distribution;in inboroughs
boroughsIIto to VI
VI the
the areas
areas under
under the
the
coverage
coverage ofofany
anylake,
lake,ponds,
ponds,or orother
othersurface
surfacewaterbodies
waterbodiesin in1980
1980changed
changeduntil
until2014
2014either
eitherinto
intourban
urban
settlements
settlementsororvegetation
vegetationpatches.
patches.The
Thedistribution
distributionof ofvegetation
vegetationpatches
patchesdeclined
declinedininthetheboroughs
boroughsX, X,XI,
XI,
and
andXII
XIIbetween
between19801980and
and2014,
2014,being
beingtransformed
transformedinto intourban
urbansettlements.
settlements. The
Thechange
changeforforthe
thevegetation
vegetation
patches
patches were
were major
major in the boroughs of of II,
II, VI,
VI, and
and V.
V.Simultaneously,
Simultaneously,a acontinuous
continuousand andstable
stable process
process of
of urbanization
urbanization occurred
occurred in boroughs
in boroughs X–XVI. X–XVI. Nevertheless,
Nevertheless, the areas
the areas coveredcovered by wetlands
by wetlands were
were mainly
mainly
changed changed in the boroughs
in the boroughs I–VIII (Figure
I–VIII (Figure 10). 10).Land 2018, 7, 91 15 of 25
Land 2018, 7, x FOR PEER REVIEW 15 of 25
Figure 10.
Figure Borough-wise change
10. Borough‐wise change (%) of urban
(%) of urban settlements, vegetation patches,
settlements, vegetation patches, and wetlands in
and wetlands in Kolkata
Kolkata
Municipal Corporation area (KMC) from 1980 to 2014. (Data base courtesy: Satellite Image
Municipal Corporation area (KMC) from 1980 to 2014. (Data base courtesy: Satellite Image
interpretation from
interpretation from Landsat
Landsat (USGS)
(USGS) and
and LISS
LISS III
III series
series (ISRO,
(ISRO, India)
India) and
and the
the Govt.
Govt. of
of West
West Bengal,
Bengal,
India).
India).
5. Water
5. Water Security
Security in
in Kolkata
Kolkata Municipal
Municipal Corporation
Corporation Area
Area
Changes in
Changes in land
land use‐land
use-land cover
cover patterns
patterns increase
increase pressures
pressures on on water
water resources,
resources, which
which ultimately
ultimately
affects the linkage between land tenure and water security [36]. This section seeks
affects the linkage between land tenure and water security [36]. This section seeks to complement the to complement the
observations on
observations onland
landuse-land
use‐land cover
coverchange
change by abyliterature review
a literature to contribute
review to developing
to contribute a shared
to developing a
understanding
shared of someofofsome
understanding the core concepts
of the related to
core concepts waterto
related security in Kolkata
water security in city. Rapid
Kolkata changes
city. Rapid
in land use-land
changes cover patterns
in land use‐land and simultaneous
cover patterns and simultaneousinsufficient water management
insufficient water managementpractices in the
practices
entire
in the KMC
entirearea
KMC caused poor water
area caused poorquality [37]. Water
water quality [37].security entails ensuring
Water security every citizen
entails ensuring everywith the
citizen
amount
with theofamount
quality ofwater theywater
quality need to safely
they needlivetotheir
safelyeveryday lifeeveryday
live their [36]. In anlife
urbanized
[36]. In area, amongst
an urbanized
other amongst
area, aspects, unrestricted
other aspects, population
unrestrictedgrowth [38,39], poor
population growth governance [40–42]
[38,39], poor and mismanagement
governance [40–42] and
of the water supply
mismanagement system
of the water[43] as well
supply as social
system [43]inequity
as well as [44–46]
social can result[44–46]
inequity in watercaninsecurity.
result in water
The nature of urbanization processes has undergone a paradigm shift since the neo-liberal
insecurity.
economic reforms
The nature ofofurbanization
1991, which processes
ultimatelyhas leads the process
undergone of the acquisition
a paradigm of land
shift since and water,
the neo‐liberal
creating a potential
economic reforms of insecurity
1991, whichfor the urban water
ultimately leadssystem in the of
the process KMCthe area [8,36]. In
acquisition ofaddition,
land andparallel
water,
physical processes like climate change accelerate the insecurity of water [47,48]. The
creating a potential insecurity for the urban water system in the KMC area [8,36]. In addition, parallel following section
picks three
physical major aspects
processes of urban
like climate water
change security:the
accelerate water demand
insecurity and supply,
of water [47,48].water accessibility,
The following and
section
water related
picks three disasters,
major aspectswhich include
of urban waterrisks and environmental
security: water demandhealth. and supply, water accessibility, and
water related disasters, which include risks and environmental health.
5.1. Water Demand and Supply
Time series analysis of land use-land cover change in Kolkata Municipal Corporation (KMC) area
shows that Kolkata city has been transformed during the past four decades into almost a completely
urbanized area. Population growth and resulting population density (Table 3) are the most important
drivers that act as Catalysts for urbanization. Founded by the British East India Company in the early
17th century, Kolkata was the first major Asian city which evolved as a provincial city and eventually
became the headquarters of the British India government [49]. The amount of its population, Kolkata’s
importance in trade and commerce, the varieties of employment that it offers, and the diverse nature
of its inhabitants make it a cosmopolitan city in character [50].Land 2018, 7, 91 16 of 25
Table 3. Population data of Kolkata Municipal Corporation area (KMC) from 1971 to 2011 according to
the Census of India [23].
Population
Years Growth Rate (%)
Total Male Female
1961 2,927,298 1,815,791 1,111,498 +8.48
1971 3,148,746 1,924,505 1,224,241 +7.57
1981 3,305,006 1,930,320 1,374,686 +4.96
1991 4,399,819 - - +33.12
2001 4,572,8976 2,500,040 2,072,836 +3.93
2011 4,486,679 2,362,662 2,124,017 −1.88
At the beginning of the 20th century, Kolkata was the first city in India with a population of more
than one million inhabitants. According to the 1901 census KMC area’s population totaled 933,754,
while according to the 1951 census 2,698,494 inhabitants were counted and increased to 4,572,876
inhabitants in 2001 [23]. Corresponding to the last Census report of India (2011), the decadal growth
rate of population in the Kolkata Urban Area (including KMC) amounted 6.87% between 2001 and
2011, which was far below the standard growth rate of India or West Bengal state [51]. This declining
population growth rate in the KMC area has been covered up by the continually increasing population
growth rate of greater Kolkata agglomeration areas, especially in the peri-urban zones along the banks
of river Hooghly. As per the 2011 census, the KMC area had a population of 4,496,694, of which 52.41%
(54.67% in 2001) were male and 47.58% (45.33% in 2001) were female. The population density of KMC
area averaged 22,000 inhabitants per km2 (24,718 inhabitants per km2 in 2001) [23]. The population
growth and rigorous sprawling impacts on the changing nature of the land use-land cover within
KMC area cause an increasing demand of water in the city and impose stress on the local ground
water regime [20]. This results in increased pressure on the existing demand-supply system and basic
infrastructural functionality according to recent reports on water demand [20,52].
Rapid and uncontrolled growth of urban areas is the result of, firstly, the natural increase in
population, and secondly, migration into urban areas [53]. In total, migration significantly contributes
to the urban growth of Kolkata [53,54]. According to the 2007–2008 census data, the migrant population
in Kolkata city amounted for 30.9% of the total KMC population; work participation rate of migrants
within KMC (44.5%) is much higher than West Bengal (34.7%) and in India (37.3%) [52]. Although
insignificant, comparing to the migration of people within India, international migration (mainly,
refugees and undocumented migrants during and after the Bangladesh Liberation War of 1971) also
must be considered as a growth factor. By the beginning of the 20th century, the urbanization in
Kolkata took place majorly along the eastern bank of the river Hooghly (currently areas under KMC
boroughs I–VII). Since the 1980s most of the surface waterbodies in the peri-urban areas of KMC were
impoldered and sealed [20]. Table 3 reflects the total population and its decadal growth rates in the
KMC area since 1961 until 2011: The population growth rate in 1961 was higher than in 1971 and
1981; nevertheless, the growth rate increased and peaked in 1991. An important factor triggering
rapid urbanization is economic growth and its related development of infrastructural facilities [55,56],
frequently forcing uncontrolled urban sprawl [53,57]. In general, the rapid growth of cities stresses
their capacity to provide technical infrastructure and services such as energy, education, health care,
transportation, and sanitation. Since governments have less revenue to provide the basic maintenance
and provision of services, massive urban sprawl occurs, locally affecting urban ecosystem [53]. In
many developing countries rapid urbanization and low levels of technology are expected to affect
ecosystem services and to put more pressure on the urban community to cope with these changes [58].
Studies like [3] can be combined with the frequent LULC changes to predict the futuristic pressure on
the urbanization in accordance with water security.
KMC’s water supply system is based on both, surface and subsurface waters [59].
Bhagirathi-Hooghly, a major distributary of the Ganga about 500 km in length, is the main waterLand 2018, 7, 91 17 of 25
source for the entire city’s water supply system. In 1997, the average water supply for KMC’s urban
population lasted less than four hours a day [60]. In 2014, in India (data from 28 cities) daily water
supply was 3.3 h on average while the hours of supply varied from 1 h per 3 days to 18 h per day [61].
In contrast, in KMC the daily water supply was still 4 h on average, while serving 81% of population
and providing an average of 123 L per capita per day [27]. It exceeds the national average of 71.2% in
terms of the number of the people served (Table 4) [27,62].
Leakage from piped water supply systems, mainly originating from rusted iron pipes frequently
causes interruption of the water supply [25]. Leaky water pipes expose the drinking water to
contamination and, thus, affect the public health [63]. Leakage and cracks in the piped water
system also might cause fecal contamination of drinking water, which turns the whole system into
insecurity [50]. However, according to the Central Pollution Control Board of India (CPCB), Indian
cities should focus on the required availability and quality of the supplied drinking water (64). In 2006
and 2011, all over India the non-revenue water due to leakages, unauthorized connections, billing,
and collection inefficiencies, etc., was estimated to be 40–70% of the water distributed [64–66]. For
Kolkata the economic effects of water leakage can be sketched as follows: water is supplied through a
distribution network of 5500 km of underground water pipes, supported by 13 pumping stations in the
four zonal mains [12]. 30–35% of the pumped water is lost during transmission either through leaks or
theft. The resulting costs of water loss are estimated to about 2.7 million rupees annually (treated at
4.50 rupees per 1000 L) [67].
Table 4. Comparison between National and Municipal Urban Service Delivery Status in Kolkata
Municipal Corporation [23,62].
Water Supply Sewerage
Coverage Per Capital Hours Non-Revenue Metered Coverage
(%) Amount (IPCD) (Hours/Day) Water Connections (%) (%)
National
81 123 4 - 25 28
Average
KMC 92 134 8 93 0.1 43
Groundwater, the second major source of fresh water in the KMA, gets extracted for domestic and
agricultural use in large quantities in areas distant from the river [26]. Due to the hydrogeologic
situation of Kolkata city, groundwater contamination by infiltration of polluted floodwater is
constricted [20]. Nevertheless, Kolkata and the Ganga-Brahmaputra delta lie in a geological zone with
naturally occurring arsenic in deeper strata. In consequence, arsenic concentrations higher than the
WHO’s recommended maximum concentrations of 10 µg·L−1 were detected in groundwater from
65 of 100 sampled wards in Kolkata monitored over a twenty-year study period [68]. The natural
occurrence of arsenic in the aquifer is exacerbated by the over-extraction of groundwater [69]. A most
recent study shows that the groundwater extraction in the KMC area was about 32 × 104 m3 per
day and significantly exceeded groundwater recharge [70]. Over-extraction of the groundwater and
reduced rate of aquifer recharge also cause ground subsidence [71].
5.2. Water Accessibility
Changes in land use-land cover influence the interaction of structural and behavioral factors
associated with technological and environmental capacity, demand-supply and social relations. As a
result, the increased physical water demand of the growing population affects the accessibility of water
for the citizens [72]. In case of urban India, nearly 70% of the households have access to tap water, out
of which 62% have access to treated tap water [25]. Correspondingly, less than 30% of Indian urban
households depend on other sources of water than tap water [23–25]. All over India less than 50% of
the urban population has access to piped water within their premises [23]. In 2007, in the KMC area
around 74% of the population were served with water by house connections (and public taps in case
of slum areas) and provided continuous and uninterrupted water supply of 8.3 h daily [60]; the rest ofLand 2018, 7, 91 18 of 25
the households were accessing groundwater through private pumps or wells [60]. In the census data
from 2011 [23], the percentage of households having access to piped water within the KMA increased
to 79% [17,66].
Between 2006 and 2011 revenues from user charges covered c. 30–40% of the operation and
maintenance costs of the water supply and sanitation infrastructure within the KMC area [65,66]. The
KMC does not levy tax on drinking water for the citizens [73]. Most urban water supply operations
survive on large operating subsidies and capital grants [66]. The policy of not pricing water for
domestic use has received the authority’s criticism as it sends the wrong signals to consumers, thus
promoting wastage [60,74]. The consequence of underpricing, coming along with KMC’s overstaffing
and large amount of unaccounted water is that KMC can hardly cover maintenance costs or provide
capital through tariff revenues for infrastructure improvement [26,74]. KMC’s recovery of operational
costs with an average of 15% is one of the lowest among Indian cities [74]. According to Majumdar &
Gupta (2009), the issue of water conservation within the KMC area is completely neglected, which over
time has also required a mounting of government subsidies on water [75]. An analysis of the decade
(from 1992 to 2002) reports that the expenditure for water supply and sewerage increased five times,
whereas revenues only doubled [75]. Additionally, there has been a sharp decline in the groundwater
level, especially in central to south Kolkata as well as along the Eastern Metropolitan Bypass in the east
of KMC area (Rajpur-Sonarpur areas). In both areas settling-up intensified in recent years with the
newly settled areas being only barely tapped [13]. In consequence, the wealthy residents settling in
these newly constructed multi-story apartment blocks pump their own water as they do not trust on
the quality of the water supplied by civic bodies. Groundwater pumping within KMA is increased
wherever the access to surface water is limited [13].
Slums result from uncontrolled and invariable urban sprawl in and around Kolkata city since
the Colonial era. Kolkata’s slums are characterized by high socio-economic and ethnic disparities and
accommodate approximately one third of Kolkata‘s population, occupying about half of the Kolkata
metropolitan area (KMA) [13,23,24]. Slums and squatter settlements are in general physically distinct,
with tile roofed kutcha huts, often made of brick, mud, and wattle, and are poorly serviced in terms
of water, sanitation, sewerage, drainage, and waste disposal [53]. Accessibility to the public water
supply is limited and is mostly only available at some few stand posts [13]; during the summer days
the supply shortage generally increases, and water quality degrades [76]. The water supply provision
of KMC does not sufficiently cover the water demand of these slum areas with 90 L per capita per day
(lpd) while the estimated water demand of KMC’s inhabitants amounts to 180 lpd [77].
Poor and inadequate living conditions and municipal services increase the chances of lethal health
and sanitation issues [78]. These problems are especially critical in slums and squatters in fringe
areas [49]. Peri-urban fringe areas (e.g., newly added wards, such as 101, 141–146) are lacking access to
piped water supply from the municipality. The residents must either use the groundwater through
handheld tube wells or get access from KMC supports such as water delivery by water trucks a few
times a week. The increasing numbers of slum dwellers have been the key concerns for urban planning
in respect to accessibility of safe drinking water and availability of adequate sanitation facilities [79].
5.3. Water Related Disasters
In Kolkata seasonal flooding and its impact on the environment affects human health and is
a significant challenge. Established in the Ganga delta frequent flooding is a natural phenomenon.
Urban spread and unplanned occupation of the natural drainage system is a major source for the
exposure of urbanized areas to flooding. 17.3% of Kolkata’s population live in areas of high flood risk
(especially in ward numbers 14, 57, 58, 63, 66, 67, 74, 80, 108, 111–115, and 122–126; Table 1) [80]. These
high-risk areas are located along canals and wetland areas that originally served as by-pass or retention
areas during flooding while today most of the canals are superstructed [80]. The land use-land cover
changes observed in the class of urban settlements clearly show that urbanization processes affected the
distribution surface waterbodies during the observation period (1980–2014). It resulted in the drainageLand 2018, 7, 91 19 of 25
of wetlands and its replacement by either compact surfaces or barren land for further development.
Another reason for the shrinkage of surface waterbodies was the vanishing of the trees in the city and
the resultant increased surface runoff [80]. Consequently, the groundwater table lowered [81–84]. With
the increasing surface runoff and due to the poor sanitation conditions in these areas contamination of
surface waterbodies by dissolved and solid matters increased. To improve water quality, 25 sewage
treatment plants (STPS) have been installed in West Bengal under phase II of the Ganga Action Plan
between 1993 and 1996, but the capacity available is still not sufficient [85]. There are two sewage
treatment plants (Bangur and Garden Reach STPs) installed outside the KMC area receiving waste
water from the KMC area; both were underutilized due to a lack of household connections in their
catchments, as until 2006 only 17% of the population in these areas had sewer connections [85,86].
Due to the insufficiency of these measures dissolved oxygen levels, measured in July 2007 by the
National River Conservation Directorate and WBPCB, pointed out unsuitable bathing conditions at
all monitoring stations in Kolkata when the value of dissolved oxygen levels reached less than 4 mg
O2 L−1 [85]. Beyond, the total coliform count has been rising: while the average levels of coliforms
in 2001–2002 were mostly within levels deemed to be suitable for bathing (max. 500 most probable
numbers × 100 mL−1 ), the 2005–2006 average increased to 423,125 most probable numbers × 100
mL−1 at the Howrah Monitoring Station [85]. During severe flooding, such as in September 1999, the
slum areas suffered from a paucity of power supply, acute shortages of safe drinking water, out breaks
of water borne diseases such as Gastro-enteritis, Typhoid, Entamoebiasis, Hepatitis etc., and a long period
of water logging [81].
Palit et al. (2012) conducted a study on the potential of different water sources, both for drinking
and domestic purposes, for diarrheal disease transmission in Kolkata’s urban slums [87]. The results
show a significantly higher prevalence of fecal coliforms (58%) in stored water for washing than the
stored water for drinking (28%) and tap/tube well water (8%) collected [87]. Samples containing
stored water for washing also had the highest non-permissible range of physico-chemical parameters.
Household water containers storing water for washing were rich in fecal coliforms and residual
chlorine contents. Palit et al. (2012) found less than the satisfactory level of residual chlorine (57%),
TDS (37%), and pH (20%) present in almost two thirds of the samples of water stored for washing [87].
The urbanization processes in the KMC area over the past four decades went along with a decline
in vegetation cover and water bodies (Figures 7 and 8). The loss of green spaces coinciding with an
increase of built-up and sealed areas affects surface temperatures and causes the development of urban
heat islands [88]. Urban heat islands in turn have effects on rainfall patterns and intensities, threaten
biodiversity, and consequently affect water security [26,88]. The eastward expansion of Kolkata has
been accommodated at the expense of natural ecosystems, mainly the East Kolkata Wetlands. The
Basic Development Plan for the city completely disregards the ecological sensitivity of the East Kolkata
Wetlands and proposes to develop two major townships near them [26]. Reclamation of wetlands for
other commercial usages such as garbage dumping also seems to continue unabated, according to the
same WWF India report (2011) [26]. In consequence, unplanned and rough handled socio-economic
activities in the Kolkata Metropolitan area stress water quality [26,88,89].
6. Conclusions
This review provides a qualitative snapshot on the effects of land use-land cover change and
water management strategies to urban water insecurity in Kolkata Municipal Corporation (KMC)
area during the last four decades. Beyond water’s functions in the hydrological cycle, it has social,
economic, and environmental values, and is essential for sustainable development. Unprecedented
population growth, a changing climate, rapid urbanization, expansion of infrastructure, migration,
land conversion, and pollution translate into changes in the water fluxes, water pathways, and water
stores. Population density and per capita resource use have increased dramatically over the past
four decades in KMC area; parallel, urban ecosystems have undergone significant modifications that
affect the vitality, quality, and availability of the water resources in KMC. The trends observed inYou can also read