Transit Oriented Development for Pimpri Chinchwad: Workshop Outcomes and Action Plan - Prepared by the Institute for Transportation and ...
←
→
Page content transcription
If your browser does not render page correctly, please read the page content below
Transit Oriented Development for
Pimpri Chinchwad: Workshop Outcomes
and Action Plan

Prepared by the Institute for Transportation and Development Policy
for the Pimpri Chinchwad Municipal Corporation
March 2013
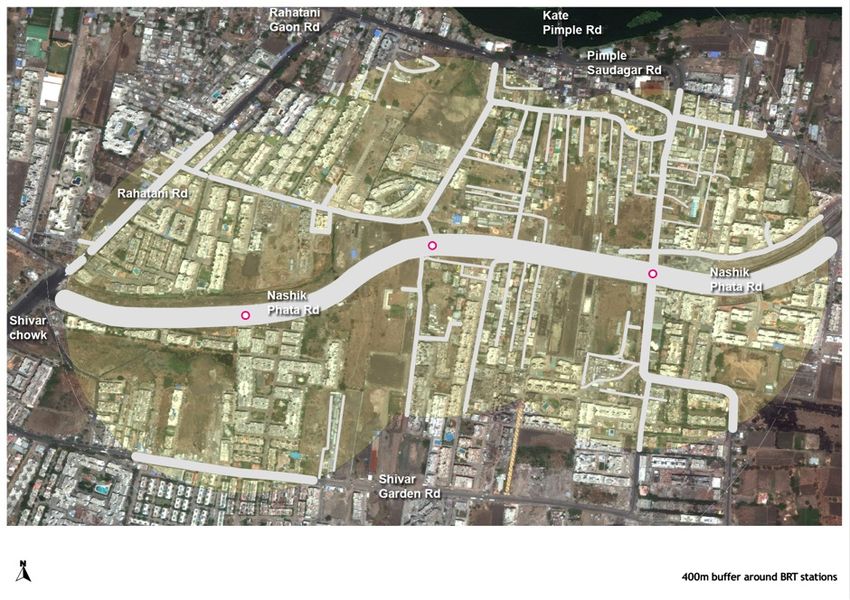
Table of Contents
1.
   Executive Summary .......................................................................................................................... 1

2.
   Introduction....................................................................................................................................... 2

3.
   TOD Principles ................................................................................................................................. 4

    3.1
   Walk .......................................................................................................................................... 4

    3.2
   Cycle .......................................................................................................................................... 7

    3.3
   Connect ...................................................................................................................................... 9

    3.4
   Public Transport ...................................................................................................................... 10

    3.5
   Mix .......................................................................................................................................... 11

    3.6
   Densify .................................................................................................................................... 13

    3.7
   Compact ................................................................................................................................... 14

    3.8
   Shift ......................................................................................................................................... 16

    3.9
   TOD Standard Scorecard ......................................................................................................... 18

4.
   PCMC Case Study .......................................................................................................................... 19

    4.1
   Walk ........................................................................................................................................ 21

    4.2
   Cycle ........................................................................................................................................ 25

    4.3
   Connect .................................................................................................................................... 27

    4.4
   Transit ...................................................................................................................................... 30

    4.5
   Mix .......................................................................................................................................... 30

    4.6
   Density ..................................................................................................................................... 33

    4.7
   Compact ................................................................................................................................... 34

    4.8
   Shift ......................................................................................................................................... 34

    4.9
   Overall TOD score .................................................................................................................. 35

5.
   Workshop findings.......................................................................................................................... 37

    5.1
   Workshop agenda .................................................................................................................... 37

    5.2
   Group 1: Transit oriented land use planning ........................................................................... 42

    5.3
   Group 2: Structure and design of the public realm .................................................................. 48

    5.4
   Group 3. Built form and its impact on the public realm .......................................................... 53

6.
   Action plan...................................................................................................................................... 58

    6.1
   Delineation of TOD zones ....................................................................................................... 58

    6.2
   Intensification of residential and commercial uses in TOD zones .......................................... 59

    6.3
   Provision of affordable housing in TOD zones ....................................................................... 59

    6.4
   Creation of a dense network of streets .................................................................................... 60


                                                                               i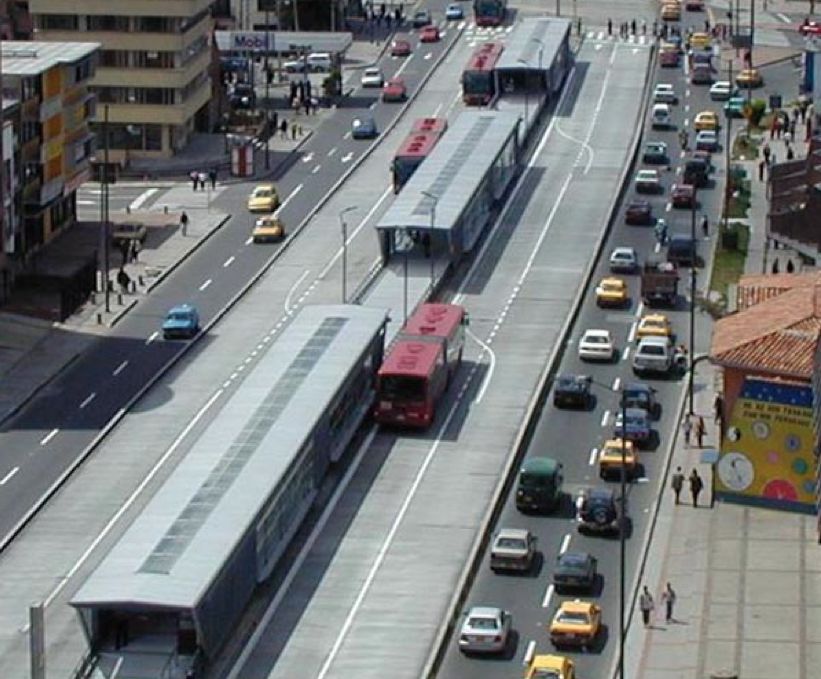
6.5
   Development of complete streets with high quality walking and cycling facilities ................ 60

   6.6
   On-going management of street space .................................................................................... 60

   6.7
   Parking management in TOD zones ........................................................................................ 61

   6.8
   Urban design reforms .............................................................................................................. 62

7.
   Appendix: Workshop participants .................................................................................................. 63


                                                                        ii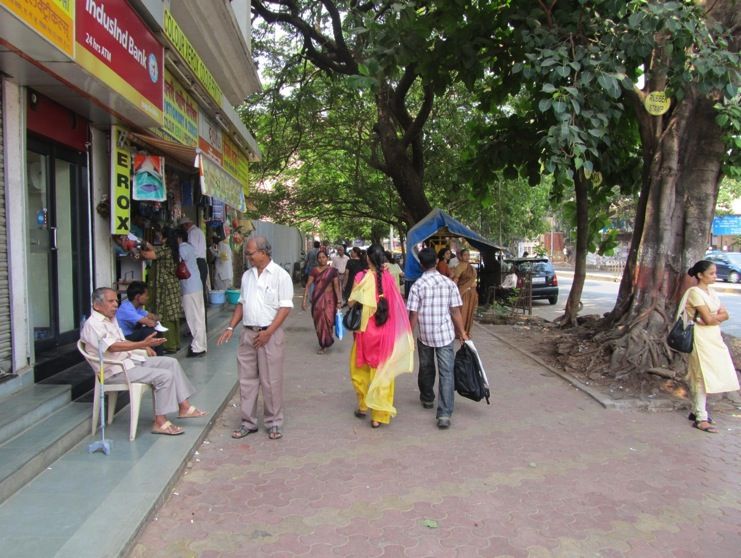
1. Executive Summary
Pimpri Chinchwad is at a critical juncture in its development trajectory, enjoying accelerated
economic growth coupled with a rapidly increasing population and a fast pace of urban development.
The Pimpri Chinchwad Municipal Corporation (PCMC) is showing leadership in the area of
sustainable transport with its implementation of a high quality bus rapid transit (BRT) system. To
capitalise on these transport investments, PCMC is now pursuing transit-oriented development (TOD)
to ensure that a large number of people can live, work, and play along the BRT corridors. This report
examines strategies and actions that PCMC can consider as it formulates TOD policies.
The findings reported here were developed through a one-day participatory workshop with public
officials, Corporation staff, and other stakeholders. The workshop in turn was informed by
background research by the Institute for Transportation and Development Policy, involving
comprehensive surveys of existing travel patterns, land use characteristics, and built form.
Pimpri Chinchwad faces multiple challenges in securing a sustainable urban future for its growing
population. Much needs to be done to develop infrastructure and housing, and this expansion must be
coupled with efforts to promote sustainable modes (e.g. walking, cycling, and public transport) and
reduce dependence on personal motor vehicles. To enable mode shift, it is essential to increase
residential and job densities near rapid transit corridors. Policies should aim at accommodating the
majority of new housing and employment in areas with close proximity to high quality public
transport. In addition, a denser network of streets and paths is needed to provide connectivity and
reduce walking distances to public transport stations. Revenue generation through effective
management of street space along with funds from sale of tradable development rights can help pay
for improvements in the transport system and other types of infrastructure. Finally, building control
regulations can create incentives for private players to develop projects that contribute to an active,
vibrant public realm that is safe for all users.
This report elaborates on these objectives and identifies concrete steps that PCMC can take to achieve
TOD. The proposals cover multi-scalar issues of density, land use, housing, jobs, public space, street
management, parking, urban form, building typologies, and non-motorized transport, all essential
considerations for an effective citywide TOD policy. Implementation of this TOD strategy will
require dedicated funding mechanisms as well as accompanying institutional changes. While this
workshop and its findings mark the first step towards initiating dialogues among various stakeholders,
PCMC would not be able to achieve comprehensive implementation of TOD across Pimpri
Chinchwad without consulting and seeking active support of the development community,
landowners, residents, and non-governmental organisations. Therefore, greater engagement with these
stakeholders will be crucial in this process.

                                                   1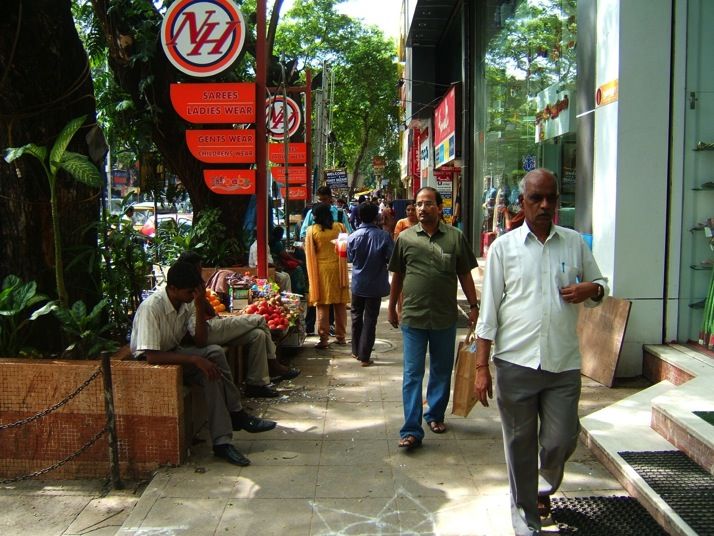
2. Introduction
The Pimpri Chinchwad Municipal Corporation (PCMC) is making considerable investments in
sustainable transport and local area improvements for its residents. Most notably, the city is
introducing a high quality bus rapid transit (BRT) system along four major corridors to enhance the
mobility and accessibility of all residents (Figure 1). Other mass rapid transit systems such as metro
and monorail/light rail are also being considered.

                                  Figure 1. BRT corridors in PCMC.

PCMC has recognised the importance of integrating land use policies with the city’s mass rapid
transit system in order to ensure the success of investments like BRT while also increasing the overall
liveability of the city. Transit oriented development (TOD) is an integral part of this strategy,
allowing for a concentration of housing and jobs within walking distance of mass rapid transit
stations.
Well designed and fully realized TOD areas can play a key role in the city’s economic and cultural
wellbeing, creating vibrant, lively places for people of all ages and income groups. A strategic
concentration of compatible activities in conjunction with high quality transport systems can help
reduce dependence on personal motor vehicles and curb emissions of harmful smog-forming and
greenhouse gas (GHG) pollutants. Adoption of innovative and contextual TOD policies and practices
in PCMC can become a model for the wider region as well as the rest of India.
TOD planning is a complex process, involving multiple stakeholders and requiring a high level of
interdepartmental collaboration between various government agencies. As part of PCMC’s efforts to
gain clarity on its TOD policies and initiatives, the Institute for Transportation and Development
Policy conducted a one-day workshop with municipal officials and other participants to explore
various elements of the TOD planning process. The intention was, on one hand, to familiarize

                                                   2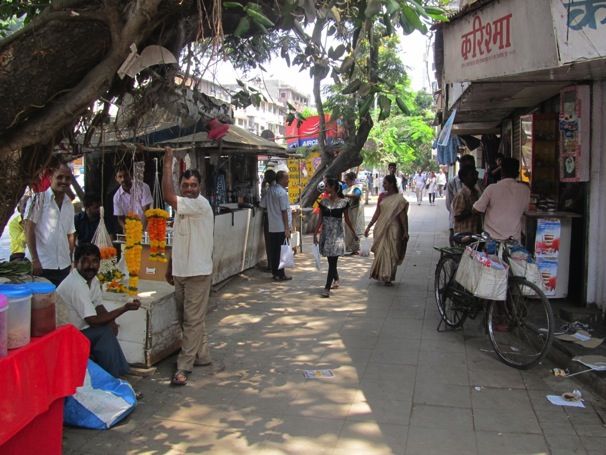
everyone with TOD concepts and methodologies, and on the other hand, to discuss politically viable
strategies and actions that could be taken by the Municipal Corporation, residents, and local
developers.
This report is the product of a collaborative effort and can serve as a stepping-stone towards the
adoption of TOD policies, projects, and initiatives. The following section describes eight key
principles of TOD that can guide the policymaking process in PCMC. Next, the TOD Standard, a set
of criteria developed by the Institute for Transportation and Development Policy (ITDP) to rate
quality of TODs, is applied to a case study site along PCMC’s Nashik Phata-Wakad BRT corridor.
During the workshop, the case study was presented to help generate discussion on some of the
opportunities and challenges to TOD in the context of PCMC’s BRT corridors. Next, the report
discusses the recommendation that emerged from the group discussions during the workshops.
Finally, the report synthesizes the recommendations from the three groups into a set of strategies and
actions to facilitate TOD. PCMC’s planning and engineering staff can now initiate the necessary
studies, activities, and dialogue required for a full implementation of TOD along BRT corridors in
PCMC.

                                                   3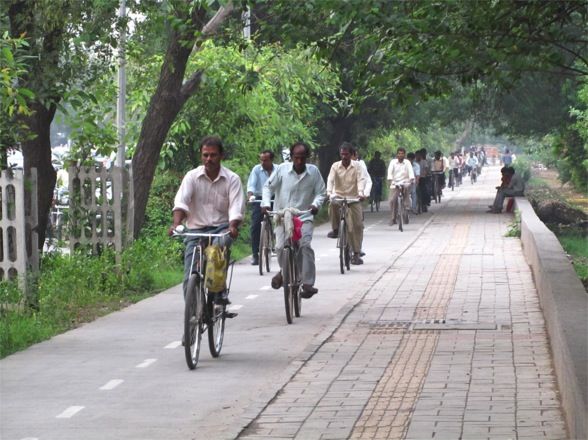
3. TOD Principles
Transit-oriented urban development and planning is a multi-faceted endeavour, requiring
consideration of the built environment at multiple scales, governmental policy at multiple levels,
public transport investments, and private interest. As in any complex planning exercise, it is prudent
to underline these activities with a set of widely accepted principles informed by worldwide best
practices. At the heart of TOD planning is the recognition of urban form and development patterns
that strategically house people and jobs within walking distance of high-capacity public transport
stations. In addition, the urban design and land use characteristics of TOD facilitate the use of public
transport, walking, and cycling. TOD is actively oriented toward, rather than simply adjacent to,
public transport. The following principles describe the key features of TOD:
      1.    Walk: Develop neighbourhoods that promote walking.
      2.    Cycle: Prioritizing motorised transport networks
      3.    Connect: Create dense networks of streets and paths.
      4.    Public transport: Locate development near high-quality public transport
      5.    Mix: Plan for mixed use
      6.    Densify: Match density and public transport capacity
      7.    Compact: Create compact regions with short commutes
      8.    Shift: Increase mobility by regulating parking and road use
Together, these urban development principles foster efficient spatial configurations that enable high-
quality, and car-independent lifestyles. The reduced vehicle-kilometres travelled (VKT) in these
developments mean less time wasted in traffic, less congestion, and reduced air pollution.
It is important to have measurable objectives that quantify the degree to which existing and proposed
policies and design solutions work towards a successful TOD. ITDP has worked with its global
partners to develop a set of principles and standards, known as the “TOD Standard,” to facilitate this
process. 1 The Standard expands upon the eight principles outlined above with a set of quantitative
metrics that can be used to determine how close a particular development comes to representing best
practice TOD. This section introduces the TOD Standard metrics. In the next section, the Standard is
applied to a study area in PCMC.

3.1        Walk
We are all pedestrians. Walking is the most natural, affordable, healthy, and clean way of getting
around, but it requires more than just feet and legs. It requires walkable streets—the fundamental
building blocks of a sustainable city. Hence, TODs cannot be considered successful without providing
safe, comfortable and attractive walking options for their residents, both to and from station areas and
within the TOD zone.

3.1.1 Objective: The pedestrian network is safe and complete
A great walking environment must protect pedestrians from motor vehicles. Streets need dedicated
pedestrian footpaths or vehicle speeds need to be radically reduced in case of a shared space.
Footpaths need to be unobstructed, continuous, shaded, and well lit. Vehicle speeds at crossings must
be slowed down with tighter turns, narrower lanes, restrictions on free turns, and speed bumps.

1
 The draft TOD Standard is available at . The
Standard is in draft stage and ITDP welcomes comments or questions about the scoring system.

                                                      4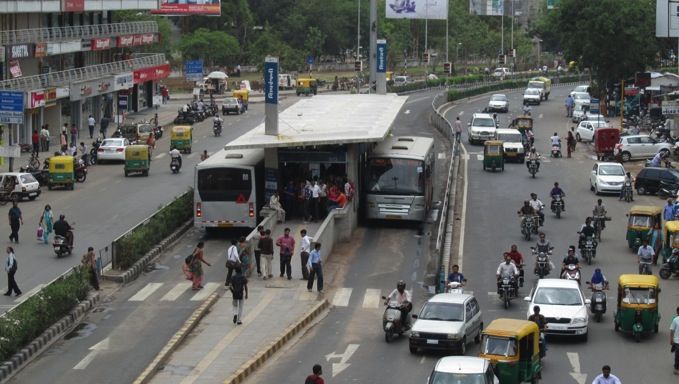
Crossings should be made safer with leading pedestrian crossing signals, pedestrian islands and curb
extensions that minimize crossing distances. These facilities need to be ramped to ensure accessibility
for all—including a person in a wheelchair or a family using a stroller.
The pedestrian network should foster the most direct access to all local destinations, such as schools,
work, and public transport stations, and should offer choices of pleasant and interesting routes.
Finally, the number of driveways cutting across pedestrian pathways need to be minimized.

                      Figure 2. Wide, unobstructed footpaths are an essential
                      component of a safe and complete pedestrian network.

The following metrics measure the degree to which a given pedestrian network is safe and complete:
Metric 1.1 Walkways: Percentage of block frontage with complete, wheelchair-accessible walkways.
Metric 1.2 Crosswalks: Percentage of intersections with complete, wheelchair-accessible crosswalks
in all directions.
Metric 1.3 Driveway Density: Average number of driveways per 100 m of block frontage.

3.1.2 Objective: The pedestrian realm is active and vibrant
Streetscapes should be thoughtfully and artistically designed to draw more people to walk for both
utility and pleasure. The most successful and best-loved cities in the world have vibrant and safe
streets. In order to achieve this level of quality, the interface between private buildings and the public
realm is very important. Streets with many shop fronts, doors, windows and patios that open directly
to pedestrian environments create a feeling of safety, while producing a more active and vibrant
atmosphere.

                                                    5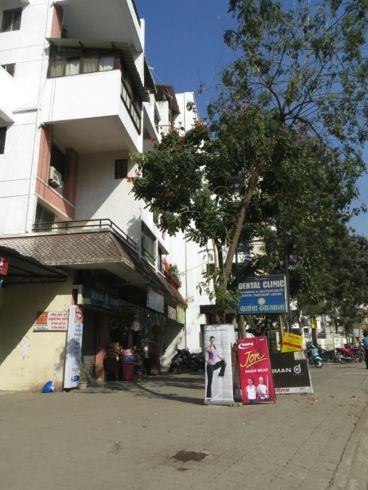
Figure 3. Active and vibrant pedestrian realm.

The following metrics measure the degree to which streets provide possibility for active and vibrant
pedestrian realm:
Metric 1.4 Visually Active Frontage: Percentage of street frontage that provides visual connection
to building interior activity.
Metric 1.5 Physically Permeable Frontage: Average number of shops and pedestrian building
entrances per 100m of street frontage.

3.1.3 Objective: The pedestrian realm is temperate and comfortable
Great cities start with great pedestrian environments that protect pedestrians from the elements. Trees
are critical in providing natural shade in the summer. Buildings that extend to the property edge,
storefront awnings, and arcades also help protect pedestrians from rain and sun.

                                                   6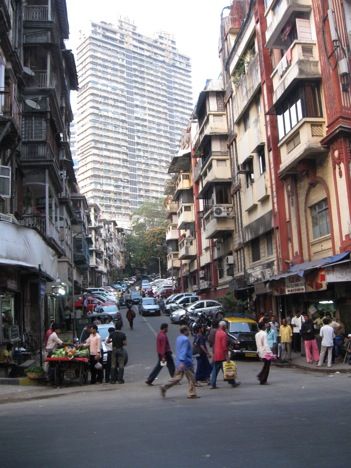
Figure 4. Shade provided by trees or buildings helps to create a
                           temperate and comfortable pedestrian realm.

Metric 1.6 Shade and Shelter: Percentage of walkway segments that incorporate adequate shade or
shelter element.

3.2   Cycle
Cycles allow the convenience of door-to-door travel while using less space and fewer resources. They
are a healthier and more sustainable alternative to cars, two-wheelers, auto-rickshaws, and taxis for
short trips. Many people will choose cycling if street design makes cycling safe and comfortable.

3.2.1 Objective: The cycling network is safe and complete
The more cycles on the streets, the safer the streets become. Segregated bike lanes are needed on
higher speed roads, while on local streets, traffic calming and shared street designs are better,
allowing traffic to mix at slow speeds. In hot countries in particular, shade is very important. A great
cycling environment is one where a child can cycle without danger and where a cyclist can safely and
quickly travel to any destination.

                                                   7
Figure 5. Continuous dedicated cycle tracks are an important
component of a complete cycle network.
The following metric measures the degree to which a TOD area provides a safe and complete cycle
network:
Metric 2.1 Cycle Network: Percentage of streets with safe and complete cycleways.
3.2.2 Objective: Cycle parking is ample and secure
Without high quality and safe space for parking cycles in private developments and on public streets,
cycling is not a viable option for many potential users. Cycling can also successfully be integrated
with public transportation, if fully protected cycle parking is provided.
Figure 6. Ample and secure cycle parking should be available at public transport stations.
8The following metrics measure availability of secure spaces for cycle parking:
Metric 2.2 Cycle Parking at Public Transport Stations: Secure multi-space cycle parking facilities
are provided at all public transport stations.
Metric 2.3 Cycle Parking at Buildings: Percentage of new buildings that provide secure, weather-
protected cycle parking.
Metric 2.4 Cycle Access in Buildings: Buildings allow cycle storage within tenant-controlled spaces.
3.3 Connect
Cities that are pleasant to walk and cycle typically have large numbers of narrow and short streets
with many intersections per unit of area. This makes the traffic slow down to make walking safe,
more direct, varied, interesting and attractive.
3.3.1 Objective: Walking and cycling routes are short, direct, and varied
The overall street network should offer frequent pedestrian and cycle connections to minimise the
distance between public transport stations and residential, employment, and other destinations. The
street network should be legible for someone on foot, such that each corner offers glimpses of
alternate routes or places.
Figure 7. Short, direct, and varied pedestrian routes reduce walking distances.
The following metrics measure the degree to which an area’s urban structure provides greater
connectivity and choice to pedestrians and cyclists:
Metric 3.1 Pedestrian Intersection Density: Intersections of pedestrian routes per square km.
Metric 3.2 Small Blocks: Percentage of blocks that are no more than 150 meters in length.
3.3.2 Objective: Walking and cycling routes are shorter than motor vehicle routes
The tighter the street grid, the less detour to a destination. Detours can affect the decision to undertake
a trip and by what means. At walking speeds, detours matter much more than at car speeds. Street
networks that prioritize shortest distances for pedestrians and cyclists result in more successful TOD
areas.
9Figure 8. Dedicated passageways for pedestrians and cyclists
offer shorter routes than the motor vehicle network.
The following metric measures the level of priority given to pedestrians and cyclists:
Metric 3.3 Prioritized Connectivity: Ratio of pedestrian and cycle-only intersections to motor
vehicle-accessible intersections.
3.4 Public Transport
Some trips are too long to make walking or cycling a viable option. As growing traffic from private
cars and trucks slows down buses, cities need to intervene to improve their public transport systems.
Mass rapid transit can move millions of people quickly and comfortably using a fraction of the fuel
and street space required by automobiles. TOD areas need to facilitate access to high quality public
transportation by non-motorized modes.
3.4.1 Objective: High quality public transport is accessible by foot
Where people are located with respect to public transportation stations can influence travel patterns of
individuals. Public transportation needs to be within walking distance of most people in a TOD area
and high-density developments should be strategically closer to public transportation stations.
10Figure 9. Employees and residents in TOD zones should have
access to high quality public transport, such as BRT.
The following metrics evaluate TOD areas level of access to public transportation:
Metric 4.1 Maximum Walk Distance to Transit: Maximum walk distance from the developments
in the TOD area to the nearest high-capacity public transport station.
Metric 4.2 Average Walk Distance to Transit: Weighted average walk distance between buildings
in the TOD area and the nearest high-capacity public transport station
3.5 Mix
Integrating residential, work, retail and entertainment activities into a single area makes for better
cities and better places. When the destinations that people need to access everyday are mixed rather
than segregated in disparate enclaves, many trips become short and walkable. Time spent commuting
or running errands can be reduced, as it becomes easier to combine trips.
3.5.1 Objective: Trip distances are reduced by providing diverse and complementary
uses
Overlapping activities animate the streets at all hours. Liveliness attracts life, people attract people,
and the local economy thrives and diversifies. The liveliest cities stack residential and office functions
above lower-floor retail. Combined with well-designed public spaces and plazas, mixing contributes a
vibrant street environment. The mixing of uses ensures that there is activity at all hours of the day,
which is essential for the safety of women.
11Figure 10. The mixing of complementary residential and commercial reduces trip distances.
The following metrics measure the level of mixing in a neighbourhood:
Metric 5.1 Complementary Uses: Presence of residential and non-residential uses combined within
the same or adjacent blocks.
Metric 5.2 Accessibility to Food: Percentage of residential units that are within 500 m walk of an
existing, or planned, source of fresh food.
3.5.2 Objective: Short commutes for lower income groups
Socially diverse, mixed-income neighbourhoods shorten trip distances and are safer and more
interesting. Streetscapes become more varied, rich and socially just. People with lower economic
means benefit from having shorter commute times and greater access to public transport.
12Figure 11. Affordable housing should be sited near high quality public transport.
The following metric measures the level of income mixing in a neighbourhood:
Metric 5.3 Affordable Housing: Percentage of residential units provided as affordable housing.
3.6 Densify
By 2030, cities are projected to absorb two billion more people. High density is crucial to low-carbon
cities. Density needs to be related to the capacity of all modes of transport. If roads are designed to be
cycle and pedestrian-friendly with public transport-priority lanes on major arterials, the transport
system can handle more intense residential and commercial uses. Compact development supports the
long-run viability of public transport, shortens trip distances, saves travel time and preserves arable
land. Dense communities also use resources more efficiently, reducing the carbon footprint of
residents.
3.6.1 Objective: Residential and job densities support high quality transit and local
services
Successful public transport systems depend on a concentration of jobs and residents in close
proximity to stations. Measuring density accurately is critical to station area planning. The crucial
variable is the density of residents or employees, which is not necessarily correlated with the amount
of built space. A neighbourhood with small units in low-rise buildings might have the same person
density as an area with large format high-rise developments with large units.
13Figure 12. Placing density close to public transport stations
enables more people to use public transport.
The following metrics measure residential and non-residential densities:
Metric 6.1 Residential Density: Residential density measured in Dwelling Units per Net Hectare
(DU/NHa) of developable land.
Metric 6.2 Non-Residential Density: Non-residential density measured in Floor Area per Net
Hectare (FAR/NHa) for the project.
3.7 Compact
Community location has a long-term impact on sustainability. New developments placed far from
existing cities are inconvenient and rarely thrive. City planners can avoid this by locating compact
new sub-centres within or adjacent to existing cities.
3.7.1 Objective: The development is close to jobs, services and other frequent
destinations
Most cities have underutilized land no longer needed for its original purpose. Old docklands, rail
yards, surface parking, industrial zones, or decommissioned military bases can often be re-used and
become vital new urban centres.
Cities need to create incentives to develop this land first, before driving development to distant
greenfields. In addition to protecting arable land, this strategy significantly decreases the cost of
providing public transport, utilities, and other services to these new locations, while reducing most
residents’ daily commute.
14Figure 13. Compact development within a short commuting distance of a job centre.
The following metric evaluates the development’s proximity to regional centres:
Metric 7.1 Urban Site: Number of sides of the development adjoining existing built-up sites.
3.7.2 Objective: Travelling by transit is convenient, efficient and attractive
A region with interconnected town centres through public transportation provides the opportunity for
residents to have access to all goods and services of the region without reliance on the automobile.
Within the city, it is important to connect all major destinations with a high-quality public transport
system.
15Figure 14. Public transport framework linking different city areas.
The following metric measures commute times:
Metric 7.2 Short Commute: Average peak-time commute duration in minutes by public transport to
the nearest urban centre.
3.8 Shift
In the last century many cities were retrofitted and designed to accommodate automobile travel. Car
travel will remain a preferred choice for some people on certain trips in the future, especially where
cost-effective public transport options are not available. These cars should be as clean, fuel efficient,
quiet, and safe as possible for both passengers and surrounding people.
Widening or adding roads in built up urban areas tends to damage local communities. More cars lead
to greater congestion, pollution, fuel consumption, and greenhouse gas emissions. Cars consume too
much road space to be viable for more than a fraction of total travel. If car travel keeps pace with
population growth, gains from fuel efficiency and cleaner technologies will be countered by slow
speeds—as drivers get stuck in traffic congestion.
3.8.1 Objective: The area of land used by motor vehicles is minimised
Car trips can be kept at levels that available roads can handle through parking policies, vehicle
restrictions, user charges, and traffic cells that allow more direct access for transit vehicles and
bicycles. These strategies can also be tailored to specifically encourage the use of cleaner and quieter
vehicles. Better management of travel demand is critical for any city made for people, not cars.
Appropriate parking requirements on the streets and private properties can have an important
16influence on people’s decision to use their motor vehicles or purchase new ones, particularly if other
alternatives are available.
Figure 15. The allocation of street space should prioritise sustainable modes.
The following metrics measure shift strategies through parking requirements in TOD areas:
Metric 8.1 Off-Street parking: Total off-street area dedicated to parking as a percentage of total
development land area.
Metric 8.2 On-Street Parking and Traffic Area: Total road area used for motor vehicle travel and
on-street parking as percentage of total development land area
173.9 TOD Standard Scorecard
The TOD Standard includes a scoring system based on the metrics outlined above. The scores are
summarized below:
Table 1. TOD scoring summary by category
Principle Metric Maximum Maximum Points
Penalty Points
WALK Walkways - 10 0
Crosswalks -5 0
Visually Active Frontage 0 10
Physically Permeable Frontage 0 2
Shade and Shelter 0 2
Driveway Density 0 1
CYCLE Cycle Network -5 0
Cycle Parking at Stations 0 2
Cycle Parking at Buildings 0 2
Cycle Access in Buildings 0 1
CONNECT Intersection Density - 10 2
Small Blocks 0 5
Prioritized Connectivity 0 3
TRANSIT Maximum Walk Distance to Transit -5 0
Average Walk Distance to Transit 0 5
MIX Complementary Uses 0 10
Accessibility to Food 0 1
Affordable Housing 0 4
DENSIFY Residential Density 0 10
Non-Residential Density 0 5
COMPACT Urban Site - 15 10
Short Commute 0 5
SHIFT Off-Street Parking 0 15
On-Street Parking and Traffic Area 0 5
BONUS For innovative measures/initiatives 0 5
Totals - 50 100
(+5 bonus)
184. PCMC Case Study
For the purposes of this workshop, a 1.2 sq km area centred around three BRT stations along the
Nashik Phata–Wakad corridor was chosen as the study area (Figure 16). This area was surveyed and
analysed by the ITDP team in accordance with the TOD Standard (see previous section) to assess the
nature of the existing urban form and its conformity to basic TOD elements.
Figure 16. Study area map showing street network and buildings located
within 400 m of the BRT stations in the Pimple Saudagar area.
The study area has undergone rapid change in recent years, as private agricultural areas and small
villages have been turned into large format multi-unit developments. However, this pattern of
development has occurred in absence of any detailed area-planning regime and thus far has resulted in
a fragmented and incoherent urban structure (Figure 17).
19Figure 17. Satellite images of the site from 2004, 2009, and 2012, revealing the
rapid growth in the study area, without an underlying structural plan.
At the ground level, the case study site has many areas of opportunity, including a scenic river that
runs through the north of the site and well located undeveloped parcels of land close to the BRT
corridor that could be capitalised on, as the site attempts to ameliorate the existing conditions and
arrive at an urban pattern more compatible with TOD requirements.
20Figure 18. The view at the north end of the case study area over the bridge (top)
and views from the BRT corridor (middle and bottom).
Given this context, the TOD Standard was applied to the study area surrounding the three BRT
stations to identify what elements of the urban environment are supportive of public transport use as
well as possible areas of improvement. Survey data collected through ground surveys were compiled
and analysed using a GIS platform.
4.1 Walk
4.1.1 Objective: The pedestrian network is safe and complete
Metric 1.1: Walkways
In the study area, walkways that would meet the TOD Standard’s requirements do not exist in most
parts. When they do exist, they are discontinuous and are not accessible to people with disabilities.
Thus, on a score range of -10 to 0, the study area gets a score of -10.
21Figure 19. Nature of existing sidewalks.
Metric 1.2 Crosswalks
Pedestrian safety must be ensured at street junctions through the presence of accessible crosswalks in
all directions. Since the site lacks a defined pedestrian environment, it scores a -5 on a scale of -5 to 0.
Figure 20. Lack of pedestrian crossings and infrastructure.
Metric 1.3 Driveway Density
Neighbourhoods that promote walking should minimise the number of points where motor vehicle
driveways interrupt the pedestrian realm. Given the large-format developments as well as the fact that
the site is not completely developed, the driveway density is currently low at 0.497. This gives the site
a score of 1 and provides an opportunity to keep the driveway density number low as the area
develops further.
22Figure 21. Pedestrian walkways are interrupted at gateways to large residential developments.
4.1.2 Objective: The pedestrian realm is active and vibrant
Metric 1.4 Visually Active Frontage
In order to create a pedestrian realm that is active, vibrant and safe, it is preferred to have at least 75
per cent of the buildings with visually active frontages. These could be in the form of actual openings
and/or transparent frontages (windows/patios) that are visually penetrable and provide a means of
passive surveillance. Since 67.1 per cent of building frontages in the study area relate to the street, the
site scores 7 points out of a maximum of 10.
Figure 22. Streets with visually active frontages on public roads.
23Metric 1.5: Physically Permeable Frontage
This metric deals with the average number of shops and building entrances per 100m of block
frontage. Permeable frontages abutting public walkways can include entrances to restaurants and
cafes, storefronts, and residential housing that contribute to a vibrant public realm. The site currently
scores a 0 in this category since most shop fronts do not relate to the public walkways.
Figure 23. Many existing shop frontages do not adequately interact with the public realm.
4.1.3 Objective: The pedestrian realm is temperate and comfortable
Metric 1.6: Shade and Shelter
Pedestrian comfort can be enhanced by providing adequate shading elements, either in the form of
landscaping or canopies. The site currently has tree cover only for 1.62 per cent of the length of the
pedestrian network, and hence scores 0 out of 2.
24Figure 24. Locations of trees abutting public roads in the study area.
4.2 Cycle
4.2.1 Objective: Walking and cycling routes are short, direct and varied:
Metric 2.1 Cycle Network
Cycling streets are those with speeds of 30 km per hour or less as well as those with dedicated cycle
lanes. In the study area, only 73.9 per cent of public streets can be seen to provide a safe cycling
environment. Therefore the site receives a score of -5 out of a maximum score of 0.
25Figure 25. Cycle friendly streets.
Metric 2.2: Cycle Parking at Transit Stations
It is necessary to include secure cycle parking areas as part of the station design to encourage mode
shifts from private motor vehicles to non-motorized transport. Since no cycle parking is mandated at
BRT stations (or its vicinity) as per the current design proposal, the study area scores 0 out of a score
range of 0 to 2.
Metric 2.3: Cycle parking at buildings
Increased use of cycles can occur only if adequate parking is provided not only at the stations, but
also in the buildings that serve as trip origin or destination points. In the case of Pimple Saudagar,
secure parking is available only in 19.3 per cent of the buildings, leading to a score of 0 out of
maximum of 2 points. For the purpose of this calculation, buildings with parking floors at stilt and
basement level are assumed to have cycle parking facilities.
Metric 2.4: Cycle Access in Buildings
This metric is a measure of cycle access in tenant-controlled spaces, as mandated by law. Since the
Development Control Regulations of Pimpri Chinchwad mandate cycle parking in various land use
categories, 1 point is awarded.
26Figure 26. Despite the absence of cycling infrastructure,
cycling is widespread in the study area.
4.3 Connect
4.3.1 Objective: Walking and cycling routes are short, direct and varied
Metric 3.1: Pedestrian Intersection Density
In order to reduce travel time and provide shorter, direct routes for non-motorised modes, it is
necessary to maximize the number of pedestrian and cycle intersections on public streets. As shown
below, the pedestrian intersection density of public streets in the study area is 49.6 per sq km, which
is much below the ideal density of 80 intersections per sq km. This means that long detours are still
required to access many places in the site and hence, a score of -5 is given out of a score range of -10
to 2.
27Figure 27. Intersections of public streets.
Metric 3.2: Small Blocks
One means of improving connectivity is by encouraging smaller block sizes. In Pimple Saudagar,
existing gated private developments reach up to 1,300 m in perimeter, rendering walking and cycling
difficult and impractical.
Figure 28. A private development with block perimeter of 1,300 m.
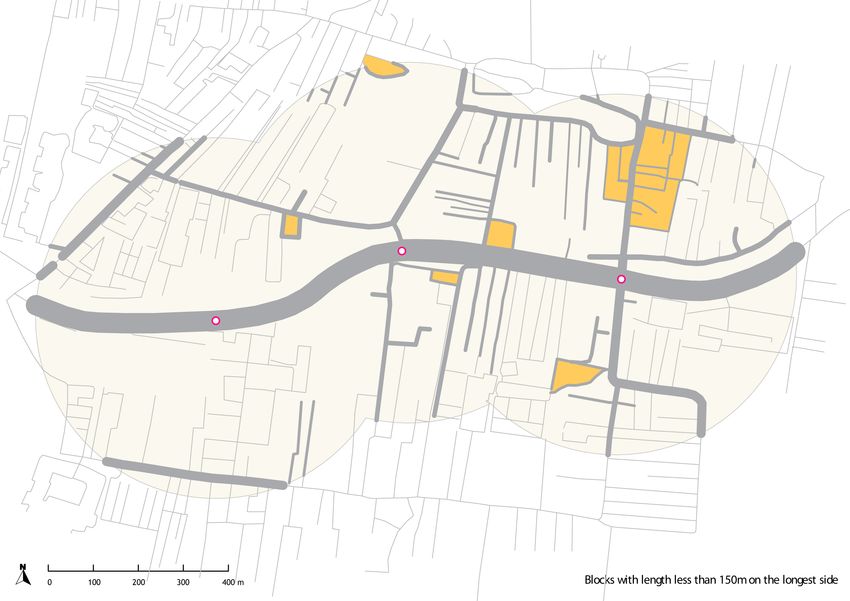
This metric looks at the number of blocks that measure 150 m or less on the longest side of the block
perimeter, resulting in a finer-grain urban fabric. As indicated in the map below, including blocks that
28lie partially within the development, only 42 per cent satisfy this criterion and hence a score of 0 is
given.
Figure 29. Blocks in the study area, with blocks with their
longest side less than or equal to 150m highlighted in green.
4.3.2 Objective: Walking and cycling routes are shorter than motor vehicle routes
Metric 3.3: Prioritized connectivity
This metric looks at the number of pedestrian and cycle-only intersections as compared to the total
number of all intersections. This area suffers from poor connectivity, resulting in a score of 0 for this
metric.
Figure 30. Desire lines showing people’s need for better and shorter pedestrian connections.
294.4 Transit
4.4.1 Objective: High quality transit is accessible by foot
Metric 4.1: Percentage of Units Within Walk Distance to Transit Station
The poor network of public streets in the study area limits access to public transport. In Figure 31, the
green area indicates the buildings that are within a 400 m walk of one of the three BRT stations. This
area is much smaller than the ideal 400 m walking radius, shown in light yellow. Only 56.3 per cent
of the total dwelling units are within a 5 minute walk of a BRT station.2 Thus there is a need to
accommodate a larger number of people in denser developments located close to the BRT corridor
and increase the density of pedestrian paths to reduce walking distances for existing residents.
Figure 31. Extent of the “REAL 400m walk” from the three BRT stations.
Metric 4.2: Average walk distance to transit
The weighted average walking distance to transit for Pimple Saudagar is 485 m. This means that the
bulk of the population residing in the study area has to walk for more than 5 minutes to the nearest
station. Hence the development, as it stands today, is not public transport friendly and gets a score of
1 out of 5.
4.5 Mix
2
Based on observed income levels and assumed dwelling unit sizes of 30 sq m per unit for lower income
groups, 75 sq m per unit for middle income groups, and 140 sq m for high income groups.
304.5.1 Objective: Trip distances are reduced by providing diverse and complementary
uses
Metric 5.1: Complementary uses
In order to reduce trip distances, there is a need to provide diverse and complementary uses within the
development. In the study area, the development is assumed to be externally complementary due to
the mix of land uses along the proposed BRT corridor. But within the study area, over 93.9 per cent of
the developed floor area is used dedicated to residential uses (Figure 32). This means that the site is
heavily biased towards residential space, creating imbalances in commute patterns to and from other
regional job centres. Furthermore, this results in greater trip generation for shopping, entertainment
and other daily necessities. Considering these factors, the site receives a total score of 5 out of 10.
Figure 32. The land use map reveals the predominance of residential uses in the study area.
Metric 5.2. Accessibility to food
Access to fresh food is a daily requirement and results in many generated local and citywide trips.
This site enjoys relatively good access to local food, both in formal spaces as well as through informal
street vending, resulting in a score of 1 out of 1.
31Figure 33. Food outlets and shops are common in the study area.
4.5.2 Objective: Short commutes for lower income groups
Metric 5.3: Affordable housing
As shown below, coexistence of older developments in the study area on smaller plots along with
large format gated private developments has ensured a good mix of income groups around the transit
corridor. With affordable housing units constituting 18.8 per cent of the total number of dwelling
units in the region, a score of 3 is earned out of 4. However, it must be noted that this is not through
planning but due to historical reasons.
Figure 34. Income distribution across the study area.
324.6 Density
4.6.1 Objective: Residential and job densities support high quality transit and local
services
Metric 6.1: Residential density
The TOD Standard measures residential density in terms of dwelling units per net hectare (DU/NHa)
of developable land. The presence of large format developments with building heights over G+6 and
considerable land coverage in the area have helped create a residential density of 124.8 dwelling units
per net hectare of developable land (Figure 35). This results in a score of 8 out of a maximum of 10
under this metric. However, it must be noted that if greater space is to be brought into the public
realm, in the form of more public space, parks, and street network, then the permitted density at the
plot level will to go up to achieve the same number of dwelling units per net hectare.
Figure 35. Building heights in the study area.
Metric 6.2. Non-residential density
In order to ensure that residential and job densities support high quality transit and local services,
there is a need for other uses in the form of commercial, institutional, recreational and public spaces
as part of the developable land. This would result in a more locally balanced land use pattern and less
travel demand. In Pimple Saudagar, only 0.07 ha of gross floor area per ha of net developable land is
used for non-residential purposes, leading to a score of 0 out of 5.
33Figure 36. A commercial street in the study area.
4.7 Compact
4.7.1 Objective: The development is close to jobs, services and other frequent
destinations
Metric 7.1: Urban Site
This principle measures the proximity of the development to urban centres, job destinations and other
frequently visited areas, penalising greenfield developments and regional dispersion of housing and
economic activity. Since the chosen study area is located within the existing urban boundary, a full
score of 10 is given for this metric, as all sides of this area adjoin other built-up sites within the
PCMC.
4.7.2 Objective: Travelling by transit is convenient, efficient and attractive
Metric 7.2: Short Commute
Due to the relative central location of this site, the study area will have access to the urban core and
other urban centres within PCMC once the BRT system is operational. Thus a full score of 5 is given
to this site.
4.8 Shift
4.8.1 Objective: The area of land used by motor vehicles is minimized
Metric 8.1 Off-street parking
An effective method for encouraging mode shift towards more sustainable modes is through the
regulation of off-street parking and reduction of the amount of space provided for parking of private
motor vehicles. In Pimple Saudagar, the total land area dedicated to parking is 14.9 per cent of the
total developable land area. This number may increase if the entire site had been developed under
business-as-usual development control regulations. At the moment the site gets a score of 5 out of a
34maximum of 15 and there is an opportunity to maintain this score and build on it, if parking
requirements are altered for TOD areas.
Figure 37. Off-Street parking provision in private developments.
Metric 8.2: On-street parking and traffic area
Currently in the study area, road space used for on-street parking and car travel account for 13.8 per
cent of the total study area. While this gives the study area a score of 4 out of 5 according to the
Standard, it must be noted that most streets are private and hence are not counted towards this score.
Hence, the challenge will be to create a better public street network within the existing framework
while further minimising space for motor vehicles.
4.9 Overall TOD score
Overall, the site scores 25 out of a score range of -50 to 100 points, with the scores for individual
categories listed below.
Table 2. TOD Standard scores for the Pimple Saudagar study area
Possible scores
Principle Study area
Min. Max.
score
Walk –15 15 –7
Cycle –5 5 –4
Connect –10 10 –5
35Public transport –5 5 0
Mix 0 15 9
Density 0 15 8
Compact –15 15 15
Shift 0 20 9
TOTAL –50 100 25
In summary, the scoring revealed the following characteristics of the study area:
• The scoring results emphasise the importance of better walking and cycling networks to help
improve connectivity to the BRT stations. Both pedestrian and cycle facilities received
negative scores (–7 and –4, respectively).
• The study area scores poorly in terms of the level of pedestrian connectivity provided by the
street network (–5). A finer grained urban fabric with smaller blocks would increase route
choice and walkability.
• The site receives a moderate score for mixed use (9), but there is much room for
improvement. Mixing appropriate land uses to complement the existing residential population
and accommodating greater number of people along public transport corridors would lead to
creation of inclusive environments with greater reliance of local walking and cycling.
• The site has reasonable residential densities, resulting in a decent score for this category (8).
However, the existing built form bears little relationship with the location BRT stations, so
the site receives a low score for the fraction of residents who actually have quick access to
public transport (0). If dense developments are encouraged closer to the BRT stations, the site
will generate greater public transport ridership.
• The site receives all the available points for compact (15) because it is relatively close to
other urban centres.
• The score for shift (9) reflects the lower parking provision in older buildings on the site.
Under business-as-usual regulations, the amount of parking will increase, countering PCMC’s
goal of facilitating TOD.
Although the Pimple Saudagar case study site is arguably, at the time of this survey, a collection of
individual developments that do not relate to each other, timely interventions can transform it into a
dense and vibrant urban fabric that provides a high quality of life for its residents and the wider city.
The next sections discuss the design interventions and policy recommendations generated during the
TOD workshop.
365. Workshop findings
5.1 Workshop agenda
The primary purpose of the PCMC TOD workshop was to bring various government officials and
other stakeholders together to discuss salient TOD planning concerns in the PCMC context. The case
study site was used as a facilitation tool to generate spatial strategies that could be unpacked into
specific policies and strategies that would be applicable to the PCMC’s corridors as well as other
TOD sites. Given the complexity of this exercise, workshop participants formed three teams, each
focusing on one facet of TOD planning (Figure 38):
1. Transit-oriented land use planning
2. Structure and design of the public realm
3. Built form and its impact on the public realm
Each group discussed a series of possible mechanisms to shape the development along the BRT
corridors, focusing on interventions that facilitate the adoption of the eight TOD principles mentioned
in the previous chapter. Facilitators from ITDP circulated among the groups, helping to highlight the
essential inter-linkages among the respective themes being discussed by each group.
Figure 38. TOD planning process and workshop flow.
To facilitate the discussion process, the ITDP team presented examples of the TOD planning process,
illustrating steps such as data collection, site analysis, design work, and the formulation of policy
37proposals. To begin, each group was provided a base map satellite image of the Pimple Saudagar case
study site, showing the 400 m catchment areas around three BRT stations (Figure 39).
Figure 39. Case study site near Pimple Gaon on the Nashik Phata-Wakad BRT corridor.
The first group explored appropriate levels of land use intensification that could qualify this site as a
TOD area, taking into account citywide growth trends and land availability. This group sought
mechanisms to make TOD successful in terms of real-estate marketability and density absorption.
ITDP provided examples of the kinds of spatial strategies that this team could consider (Figure 40).
38Figure 40. Illustrative TOD proposal diagrams showing preliminary land use (left), refined land
use (centre), and height and density (right).
Group 2 was asked to resolve urban structure issues of the site, such as street connectivity, street
design to facilitate the use of walking and cycling, and public realm issues. Similar to group 1,
examples were provided to facilitate these discussions (Figure 41 and Figure 42).
Figure 41. Existing street network (left) and potential new links (right).
39Figure 42. Possible pedestrian network (left) and cycling connections (right).
Finally, group 3 was asked to brainstorm on possible roles that private land owners and future
developers can play in facilitating the transformation of the site. Critically, this group explored ways
to create smaller blocks to improve pedestrian access (Figure 43). and mechanisms to bring more of
the private open space in the study area into the public domain The group also discussed means of
incentivising the creation of appropriate building typologies that are conducive to a safer and more
vibrant public realm (Figure 44).
Figure 43. Creating smaller blocks given the alignment of existing lot boundaries (left). As
redevelopment occurs, large blocks can be subdivided (new blocks in dark green, right).
40Figure 44. Examples of building typologies that facilitate intensification while creating a safe,
vibrant edge at street level (clockwise from top left): point towers on a podium base, row
housing, towers with interlinked pedestrian plazas, and mid-rise blocks.
The hope of the workshop was to also emulate the kind of analysis, design, and policymaking process
that the city can pursue to produce successful and contextual TOD plans and strategies. These kinds
of activities should be always integrated through interdepartmental coordination. An eventual
outcome is the formulation of Detailed Development Plans (DDPs) for key TOD zones within the
city. For this particular site, an example of a possible synthesis of these ideas into a plan and a vision
was provided (Figure 45).
41Figure 45. Example of a Detailed Development Plan map for the case study area.
During the workshop, ITDP facilitators moved from one group to another to encourage cross-
pollination of ideas and greater synthesis of the policy proposals amongst the groups. At the end of
the day, groups presented the culmination of their work to other participants and engaged in dialogue
about the next steps for TOD planning. The following section provides a more detailed summary of
the group discussions and policy proposals, while actions and strategies that can be taken on by the
Corporation are provided in the next chapter.
5.2 Group 1: Transit oriented land use planning
At the city level, there is a need to facilitate the use of public transport through appropriate
intensification of land uses within walking distance of mass rapid transit stations while restricting
high-intensity development of areas not well served by public transport. In addition, appropriate
mixing of land uses and income groups can help transform these station areas into vibrant public
spaces. Group 1 discussed methods for achieving these land use patterns in PCMC.
5.2.1 Increasing population and job density near BRT and metro stations
The population of Pimpri Chinchwad is projected to increase by 43 per cent by 2021 (i.e. an increase
of 7.4 lakh residents between 2011 and 2021). As an initial activity, this group calculated the
additional floor area required to accommodate such a population increase within the existing TOD
band of 100 m on either side of the 40 km length of BRT corridors in PCMC. The calculation
considered both the direct residential space requirement as well as the accompanying commercial uses
42based on the ratio of commercial to residential space in a typical urban area. Under the existing
allowed base FSI of 1 plus transfer of development right (TDR) FSI of 1, very few of the 7.4 lakh new
residents can be accommodated along the BRT corridors. Instead, they will be compelled to move to
areas in PCMC that lack frequent, high quality public transport service. Thus, the group discussed
ways to allow more of the expected growth to occur along the BRT corridors. The group observed
that if FSI alone were adjusted in the existing 100 m buffer, an allowed FSI of 26 would be required
to accommodate all of these residents near BRT. However, if the TOD zone were widened to 400 m
on either side of the corridor, a more reasonable FSI of around 4 would accommodate the increase in
population close to public transport. Therefore, the group concluded that the TOD zone should be
expanded to a full 400 m buffer.
Table 3. Comparison of the average FSI and buildable area for BRT and Metro zones
BRT Metro
Length of corridor (km) 10 10
Number of stations 20 10
Primary zone FSI 5 5
Primary zone dimension (m)* 200 300
Primary zone area (sq km) 4.0 2.8
Secondary zone FSI 3 3
Secondary zone dimension (m)** 400 450
Secondary zone area (sq km) 4.0 6.2
Total TOD zone area (sq km) 8.0 9.0
Average FSI in primary + secondary zones 4.0 3.6
Buildable area available (sq km) 32.0 32.7
The presence of multiple mass rapid transit modes in PCMC—metro and BRT—led the participants
to debate the appropriate methodology for the delineation of the TOD area boundaries. Due to the
proximity of the BRT stations to each other, the group decided to define the TOD zones along BRT
corridors as a continuous band, 400 m on either side of the corridor. For the metro stations, the
primary influence zone is a circular buffer with a radius of 400 m. The secondary zone consists of a
continuous 600 m band on either side of the metro line. The group also calculated the capacity of the
BRT versus the metro and came to the conclusion that BRT could have the same capacity as metro,
provided that overtaking lanes and multiple sub-stops are provided along the BRT corridors. Since a
wide ROW is available on the PCMC BRT corridors, participants agreed that passing lanes could be
implemented throughout the network. Thus, a maximum FSI of 5 is proposed for both the BRT and
metro primary TOD zones.
43You can also read