Testing Extended Accounts in Scheduled Conservation of Open Woodlands with Permanent Livestock Grazing: Dehesa de la Luz Estate Case Study, Arroyo ...
←
→
Page content transcription
If your browser does not render page correctly, please read the page content below
Article
Testing Extended Accounts in Scheduled
Conservation of Open Woodlands with Permanent
Livestock Grazing: Dehesa de la Luz Estate Case
Study, Arroyo de la Luz, Spain
Pablo Campos 1,*, Bruno Mesa 1, Alejandro Álvarez 1, Francisco M. Castaño 2 and Fernando Pulido 2
 1 Spanish National Research Council (CSIC), Instituto de Políticas y Bienes Públicos (IPP), C/Albasanz,
   26–28, E-28037 Madrid, Spain; bruno.mesa@cchs.csic.es (B.M.); alejandro.alvarez@cchs.csic.es (A.Á.)
 2 Institute for Dehesa Research (INDEHESA), Universidad de Extremadura, 06071 Badajoz, Spain;

   franmcmartin@hotmail.com (F.M.C.); nando@unex.es (F.P.)
 * Correspondence: pablo.campos@csic.es; Tel.: +34-91-602-2535

 Received: 22 September 2017; Accepted: 10 November 2017; Published: 15 November 2017

 Abstract: Standard Economic Accounts for Agriculture and Forestry do not measure the ecosystem
 services and intermediate products embedded in the final products recorded, and omit the private
 non-commercial intermediate products and self-consumption of private amenities. These
 limitations of the standard accounts are addressed by the extended Agroforestry Accounting
 System, which is being tested at the publicly-owned Dehesa de la Luz agroforestry estate. The
 extended accounts simulate conservation forestry of holm oak and cork oak for the current as well
 as successive rotation cycles during which scheduled conservation of the cultural woodland
 landscape of the Dehesa de la Luz is carried out, improving the natural physical growth of the
 firewood and cork. The estimated results for 2014 reveal that private ecosystem services make up
 50% of the firewood and grazing products consumed; the private environmental income accounts
 for 13% of the total private income; and the private environmental asset represents 53% of the total
 opening capital. The net value added is more than 2.3 times the amount estimated using the
 standard accounts. The landowner donates intermediate products of non-commercial services at a
 value of 85 €/ha, which are used to enhance the supply of public products.

 Keywords: Agroforestry Accounting System; standard accounts; private ecosystem services
 consumed; private intermediate services; private environmental income and asset; private
 profitability rate; public products

1. Introduction
     The sustainable management of the Spanish dehesa is important to rural development at the
local, national, and European Union levels due to its environmental and economic value [1–4]. Open
woodlands in five autonomous communities in West and Central Spain predominate over an area of
6,151,318 ha (Table 1 and Figure 1) [5]. Open holm oak woodland accounts for 73% of Spanish open
woodland in the five main dehesa regions. In the absence of statistics from the government
regarding public dehesas, we estimated the extent of publicly-owned Mediterranean open
woodlands where the fraction of tree cover is between 5% and 75%. These public open woodland
formations occupy 738,615 ha and represent 12% of the estimated total area of open woodland
formations in the Spanish dehesa area (Table 1). Most of these open woodlands do not form part of
dehesa estates [6]. This agroforestry system is defined as an anthropogenic land use system based
mainly on extensive livestock grazing in the Mediterranean woodlands, shrublands, and grasslands,
where more than 20% of the area of the estate is occupied by broadleaved species with a canopy

Environments 2017, 4, 82; doi:10.3390/environments4040082                  www.mdpi.com/journal/environments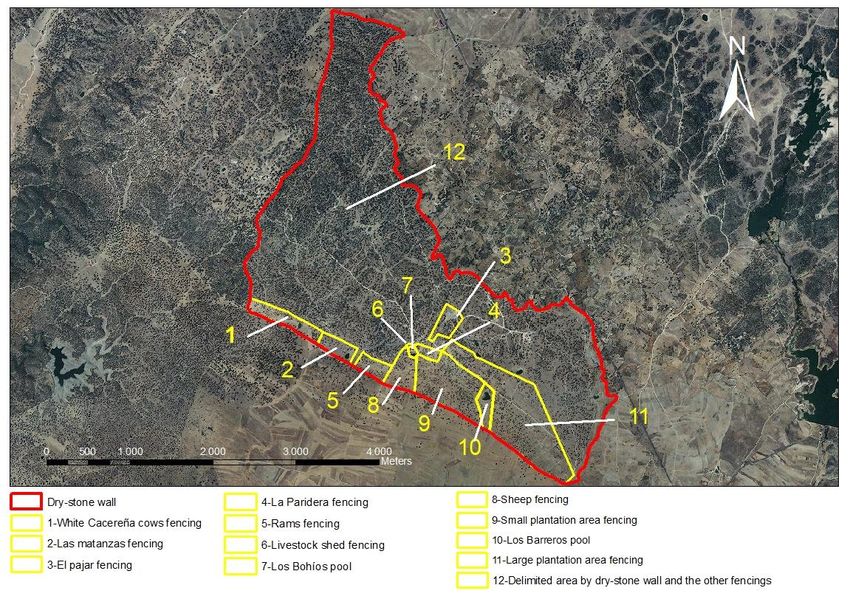
Environments 2017, 4, 82                                                                                  2 of 38

cover fraction of between 5% and 60% [7] (p. 7). Spanish dehesa agroforestry estates cover a total
area of 3,606,154 ha and the open woodlands within them account for 2,203,002 ha (Table 2 and
Figure S9) [7,8]. The natural conditions and medieval process of land appropriation have led to the
concentration of most of the dehesa areas within large dehesa estates. For example, the 4575 dehesa
estates of 200 hectares or more represent 64% of the total dehesa area, with an average estate size of
502 ha. The remaining 107,812 dehesa estates with less than 200 ha have an average estate size of 12
ha (Table 2).

      Table 1. Open woodland area in the five autonomous communities in West and Central Spain (ha).

                                        Castilla-La    Castilla y
        Tree Species       Andalucía                                Extremadura      Madrid       Total
                                         Mancha          León
        Holm oak           1,302,901     1,019,286      676,305       1,353,119      119,848     4,471,460
           Cork             207,101        21,724         6753         138,334         190        374,102
        Other oaks           27,158       156,562       662,997         91,069        20,033      957,819
         Others (1)         118,637       105,871       103,116          7593         12,721      347,937
     Open woodlands (2)    1,655,796     1,303,443     1,449,171      1,590,115      152,792     6,151,318
      Notes: (1) Others includes Spanish juniper, wild olive, narrow-leaved ash, and carob tree. (2) Open
      woodlands are between CCFtrees ≥ 5% and CCFtrees ≤ 75%, where CCF (canopy cover fraction) is the
      stand area covered by the tree canopies. Includes the stand ages of polewood and old growth only.
      Source: Own elaboration based on Reference [5].

      Figure 1. Map of open woodlands in the five autonomous communities in West and Central Spain by
      tree species. Source: Own elaboration based on Reference [5].

     In the Iberian Peninsula, stakeholders have warned of the economic and environmental
consequences of the decline of Spanish dehesas [6,7,9–11]. This concern is also present in the
Portuguese montados, where woodlands cover 1,066,000 ha (holm oak: 329,000 ha and cork oak:
737,000 ha), mainly in the Alentejo region [12,13].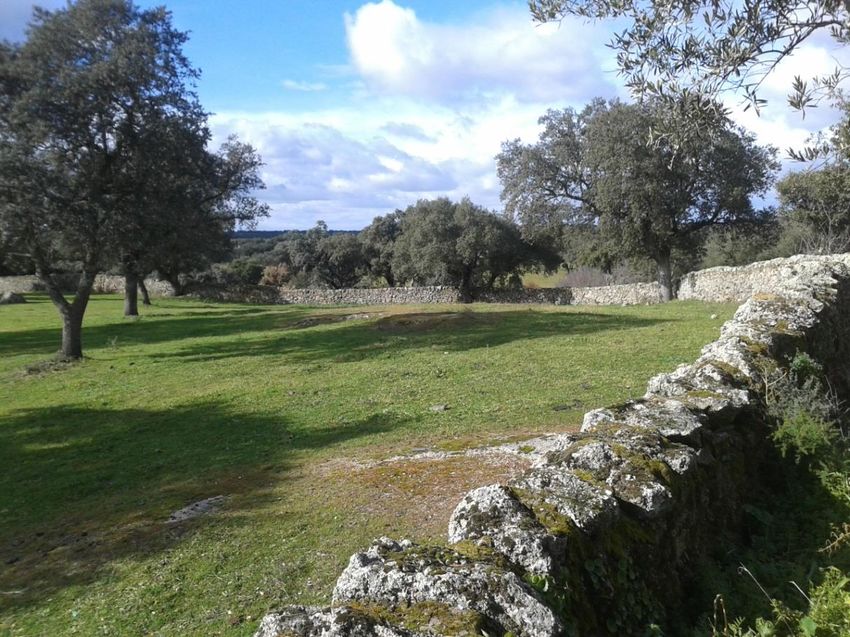
Environments 2017, 4, 82                                                                                  3 of 38

      Table 2. Numbered classification of dehesa estates according to surface area in the five Spanish
      autonomous communities in West and Central Spain.

                                                                              Area of Dehesa States
                                          Dehesa Estates Number
     Dehesa Estates Size Class (ha)                                   Open Woodland             Total
                                               Nº            %            ha         %        ha         %
                 0 ˂ ha ≤ 10                 87,395          78         102,611      5      152,867       4
                 10 ˂ ha ≤ 50                12,015          11         183,203      8      287,939       8
                50 ˂ ha ≤ 100                 4612            4         209,429     10      330,672       9
               100 ˂ ha ≤ 150                 2322            2         177,758      8      285,042       8
               150 ˂ ha ≤ 200                 1468            1         161,912      7      253,716       7
               200 ˂ ha ≤ 300                 1698            2         265,382     12      416,935      12
               300 ˂ ha ≤ 500                 1521            1         373,223     17      582,026      16
              500 ˂ ha ≤ 1.000                 979            1         394,791     18      658,528      18
                  ha > 1.000                   377            0         334,693     15      638,429      18
                    Total                   112,387         100        2,203,002    100    3,606,154    100
                 0 ˂ ha ≤ 10                 87,395          78         102,611      5      152,867       4
                10 ≤ ha ≤ 200                20,417          18         732,302     33     1,157,369     32
                   ha > 200                   4575            4        1,368,089    62     2,295,918     64
                                 Source: Modified from Reference [7] (Table 23, p. 46).

     The deficiency or complete lack of natural regeneration has been identified as the key problem
in current dehesa open woodland management. Current grazing levels reveal that, in general, both
landowners and governments overlook the question of compatibility with woodland regeneration
and that today, after several centuries of inadequate grazing management, the dehesas are suffering
an ongoing process of increasing natural death rates due to diseases and ageing of the trees. The
regeneration of trees in Spanish dehesas is either null or scarce in 46–70% of plots and normal or
abundant in 28–45% according to data from the Third National Forest Inventory for five
autonomous communities with dehesas [5,7,8]. The data which reflect this general lack of
regeneration are accentuated if the analysis is restricted to the tree species which most frequently
form part of the livestock farming estates (holm oak, cork oak, and Pyrenean oak), with a lack of
woody seedlings in 82%, 96%, and 65% of each species, respectively, in the inventoried plots [10].
     The Economic Accounts for Agriculture and Forestry (EAA/EAF) is the government statistical
office regulation for accounting the final products and net value added from the agriculture and
forestry sector market [14]. The omission of economic statistics for dehesas from standard national
EAA/EAF (hereinafter standard accounts) prevents us from determining the contribution of these
agroforestry estates to the provincial and regional economies of the autonomous regions in which
they are most widespread (Tables 1 and 2, Figures 1 and S9). The EAA/EAF estimates the aggregated
sales of products classified as agricultural and forestry products produced in the territory at the
regional or national scale without distinction between types of enterprise. Thus, agroforestry estates
are not a separate part of the agricultural and forestry product statistics. For example, in the case of
livestock production, no distinction is made between whether it is produced in a grazing system or
in an industrial feedlot. The only economic information available on dehesas is that which has been
published in scientific articles relating to a small number of large dehesas in the Spanish
communities of Andalucia and Extremadura. Data from the scarce scientific publications regarding
testing of the Agroforestry Accounting System (AAS) (hereinafter extended accounts) in a group of
large private dehesas coincide with those from studies conducted using the same extended accounts
in Mediterranean ranches in California [15,16] (see supplementary materials (SM) 1–6).
     We follow the reference [17] and define products (or outputs) as goods (tangible products) and
services (intangible products) produced in the accounting period in the estate for current or future
consumption by people. The products measured in the Dehesa de la Luz case study are: cork and
firewood natural growths, firewood harvest, acorns, grass, stored water flow, intermediate and final
private services, manufactured gross capital formation of plantation and dry-stone wall, livestock
products, private amenity, recreation, landscape, livestock biodiversity, and carbon. We measure the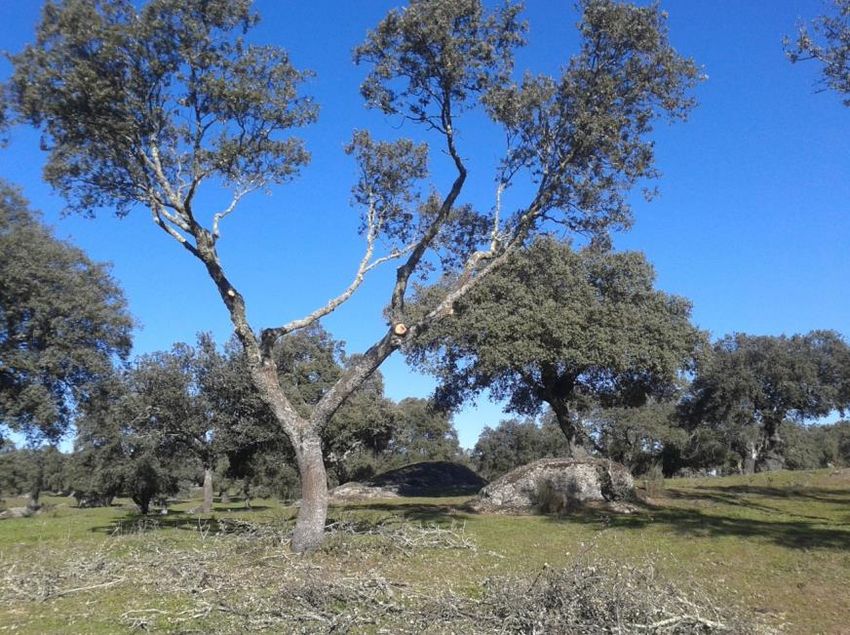
Environments 2017, 4, 82 4 of 38
environmental assets and/or manufactured capitals of the abovementioned products and the
environmental asset of hunting.
The objective of the management at Dehesa de la Luz, undertaken by the public owner and
scheduled in this study, is to reach the highest potential consumption of the goods and services
produced, subject to the condition that the net worth (see SM 2) of environmental assets are not
diminished at the closing of the accounting period. Achieving this objective requires the continued
future presence of private forestry activities, animals, and services simultaneously, both in space
and/or sequentially over time. In this study, our purpose is to examine the assumed hypothesis of
economic rationale of the public landowner and the leasehold family livestock owners with regard
to the supply of private manufactured intermediate products of services (hereinafter intermediate
services). The framwork of our case study are as follows: the owners receive a normal manufactured
net operating margin (operating benefit) from their manufactured capital investments in forestry
conservation, livestock, and infrastructures, with which they produce intermediate services (ISS) to
be used up as own intermediate consumption of services (SSo) for public and private activities.
These services contribute to the economic activities of Dehesa de la Luz as inputs to the final
products of public recreation, landscape (including human-made historical-cultural legacy), and
threatened livestock biodiversity activities as well as private amenity activities. Thus, we
hypothesize that the intermediate services which we attribute to private activities explain the
investment rationale of the public landowner, as well as the employment and investment by
leasehold family livestock owners who decide to continue with their private activities despite
incurring net manufactured monetary operating margins at basic prices (after including subsidies
and taxes linked to the production process) below the normal margins of the market for alternative
investment options (see SM 4).
The objectives of this study are to test the monetary extended accounts for the year 2014 of the
individual private activities analyzed and for Dehesa de la Luz as a whole, the ecosystem services,
the intermediate services, the environmental income, the environmental assets, the total private
income and its factorial distribution, and the total private profitability rates [18,19]. With regard to
previous applications of the extended accounts, the novelty of the present study is that it attempts to
illustrate, through the real case study of Dehesa de la Luz, the estimation of intermediate service
values hidden and omitted by the standard accounts, and to assign them to the activities which
produce them as well as to the public and private activities which consume them as own
intermediate consumption (inputs).
2. Materials and Methods
The case study of Dehesa de la Luz is presented in this section, which deals with the modeling
of physical growth functions for tree volume, firewood, cork, and acorns (Section 2.1) and the
specific valuation criteria applied for each of the private products estimated in 2014 (Section 2.2).
The previously published development of extended accounts is not presented in the main text of this
study [4,16,19–21], although we summarize the key accounting concepts in the supplementary
materials (see SM 1–4, 8–9).
Primary data have been collected through field work at Dehesa de la Luz by following ad hoc
protocols in forestry, livestock, and infrastructure products and costs. Reference is made to
appropriate published data where such data have been used.
2.1. Dehesa de la Luz Public Ownership Case Study
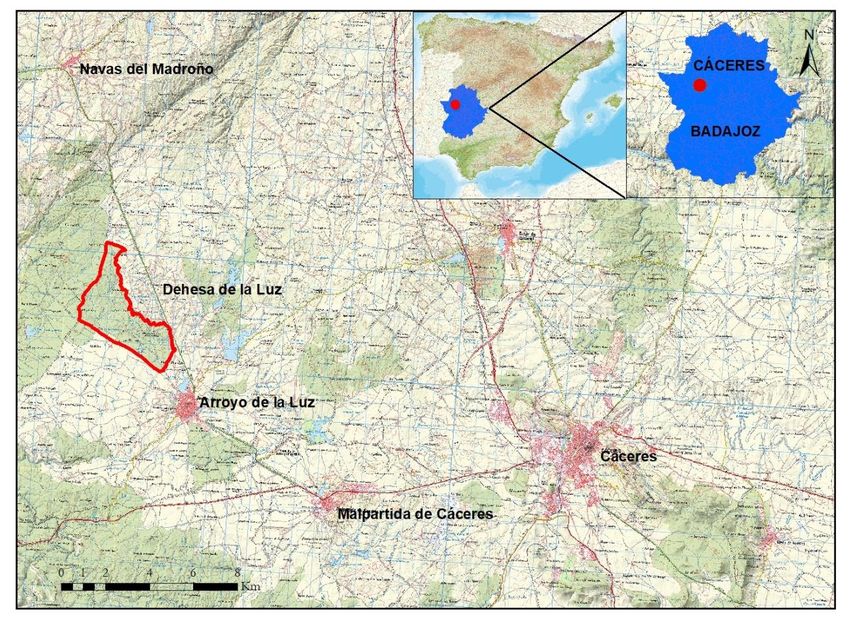
The town council of Arroyo de la Luz (Cáceres province, Spain) (Figures 2 and 3), as public
owner of Dehesa de la Luz, aims to establish conservation-orientated management of forest
resources and threatened autochthonous livestock breeds based on scientific information as well as
to improve the offer of public products in Dehesa de la Luz. Determining the total private income
and total private capital of the individual activities at Dehesa de la Luz allows us to estimate their
economic profitability rates and, where appropriate, justify the compensation received from the
government in reciprocity for the contribution to the intermediate services which are re-employed as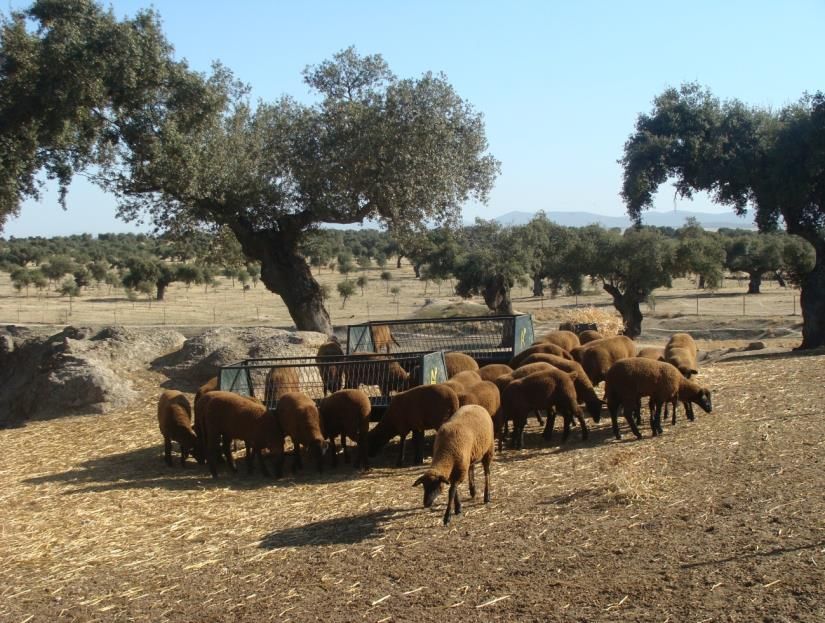
Environments 2017, 4, 82                                                                          5 of 38

input in the supply of public products at Dehesa de la Luz. The public landowner mitigates the
manufactured (man-made) investment risk and favors the supply of public products, leasing
livestock grazing for most of the cattle rearing activity (with the exception of pure breeds in danger
of extinction), as well as pruning firewood from holm oaks by self-employed family labor. Small
game hunting, with no investment by either the landowner or hunters, is practiced by members of
the local hunting society [19,22].
      In this Dehesa case study, we use ‘number of trees’ (and omit tree biomass) because the holm
oak and cork oak are not commercial wood species and acorn and periodical cork harvests are the
main products, with the silviculture undertaken being similar to that of fruit tree management (cork
is a periodically harvested product from the same cork oak trees). In addition, we want to highlight
the quantity of plantation trees vs natural regeneration. The inventories performed in 2014 over a
total area of 978 ha of Dehesa de la Luz reveal that 93% of the area is occupied by holm oaks (Quercus
ilex L.), with a small number of cork oaks (Quercus suber L.) dispersed among the former (Table 3).
      Sixty percent of the trees originate from natural regeneration and the remaining 40% are young
trees from recent plantations. Fifty three percent of the latter trees are cork oaks planted in 1993 and
the other 47% are holm oaks planted in 1993 and 2014 (Figure 4). Seven percent of the non-wooded
area includes parts which are occupied by paths, roads, water courses, and pools as well as
infrastructures currently used for livestock management.
      Over more than 50 years, the holm oaks and cork oaks from natural regeneration in Dehesa de
la Luz have diminished by 17% (see SM 5). The diameter distribution of the adult trees reveals
marked ageing of the woodland. This situation led the public owner, having recently regained
ownership of the trees, to initiate the recovery of the holm and cork oaks, impoverished by excessive
pruning carried out by the local private owners of the trees over more than a century (a local private
societal enterprise (“Sociedad Forestal”) bought the holm oaks and the cork oaks in the 1880s and
managed them up until the 1990s, when the regional government of Extremadura bought the trees
and donated them to de municipality of Arroyo de la Luz, which previously had the ownership of
grass and agricultural uses) (Figure 4). This involved the mixed plantation of holm oaks and cork
oaks in 1993 and the plantation (densification) of holm oaks in 2014 (Figure 5).

                            Figure 2. Location map of Dehesa de la Luz estate.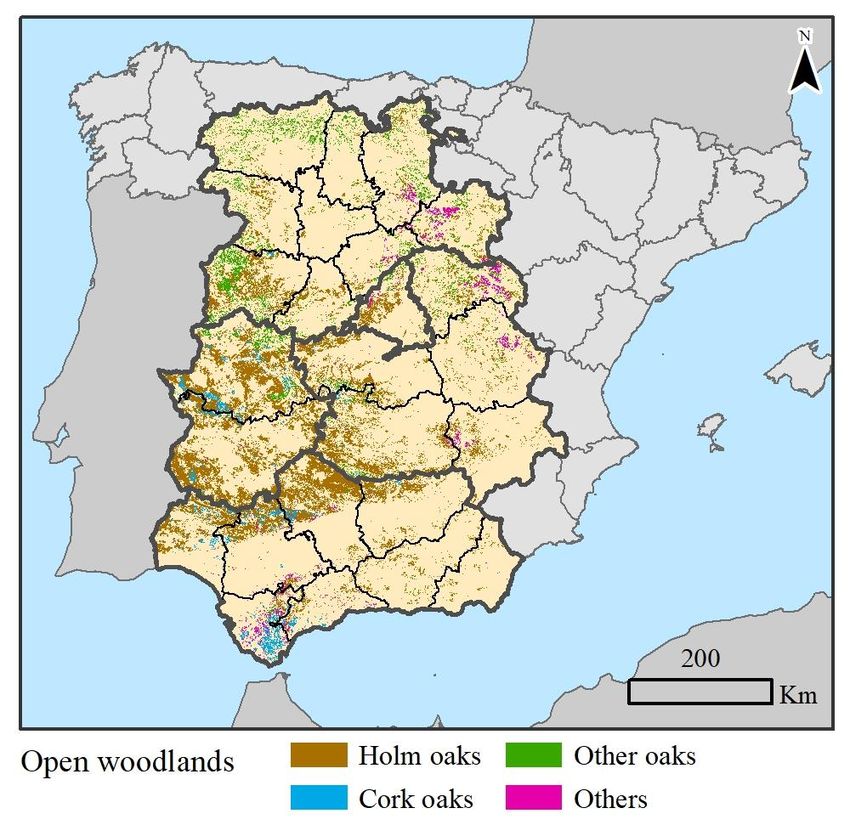
Environments 2017, 4, 82                                                                                     6 of 38

                                   Figure 3. Orthophoto of Dehesa de la Luz.

              Table 3. Open woodlands and other land use areas in Dehesa de la Luz estate (2014).

                                                                                                  Area (2)
                   Class                    N (1)          Canopy Cover Fraction (%)
                                                                                                (ha) (%)
       1. Wooded area                     47,968                          19                    909 93
       1.1 Natural regeneration           29,007                          17                    756 77
          Holm oaks                       28,248                          17                    756 77
          Cork oaks                         759                            0
       1.2 Plantation                     18,961                          27                    153     16
          Holm oaks                        8895                           21
          Cork oaks                       10,066                           6                    153     16
       2. Non-wooded area                                                                        69      7
          Pools                                                                                  11      1
          Other                                                                                  58      6
       3. Total                                                                                 978    100
 Notes: (1) Number of trees; (2) Area assigned to the main species (that which has the greatest number of trees).

     The distribution of the trees by diameter class allows us to verify that the holm oaks from
natural regeneration, of more than 25 cm, make up more than a third of the total. If all the holm oaks
are considered, including those which were planted, 68% have a diameter at breast height (Db) of
more than 25 cm (Table 4).
     Thus, according to this diameter distribution, most of the holm oaks present in Dehesa de la
Luz are more than 60 years old and the natural regeneration is insufficient to replace the existing
woodland. In the case of cork oaks, 86% of those originating from natural regeneration have a
diameter of more than 25 cm, the opposite being the case for the total population, since 95% have a
diameter of less than 25 cm due to the quantity of cork oaks distributed throughout the estate and
the density of the plantation carried out in 1993 (Table 4).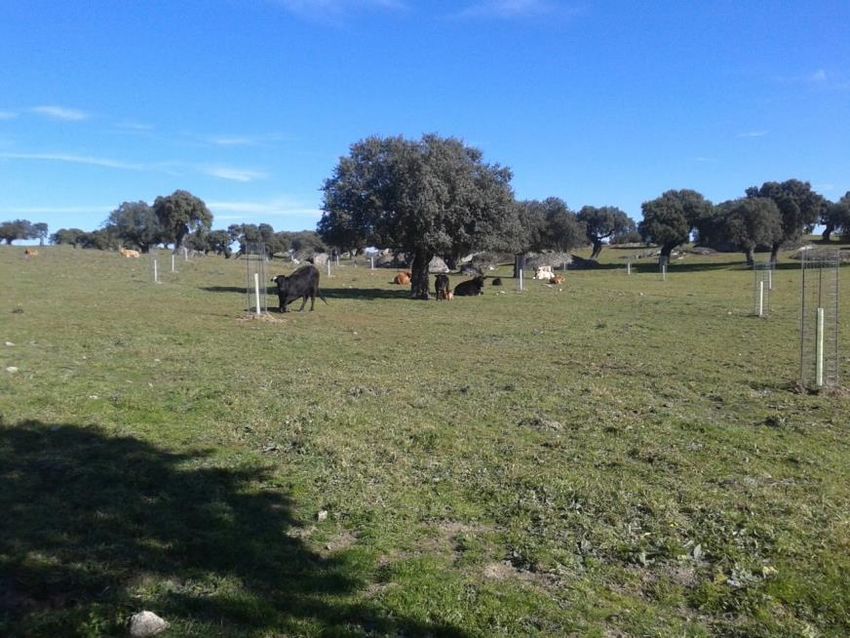
Environments 2017, 4, 82                                                                                   7 of 38

                Table 4. Density per species, origin, and diameter class in Dehesa de a Luz (2014).

Diameter                   Holm Oaks (Trees)                            Cork Oaks (Trees)                  Total
Class (cm)    Natural Regeneration  Plantation    Total    Natural Regeneration (1) Plantation   Total    (Trees)
   5–25               5959              5758      11,717             82               10,018     10,100    21,817
  30–50               8563                         8563             224                 48        272       8835
  55–75               9309                         9309             199                           199       9508
 80–100               6011                         6011              66                            66       6077
 105–125              1437                         1437              12                            12       1449
 130–150               106                          106               3                            3         109
 155–175                                                              1                            1          1
  Total               31,385            5758      37,143            587               10,066     10,653    47,796
      Notes: (1) Does not include 172 trees without branches, those which on which the diameter is
      impossible to measure, and the lesser non-inventoriable trees.

                 Figure 4. Holm oak pruning in Dehesa de la Luz. Photograph: Daniel González.

      Figure 5. Old holm oaks and young holm densification in Dehesa de la Luz estate. Photograph:
      Daniel González.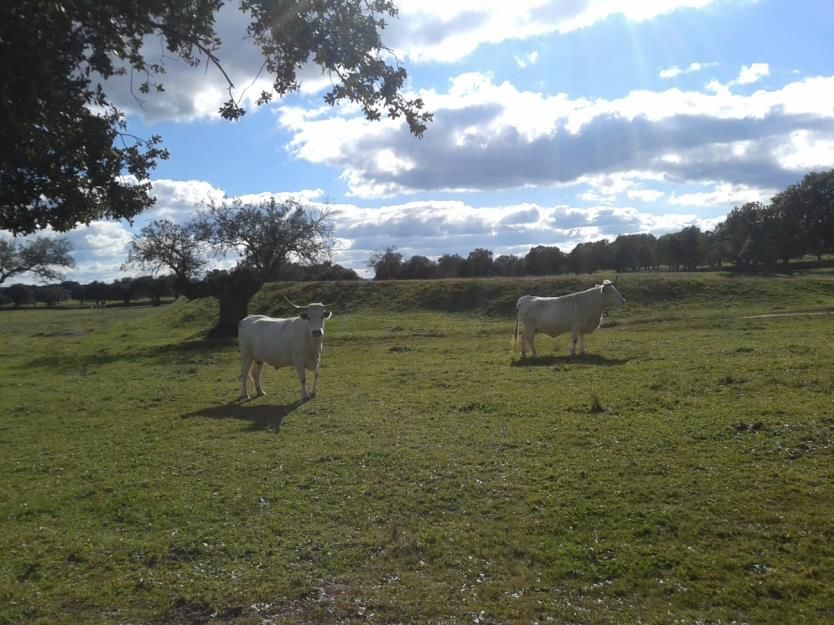
Environments 2017, 4, 82                                                                            8 of 38

     In the inventory conducted at the opening of the 2014 accounting period, there was a greater
presence of bovine livestock belonging to family livestock owners, making up 77% of the census
(Table S6). Bovine rearing involves producing calves for sale after weaning at an age of between five
and seven months. They graze during the whole year in the leased enclosures, and there are jointly
owned Limousin studs for mating with the cows. The bovine belonging to family livestock owners
are a cross with foreign breeds: Charolaise, Friesian, and Limousin [22], although there are also some
pure Retinta cows.
     The landowner has autochthonous livestock species, including black Merina sheep, white
Cacereña cows, and Cordobes donkeys, although there are also pure breed foreign species such as
Rambouillet Merina sheep and Hispano-bretón mares (Figures 6, 7 and S7). Of all the livestock
belonging to the public landowner, the Rambouillet Merina sheep are the most numerous,
comprising 70% of their livestock. Regarding the type of livestock on the estate, bovine make up the
largest percentage (79%) of the total, followed by ovine (18%) (Table S6).

     Figure 6. Endangered Cacereña White cow rearing in Dehesa de la Luz. Photograph: Daniel González.

                     Figure 7. Endangered Black Merina Sheep. Photograph: Fernando Pulido.
Environments 2017, 4, 82                                                                              9 of 38

     Recreational hunting for small game is leased by the public landowner to the local hunting
society. However, in practice, no resource rent is paid for hunting, as the hunters deem the resource
to have a reduced market value due to the scarcity of game species captured. Although the hunting
product value may be modest, it has been incorporated by discounting its expected resource rent
from the estimated market price of the land.
     At Dehesa de la Luz there are legacy-cultural values such as the presence of archaeological sites
dating from pre-Roman times and the medieval era, as well as contemporary cultural-historical
constructions such as Roman-Visigothic tombs (Figures S10 and S11), the 18-km dry-stone wall
which encloses the whole estate occupied by the Dehesa de la Luz (Figure 8), and a stone shepherds’
hut (Figure S8). The Ermita de la Virgen de la Luz sanctuary is also a noteworthy construction
situated within the estate, although the public economic services associated with it have not been
addressed in our valuation on this occasion (Figure S12).

               Figure 8. Historical cultural legacy dry-stone walling. Photograph: Daniel Gónzalez.

2.2. Modeling Natural Growth of Trees and Extracted Products

2.2.1. Forest Stand Inventories
     The models for holm oak and cork oak production functions are estimated for the full cycle of
the woodland on the basis of the existing adult trees in 2014 from natural regeneration, young trees
planted in 1993, and the densification in 2014.
     Modeling the production functions starts with an inventory of 34 plots, a stem count of the
scarce number of adult cork oaks dispersed among the holm oaks and in 20 reforested plots in the
area occupied by the 1993 plantation.
     The site is divided into six forest stands, allowing a detailed analysis based on the physical and
geographic characteristics of the woodland (see SM 5). Using this management division, mortality
between the years 1956 and 2010 was analyzed through orthophotos and geographical information
system (GIS) software, which allowed us to determine the existence of trees in each year and the
potential occurrence of regeneration (see SM 5). This field data provides the basis for modeling the
future conservation forestry schedule. Based on the estimated tree volume growth, firewood
pruning and cork stripping rotations, and the mortality and commercial cycles of the trees, it is
possible to schedule the conservation forestry for the expected future growth and extracted products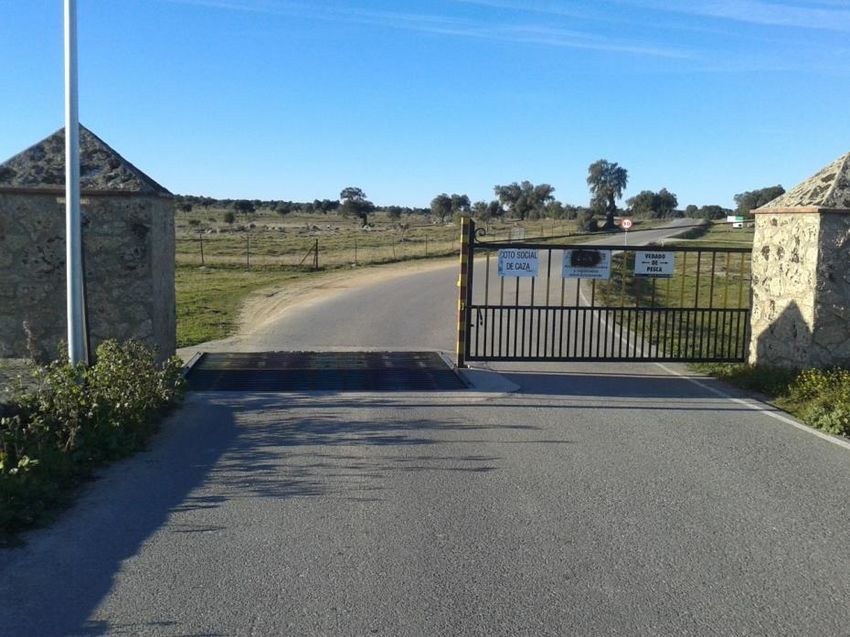
Environments 2017, 4, 82                                                                         10 of 38

at Dehesa de la Luz. The schedule is designed in accordance with the estimated area, location, and
year of intervention as well as the type of activity or treatment to be applied (see SM 5). Natural
growth and extractions are estimated by physical functions fitted to the environmental
characteristics and woodland management of the Dehesa de la Luz case study [19] (see SM 5).

2.2.2. Holm Oak: Tree Volume, Firewood Natural Growth, and Acorn Yield Functions
     Calculating the full production cycle of the holm oak involves using the functions for estimated
age (Ae) and volume (V) to calculate physical natural growth (ng), based on the measurements
carried out in the inventories, the age functions developed by Reference [23], and the official
databases of the National Forest Inventory (NFI). This cycle is assumed to correspond to the point at
which the power function of the growth based on estimated volume tends towards asymptotic
curve, estimating the point of tangency between the linear (ng linear) and power (ngpower) functions in
order to select the forestry cycles for assisted holm oak landscape regeneration (see SM 5):
                                                                     1
                                ng = 29.5437∙ (Db )0.8156 ∙(                )                      (1)
                                                               Ae + 72.9785
                                       ng linear = -0.0002∙V +1.930                                (2)
                                          ngpower =2.905 ∙V -0.084                                 (3)

where Db is the breast height diameter in cm, Ae is the estimated age in years, and V is the volume
in dm3.
     The models for annual holm oak firewood product (Pfirewood) are estimated in kg, based on the
measurement of a pilot pruning of 30 holm oaks representative of the diameter classes recorded in
the estate inventory. This model serves to calculate firewood growth according to the models
developed to estimate the total volume of holm oak based on the measurements taken and the
functions used in the second National Forest Inventory (NFI) in the province of Caceres [24]. Based
on this estimate, it is possible to determine the time period necessary to replace extracted firewood
between two consecutive pruning operations without exceeding the accumulated growth since the
previous pruning. This period is the minimum rotation between two consecutive pruning operations
(see SM 5). Only holm oak firewood is considered, as pruning is not performed on cork oaks.

                                       P firewood = 0.6661∙Db1.3314                                (4)
      The function for acorn production from adult holm oaks originating from natural regeneration
(Pacornnr) is estimated in kg by modeling the count of cupules on the floor at the end of the
‘montanera’ (Iberian pig fattening period) in the months of December and January, over three
consecutive seasons (2013–2104 to 2015–2016). To estimate the acorn production function for young,
planted holm oaks, the acorn yield model developed by Reference [25] is applied.
                                        Pacornnr ≡ F(Cca, Da, Wa)                                   (5)
where Cca is the tree canopy cover area, Da is the average density of acorns per square meter, and
Wa is the average weight of the acorns.

2.2.3. Cork Oak: Tree Volume, Cork Natural Growth, and Acorn Yield Functions
      Given the average age of cork oaks and the scarce number of inventoried adult trees, it is not
possible to obtain an acceptable production cycle using the algorithms applied to the holm oak;
hence, a maximum cycle for cork stripping of 150 years is used [26].
      The estimate of the cork production function considers the inventories conducted stem by stem
and the areas with planted trees. The model used to estimate cork yield (Pc) is taken from Reference
[27]. The results obtained using this model are contrasted with the data from the last cork stripping
in 2010 (these extractions being performed the same year for all the cork oaks dispersed throughout
the estate), obtaining similar yield results. It is assumed that cork growth is linear during the period
between stripping, with the debarking rotation (td) applied in Dehesa de la Luz being 10 years.
Environments 2017, 4, 82 11 of 38
The cork oak acorn yield function uses a different model for the plantation cork oaks and the
natural regeneration adult cork oaks. In the case of the young cork oaks, the fitted model for cork
oak acorn yield published by Reference [28] is used. To calculate acorn yield in adult cork oaks, a
coefficient is estimated which relates the mean yield obtained in young holm oaks and cork oaks.
2.2.4. Carbon Uptake
The carbon stored through the sink effect of the woodland is calculated using models
developed by References [29,30], based on volume and growth measurements performed in the
inventories (see SM 5). These models allow aboveground, large root, and fine root carbon to be
measured both in holm oaks and cork oaks.
2.3. Private Activity Economic Valuation Criteria
The economic valuation uses the extended accounts. The novelties incorporated are described
below, referring to conceptual aspects divulged in publications [4,16,19–22] as well as to
supplementary material concerning the methodological details and some of the extended accounts
application methods employed at Dehesa de la Luz.
Concepts and equations for products and costs are described in supplementary materials
sections 1. The reader should consult the tables and supplementary materials for detailed
explanations on accounting variables. Measuring the total private economic value of an agroforestry
estate in a consistent manner using social income theory may be an impossible task [18,21]. We
conducted exhaustive data collection at the estate itself to value the multiple private economic
values currently consumed. Some public services have been estimated according to their public
landowner production cost. The latter price is the EAA/EAF valuation criterion for non-market
goods.
2.3.1. Forestry Activities
Private forestry activities in this study are classified into manufactured (human-made)
conservation forestry activity (CF), cork, firewood, and grazing (grass and acorns) activities. The CF
products include intermediate services and the final product of gross formation of fixed
manufactured capital (GFCF) from tree plantations, the replacement of failed plantations, and
densification (Figure 4). The cork and firewood products only incur ordinary costs of raw materials,
services, and work in progress used in the course of extractions, and their products are natural
growth, cork stripping, and holm oak firewood. Manufactured CF also enhances the natural growth
of cork and firewood as well as acorn yield, increasing the value of these environmental assets.
The natural growths of cork and firewood over the period are final products classified as gross
production-in-progress formation in the supply side of the production account and are registered as
entries to the production-in-progress environmental assets of the capital account for the same
period. The current inventories of holm oaks and cork oaks are fixed environmental assets of
biological resources, valued according to the discounted expected future resource rents of cork and
firewood from harvesting rotations beyond the current one. Future trees (not yet existent) which will
replace those of current cycles also generate fixed cork and firewood environmental assets classified
as land. The sum of the three types of environmental assets of natural growths of cork and firewood
comprises the total value of their environmental assets. These valuation approaches avoid double
accounting when measuring total environmental incomes and assets of cork and firewood (see SM 6
and [21]).
Grazing only incurs the ordinary cost of ploughing (Figure S6) (see the development of
estimates for full production cycles of holm oak and cork oak in SM 6).Environments 2017, 4, 82 12 of 38
2.3.2. Water Storage Activity
The main function provided by the pools, wells, and springs is that of supplying water as an
intermediate raw material product (hereinafter intermediate water) for livestock drinking troughs,
although a secondary use for some pools in certain months is the rearing of tench (Figure 9). The
value of the intermediate water is the ordinary cost of production (maintenance cost and ordinary
consumption of fixed capital), plus the normal return from immobilized manufactured fixed capital
(pools). Water pools are valued at their market replacement production cost, corrected by a factor
which takes into account the state of conservation of each individual pool. The physical intermediate
water and consumption were not measured.
Figure 9. Pool made with compacted soil. Photograph: Daniel González.
2.3.3. Livestock Activity
Regarding field data collection for livestock, little difficulty is involved in the physical
inventory at the start of the accounting period, entries, withdrawals, and valuation of commercial
products. Self-employed family labor is valued by the residual method (see SM 8) [4,16,22,31,32] if
there is a positive net operating margin for livestock. If the latter is negative, that is, a monetary loss
for the family livestock activity, we assume that there is a positive trade-off against a self-consumed
intermediate service (ISSnca) by family livestock owners (see SM 8). This ISSnca is considered an
input of own intermediate consumption of service (SSo) of the family livestock private amenity [16].
In this case study, we did not measured the total product of amenity activity, but rather their SSo.
Thus, the potential environmental income for livestock is not measured.
2.3.4. Intermediate Services of Infrastructure Activities
Service activities include fencing and other infrastructures, footpaths for the public visitors, and
the dry-stone perimeter wall, given its public service function as a cultural landscape with historical
constructions.
The same valuation criteria as those used for the water services are followed for the livestock
infrastructure services. The main function of the fencing, access gates, livestock infrastructures, and
main gates is that of livestock management. Sanitation management and livestock foodstuff storage
require the use of infrastructures (sheds, tanks, stables and portable troughs). The fencing and the
dry-stone perimeter wall produce commercial and non-commercial intermediate services which are
consumed by the livestock activity and the public landscape activity, respectively. Infrastructure
service activity in 2014 also saw the final product of the dry-stone perimeter wall improvements
(manufactured gross fixed capital formation) valued at restoration cost.Environments 2017, 4, 82 13 of 38
The roads, paths, and bridges for the free public access are mainly used for public recreational
activity in Dehesa de la Luz. Hence, their construction is suitable for vehicle and pedestrian access.
There is a public right of way for access to the Ermita de la Luz sanctuary.
The dry-stone perimeter wall serves the same purpose as the fencing as well as providing a
public service given its cultural-historical interest (Figure 8). The concept of cultural-historical value
of a fixed-capital manufactured asset refers precisely to its condition as an ancient man-made
construction and as such it is assumed that citizens wish to contribute to its maintenance costs in
return for using the services provided by its existence in its current state of conservation. This
cultural-historical asset has survived to the present day in a partially complete state as regards the
historic construction, with broken parts of the wall having been replaced with stone and
construction materials. The cost incurred includes maintenance work, investment in restoration, and
consumption of fixed capital of post-2004 restoration works at replacement cost. The value per cubic
meter of stone wall is assumed to be the market value of its restoration. The market price of
construction weighted by a correction factor that takes into account the current state of conservation
is used. The capital value of the dry-stone wall is divided among the livestock activity, considering
the equivalent linear meters of wire fencing, and the remaining capital value is attributed to the
cultural-historical service provided by the dry-stone perimeter wall. The value of the intermediate
service is estimated using the same criteria as those for the livestock and public recreational
infrastructure, although the capital in this case is estimated according to the cost of the
quasi-restoration of stone work weighted by a correction coefficient of 0.6.
2.3.5. Private Amenity Activity
The family livestock owners’ private amenity product is valued in accordance with their
production cost, thus obtaining a null net operating margin. However, the value of the
environmental asset of the private amenity embedded in the market price of the land is estimated
based on available published information [4,16,33].
2.4. Public Activity Valuation Criteria
We measured the imputed market value of the product, cost, and change of net worth
associated with greenhouse effect carbon (environmental asset revaluation in this case). Other public
activities are final services and these are not valued at simulated market price, but at public
landowner production cost. Firstly, we registered the conservation forestry, livestock, dry-stone
wall, and roads that produce intermediate services to be used as inputs (own intermediate
consumption) by free access public recreation, option value of landscape services, and existence
value of the threatened livestock biodiversity service. Secondly, we registered the respective public
activities as inputs of own intermediate consumption of services (SSo). Finally, as standard accounts
criterion apply, we assumed the value of public services to be equal to their SSo production cost.
Public profitability denotes the ratio between the benefits (capital income) and the immobilized
capital (average annual capital invested in the economic activity) of public activities. To estimate
public benefit, we needed to measure the public products at simulated market prices [4,21]. To
determine this latter value, we needed to employ several non-market valuation techniques based on
consumer preferences.
2.4.1. Public Recreation, Landscape, and Threatened Livestock Biodiversity Activities
In this case study of Dehesa de la Luz, we omitted the valuation of public services produced by
the simulated market price criterion which consumers are willing to accept to finance the private
costs of the landowners and the livestock owners, as well as the direct costs to the government for
the management of public activities. Due to the omission of the public willingness-to-pay criterion, it
is not possible to determine the true product values of the public activities considered in Dehesa de
la Luz. The valuation of the free access for public recreation (Figure 10), landscape, and threatenedEnvironments 2017, 4, 82 14 of 38
livestock biodiversity is conducted using the valuation criterion of private ‘own’ services costs
incurred by the public landowner, family livestock owners, and family foresters.
Figure 10. Main free access entrance gate at Dehesa de la Luz. Photograph: Daniel Gónzalez.
2.4.2. Carbon Activity
The only exception to the valuation of public services at production cost is that of carbon, which
is valued at simulated market price. The carbon service involves estimating the fixation and
environmental consumption service of 2014 carbon dioxide emissions from the firewood
consumption and their revaluation in future cycles of the woodland, which is consistent with the
standard economic-environmental accounting criteria (SEEA-CF) and the extended accounts
valuation criterion [4,32,34].
We estimated the environmental income from carbon stored in the trees by the variation in
capital values between the opening and closing of the 2014 accounting period. This variation in net
carbon assets is equivalent to the sum of the carbon environmental net operating margin and the
environmental gains. The margin is calculated as the difference, over the period, between the values
for carbon fixation from natural growth of firewood and cork, and the equivalent emissions,
estimated from the firewood extracted in pruning operations and natural mortality in the woodland
in 2014. The environmental asset gain is estimated by the revaluation of the carbon environmental
asset, adjusted by the deduction of the expected fixation value at the opening of the period. The total
environmental asset of carbon is recorded as fixed capital land (FClce). This environmental asset has
two components: first, the carbon fixed by trees in the current production cycle, and second, the
carbon that is expected to be fixed or emitted in successive production cycles. These production
cycles were simulated according to silvicultural models.
2.5. Private Ecosystem Services
Ecosystem services are classified in this study according to the International Classification of
Ecosystem Services (CICES) [35] and defined as ‘the contributions of ecosystems to benefits
(products: goods and services) used in economic and other human activity’ [17] (p. 19, para. 2.23).
Ecosystem services can be intermediate or final, depending on the classification of products in which
they are embedded. The SEEA-EEA technical guidelines clarify the latter criterion: ‘There is common
misunderstanding of the role of classifications with regard to the distinction between final and
intermediate ecosystem services. Put simply, it is not the case that ecosystem services must be neatlyEnvironments 2017, 4, 82 15 of 38
classified between those that contribute directly to economic and social beneficiaries and those that
support the ongoing functioning of ecosystems. For example, when water is extracted from a lake it
would be considered final if the beneficiary was a household but intermediate if consumed by wild
deer’ [36] (p. 53, para. 5.33).
The private ecosystem services refer to the embedded contributions as natural production
factor inputs to the values of the total products consumed from the landowner’s private forestry
activities at Dehesa de la Luz in 2014. The absence of cork stripping explains the null value for
ecosystem services of cork consumed (the natural growth of cork and firewood are not consumed in
2014, as their contribution is taken into account in the accounting period in which they are extracted
(consumed) (for methodological details see [19].
2.6. Intermediate Products of Services
If the operating benefits of manufactured investments in conservation forestry, livestock, and
infrastructures for public services (recreation and cultural legacy) according to standard accounts
are lower than the normal in an alternative investment, then business-as-usual investment theory
states that the aforementioned activities are not competitive investments. Our hypothesis provides a
solution for this unexplained occurrence which does not fit into currently accepted investment
theory. We assume that the land and livestock owners obtain non-commercial intermediate services,
which entail that the owners receive competitive operating benefits (manufactured net operating
margin at basic prices). Our extended accounts measure the hidden donated and self-consumed
intermediate services that are omitted in the standard accounts measurements of intermediate
services.
In this research, our extended agroforestry accounts incorporate the intermediate products of
services (intermediate services) in a manner which is consistent with the SEEA-CF [34] and
SEEA-EEA [17] methodologies; although, in the latter, an ongoing approach to establish a standard
for institutional sectors of the ecosystem accounts has not been agreed on. Our extended
Agroforestry Accounting System (extended accounts) adopts a novel development to the SEEA-EEA
model B accounts [17] (p. 134, Section 6.3.2 and p. 144, Annex A6), [21] (p. 28, SM. Eq. (3.1)), [4] (p.
50). In this model B, the ecosystem is considered as a factor of the production function of the
individual products and the ecosystem is not an additional institutional sector, as treated in model A
of the accounts [37] (p. 13), [17] (p. 17, para. 2.13).
Agroforestry ecosystems potentially produce environmental intermediate products of raw
materials and services (although we term the latter ‘intermediate services’ for simplicity) with the
absence of human labor and manufactured capital inputs in their production function, and more
generally, they supply multiple manufactured intermediate products. The latter necessarily
incorporate the values of human labor and manufactured capital contributions which, along with
the contribution from the natural environment, can potentially provide embedded values of
ecosystem services estimated by the residual valuation method. We underline the fact that the
estimated intermediate services for conservation forestry, livestock, and infrastructures activities are
manufactured (human-made) intermediate services.
Intermediate products are goods and services produced on the agroforestry estate that are used
during the same period in which they are generated as own intermediate consumptions (inputs) by
the same activity that produces them (intra-consumption) or by other activities (inter-consumption)
on the same estate for the generation of the final products of the period. The classification and
valuation of the intermediate products and the individual intermediate consumptions coincide by
definition and, where all the products of the estate on which they are produced and consumed are
considered, their entire aggregate value also coincides.
Intermediate products are valued at the prices of formal markets or, in the absence of formal
transactions, simulated markets. It is assumed in the imputed prices of the individual donated and
self-consumed intermediate products that they correspond to the normal opportunity cost of the
immobilized manufactured investment in the production of the individual intermediate product.Environments 2017, 4, 82 16 of 38
Opportunity cost is defined by the total ordinary cost plus a normal manufactured net operating
margin (see SM 4 for details of its calculation).
The assumed hypothesis of a continuing investment by the landowner in the activities of
conservation forestry, livestock, and infrastructures with recreation and legacy services must reflect
the achievement of a normal profit (manufactured net operating margin). Establishing sufficient
evidence of obtaining a persistent profit margin in the medium term from manufactured margin at
producer prices below the norm for the mentioned activities is justified by the omission in the
standard accounts of the non-commercial intermediate services for the individual private activities
previously mentioned.
The intermediate services are classified into commercial and non-commercial categories. The
latter are noted as ‘compensated’ by the government (these are conventional operating and capital
subsidies), donated by the public landowner, and the self-consumption of private amenities by the
leasehold family livestock owners (these are used as input in the supply of self-consumed private
amenity products). The public landowner aims to encourage the intermediate services to promote
the supply of public products, accepting a lower private monetary manufactured net operating
margin against a benefit in the form of non-commercial intermediate services for donations. The
family livestock owners accept a lower private monetary manufactured net operating margin
against a benefit in the form of non-commercial intermediate services for private amenity
self-consumption. The family livestock owner benefit from his investment in livestock rearing is
characterized by the acceptance of lower or zero compensation from self-employed family labor and,
occasionally, a negative private monetary manufactured net operating margin from manufactured
investment (excluding the land).
3. Results
3.1. Physical Assets and Yields of Forestry
3.1.1. Open Woodlands Condition and Expected Future Improvement Trends
Table 5 presents the scheduling for full cycles of conservation forestry for the proposed cultural
landscape valued as the final environmental asset, indicating future interventions and the rotation
period applied (see SM 5). Regarding this future horizon, if the proposed future plantations and
interventions continue as scheduled (Table 5), the product, growth, and other parameters
representative of the forest species present in the estate will increase.
The estimated average age of the adult holm oaks and cork oaks at Dehesa de la Luz in 2014
was 165 (±4.2) and 109 (±3.6) years, respectively. In 2014, the density of the naturally regenerated
holm oaks and cork oaks was more than double that of the planted trees, reaching a similar density
by 2100 (Table 6). The canopy cover (CCF) of the estate circa 2014 was 19%, increasing to 31% by
2100 with the planned conservation forestry schedule. The conservation forestry cycles estimated for
holm oak and cork oak are 225 and 150 years, respectively. For the pruning of holm oak firewood, a
rotation period of 41 years has been established, which is compatible with the growth of the holm
oaks, and which will be reduced to 27 years once the currently existing aged trees have gone. In the
case of cork stripping, the current rotation period of 10 years is maintained.Environments 2017, 4, 82 17 of 38
Table 5. Schedule of the future assisted regeneration of holm oaks and cork oaks at Dehesa de la Luz.
Replacing Failed
Production Pruning Densification Formative Pruning Debarking Regeneration Felling Grazing Delimitation
Forest Plot Plants
Stand (ha) Next Period (1) Next Period Next Period Next Period Next Period Next Period Next Period
(year) (years) (year) (years) (year) (years) (year) (years) (year) (years) (year) (years) (year) (years)
1 21 2029 41 2120 110 2121 110 2015 110 2020 10
1 18.8 2028 41 2120 110 2121 110 2015 110 2020 10
1 24.7 2027 41 2120 110 2121 110 2015 110 2020 10
1 26 2026 41 2120 110 2121 110 2015 110 2020 10
2 23.5 2025 41 2014 35 2015 35 2019 35 2020 10
2 21.1 2030 41 2014 35 2015 35 2019 35 2020 10
2 21.3 2031 41 2014 35 2015 35 2019 35 2020 10
2 23.2 2045 41 2022 35 2023 35 2027 35 2020 10
2 22.1 2046 41 2022 35 2023 35 2027 35 2020 10
3 24.8 2039 41 2018 205 2019 205 2023 205 2020 10
4 28.8 2040 41 2026 210 2027 210 2031 210 2020 10
4 23.7 2041 41 2026 210 2027 210 2031 210 2020 10
4 22.8 2042 41 2026 210 2027 210 2031 210 2020 10
4 22.2 2043 41 2030 210 2031 210 2035 210 2020 10
4 16.4 2047 41 2022 210 2023 210 2027 210 2020 10
4 19.2 2048 41 2022 210 2023 210 2027 210 2020 10
4 19.1 2049 41 2030 210 2031 210 2035 210 2020 10
4 21.2 2050 41 2030 210 2031 210 2035 210 2020 10
4 21.8 2051 41 2030 210 2031 210 2035 210 2020 10
4 27.6 2052 41 2034 210 2035 210 2039 210 2020 10
4 20.8 2055 41 2034 210 2035 210 2039 210 2020 10
4 20.5 2056 41 2034 210 2035 210 2039 210 2020 10
4 23.8 2020 41 2034 210 2035 210 2039 210 2020 10
5 20 2023 41 2026 225 2027 225 2031 225 2020 10
5 20.4 2024 41 2038 225 2039 225 2043 225 2020 10
5 22.9 2044 41 2038 225 2039 225 2043 225 2020 10
5 19.2 2053 41 2038 225 2039 225 2043 225 2020 10
5 21.8 2054 41 2038 225 2039 225 2043 225 2020 10
5 27.2 2016 41 2042 225 2043 225 2047 225 2020 10
5 17.7 2017 41 2042 225 2043 225 2047 225 2020 10
5 16.5 2018 41 2042 225 2043 225 2047 225 2020 10
5 24.3 2019 41 2042 225 2043 225 2047 225 2020 10
5 26.1 2021 41 2046 225 2047 225 2051 225 2020 10
5 26.1 2022 41 2046 225 2047 225 2051 225 2020 10
R 24.6 2032 41 2159 150 2023 10 2144 150 2144–2164 130
R 23 2033 41 2159 150 2023 10 2144 150 2144–2164 130
R 21.8 2034 41 2159 150 2023 10 2144 150 2144–2164 130
R 12.5 2035 41 2159 150 2023 10 2144 150 2144–2164 130
R 7.7 2035 41 2159 150 2023 10 2144 150 2144–2164 130
R 16.9 2036 41 2159 150 2023 10 2144 150 2144–2164 130Environments 2017, 4, 82 18 of 38
R 21 2037 41 2159 150 2023 10 2144 150 2144–2164 130
R 25.2 2038 41 2159 150 2023 10 2144 150 2144–2164 130
Notes: (1) The pruning period is 41 years until all the trees from natural regeneration have been replaced by planted trees, when the pruning period becomes 27 years. Soil tilling is carried out over
the area where pruning was performed the previous year.
Table 6. Projection of the future condition and supply of the main products of holm oaks and cork oaks at Dehesa de la Luz.
Average Age Density Acorn Production Cork Growth Firewood Growth Canopy Cover
(years) (Trees) (t) (t) (m3) Fraction (%)
Class
Year Year Year Year Year Year Year Year Year Year Year Year Year Year Year Year Year Year
2014 2050 2100 2014 2050 2100 2014 2050 2100 2014 2050 2100 2014 2050 2100 2014 2050 2100
1. Natural regeneration 163 200 250 32,144 29,681 27,054 147.4 154.0 156.2 1.9 2.7 3.0 63.0 52.1 36.3 17 19 19
Holm oak 165 201 251 31,385 29,202 26,646 146.2 152.7 154.9 63.0 52.1 36.3 17 18 18
Cork oak 109 145 195 759 479 408 1.2 1.3 1.3 1.9 2.7 3.0 0 0 1
2. Plantation 19 40 81 15,824 26,475 26,384 9.3 56.5 195.5 4.4 10.4 23.1 2.4 19.5 46.3 2 5 12
Holm oak 15 30 69 5758 17,244 18,198 4.2 35.8 158.1 2.4 19.5 46.3 1 3 7
Cork oak 21 57 107 10,066 9231 8186 5.1 20.6 37.4 4.4 10.4 23.1 1 3 5
3. Total 117 124 166 47,968 56,156 53,438 156.6 210.5 351.7 6.3 13.1 26.1 65.4 71.6 82.6 19 24 31Environments 2017, 4, 82 19 of 38
3.1.2. Physical Natural Growth and Extractions of Firewood, Cork, Acorn, and Grass
The pruning of holm oaks in 2014 took place over an area of 19 ha. The annual growth of
firewood accounts for 45% of the firewood extracted, which is due, in the first place, to the fact that
extractions carried out in 2014 were larger than the accumulated growth since the last pruning. This
was firstly because the holm oak firewood was extracted beyond the maximum cycle established in
this study, and secondly due to dead holm oak firewood being extracted (estimated at 37% of the
amount of green firewood extracted and making up 23% of the total in 2014). Table 7 shows the
values for the growth and extraction of firewood, valued at stumpage price per ton.
The grazing price of acorn and grass (including browse) was estimated to be 0.035 €/forage unit
(FU) at Dehesa de la Luz in 2014 [19,22]. Grass and acorn make up 87% and 13%, respectively, of the
total grazing value (Table 7). The acorn yield per tree, obtained using the cupules count model, is
below that expected for holm oaks of that diameter due to the ageing of adult trees and the excessive
pruning that has taken place in the past.
Grazing (including acorn, grass and browse) are the main forestry activity raw material at
Dehesa de la Luz. The value of cork growth at Dehesa de la Luz is 6% that of grazing.
Table 7. Annual products of wood, cork, acorns, and grass at Dehesa de la Luz (2014).
Unit Yield Quantity Price Value
Class
(u) (u/100 Trees) (u) (€/u) (€)
Firewood extraction t 19.4 147.0 3.7 538.0
Annual firewood growth t 0.2 65.7 2.1 139.8
Annual cork growth kg 58.4 6325.7 0.3 2198.8
Grazing consumption 100 FU * 8234.9 3.5 28,723.6
Grass and browse 100 FU 7131.5 3.5 24,875.0
Acorn 100 FU 2.4 1103.4 3.5 3848.6
* FU: Physical forge unit represents a kilogram of barley with humidity of 14.1% which provides a
content of 2.723 kcal/kg DM (dry matter) of metabolisable energy.
3.1.3. Carbon Uptake
The value of carbon fixation by holm oaks is almost four times that of cork oaks, while the
carbon emissions from holm oaks are more than 10 times greater due to the quantity of firewood
extracted in 2014. Due to the quantity of carbon emissions from the holm oaks, the net fixation value
is negative, whereas in the case of the cork oaks it remains positive (Table S9).
3.1.4. Livestock Grazing
The 2014 accounting period total metabolic energy requirements of the landowner’s and
family’s livestock that feed on the Dehesa de la Luz estate is estimated to be 1013.7 FU/ha. Eighty
three percent of these energy requirements are provided by grazing, while the remaining 17% comes
from the provision of supplementary foodstuff. In the case of family livestock owners, the
accounting period total physical energy requirements of the livestock are estimated at 794 FU/ha.
Eighty two percent of these family’s livestock energy requirements are met by grazing and the
remaining 18% corresponds to supplementary foodstuff. For the landowner’s livestock, the
requirements are estimated at 219.4 FU/ha, with 88% of that coming from grazing and 12%
supplementary foodstuff (Table 8).
Regarding the different livestock, bovine consume 796 FU/ha, of which 81% is grazed and the
other 19% is supplemented. Equine consumption is estimated at 39 FU/ha, of which 94%
corresponds to grazing and 6% to supplementary foodstuff (Table 8).
The total price of the feed consumed is estimated at 0.074 €/FU, that of the family livestock
owners being double that of the landowner (Table 9) [19,22]. There is no marked difference in the
prices of supplementary foodstuff (Table 9).Environments 2017, 4, 82 20 of 38
Table 8. Livestock grazing and supplementary foodstuff consumption in Dehesa de la Luz (2014:
FU/ha).
Forage Units (FU)
Class Grazing
Supplements Total
Grass and Browse Acorn Total
1. Family livestock owners 561.8 86.9 648.7 145.5 794.3
1.1 Bovine 547.7 84.7 632.5 143.8 776.2
1.2 Equine 14.1 2.2 16.3 1.8 18.1
2. Landowner 167.6 25.9 193.5 25.9 219.4
2.1 Ovine 140.9 21.8 162.6 15.7 178.3
Rambouillet Merina 129.0 20.0 148.9 14.3 163.3
Black Merina 11.9 1.8 13.7 1.3 15.0
2.2 Bovine 8.8 1.4 10.2 9.6 19.8
2.3 Equine 17.9 2.8 20.7 0.6 21.3
Total 729.4 112.8 842.2 171.5 1013.7
Table 9. Price of grazing and supplementary foodstuff by owner and livestock type at Dehesa de la
Luz (2014: €/100 FU).
Class Grazing Supplements Total
1. Family livestock owners 4.2 27.2 8.4
1.1 Bovine 4.0 27.2 8.3
1.2 Equine 12.1 29.5 13.8
2. Landowner 1.1 22.4 3.6
2.1 Ovine 0.7 26.4 3.0
Rambouillet Merina 0.7 26.4 3.0
Black Merina 0.7 26.4 3.0
2.2 Bovine 0.0 15.7 7.6
2.3 Equine 4.5 25.0 5.1
Total 3.5 26.5 7.4
3.2. Selected Physical Capital and Product Indicators per Livestock Type
The number of calves born to each reproductive female is higher for the landowner than for the
family livestock owners. In contrast, the number of equine births is greater among the family
livestock owners than for the landowner. The fertility rate of the two ovine breeds differs
moderately, the figure being 0.7 for the Rambouillet Merina and 0.8 in the case of the Black Merina
sheep (Table S7)
The sale of calves per reproductive female is greater in the case of the landowner than for the
family livestock owners. The ratio of calf sales to births is 78% in the case of the landowner and 71%
for the family livestock owners. Concerning ovine livestock, the ratio of sales to births is 43% for the
Rambouillet Merina and 38% for the black Merina. The equine livestock belonging to the landowner
had a sales-to-births ratio of 33%, while in the case of the family livestock owners, no sales of foals
were made during the accounting period.
Table S7 shows the average prices used per livestock type and owner for the different livestock
product valuations. In the case of calf sales, it can be seen that the landowner’s price is higher than
that of the family livestock owners.
3.3. Selected Economic Indicators of Private Activities at Dehesa de la Luz
Table 10 presents the main accounting identities used in the estimation of income, total capital,
and private yield rates in the case study of Dehesa de la Luz [4,16,18,20,32].You can also read