The Economic Value of Private Woodlots in Southern Ontario
←
→
Page content transcription
If your browser does not render page correctly, please read the page content below
The Economic Value of Private Woodlots
 in Southern Ontario

 by

 Hyemin Kim

 A research paper submitted in conformity with the requirements
 for the degree of Master of Forest Conservation
 Faculty of Forestry
 University of Toronto

 © Copyright by Hyemin Kim 2020
The Economic Value of Private Woodlots in Southern Ontario

 Hyemin Kim

 Master of Forest Conservation

 Faculty of Forestry
 University of Toronto

 2020

Abstract

This study investigated various characteristics of private woodlots in southern Ontario and

calculated their estimated economic value. More than 90% of southern Ontario forests are

privately owned, which are small and fragmented. While many woodlots in the southwestern

region are small parts of farmlands, the majority of owners in central and northern regions are

non-farmers. The southwestern counties mostly have forest conservation by-laws allowing both

diameter-limit cutting and good forestry practices, whereas most of the eastern municipalities do

not have by-laws. It turned out that diameter-limit cutting is still the most common practice

throughout southern Ontario, and the participation rate of the Managed Forest Tax Incentive

Program in Ontario is only 10%. The geospatial analysis showed that 1.3 million hectares of

southern Ontario private forests, located in the Mixedwood Plains ecozone, consist of 46%

deciduous, 21% mixed, 18% coniferous, and 7% plantations. The economic value of deciduous

forests was estimated to be about 1,089 million dollars, which can be increased by 91 million

dollars through a complete conversion of diameter-limit cutting to good forestry practices. The

private plantation was calculated to have a value of 170 million dollars, with increasing potential

of 30 million dollars by increasing the thinning ratio of red pine plantations by 10%.

 ii
Acknowledgments

I would like to gratefully acknowledge the assistance of the numerous informants who were
willing to contribute to this study. I particularly wish to thank several informants who provided
me timber sales data: Simcoe County, Ganaraska Conservation Authority, York region, Saugeen
Valley Conservation Authority, and a couple of highly supportive forest consultants.

I would like to extend my sincerest gratitude to my supervisors Kymberley Snarr, Art Shannon,
and Paul Robertson from the OWA (Ontario Woodlot Association). This capstone project was
initiated by the OWA as a part of its efforts to increase the level of understanding about privately
owned forests in southern Ontario. I also express my genuine thanks to my internal supervisor
Shashi Kant for his guidance and support throughout the project. I thank Gerald Romme, a GIS
Analyst in the Map and Data Library, for his technical supports regarding the GIS program.

 iii
Table of Contents

List of Tables ............................................................................................................................. v

List of Figures ........................................................................................................................... vi
List of Appendices ................................................................................................................... vii
Introduction .............................................................................................................................. 8
Private woodlots in southern Ontario .....................................................................................12
 General Characteristics .........................................................................................................12
 Forest Conservation By-laws ................................................................................................13

 Managed Forest Tax Incentive Program (MFTIP) .................................................................17
Geospatial analysis of private woodlots in southern Ontario ................................................21
Economic valuation of private woodlots in southern Ontario ...............................................24
 Deciduous forests .................................................................................................................24
 (1) Harvest ratio .............................................................................................................27
 (2) The proportion of DLC versus GFPs ........................................................................29

 (3) Revenues and volume yields of GFPs .......................................................................30
 (4) Revenues and volume yields of DLC ........................................................................33
 (5) Potential for deciduous forest value increase ............................................................36
 Plantations ............................................................................................................................36
 (1) Thinning ratio ...........................................................................................................38
 (2) Economic value of red pine plantations ....................................................................39

 (3) Potential for plantation value increase ......................................................................42
Discussion ................................................................................................................................44
Recommendations ...................................................................................................................46
References .................................................................................................................................48
Appendices................................................................................................................................54

 iv
List of Tables

Table 1. The proportion of diameter-limit cutting (DLC) and good forestry practices (GFPs) ... 16

Table 2. The number and eligible areas of participating properties in the MFTIP ...................... 18

Table 3. Land area by categories and forest types in southern Ontario. ..................................... 23

Table 4. The estimated proportion of private woodlots doing regular harvesting operations. ..... 27

Table 5. The proportion of DLC versus GFPs in each region .................................................... 29

Table 6. The estimated revenues of deciduous forests in each region. ....................................... 30

Table 7. Improvement of stands after good management .......................................................... 32

Table 8. The calculated private forests value under GFPs in each region................................... 33

Table 9. The estimated revenues of private woodlots receiving DLC ........................................ 35

Table 10. The expected value increases according to the GFPs proportion increase. ................. 36

Table 11. The percentage of private plantations receiving regular thinning operations .............. 38

Table 12. The expected revenues from red pine plantations in the eastern region. ..................... 41

Table 13. The estimated revenue table of Simcoe county red pine plantations. .......................... 41

Table 14. The estimated revenue table of Ganaraska red pine plantations. ................................ 41

Table 15. The estimated revenues of plantations receiving regular thinning operations. ............ 42

Table 16. The expected value increases with an increased thinning ratio by 10%. ..................... 43

Table 17. The summary table of the economic valuations. ........................................................ 43

 v
List of Figures

Figure 1. Sub-regions of southern Ontario ................................................................................ 10

Figure 2. Upper- and single-tier municipalities with or without forest conservation by-laws ..... 15

Figure 3. Participation areas and the number of properties in the MFTIP .................................. 17

Figure 4. The map of the MFTIP participation rate in southwestern Ontario ............................. 19

Figure 5. The geographical distribution of privately owned forests in southern Ontario ............ 21

Figure 6. Areas and forest types of private woodlots in the Mixed Plains ecozone .................... 22

Figure 7. The process of deciduous forest value calculation ...................................................... 27

Figure 8. Volume yields and revenues from the total 109 sales data .......................................... 31

Figure 9. Stumpage price and net present value per tree by diameter and age (Hard maple) ...... 34

Figure 10. Timber production and realized values of selection cutting and DLC ....................... 34

 vi
List of Appendices

Appendix 1. Informant list ........................................................................................................ 54

Appendix 2. Interview questions .............................................................................................. 56

Appendix 3. The MFTIP participation data by counties ............................................................ 57

Appendix 4. Forest covers and agricultural land areas of southern Ontario municipalities ......... 59

Appendix 5. Prices of some species ($/mfbm, $/m3 ). ................................................................ 61

Appendix 6. Conversion factors................................................................................................ 62

 vii
Introduction

Canada has the third largest area of forest in the world, around 400 million hectares, after Russia
and Brazil (Rotherham, 2003). Around 47% of this forested area, 188 million hectares are
estimated to be actively managed and harvested (Rotherham, 2017). Approximately 13% of the
managed forests, 24 million hectares, are regarded as privately owned forests which produce
around 20% of the national timber supply (Rotherham, 2017). The proportion of private forests
in Canada is much smaller than other developed countries such as Sweden (91%), Finland
(75%), France (74%), the USA (73%), and Germany (47%) (Kant, 2009).

Private forests are spread throughout the southern part of Canada, and approximately one-quarter
of them are located in Ontario. Among the total 56 million hectares of productive forests in
Ontario, 90% are publicly owned forests and 10% are privately owned forests (MNRF, 2019-a).
A large portion of privately owned woodlots is located in southern Ontario, the most populated
and urbanized area in Canada (Kant & Kant, 2009; Watkins, 2011). In terms of Rowe (1972)’s
forest region, approximately 67% of the private forest is located in the Great Lakes-St. Lawrence
Forest region and only 3% in the Deciduous Forest region (Kant & Kant, 2009). In respect of the
ecozone, private forests are mostly distributed throughout the Mixedwood Plains ecozone,
covering Deciduous Forest and a part of Great Lakes-St. Lawrence Forest region (Watkins,
2011). Although this Ontario’s southernmost ecozone occupies less than 10% of the province
and experienced significant anthropogenic disturbances, its forests still have the greatest
diversity of tree species with more than 60 native hardwood and softwood species (MNRF,
2019-b). In addition, around 82% of the provincially listed vulnerable, threatened, or endangered
species were discovered, and 646 unique species were reported in this region (Kant & Kant,
2009).

The origin of private woodlots in Canada is closely linked to European settlement history.
Between 1700 and 1900, early European settlers could acquire landownership under the
condition that they cleared land for farming and housing (Rotherham, 2017; Schwan et al. 2013).
Since the deciduous forests with fertile soil and temperate climate were suitable for agriculture,
much of southern Ontario land was cleared but a part of forests was kept as a source of fuelwood,
building materials, and food - maple sugar, berries, mushrooms, and meat (Dansereau &
deMarsh, 2003; Kant & Kant, 2009). Also, some farmlands that were unsuitable for agriculture

 8
due to soils, drainage, or topography were abandoned and converted back to forests (Schwan et
al. 2013). This settlement history reduced the southern Ontario forest cover from 85% to 20-30%
in rural areas and to less than 5% in urban regions, creating the unique feature of the small-sized
and fragmented distribution of private woodlots (Butt, 2010).

Due to their small portion, private forests have always received little attention compared to
publicly owned forests. Public woodlands are systemically managed with a long-term plan under
professional management, receiving more regeneration and tending activities (Kant, 1999; Davis,
2018). On the contrary, private woodlots are usually under the sole stewardship of landowners
who have limited knowledge and resources. Furthermore, many of the woodlots located near
farmlands received much less attention than agriculture and development (Schwan et al. 2013;
Informant 17; Informant 32). Hence, there are not much information and data regarding private
forests in Ontario. Forest inventory investigation (Watkins, 2011; MNRF, 2019-a) only focuses
on public forests excluding the southern Ontario region where most of the private woodlots are
located. The last inventory of private forests in southern Ontario was conducted in 1978 (Schwan
& Elliott, 2010), and no recent research has shown the present condition or economic value of
privately owned woodlots.

Since private woodlots occupy small areas but lie near cities, their benefits to people are more
direct: purifying air and water, maintaining wildlife habitat, supplying various forest products,
and offering recreational sites (NRCan, 2017). Along with these benefits, well-managed
woodlots can produce constant and sustainable revenues, comparable to agricultural profits,
through timber harvest (Schwan et al. 2013). Therefore, it would be meaningful to calculate the
economic value of private woodlots because they are not public goods and they have always
been threatened by land clearing for farmlands or residential development.

This study aims to investigate the current status of private woodlots and their estimated
economic value. First, the general characteristics of private forests in southern Ontario were
investigated from various perspectives, which include not only average areas and landowners but
also forest conservation by-laws and the Managed Forest Tax Incentive Program (MFTIP) in
each county. Second, the geospatial analysis was conducted in order to examine the geographical
location and forest types of private woodlots. Finally, their current economic value was
calculated and the expected value increase with good forest practices was derived.

 9
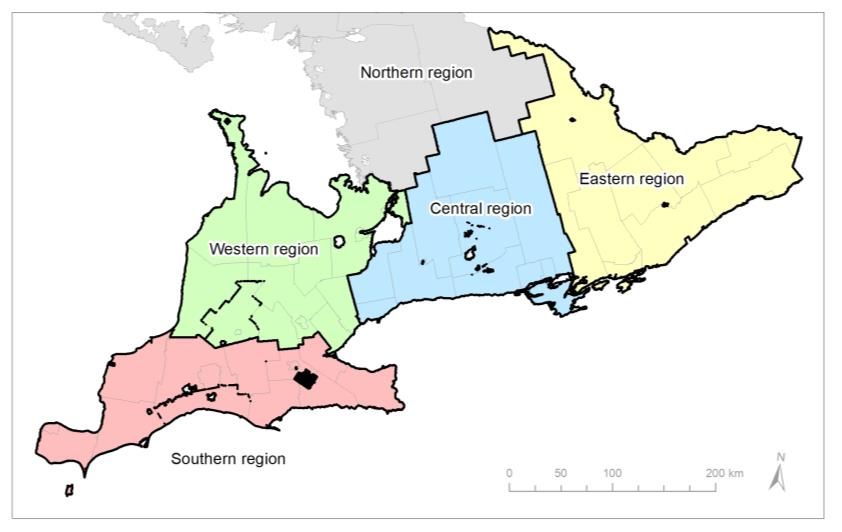
Methods

The study area is southern Ontario, particularly the Mixedwood Plains ecozone, because a large
portion of the private woodlots is located in the southern part of Ontario. In addition, it was
estimated that each region has different characteristics and economic values, and hence southern
Ontario was divided into four sub-regions: southern, western, central, and eastern regions
(Figure 1). For this study, four types of methods were used: literature review, geospatial analysis,
interviews, and economic valuation.

First, a number of papers and articles were investigated to understand the various aspects of
private forests in Ontario and to attach credence to the study.

Second, in order to identify the location, size, and forest types of private woodlands, the
Southern Ontario Land Resource Information System (SOLRIS) Version 2.0 was geospatially
analyzed with the GIS (Geographic Information Systems) software (ArcMap 10.4.1). To obtain
the pure private forest cover, publicly owned lands were removed, and these georeferenced files
 1
were downloaded from the “Scholars Geoportal” website . Then, the area and composition of
private woodlands in southern Ontario were analyzed and compared by municipalities.

 Figure 1. Sub-regions of southern
 Ontario: southern, western, central,
 and eastern regions. Sub-regional
 boundaries were drawn based on
 the regional classification of
 OMAFRA (2019).

1
 http://geo2.scholarsportal.info/ (Geospatial datasets developed through the Ontario Council of University Libraries)

 10
Third, a number of professionals who have many years of experience in private forests were
interviewed via email, phone, or face-to-face meetings. Initial contacts were obtained from the
 2
OWA (Ontario Woodlot Association) executives, the OWA website (Forest Services Directory) ,
 3
and the Managed Forest Plan Approver Listing . Based on these contacts, new potential
interviewees were recruited by snowball sampling (Goodman, 1961). The interview questions
regarding private woodlots were as follows: average size, forest type, species composition,
management status, harvest regimes, timber yields and revenues, etc. In addition, forest
conservation officers in each municipality were contacted to obtain the harvest permits data,
from which the proportion of diameter-limit cutting and good forestry practices was calculated.
The participation data of the MFTIP (Managed Forest Tax Incentive Program) were acquired
directly from the MNRF. In the report, for the confidentiality purpose, all interviewees were
listed as Informants and numbered (Appendix 1). A list of questions used for the interviews is
included in Appendix 2.

Finally, based on gathered data, the estimated economic value of private woodlots for each forest
type was calculated. Since well-managed forests can permanently produce consistent timber
volumes and revenues in ideal conditions, the land expectation value was calculated on the basis
of the perpetual periodic annuity concept. In addition, the potential of the economic value
increase was derived under the assumption that the proportion of good forestry practices
increases or the number of plantations receiving thinning operations increases. The analysis was
concentrated on deciduous forests and plantations due to their economic importance and lack of
data availability of other forest types.

2
 https://www.ontariowoodlot.com/directory
3
 https://www.sps.mnr.gov.on.ca/MFPAListing

 11
Private woodlots in southern Ontario

General Characteristics
The average size of private forests in southern Ontario is much smaller and more fragmented
than public forests in the northern region (Kant & Kant, 2009; MNRF, 2019-c). The average area
of woodlands in southern and western regions is known to be around 6-8 hectares (Informant 1;
Informant 17; Schwan & Elliott, 2010) (Sub-regional boundaries of southern Ontario are
indicated in Figure 1). On the other hand, woodlots in central and eastern regions have a bit
larger size, approximately 20-40 hectares (Informant 2; Informant 14; Informant 31). Since the
majority of counties do not have good data on private woodlots, it was impossible to know the
exact average size. Only Lambton County (located in the southern region) provided its figures:
total area of private woodlots is 37,500 hectares, the total number of private woodlots is 2,565,
so the average area is 14 hectares (Informant 10). According to Watkins (2011), of all the
patches of forest in southern Ontario, only 0.2% is greater than 100 hectares, and just 4.4% is
greater than 10 hectares. Therefore, merely a small percentage of forest owners hold larger than a
few hundred hectares (Dansereau & deMarsh, 2003), but the majority of them have a small size
of woodland.

The greater part of private woodlots in southern and western regions are located at the back of
farmlands (Informant 18; Informant 27), and their portion in farmlands is considerably small: 7%
(southern), and 11% (western) (Statistics Canada, 2017). Meanwhile, the majority of landowners
in central and northern regions are non-farmers who are local residents or urban dwellers
(Informant 15; Informant 16; Informant 23; Informant 25; Informant 30). The southern part of
eastern regions, near Ottawa, has a high percentage of farmer-owners, whereas the northern part,
such as Renfrew County, has a much lower percentage (Informant 2; Informant 32). For the
majority of landowners, woodlot profits are not a primary source of income but secondary
revenue, and hence only a small number of owners with larger areas make a living by managing
their forests (Dansereau & deMarsh, 2003).

In recent years, there have been some changes in woodlot ownership throughout rural Ontario. A
number of old farms and woodlots have been sold to retirees or a new generation of landowners
with an urban background who want to enjoy nature-friendly living and recreational pleasure

 12
(Rotherham, 2017). Many of them use these properties as weekend spots, regularly traveling
from urban areas for the weekend (Informant 1; Informant 6; Informant 17). The young
generation of landowners can be classified into two types: The first type just leaves their
woodlots unmanaged, and the second type, normally well-educated people, is greatly interested
in sustainable forest management by actively seeking advice from professional foresters (Côté et
al. 2017; Informant 1). On the other hand, the agricultural business has transformed from small
family farms to larger corporation entities, some of them owning larger than 1,500 hectares
(Informant 1; Informant 3; Informant 6). According to Statistics Canada (2012), the average farm
size in Ontario has increased by approximately 100 hectares (4.7%) from 2006 to 2011. These
big-sized farmlands, therefore, tend to have multiple patches of small woodlots.

Forest Conservation By-laws
Since the late 1940s, the Ontario province has empowered municipalities to protect woodlands
and regulate tree cutting in private forests (Yung, 2018). Several upper- and lower-tier
municipalities passed tree-cutting by-laws (changed to forest conservation by-laws) through the
Trees Conservation Act (1946), the Trees Act (1950), and the Forestry Act (1998). Now all
levels of municipalities can pass and enforce by-laws under the Municipal Act (2001), but it is
not mandatory. This legislation allows upper-tier municipalities to have jurisdiction over
woodlots that are 1 hectare or larger, whereas small sized woodlots less than 1 hectare in the area
are regulated by lower-tier municipalities (Buchanan et al. 2013). On the other hand, single-tier
municipalities have authority regardless of the size of woodland (Buchanan et al. 2013). Since
each municipality enacts its own tree by-law, the size threshold of woodland to be protected
under the by-law is dissimilar across municipalities: 4 hectares in Haliburton County (Haliburton
County, 2014), 2 hectares in Lanark County (Lanark County, 2016), 1 hectare in Lambton
County (Lambton County, 2012), and 0.2 hectares in Norfolk County (Norfolk County, 2006).

Most of the current by-laws contain two possible harvesting options: diameter-limit cutting
(DLC) and good forestry practices (GFPs). The DLC, also referred to as circumference-limit
cutting, set minimum diameters of trees to be retained by allowing to remove trees above them
(MNRF, 2005). The diameter limit varies by species and location in each county. This approach,
which was developed in the early 1900s to prevent the widespread practice of clearcutting, was
adopted and continuously used by many municipalities in Ontario because of its ease of

 13
application and enforcement (Jacobson, 2001; MNRF, 2005). While it has helped to protect
private woodlots from complete deforestation (MNRF, 2005), there have been a number of
concerns about its long term effects.

The DLC tends to remove all the big and mature trees leaving only small ones below the size
threshold (Kenefic et al. 2005; Schwan & Elliott, 2010). It normally results in the removal of the
fastest-growing or the most vigorous trees and the retention of genetically inferior or slow-
growing individuals (Kenefic et al. 2005). In addition, diseased or injured trees smaller than the
diameter limit cannot be removed with this practice (Informant 1; Informant 17). Therefore, it
leads to lower stand productivity and downgraded timber value (Kenefic et al. 2005; MNRF,
2005; Buchanan et al. 2013; Guillemette & Bédard, 2019). Furthermore, DLC normally
disregards crucial factors such as regeneration, species composition, proper spacing, or forest
health (Schwan & Elliott, 2010). Since there is usually no supervision, some loggers move just
fast without much consideration of damage to the remaining trees (Informant 25). Under this
scheme, the harvesting cycle may need to be extended to as long as 40 years due to less regular
and less frequent yields of volume (Nyland, 2005; Schwan & Elliott, 2010; Informant 18), and
some highly degraded stands would be better to clearcut and replant (Informant 25). For these
reasons, DLC is not regarded as a silvicultural system in Ontario (MNRF, 2000), and the
majority of the interviewed forest consultants agreed that it is a form of bad practice.

On the other hand, GFPs represent silvicultural activities that allow forest stands to maintain
ecosystem processes and wildlife habitats by minimizing damage to other forest values and by
pursuing long-term forest health (MNRF, 2000). Some commonly accepted norms of GFPs
include: minimizing environmental damage to the site (soil, water, young seedlings, etc.),
protecting forest components (biodiversity, habitats, etc.), providing continual and increased
economic benefits to landowners, and preparing long-term forest management plan (MNRF,
2000). For the application of GFPs, the by-law requires that a prescription or forest management
plan should be prepared by a registered professional forester (RPF) or member of the Ontario
Professional Foresters Association (OPFA), and trees have to be marked by a certified tree
marker (Glasgow, 2017). GFPs normally (1) remove the worst trees, such as diseased or
defective entities, first; (2) never harvest more than 30% of the stand density; and (3) leave
different size classes of trees (pole, small, medium, and large) as residual stocks (Informant 1;
Informant 25).

 14
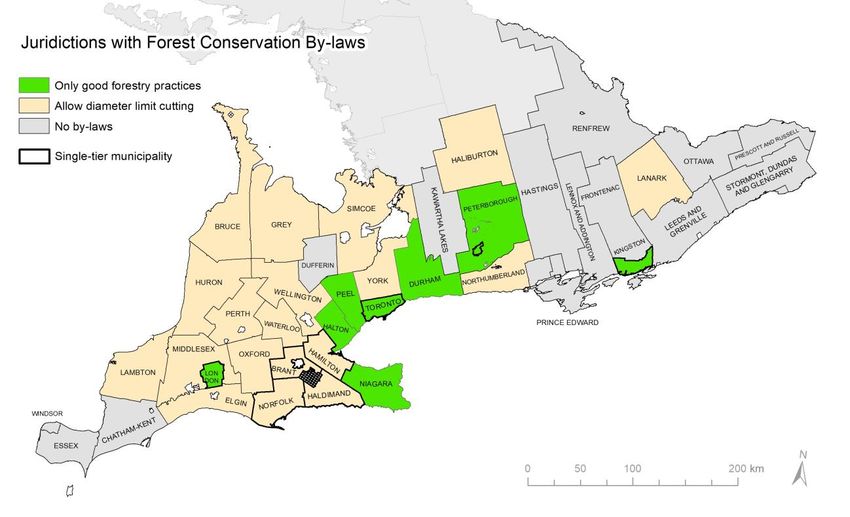
In Ontario, there are 444 municipalities including 30 upper-tier, 241 lower-tier, and 173 single-
tier municipalities, but among them only 67 municipalities (15%) have forest conservation by-
laws (Yung, 2018). Among 30 Ontario upper-tier municipalities that have jurisdiction over
woodlots of 1 hectare or more, 20 of them have forest conservation by-laws containing GFPs
solely or in combination with DLC (Yung, 2018). 15 upper-tier municipalities allow both DLC
and GFPs, whereas 5 upper-tier municipalities only permit GFPs: Regional Municipality of
Niagara, Regional Municipality of Halton, Regional Municipality of Peel, Regional Municipality
of Durham, and Peterborough County (Yung, 2018) (Figure 2). There are also some single-tier
municipalities that promote GFPs, such as the city of London, Toronto, Peterborough, and
Kingston (Yung, 2018). Meanwhile, most of the municipalities in eastern Ontario do not have
by-laws except Lanark County (Figure 2). The reason behind this phenomenon is presumed to be
the lack of public support and lower pressure of agriculture or development compared with
western regions (Informant 8). In the southern region, Essex County and Chatham-Kent County,
which have higher agricultural land covers, have not imposed forest conservation by-laws as well.
Many forest experts contended that there has been substantial public opposition against

Figure 2. Upper- and single-tier municipalities with or without forest conservation by-laws in southern
Ontario. Results are retrieved from Yung (2018).

 15
introducing or strengthening by-laws (Informant 1; Informant 3; Informant 4; Informant 8).
There are plenty of landowners who regard that the forest conservation by-laws are too
restrictive and invasive (Informant 20; Informant 23). But the municipalities without forest
conservation by-laws are more likely to experience commercial clearcutting or high grading
(Informant 3; Informant 4; Informant 14).

The forest conservation by-laws require landowners to submit a Notice of Intent (NOI) before
harvesting (Schwan & Elliott, 2010). The NOI document contains of harvesting types as well as
the owner, the location, the harvest timing, the tree species being removed, etc. (Schwan &
Elliott, 2010). In order to identify the harvesting regimes of private forests in each county, the
proportions of harvesting types were investigated via interviews with forest conservation officers
or literature (Table 1). Judging from the collected information, many woodlots of southern and
western Ontario still perform more DLC than GFPs: on average, 66% of DLC and 34% of GFPs.

In terms of harvesting area of NOIs, GFPs tend to have larger areas than DLC, so the GFPs
proportion is a bit higher than Table 1: Northumberland (DLC 60%, GFP 40%), Haldimand
(DLC 59%, GFP 41%), and Simcoe (DLC 53%, GFP 47%). In Huron County, the GFPs portion
has increased dramatically from 8% in 1999 (Schwan & Elliott, 2010) and 15% in 2001 to 50%
in 2019 (Informant 9). This is in part due to education and outreach efforts by the county as well
as the increased recognition of landowners about the benefits of sustainable forest management

Region County Diameter-limit cutting Good forestry practices Sources
Southern NORFOLK 50% 50% FitzGibbon & Summers, 2002

Southern LAMBTON 99% 1% Informant 10

Southern HALDIMAND 65% 35% Informant 11

Western BRUCE 75% 25% Informant 1, Informant 27

Western GREY 50-60% 40-50% FitzGibbon & Summers, 2002

Western SIMCOE 61% 39% Informant 5

Western HURON 50% 50% Informant 9

Western PERTH 92% 8% Schwan & Elliott, 2010

Central NORTHUMBERLAND 75% 25% Informant 12

Table 1. The proportion of diameter-limit cutting and good forestry practices in several Ontario counties
based on the number of notice of intents (NOIs). Since most of the eastern Ontario municipalities do not
have by-laws, there is no relevant data.

 16
(Informant 9). On the contrary, the GFPs rate has been considerably decreased from 31% (2012)
to 1% (2019) in Lambton County. Large agricultural business, high fees of GFPs, and very few
numbers of forest consultants (only 4) in the region might affect this trend (Informant 10).

Managed Forest Tax Incentive Program (MFTIP)
In order to encourage GFPs and increase the landowners’ awareness about forest stewardship,
the Managed Forest Tax Incentive Program (MFTIP) was designed. The tax of the eligible land
is 25 percent of the municipal tax rate for residential properties. To participate in the MFTIP,
landowners should possess at least 4 hectares of forest and submit a long-term forest
management plan. Five years later, a progress report must be completed, and the plan should be
updated every ten years to remain in the MFTIP (MNRF, 2012; Rotherham, 2017). Under the
MFTIP, the landowner is ultimately responsible for the management of their lands, mostly
handling basic tending activities on their own or hiring forest consultants to complete
challenging operations (Informant 14; Informant 19). These activities should comply with GFPs,
and harvesting operations must be conducted according to the MNRF’s silvicultural guide
(MNRF, 2012; Informant 15; Informant 19). The MFTIP does not allow high-grading or DLC as
well as perpetual inactivity degrading the forest health (MNRF, 2012). The properties that are
found to be unqualified would be removed from the program and may have to return their tax
benefits (MNRF, 2012; Informant 3).

Overall, the total land area in the program has remained steady around 700,000 hectares, whereas
the number of participant shows an increasing trend (MNRF, 2019-c) (Figure 3). It means that
the average area of participating properties has decreased from 68 hectares in 2004 to 45 hectares

 Figure 3. Participation areas
 and the number of properties
 in the MFTIP (Managed
 Forest Tax Incentive Program)
 (MNRF, 2019-c).

 17
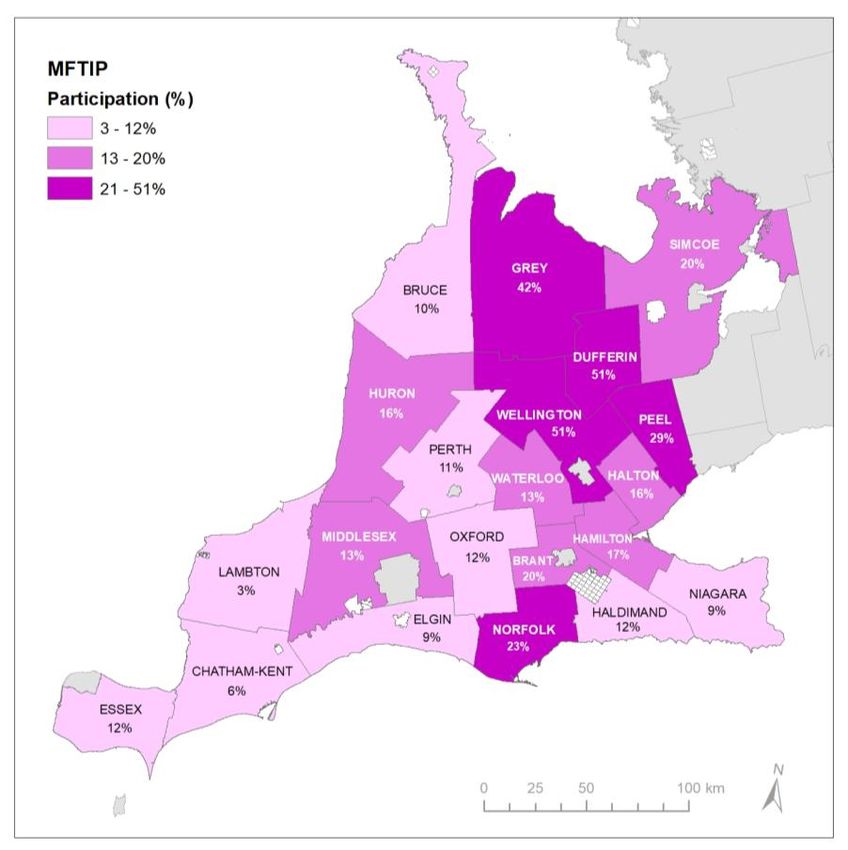
Region Participating properties MFTIP eligible area (ha) Average area (ha)
 Southern 1,159 20,630 18
 Western 4,414 93,977 21
 Central 4,026 170,183 42
 Eastern 2,833 101,273 36
 Northern 4,350 199,327 46
 Total 16,782 585,389 35

Table 2. The number and eligible areas of participating properties in the MFTIP (Managed Forest Tax
Incentive Program). Data are obtained from the MNRF (Ministry of Natural Resources and Forestry).

in 2014. As of 2019, the total area remains at about the same level, 666,270 hectares (eligible
area 585,389 hectares), and participant enrolment is 16,782 (data was obtained directly from
MNRF). Considering the total number of private woodlot owners in Ontario (170,000)
(Dansereau & deMarsh, 2003; Rotherham, 2017), the MFTIP participation rate is less than 10%.
Also, given that the total forest area of Ontario is 5.5 million hectares (Watkins, 2011), the
proportion of the woodlots in MFTIP is around 12% in terms of land area.

When examined by region, the northern region has the largest MFTIP participation area (199,327
hectares), whereas the southern region has only 20,630 hectares. In addition, the average area is
much larger in the northern region (46 ha) compared with southern (18 ha) and western (21 ha)
regions (Table 2). Especially in southern and western Ontario, Wellington (51%), Dufferin
(51%), and Grey (42%) show the highest MFTIP participation rate, while Lambton (3%),
Chatham-Kent (6%), Elgin (9%), Niagara (9%), and Bruce (10%) record the much lower
enrolment in terms of MFTIP eligible area (Figure 4, Appendix 3).

The MFTIP becomes more helpful to landowners by encouraging sustainable forest management
and prohibiting high-grading practices (Informant 1; Informant 23). As the MFTIP makes them
plan in the long run, figure out their objectives, and learn how to properly manage their woodlots,
it has played a significant role in educating participants (Informant 1). Initially landowners
contact forest consultants to get tax benefits by joining the MFTIP, and they gradually realize the
benefit of GFPs and continue sustainable management activities voluntarily (Informant 30). The
majority of landowners who want to stay in the program faithfully obey the MFTIP requirements
(Informant 14). This program is becoming increasingly popular in northern and central regions

 18
Figure 4. The MFTIP
 participation rate was
 calculated as the percentage
 of the MFTIP eligible areas
 for the total private forest
 areas derived from the
 SOLRIS (Southern Ontario
 Land Resource Information
 System) (MNRF, 2015).

with little farmland, and it plays important roles in preventing high-grading or DLC in some
counties where by-laws allow this type of harvesting (Informant 15; Informant 25). According to
the MNRF, around 61.7% of the MFTIP area (43% based on the number of properties) has an
intention to harvest for commercial use.

Notwithstanding its irresistible benefits, the MFTIP’s participation rate is still low, around 10%,
and it seems that there are a couple of reasons behind this. Firstly, the majority of farmers, the
single largest group of woodlot owners (Kant & Kant, 2009), do not need to enroll in the MFTIP
because woodlots are considered as a part of farmlands and they can have same tax benefit under
the Farm Property Class Tax Rate Program (Agricorp, 2019; Informant 3; Informant 14;
Informant 18; Informant 30). Secondly, many small woodlots below the minimum size (4
hectares) are unable to join (Informant 30). Thirdly, the amount of tax reduction is not
worthwhile to join the program in some counties where the tax rate is relatively low (Informant
30). Fourthly, there is a pervasive distrust of government along with “Back off, government”
trends in some regions (Informant 20; Informant 25). Last but not least, many landowners still do

 19
not know about the program (Informant 31). In order to encourage them to join the MFTIP, some
eastern counties provide them with a certain amount of grants that will cover the fees for the
preparation of a management plan (Informant 31).

 20
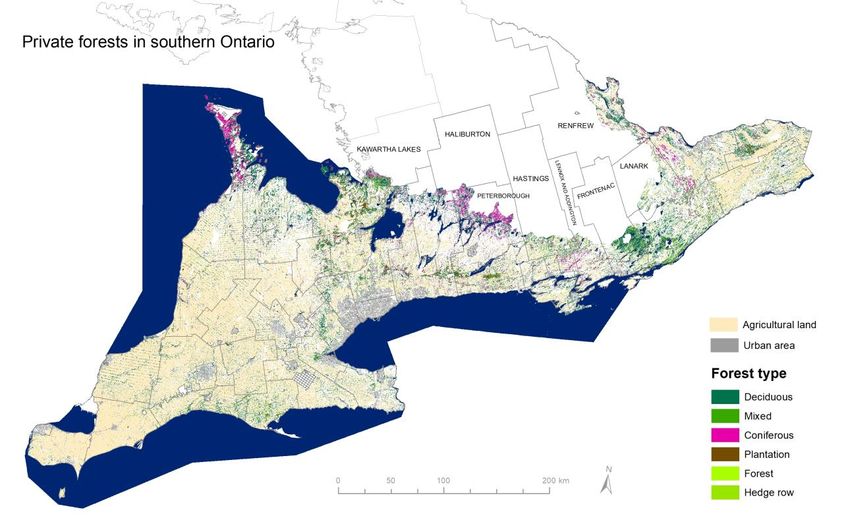
Geospatial analysis of private woodlots in southern Ontario
The second objective of this study is to geospatially investigate private forests in southern
Ontario more thoroughly. The Southern Ontario Land Resource Information System (SOLRIS)
Version 2.0 (MNRF, 2015) was analyzed to deeply understand the spatial distribution of private
forests in the Mixedwood Plains ecozone (Figure 5). It was produced by the Ministry of Natural
Resources and Forestry (MNRF) and reflects the land cover until 2011. In order to obtain the
private forested area, features with more than 60% of tree cover were included, and lands owned
by federal and provincial governments as well as Indian Reserve were removed from the
 4
SOLRIS forest layer (these georeferenced data were downloaded from “Scholars GeoPortal ”).
The coordinate system “NAD_1983_Ontario_MNR_Lambert” was used for the projection.

Figure 5. The geographical distribution of privately owned forests in southern Ontario (the Mixedwood
Plains ecozone). Only partial lands of some municipalities (names are indicated in the map) that locate at
the boundary of the ecozone are included. Green color represents deciduous forests, and red color shows
coniferous forests. Cultivated lands and urbanized areas are also described. (MNRF, 2015).

4
 http://geo2.scholarsportal.info/

 21
The SOLRIS contains 5 types of forest covers: Deciduous, Mixed, Coniferous, Plantation (linear
organizations with uniform tree type which is mostly coniferous species), and Other (unspecified
forests and hedge rows). Since the SOLRIS only provides land covers within the Mixedwood
Plains ecozone, some districts located at the boundary of the ecozone (Lanark, Renfrew,
Frontenac, Lennox and Addington, Hastings, Haliburton, Peterborough, Kawartha lakes, etc.)
were analyzed with only parts of their lands.

The analysis showed that southern Ontario forests (1.3 million ha) are consist of more than 90%
of private forests (1.2 million ha), which cover 15% of the southern Ontario land area. The most
abundant type of private forests in this area is deciduous forests (46%) followed by mixed (21%),
coniferous (18%), and plantation (7%). As looking at the regional distribution, Simcoe County
has the largest areas of private forests (110,848 ha) followed by the United Counties of Leeds
and Grenville (88,582 ha), Bruce County (85,974 ha), Grey County (76,511 ha), and
Peterborough County (71,942 ha) (Figure 6). Since these counties have larger land areas along

Figure 6. Areas and forest types of private woodlots in the Mixed Plains Ecozone by upper- and single-
tier municipalities. The percentage on the top represents the private forest cover. Single-tier
municipalities with less than 4,500 ha of private forests were excluded. Single-tier municipalities were
indicated by (S) beside names. Also, some districts included only parts of their lands are marked with *.

 22
with higher forest covers, their forested areas are exceptionally larger than others. Counties
which have the largest forest cover in each region are as follows: Norfolk (16%) in the south,
Simcoe (24%) in the west, Peterborough (33%) in the center, and Frontenac (40%) in the east.

Bruce County and Peterborough County show a distinctively higher proportion of coniferous
forests, 46% and 52% respectively. On the contrary, private woodlots of counties in southern
Ontario mostly consist of deciduous forests (Table 3): Lambton (90%), Elgin (89%), Middlesex
(81%), Niagara (74%), Oxford (74%), and Haldimand (71%) (Figure 6). Counties with less than
5% of forest cover - Essex (3%), Chatham-Kent (3%), and Perth (4%) - tend to have high
proportions of agricultural land: Essex (71%), Chatham-Kent (82%), and Perth (72%). Overall,
southern and western regions covered by larger cultivated lands have a tendency to show lower
levels of forest cover compared with central and eastern Ontario (Table 3). The forest cover of
central and eastern counties does not appear to be very high here since the SOLRIS did not fully
include their land cover information. But their actual forest areas are known to be much higher
than these figures when considering their total land covers: 90% in Haliburton County
(FitzGibbon & Summers, 2002), 65% in Hastings County (Redden, 2009), and 73% in Renfrew
County (Informant 20). Forest covers and agricultural land areas of each municipality are
organized in Appendix 4.

 < Forest type > Forest Agricultural Urban
Region
 Deciduous Mixed Coniferous Plantation Other total land area

Southern 130 (74%) 12 (7%) 2 (1%) 10 (6%) 22 (12%) 176 (8%) 1,252 (59%) 83 (4%)

Western 166 (43%) 81 (21%) 73 (19%) 40 (10%) 25 (7%) 386 (14%) 959 (36%) 102 (4%)

Central* 103 (37%) 53 (19%) 86 (31%) 14 (5%) 24 (9%) 280 (19%) 264 (14%) 96 (5%)

Eastern* 144 (43%) 104 (31%) 46 (13%) 17 (5%) 27 (8%) 338 (20%) 355 (21%) 44 (3%)

Total 543 (46%) 251 (21%) 207 (18%) 82 (7%) 97 (7%) 1,180 (15%) 2,830 (34%) 325 (4%)

Table 3. Land area (000ha) by categories and forest types in different regions in southern Ontario. The
percentage of forest types represents the proportion in the total forest area, while other percent figures
(forest total, agricultural land and urban area) describe land covers over the total land area. * Since some
municipalities in central and eastern regions were partially included, actual values are likely to be bigger
than presented figures.

 23
Economic valuation of private woodlots in southern Ontario
The third objective is to investigate the economic value of private forests in southern Ontario.
However, there were few available harvest data and no specific experiments related to private
forests in Ontario. Therefore, this study conducted the economic valuation based on the expert’s
empirical information and county/regional forest data along with some available timber sales
records. A total of 35 experts (including forest consultants, forest conservation officers, county
or regional foresters, conservation authority foresters, loggers, and sawmills) (Appendix 1) who
have many years of experience in private woodlot management were interviewed via face-to-face
meeting, telephone conversation and email communication. In addition to the interviews, timber
volume yields and revenue data from some county/regional or conservation authority forests
were gathered. Since these forests are located near private woodlots in each region, it would be
reasonable to assume that they have similar characteristics.

According to the geospatial analysis in the previous section (Figure 5, Table 3), deciduous
forests account for 46% of private forests in southern Ontario. Plantations comprise only 7% of
forest cover, but their financial returns are relatively high and the proper management has a
significant effect on their value. Therefore, the economic valuation concentrated on these two
types of private forests.

Deciduous forests
The observed study area, the Mixedwood Plains ecozone, covers the Great Lakes-St. Lawrence
forest and the Carolinian forest region. The Great Lakes–St. Lawrence region is a transitional
forest between coniferous (Boreal forest) and broad-leaved (Carolinian forest) regions,
containing both types of forests as well as mixed forests. The southernmost Carolinian forest
region is predominantly covered by deciduous forests (MNRF, 2019-a). On the whole, the
deciduous forest coverage (46%) ranks the top among four forest types in the Mixedwood Plains
ecozone. The western region covers the largest area of deciduous forests (166,076 ha) followed
by eastern (143,898 ha), southern (129,641 ha), and central (103,485 ha) regions (Table 3). The
municipalities that have deciduous forests larger than 20,000 hectares are as follows: Grey
(42,697 ha), Leeds and Grenville (37,616 ha), Simcoe (36,949 ha), Bruce (29,859 ha),
Peterborough (27,286 ha), Elgin (22,879 ha), and Lambton (21,697 ha).

 24
According to Elliott (1998), the current forest species composition is similar to the pre-European
settlement forest, but its proportion has changed with the times. Since early European settlers
cleared vast areas of land, the forest regeneration in the late 1800s and early 1900s would have
included mostly shade intolerant or mid-tolerant species such as oak, ash, cherry, hickory,
basswood, and many of the Carolinian species. Canopy closure and generally more passive
harvesting have reduced the proportion of these species and increased the presence of shade
tolerant species – sugar maple, beech, hemlock and, red maple. Meanwhile, southern Ontario
forests have experienced various kinds of diseases. Dutch elm disease (DED), introduced to
Ontario in 1967, killed the majority of elm trees but aroused people’s attention to the drawbacks
of monoculture plantings (Hubbes, 1999). However, another non-native invasive insect, the
emerald ash borer (EAB) has been widely spread throughout southern Ontario from 2002, and
hence most of the ash trees, which account for a high portion of private forests, are currently in
grave peril (Tasneem et al. 2019).

Many deciduous types of private woodlots consist of a variety of species, and sometimes tree
marking includes more than 20 different species (Informant 17). Nevertheless, many forest
professionals (Informant 1; Informant 4; etc.) confirmed that throughout the whole southern
Ontario area, by far the most dominant species is hard maple. In southern and western regions,
ash, soft maple, beech, oak, basswood, black cherry are also commonly found (Informant 1;
Informant 17; Informant 19). On the other hand, many parts of woodlots in central and eastern
regions are covered by early successional species such as poplar, birch, etc. other than hard
maple and red maple (Informant 14; Informant 20; Informant 23; Informant 29; Informant 31;
Informant 32). ESTR Secretariat (2016) argued that 90% of forests in the Mixedwood Plains
ecozone were converted from abandoned farmlands or cleared stands, and therefore they are
almost even-aged and generally young (less than 70 years old).

Unfortunately, a decent number of private woodlots are now severely suffering from EAB
(Emerald Ash Borer). Due to its aggressive proliferation, many forest consultants and loggers
have focused on salvage harvesting to remove ash trees during the last decade (Informant 1;
Informant 3; Informant 4; Informant 14; Informant 17; Informant 18; Informant 26; Informant 30;

 25
5
Informant 32). Analysis of timber harvesting data , provided by Informant 17, showed that ash
timber accounts for around 43% of the total volume yield which is much higher than other
species such as hard maple (18%), soft maple (15%), oak (6%) and beech (6%).

The hardwoods growing in southern Ontario produce some of the most valuable timber in
Canada (Nautiyal et al. 1995). Species such as sugar maple, black cherry, white ash, and red oak
particularly produce high-quality sawlogs and veneer logs when the timber has excellent quality
and large size (Nautiyal et al. 1995). A price list of some species can be found in Appendix 5.
However, it is hard to obtain these kinds of top-quality logs, so they account for only less than 1
percent of the hardwood sawlogs inventory in the northeastern United States (Wiedenbeck et al.
2003). Informant 26 mentioned that less than 5% of harvests are normally categorized as veneer
quality timber. Due to their scarcity and superior quality, the price of veneer logs is generally 1.5
to 6 times higher than that of grade 1 sawlogs (Wiedenbeck et al. 2003). For instance, the
stumpage price of hard maple sawlogs ranged around $500-800/mfbm, whereas that of veneer
quality increases to at least $1,500/mfbm (Informant 1). Small tree or damaged, diseased, or
crooked timber is normally classified as firewood, which has the lowest value ($25/cord =
$10/m3) (Informant 1; Informant 6; Informant 26).

To calculate the economic value of private forests in southern Ontario, several figures were
investigated through interviews (Figure 7). First, the estimated harvest ratios (how many
woodlots are doing regular harvesting operations) in each region were asked in order to derive
the harvest area. Then areas of woodlots under GFPs and those received DLC were obtained
based on the proportions of harvest permits and some informants’ estimation in each region.
Third, revenues and yields information about GFPs were collected from interviewees, timber sale
records, and county or conservation authority forest data. With gathered data, the present value
of forests managed by GFPs was calculated by utilizing the concept of the land expectation value
(LEV). Lastly, relative revenues from DLC were inferred from the computer simulation research
conducted by Nyland (2005), due to the absence of actual data. For the valuation, a couple of
assumptions were made: (1) woodlots without harvesting intentions have no economic value; (2)

5
 Total of 102 properties; total harvest volume of around 18,000m3; between 2016 and 2018.

 26
there are only two types of harvesting, GFPs and DLC; and (3) woodlots under a certain harvest
regime produce constant and regular revenues perpetually.

 Figure 7. The process of deciduous forest value calculation.

(1) Harvest ratio

 Southern, Western Central Eastern Northern
50% (Informant 26) 10-20% (Informant 14) 5% (Informant 31) 30% (Informant 15)
66% (Schwan & Elliott, 2010) 60% (Informant 23) 20% (Informant 32) 30-40% (Informant 16)
70% (Informant 17) 80% (Informant 30) 33% (Informant 28) 30% (Informant 25)
80% (Informant 27)
80-90% (Informant 9)

 70% 52% 19% 32%

Table 4. The estimated proportion of private woodlots doing regular harvesting operations in each region.

The majority of interviewees mentioned that they can only guess the harvest ratio based on their
limited experience as they do not aware of the overall status of private woodlots. The harvest rate
of southern and western Ontario (averagely around 70%) was assumed to be relatively high
compared with other regions. In this region, farmers have been traditionally interested in selling
timber (Informant 3; Informant 18; Schwan & Elliott, 2010) and there are many local mills that

 27
have high demands for timber (Informant 27). In the central region, low-value timber (polar,
birch or balsam fir) and negative impressions of logging have made landowners hesitate to
harvest, so the average harvest rate is around 52% (Informant 14; Informant 23). On the other
hand, the harvest intention in eastern regions is the lowest, around 19%. It is presumed that many
private woodlots are poorly managed and very few landowners show interest in harvesting
(Informant 20; Informant 31; Informant 32). In addition, harvesting operations in northern
regions are not really active due to slow tree growth, consequent long cutting cycle, and past
heavy cut (Informant 15; Informant 16).

There are several reasons why some landowners do not harvest their woodlots. First, many of
them pursue recreational or ecological values other than economic profits (Informant 15;
Informant 18; Informant 19; Informant 25; Informant 31). This tendency is more pronounced
among landowners under the MFTIP or those with urban backgrounds (Informant 3; Informant
16; Informant 26). Second, some people have a negative impression of logging due to bad
practices in the past (Informant 17). Third, it would not be economically beneficial for some
woodlots to harvest because of low-value materials (Informant 14; Informant 15; Informant 25;
Informant 31), poor growing stocks resulted from past heavy cut (Informant 18; Informant 31),
small-sized woodlots (Informant 15; Informant 16) and inaccessible location (Informant 14;
Informant 15; Informant 16). Fourth, the low market price can suppress the harvest intention as
the price variability of hardwood lumber is quite high (Informant 15). Fifth, some landowners,
particularly those from urban areas, do not know what to do with their woodlots, leaving them
unmanaged (informant 20; Informant 32).

The most recommended harvesting regime for deciduous forests is single-tree selection (STS),
along with group selection or shelterwood systems depending on site conditions and landowners’
objectives (MNRF, 2000; Schwan & Elliott, 2010). The single-tree selection which resembles
natural disturbances can produce high-quality timber of shade-tolerant species including hard
maple (MNRF, 2000). Therefore, this silviculture is regarded as one of the GFPs in southern
Ontario. The majority of interviewees confirmed that the most commonly practiced harvesting
method is single-tree selection. It usually removes one-third of standing timber and reduces basal
areas to around 20m2 (Informant 1; Informant 17; Informant 23). In order to promote more
shade-intolerant species, the group selection system has been used in southern regions
(Informant 17), and uniform shelterwood has been applied in the northern region (Informant 15).

 28
(2) The proportion of DLC versus GFPs

 Southern Western Central Eastern Northern
50:50 (Norfolk) 75:25 (Bruce) 60:40 (Northumberland) 10:90 (Informant 2, 70:30 (Informant 15)
99:1 (Lambton) 55:45 (Grey) 10:90 (with by-laws, Informant 20) 50:50 (Informant 16)
59:41 (Haldimand) 53:47 (Simcoe) Informant 14) 80:20 (Informant 31)
 50:50 (Huron) 60:40 (without by-laws, 90 (Clearcut):10 (STS)
 Informant 14) (Informant 32)
 92:8 (Perth)
 50:50 (Informant 17)

 70:30 63:37 43:57 60:40 60:40

Table 5. The proportion of diameter-limit cutting (DLC) versus good forestry practices (GFPs) in each
region. The figure with the county name was referred from Table 1.

While almost the whole traditional harvesting was either DLC or high-grading, these practices
are not as common as they used to be (Informant 15; Informant 17; Informant 23). Currently,
GFPs are more encouraged by virtue of the MFTIP and other educational opportunities via many
organizations (Informant 15; Informant 16; Informant 23; Informant 30). However, as Table 5
shows, DLC is still more popular than GFPs in Ontario private woodlots (on average, DLC 66%
and GFPs 34%). The proportion of DLC is much higher in southern and western regions where
harvesting intentions are high (Table 4). In addition, interviewees expected that the ratio of DLC
would be much higher in counties without forest conservation by-laws (Informant 14; Informant
17). Furthermore, clearcutting for land conversion to farmlands was said to be still quite common
in eastern areas since most of them do not have by-laws (Informant 20; Informant 32).

It is assumed that there are various reasons for this trend. Many landowners believe that DLC is
proper and good forest management because it is stated in the by-law (Informant 1; Informant 6).
Moreover, this practice could be quite attractive to woodlot owners due to its short-term high
yields and financial profits (Nyland, 2005; Bohn et al. 2011; Informant 1; Informant 25;
Informant 26). In the southern and western regions, some loggers frequently incite landowners to
cut, which is normally DLC or high-grading (Informant 1; Informant 18). Ownership change can
also encourage this trend since landowners tend to make the maximum profit by removing all
valuable trees from their woodlots before selling their properties (Elliott, 1998; Informant 1;
Informant 3; Informant 5; Informant 6; Informant 14). Some farmers who mistrust governments
do not want to work with forest consultants since they think these consultants still belong to the

 29
6
government (Informant 18). Also, the high market price can encourage more DLC practices due
to sharp fluctuation and unpredictability of hardwood price levels (Informant 15). In the eastern
region, private woodlot owners in Renfrew county are regarded as fairly responsible and
knowledgeable to sustainably manage their forests through generations (Informant 2; Informant
20), whereas many other woodlots are presumed to have ill management (Informant 28;
Informant 31; Informant 32). The reasons are: (1) lack of forest consultants (Informant 20;
Informant 31); (2) lack of sawmills (Informant 31); (3) low-value timber which makes it difficult
to pay consulting fees (Informant 31); and (4) lack of understanding on sustainable forest
management (Informant 25; Informant 28).

(3) Revenues and volume yields of GFPs

Revenues and timber yield data of GFPs were obtained through various sources including forest
consultants, actual timber sales data (Informant 17), and county or conservation authority (CA)
forests. On average, the cutting cycle is 12-15 years (Informant 17; Informant 18; Schwan &
Elliott, 2010) in southern and western regions, 15 years in central regions (Informant 30), 20
years in eastern regions (SNC, 2018), and 25-30 years in northern regions (Informant 15;
Informant 25). In terms of timber volume yields, overall 35-45 m3/ha (around 3000-4000 fbm/ac)
is produced, generally consisting of 50% of sawlogs and 50% of firewood (Informant 15;
Informant 17; Informant 25).

 Southern, Western Central Eastern Northern
 $2293/ha (Informant 17) $1466/ha $375/ha (Informant 29) $412/ha (Informant 25)
 + $2413/ha (Simcoe, 2017) (Informant 33) $263/ha (SNC, 2018) $680/ha (Informant 15)
 + $6310/ha (Informant 34)
 + $591/ha (Halton, 2015)

 $2574/ha $1466/ha $319/ha $546/ha

Table 6. The estimated revenues of deciduous forests in each region.

6
 In the past, there were free forestry services operated by the MNRF (Ministry of Natural Resources and Forestry)
for private woodlots including woodlot assessment, tree marking, and timber sales assistance, but it was
discontinued in 1994 (Schwan & Elliott, 2010). Most of the forest professionals who left the MNRF started their
own forest consulting business (Informant 17).

 30
You can also read