Venture Pulse Q1 2020 - Global analysis of venture funding - assets.kpmg
←
→
Page content transcription
If your browser does not render page correctly, please read the page content below

Venture
            Pulse
            Q1 2020
              Global analysis of
              venture funding

             21 April, 2020
© 2020 KPMG International Cooperative (“KPMG International”). KPMG International provides no client
services and is a Swiss entity with which the independent member firms of the KPMG network are affiliated.   #Q1VC   1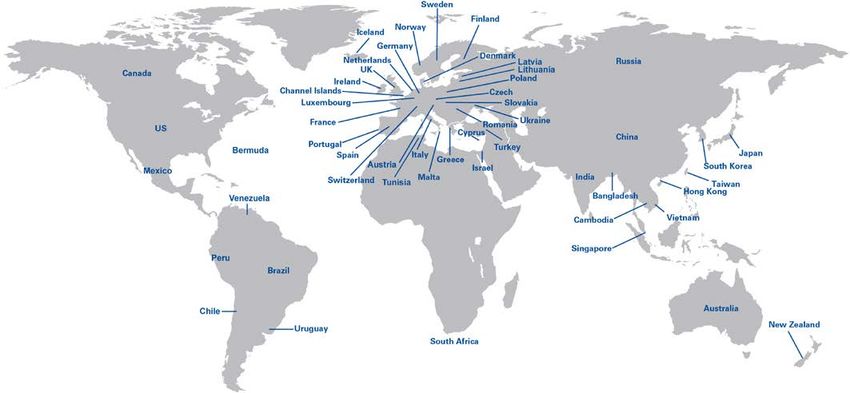
Welcome
message
In a departure from our normal format we wanted to let you all
know that you are in our thoughts as we all work through what
                                                                                                                        You know KPMG, you might not
                                                                                                                        know KPMG Private Enterprise.
is likely the biggest global test that we will likely deal with in our
                                                                                                                        KPMG Private Enterprise advisers in
lifetimes.                                                                                                              member firms around the world are
                                                                                                                        dedicated to working with businesses
Venture Capital investment trends are obviously irrelevant in                                                           like yours. Whether you’re an
comparison to what is currently facing us, but supporting and                                                           entrepreneur looking to get started,
showcasing this community remains critical to those of us                                                               an innovative, fast growing company,
                                                                                                                        or an established company looking to
leading KPMG Private Enterprise.
                                                                                                                        an exit, KPMG Private Enterprise
                                                                                                                        advisers understand what is important
We have no doubt that the human spirit will triumph over this                                                           to you and can help you navigate your
adversity and we have seen this evidenced in the tremendous                                                             challenges, no matter the size or
accomplishments of our employees and of our clients over the                                                            stage of your business. You gain
last several weeks. It has been inspirational to see, and we are                                                        access to KPMG’s global resources
                                                                                                                        through a single point of contact, a
sure to see more over the next few weeks and months.
                                                                                                                        trusted adviser to your company. It is
                                                                                                                        a local touch with a global reach.
Remember we are here to provide assistance to you in any
way we can — even if it is a simple conversation around how
you are doing.

Q1’20 was unlike any quarter on record. The emergence of the
novel coronavirus COVID-19 shattered original expectations for
the year, putting previous trends and concerns, such as Brexit
and the US-China trade tensions, on the backburner. The
spread of the virus, deemed a pandemic by the World Health
Organization on March 11th created turmoil in nations,
economies, and public markets around the world.

Despite the impact of COVID-19, VC investment globally
remained quite robust in Q1’20, primarily due to the strong
pipeline of deals in many jurisdictions around the world. In
particular, VC investment in the US remained strong, led by a
$2.25 billion raise by Waymo, a $1 billion raise by Generate
Capital, and a $750 million raise by Quibi. VC investment was
also strong in Europe, led by a $500 million raise by Revolut
and a $240 million raise by Lilium.

Throughout this document, “we”, “KPMG”, “KPMG Private Enterprise”, “us” and “our” refer to
the network of independent member firms operating under the KPMG name and affiliated
with KPMG International or to one or more of these firms or to KPMG International. KPMG
International provides no client services. No member firm has any authority to obligate or
bind KPMG International or any other member firm vis-à-vis third parties, nor does KPMG
International have any such authority to obligate or bind any member firm.

Unless otherwise noted, all currencies reflected throughout this document are US Dollar.

© 2020
© 2020 KPMG
        KPMG International
                 International Cooperative
                               Cooperative (“KPMG
                                             (“KPMG International”).
                                                       International”). KPMG
                                                                        KPMG International
                                                                               International provides
                                                                                             provides no
                                                                                                      no client
                                                                                                          client
services
services and
         and is
              is aa Swiss
                    Swiss entity
                          entity with
                                 with which
                                      which the
                                             the independent
                                                  independent member
                                                                member firms
                                                                         firms of
                                                                               of the
                                                                                   the KPMG
                                                                                       KPMG network
                                                                                              network are
                                                                                                      are affiliated.
                                                                                                          affiliated.                   #Q1VC               2
Asia, meanwhile, saw VC investment drop significantly, driven
by a slowdown in deals activity in China, where the fight
against COVID-19 began much earlier than in other
jurisdictions. Despite a sharp decline in the number of deals,
Asia saw a number of megarounds during Q1’20, including $3
billion raises by Gojek and Kuaishou, and a $1 billion raise by
Yuanfudao.

With unprecedented shutdowns around the world, Q2’20 is
expected to be a rough quarter for VC investment in every
jurisdiction. While there continues to be an enormous amount
of dry powder in the global VC

market, many investors will likely sit on the fence until the
ramifications of the pandemic become clearer. VC deals that
do occur will likely involve follow-on funding to companies
within the existing portfolios of VC investors or companies that
have a clear value proposition given the current situation.

In this quarter’s edition of Venture Pulse, we look at these and
a number of other global and regional trends, including:

— The implications of COVID-19 on each of the key
  jurisdictions
— The rise in demand for digital business models                                                                        Jonathan Lavender
— The rise in benevolent investments in companies focused                                                               Head of KPMG Private Enterprise,
  on addressing COVID-19 challenges                                                                                     KPMG International
— The long-term ramifications of the pandemic on potential
                                                                                                                        Conor Moore
  investment trends.                                                                                                    Co-Leader,
                                                                                                                        KPMG Private Enterprise Emerging
We hope you find this edition of Venture Pulse insightful. If you                                                       Giants Network,
would like to discuss any of the results in more detail, please                                                         KPMG International and Partner,
contact a KPMG Private Enterprise adviser in your area.                                                                 KPMG in the US

                                                                                                                        Kevin Smith
                                                                                                                        Co-Leader,
                                                                                                                        KPMG Private Enterprise Emerging
                                                                                                                        Giants Network,
                                                                                                                        KPMG International and EMA Head
Throughout this document, “we”, “KPMG”, “KPMG Private Enterprise”, “us” and “our” refer to
the network of independent member firms operating under the KPMG name and affiliated                                    of KPMG Private Enterprise
with KPMG International or to one or more of these firms or to KPMG International. KPMG
International provides no client services. No member firm has any authority to obligate or
bind KPMG International or any other member firm vis-à-vis third parties, nor does KPMG
International have any such authority to obligate or bind any member firm.

Unless otherwise noted, all currencies reflected throughout this document are US Dollar.

© 2020
© 2020 KPMG
        KPMG International
                 International Cooperative
                               Cooperative (“KPMG
                                             (“KPMG International”).
                                                       International”). KPMG
                                                                        KPMG International
                                                                               International provides
                                                                                             provides no
                                                                                                      no client
                                                                                                          client
services
services and
         and is
              is aa Swiss
                    Swiss entity
                          entity with
                                 with which
                                      which the
                                             the independent
                                                  independent member
                                                                member firms
                                                                         firms of
                                                                               of the
                                                                                   the KPMG
                                                                                       KPMG network
                                                                                              network are
                                                                                                      are affiliated.
                                                                                                          affiliated.                  #Q1VC               3
Global              US          Americas   Europe   Asia

Globally, in Q1‘20
VC-backed
companies raised

$61.0B
across

4,260 deals

© 2020 KPMG International Cooperative (“KPMG International”). KPMG International provides no client
services and is a Swiss entity with which the independent member firms of the KPMG network are affiliated.

Global               US   Americas   Europe   Asia

Global VC investment holds, almost steady
despite impact of COVID-19
                    To economies, public markets, and VC markets around the world, the novel coronavirus COVID-19 was a
                    black swan event. Its rise in Q1’20 was unexpected and sudden, its impact massive and widespread. Every
                    major region of the world is now working to stop its spread and to mitigate the resulting economic fallout.

                    While the impact on the VC market was somewhat muffled in Q1’20 due to a strong pipeline of deals in
                    most jurisdictions, the outlook for Q2’20 is much less promising.

                    Calm before the storm — a solid start to 2020
                    Despite some global political and economic uncertainty, including the UK’s official exit from the
                    European Union and the ongoing US-China trade war, 2020 started off on a mostly positive note. VC
                    investment in both the Americas and Europe got off to strong starts. In the US, autonomous mobility
                    company Waymo raised $2.25 billion, while cleantech infrastructure investor Generate Capital raised
                    $1 billion. In Europe, UK-based Revolut led fundraising with a $500 million round, while Germany’s
                    Lilium raised $240 million.

                    VC investment in Asia, however, fell significantly, despite $3 billion raises by both Indonesia-based
                    Gojek and China-based Kuaishou, and a $1 billion raise by China-based edtech, Yuanfudao on the last
                    day of the quarter. Deals activity dropped very sharply in Asia, driven primarily by a slowdown in China,
                    the first to be affected by COVID-19.

                    Fintech remained a very hot area of investment globally during Q1’20. Digital banks in several
                    jurisdictions raised strong funding rounds, including US-based Chime ($500 million), UK-based Revolut
                    ($500 million), Sweden-based Klarna ($200 million), and Australia-based Xinja ($160 million).

                    Responding to a global pandemic, corporates focusing on core business
                    In February, COVID-19 began to make significant waves around the world, shattering expectations and
                    creating turmoil in the public markets. In the wake of being called a pandemic by the World Health
                    Organization in early March, numerous jurisdictions around the world took unprecedented action to slow
                    the spread of the virus. International travel was limited or banned. Schools were closed and moved
                    online. Bricks-and-mortar businesses and corporate offices not considered essential businesses were
                    closed. People were told to stay home.

                    Businesses around the world are currently working to cope with the ramifications of COVID-19. With
                    the exception of strategic investments for example, to enhance digital connectivity and coworking,
                    corporate VC investment will likely be minimal in the short-term as companies focus on ensuring the
                    sustainability of their core business.

                    Already cautious investors becoming more so
                    Following WeWork’s failed IPO in 2019, VC investors appeared to be growing far more cautious with
                    their investments. They increased their focus on profitability, particularly with respect to companies
                    within their portfolios that were mulling the decision to IPO. They also focused less on seed and Series
                    A companies, preferring safer bets and companies with sustainable cash flows.

© 2020 KPMG International Cooperative (“KPMG International”). KPMG International provides no client
services and is a Swiss entity with which the independent member firms of the KPMG network are affiliated.                      #Q1VC        5
Global               US   Americas   Europe   Asia

Global VC investment holds, almost steady
despite impact of COVID-19, cont’d.
                    With the sudden uncertainty created by COVID-19, VC investors are only expected to become even
                    more risk averse. Many investors will likely sit on the fence until they better understand the impact of the
                    virus. VC investors will likely need to take time to re-evaluate their portfolios given the current situation.
                    With COVID-19 basically slamming the IPO market door shut at least for the short-term, some
                    companies might require bridge funding to get through the market turbulence. Companies in the US
                    could be particularly at risk given the upcoming presidential election. Should the pandemic not be
                    resolved in Q2’20, any potential IPO exits could be pushed into 2021.

                    Restrictions hindering cross-border VC deal activity
                    Given travel and movement restrictions, cross-border VC investment will be very challenging heading
                    into Q2’20. The inability to conduct in-person due diligence and face-to-face meetings will likely curtail a
                    significant amount of cross-border activity, with some VC investors choosing to stick closer to home.
                    Even when deals do get completed, transaction times will likely be much longer due to the need to
                    create new processes to support alternative due diligence approaches.

                    Growing number of benevolent investments
                    While COVID-19 is creating many challenges for the VC market globally, it has also driven an upswell in
                    benevolent and philanthropical investing as investors look to support companies looking for a vaccine or
                    that have innovative ways of dealing with COVID-19. In the UK, for example, the Coalition for Epidemic
                    Preparedness Innovations has invested $23.7 billion in companies that are working to develop a
                    vaccine. Companies it has supported include Novavax (working with Oxford University), Moderna, and
                    Inovio Pharmaceuticals1. Meanwhile, the Bill and Melinda Gates Foundation, working with Wellcome
                    and Mastercard committed up to $125 million to accelerate the response to COVID-192.

                    Governments are also making significant investments focused on addressing the impacts of COVID-19.
                    In March, German-based CureVac received $89 million from the European Commission so that it could
                    scale its production of its potential COVID-19 vaccine3, while the Canadian Government invested
                    $27 million to support a number of projects focused on developing, testing, and implementing measures
                    to respond to the novel coronavirus4.

                    Digital solutions making a game-changing leap forward
                    Numerous jurisdictions around the world have effectively shut down major segments of their economies,
                    closed schools, and restricted the movement of people. With restrictions closing countless business offices,
                    organizations are turning to digital solutions as a means to keep their people connected, connect with their
                    clients and customers, and keep their operations moving forward. Companies and sectors that have lagged
                    on the innovation front are now recognizing and working to bridge major gaps in their capabilities.

                    This crisis-driven action and forced innovation will have resonating impacts long after COVID-19 finally
                    abates. Companies will have realized the value of digital on an almost unheard-of scale. Consumers will
                    have seen the value of e-commerce, edtech, digital entertainment and gaming, digital learning, and all
                    manner of other digital services. This shift could forever accelerate retail and many other industries
                    further along the digital continuum. Those who do not move may very well not survive.

                    1https://canoe.com/health/cepi-ups-COVID-19-vaccine-funding-to-us23-7m
                    2https://www.gatesfoundation.org/Media-Center/Press-Releases/2020/03/COVID-19-Therapeutics-Accelerator
                    3https://www.labiotech.eu/medical/curevac-coronavirus-rna-covid/
                    4https://www.canada.ca/en/institutes-health-research/news/2020/03/government-of-canada-invests-27m-in-

                    coronavirus-research.html

© 2020 KPMG International Cooperative (“KPMG International”). KPMG International provides no client
services and is a Swiss entity with which the independent member firms of the KPMG network are affiliated.                      #Q1VC        6
Global               US   Americas   Europe   Asia

Global VC investment holds, almost steady
despite impact of COVID-19, cont’d.
                    Dry powder could be a significant force
                    Globally, VC investors are sitting on a significant amount of dry powder, one Pitchbook estimate
                    suggesting approximately $189 billion5. While VC investors may hold back for some time, they don’t
                    have the luxury of sitting on it for the long term as it could impact their timelines and the returns on their
                    ongoing funds. A lot of money is waiting to be deployed and invested. When the uncertainty around
                    COVID-19 begins to decrease, VC investors will be looking for ways to deploy these funds.

                    Trends to watch for globally
                    While traditional VC investment is expected to slow significantly over the next quarter, there are several
                    niche segments of the market that could remain attractive to investors due to their applicability in the
                    current environment. Health and biotech, for example, including companies focused on digital health,
                    pharmaceuticals and life sciences, AI modeling to predict the spread of diseases, medtech and other
                    related areas. Companies focused on productivity solutions, logistics and delivery, edtech, and online
                    entertainment could also see some investment, along with cyber security and data protection companies
                    given the significant increase in online services.

                    Heading into Q2’20, valuations are expected to fall as companies struggle to attract funding given the
                    significant levels of uncertainty, specifically around the impact of the uncertainty on sales forecasts.
                    There could also be an increase in distressed investments in some jurisdictions as companies begin to
                    run out of cash.

                    5   https://pitchbook.com/news/articles/gloom-over-a-new-recession-shifts-the-vc-narrative-for-2020

© 2020 KPMG International Cooperative (“KPMG International”). KPMG International provides no client
services and is a Swiss entity with which the independent member firms of the KPMG network are affiliated.                      #Q1VC        7
Global US Americas Europe Asia
The calm before the storm
Global venture financing
2012–Q1'20
$100 8,000
$90
7,000
$80
6,000
$70
5,000
$60
$50 4,000
$40
3,000
$30
2,000
$20
1,000
$10
$0 0
Q1Q2Q3Q4Q1Q2Q3Q4Q1Q2Q3Q4Q1Q2Q3Q4Q1Q2Q3Q4Q1Q2Q3Q4Q1Q2Q3Q4Q1Q2Q3Q4Q1
2012 2013 2014 2015 2016 2017 2018 2019 2020
Deal value ($B) Deal count Angel/Seed Early VC Later VC
Source: Venture Pulse, Q1’20. Global Analysis of Venture Funding, KPMG Private Enterprise. Data provided by PitchBook, 4/21/20. Note: Refer to
the Methodology section on page 99 to understand any possible data discrepancies between this edition and previous editions of Venture Pulse.
On the surface, the robust tally of VC invested belying the steep downturn in volume would seem to bode well for
2020, extending the remarkably strong nine-quarter stretch of venture activity. However, as the steep downturn
suggests, steeper than any data lags could explain, the COVID-19 pandemic began to truly take a toll on investor
sentiment and private markets in the closing weeks of March. By next quarter, looking back, Q1 2020 is likely to
register as the calm before the storm.
“While COVID-19 is creating a significant amount of challenges globally, it is also showcasing the
power of ingenuity and innovation. While VC activity is slowing down, we are seeing a strong
increase in philanthropic investment in all regions of world as investors, corporates, governments
and not-for-profits work to support innovative companies working on potential vaccines and
treatments — or to help better understand and stop the spread of the virus.”
Jonathan Lavender
Global Head, KPMG Private Enterprise
KPMG International
© 2020 KPMG International Cooperative (“KPMG International”). KPMG International provides no client
services and is a Swiss entity with which the independent member firms of the KPMG network are affiliated. #Q1VC 8Global US Americas Europe Asia
Late stage evens out
Global median deal size ($M) by stage
2012–2020*
$10.0 $10.0 $10.0
$7.8 $7.9
$7.2 $7.1
$5.8 $5.6
$5.1
$4.4
$4.0
$3.4
$2.7 $3.0 $3.0
$2.1 $2.2
$0.8 $0.9 $1.0 $1.1
$0.5 $0.5 $0.5 $0.6 $0.7
2012 2013 2014 2015 2016 2017 2018 2019 2020*
Angel/seed Early stage VC Later stage VC
Global up, flat or down rounds
2012–2020*
100%
90%
Up
80%
70%
60%
50%
Flat
40%
30%
20%
10% Down
0%
2012 2013 2014 2015 2016 2017 2018 2019 2020*
Source: Venture Pulse, Q1’20, Global Analysis of Venture Funding, KPMG Private Enterprise. *As of 3/31/20. Data provided by PitchBook, 4/21/20.
© 2020 KPMG International Cooperative (“KPMG International”). KPMG International provides no client
services and is a Swiss entity with which the independent member firms of the KPMG network are affiliated. #Q1VC 9Global US Americas Europe Asia
New highs by a slight margin
Global median deal size ($M) by series
2012–2020*
$20.0
$17.6
$15.8
$14.2
$12.0 $12.0
$10.0
$8.0
$7.0 $7.0 $7.0 $7.1
$5.0 $5.5
$3.5 $4.1
$2.7 $3.0
$1.4 $1.6 $2.0
$0.8 $1.0 $1.2
$0.5 $0.5 $0.5
2012 2013 2014 2015 2016 2017 2018 2019 2020*
Seed Series A Series B
$60.0
$57.5
$50.0
$36.8
$34.8
$32.0
$29.0 $30.0
$27.0
$25.2
$22.8 $22.3
$18.5
$16.1 $16.0 $15.0
$11.4 $12.0
2012 2013 2014 2015 2016 2017 2018 2019 2020*
Series C Series D+
Source: Venture Pulse, Q1’20, Global Analysis of Venture Funding, KPMG Private Enterprise. *As of 3/31/20. Data provided by PitchBook, 4/21/20.
One thing that hasn’t changed for the global venture ecosystem — there is still plenty of dry powder waiting to be
dispersed from venture fund coffers. Q1 2020 tallies speak to that reality. However, with the COVID-19 pandemic
truly coming into global effect at the end of March, it will be intriguing to see how deal sizes, of the deals that still
manage to close, change. Anecdotally, financing terms are already shifting to be moderately less founder-friendly.
© 2020 KPMG International Cooperative (“KPMG International”). KPMG International provides no client
services and is a Swiss entity with which the independent member firms of the KPMG network are affiliated. #Q1VC 10Global US Americas Europe Asia
Late-stage valuations slide in telling sign
Global median pre-money valuation ($M) by series
2012–2020*
$73.0
$67.0
$55.0
$40.0
$37.0 $36.0
$30.0
$24.3
$21.0 $22.0
$19.0 $20.1
$13.8 $15.0
$10.3 $12.1
$7.7 $8.3 $6.9 $6.7
$4.5 $4.6 $5.0 $6.0
$3.4 $3.5 $3.8
2012 2013 2014 2015 2016 2017 2018 2019 2020*
Seed Series A Series B
$425.0
$390.0
$325.4
$224.5
$200.0
$169.6
$143.9 $150.0 $149.5
$115.0
$92.1 $98.3 $90.0
$75.0 $83.4
$47.4 $54.0 $55.2
2012 2013 2014 2015 2016 2017 2018 2019 2020*
Series C Series D+
Source: Venture Pulse, Q1’20, Global Analysis of Venture Funding, KPMG Private Enterprise. *As of 3/31/20. Data provided by PitchBook, 4/21/20.
© 2020 KPMG International Cooperative (“KPMG International”). KPMG International provides no client
services and is a Swiss entity with which the independent member firms of the KPMG network are affiliated. #Q1VC 11Global US Americas Europe Asia
Late stage bolsters fading Q1
Global deal share by series Global deal share by series
2012–2020*, number of closed deals 2012–2020*, VC invested ($B)
18,000 $250
16,000
$200
14,000
12,000
$150
10,000
8,000
$100
6,000
4,000
$50
2,000
0 $0
2012 2014 2016 2018 2020* 2012 2014 2016 2018 2020*
Series D+ Series C Series B Series A Angel/seed Series D+ Series C Series B Series A Angel/seed
Source: Venture Pulse, Q1’20, Global Analysis of Venture Funding, KPMG Private Enterprise. *As of 3/31/20. Data provided by PitchBook, 4/21/20.
In the last edition of Venture Pulse, we stated that 2019 could mark a high tide in terms of how much money is still
concentrated in the existing and brand-new unicorn population. The impact of the COVID-19 pandemic was not
anticipated at all at that point, but given its potential ripple effects, that could rebalance proportions accordingly to
some degree.
© 2020 KPMG International Cooperative (“KPMG International”). KPMG International provides no client
services and is a Swiss entity with which the independent member firms of the KPMG network are affiliated. #Q1VC 12Global US Americas Europe Asia
Pharma & biotech remains robust
Global financing trends to VC-backed companies by sector
2013–2020*, number of closed deals
100%
Commercial
90% Services
Consumer Goods
80% & Recreation
Energy
70%
HC Devices &
60% Supplies
HC Services &
50% Systems
IT Hardware
40%
Media
30%
Other
20%
10% Pharma & Biotech
0% Software
2013
2014
2015
2016
2017
2018
2019
2020
*
Global financing trends to VC-backed companies by sector
2013–2020*, VC invested ($B)
100%
Commercial
90% Services
Consumer Goods &
80% Recreation
Energy
70%
HC Devices &
60% Supplies
HC Services &
50% Systems
IT Hardware
40%
30% Media
20% Other
10% Pharma & Biotech
0% Software
2013
2014
2015
2016
2017
2018
2019
2020
*
Source: Venture Pulse, Q1’20, Global Analysis of Venture Funding, KPMG Private Enterprise. *As of 3/31/20. Data provided by PitchBook, 4/21/20.
© 2020 KPMG International Cooperative (“KPMG International”). KPMG International provides no client
services and is a Swiss entity with which the independent member firms of the KPMG network are affiliated. #Q1VC 13Global US Americas Europe Asia
Asia region contracts
Financing of VC-backed companies by region
2014–2020*, number of closed deals
2020*
2019
19.9% 2018
2017
23.4%
26.1% 2016
21.4% 2015
22.6% 2014
20.2%14.5%
58.1%
52.2%
47.9%
Americas 50.6%
Europe 49.2%
Asia-Pacific 53.1%
57.6%
27.9%
26.7%
28.2%
28.0%
26.0%
24.3%
22.0%
Source: Venture Pulse, Q1’20, Global Analysis of Venture Funding, KPMG Private Enterprise. *As of 3/31/20. Data provided by PitchBook, 4/21/20.
© 2020 KPMG International Cooperative (“KPMG International”). KPMG International provides no client
services and is a Swiss entity with which the independent member firms of the KPMG network are affiliated. #Q1VC 14Global US Americas Europe Asia
As APAC diminishes, Americas see high
Financing of VC-backed companies by region
2014–2020*, VC invested ($B)
2020*
2019
27.2%
2018
30.6%
2017
43.0%
2016
38.3%
2015
40.6%
2014
32.2%
21.0%
58.2%
55.1%
Americas 47.5%
Europe 48.5%
48.3%
13.3% Asia-Pacific 55.0%
65.7%
12.8%
14.6%
14.4% 11.1%
13.2%
9.6%
Source: Venture Pulse, Q1’20, Global Analysis of Venture Funding, KPMG Private Enterprise. *As of 3/31/20. Data provided by PitchBook, 4/21/20.
© 2020 KPMG International Cooperative (“KPMG International”). KPMG International provides no client
services and is a Swiss entity with which the independent member firms of the KPMG network are affiliated. #Q1VC 15Global US Americas Europe Asia
CVC hits new record as Q1 closes amid the
impact of COVID-19
Corporate VC participation in global venture deals
2012–Q1'20
$70 35%
$60 Deal value ($B) % of total deal count 30%
$50 25%
$40 20%
$30 15%
$20 10%
$10 5%
$0 0%
Q1Q2Q3Q4Q1Q2Q3Q4Q1Q2Q3Q4Q1Q2Q3Q4Q1Q2Q3Q4Q1Q2Q3Q4Q1Q2Q3Q4Q1Q2Q3Q4Q1
2012 2013 2014 2015 2016 2017 2018 2019 2020
Source: Venture Pulse, Q1’20, Global Analysis of Venture Funding, KPMG Private Enterprise. Data provided by PitchBook, 4/21/20.
Note: The capital invested is the sum of all the round values in which corporate venture capital investors participated, not the amount that
corporate venture capital arms invested themselves. Likewise, the percentage of deals is calculated by taking the number of rounds in which
corporate venture firms participated over total deals.
After chugging along at elevated heights, corporates and their venture arms participated in a record proportion of
deals in Q1 2020. Associated deal value was likewise robust, although both tallies once again paint a rosier
picture than what the last few weeks of March revealed. It remains to be seen how much corporates and even
independent venture arms may pull back for Q2 simply given to the degree of uncertainty across the board.
© 2020 KPMG International Cooperative (“KPMG International”). KPMG International provides no client
services and is a Swiss entity with which the independent member firms of the KPMG network are affiliated. #Q1VC 16Global US Americas Europe Asia
First-time funding hits rough patch
Global first-time venture financings of companies
2012–2020*
8,202 8,324
7,603
7,427
7,162 7,179
7,000
6,200
1,042
$14.4 $13.1 $15.1 $22.4 $20.0 $18.7 $34.0 $25.7 $3.7
2012 2013 2014 2015 2016 2017 2018 2019 2020*
Deal value ($B) Deal count
Source: Venture Pulse, Q1’20, Global Analysis of Venture Funding, KPMG Private Enterprise. *As of 3/31/20. Data provided by PitchBook, 4/21/20.
For the sake of comparison, the yearly figures for first-time venture financing rounds are depicted above. Given the
degree of capital in the venture ecosystem, 2018 and 2019 were record years in VC invested even for first-time
fundings, with some companies starting off with hundreds of millions of dollars in their Series A. However, volume
has contracted since a mid-2010s peak. And, just to illustrate the decline that transpired in Q1 2020, the comparably
much-diminished tallies for the entire quarter signify how much of a rough patch first-time rounds encountered.
© 2020 KPMG International Cooperative (“KPMG International”). KPMG International provides no client
services and is a Swiss entity with which the independent member firms of the KPMG network are affiliated. #Q1VC 17Global US Americas Europe Asia
Unicorns rebound in Q1 — temporarily
Global unicorn rounds
2012–Q1'20
$40 100
90
$35
80
$30
70
$25
60
$20 50
40
$15
30
$10
20
$5
10
$0 0
Q1Q2Q3Q4Q1Q2Q3Q4Q1Q2Q3Q4Q1Q2Q3Q4Q1Q2Q3Q4Q1Q2Q3Q4Q1Q2Q3Q4Q1Q2Q3Q4Q1
2012 2013 2014 2015 2016 2017 2018 2019 2020
Deal value ($B) Deal count
Source: Venture Pulse, Q1’20, Global Analysis of Venture Funding, KPMG Private Enterprise. Data provided by PitchBook, 4/21/20.
Note: PitchBook defines a unicorn venture financing as a VC round that generates a post-money valuation of $1 billion or more. These are
not necessarily first-time unicorn financing rounds, but also include further rounds raised by existing unicorns that maintain at least that
valuation of $1 billion or more.
Unicorn financing volume has always been quite variable for obvious reasons. The last several quarters have seen a
record peak and also very sharp plunges in volume, even as aggregate VC associated stayed relatively even. The
rebound in Q1 2020 was clearly skewed by a handful of existing unicorns raking in late-stage rounds, as evidenced by
the top 10 financings’ breakdowns per region. However, again, it remains to be seen and is in fact quite likely that Q2
2020 will see a sharper drop due to the escalating effects of the COVID-19 pandemic.
© 2020 KPMG International Cooperative (“KPMG International”). KPMG International provides no client
services and is a Swiss entity with which the independent member firms of the KPMG network are affiliated. #Q1VC 18Global US Americas Europe Asia
Business/productivity software likely set for
active interest in coming months
Global venture financing in business/productivity software
2012–Q1'20
$30 4,000
3,500
3,409
$25
3,155
3,000
$20
2,524 2,500
2,194 2,217
$15 2,000
1,928
1,502 1,500
$10
1,117
1,000
$5 612
500
$10.7
$11.6
$12.1
$14.3
$25.2
$27.6
$4.4
$6.1
$6.0
$0 0
2012 2013 2014 2015 2016 2017 2018 2019 2020*
Deal value ($B) Deal count
Source: Venture Pulse, Q1’20, Global Analysis of Venture Funding, KPMG Private Enterprise. Data provided by PitchBook, 4/21/20.
More directly relevant than ever before, business and productivity software enjoyed a peak in venture activity last
year, as well as a massive near-$30 billion in dollars invested. Granted, although this space is broad-ranging, as
multiple corporations worldwide put their remote tools to the test in the largest remote working experiment ever
unintentionally devised, startups and existing businesses such as Slack are looking to see how they can seize a rare
and hopefully never-to-be-repeated opportunity to gain market share and prove the true value of their offerings.
© 2020 KPMG International Cooperative (“KPMG International”). KPMG International provides no client
services and is a Swiss entity with which the independent member firms of the KPMG network are affiliated. #Q1VC 19Global US Americas Europe Asia
Communications software sets the stage
Global venture financing in communication software
2012–Q1'20
$2.5 300
261
250
$2.0
231 226 230 226
217 212
200
$1.5 185
150
$1.0
100
$0.5
50
31
$0.7
$0.8
$1.8
$1.2
$1.5
$1.5
$2.1
$1.0
$0.3
$0.0 0
2012 2013 2014 2015 2016 2017 2018 2019 2020*
Deal value ($B) Deal count
Source: Venture Pulse, Q1’20, Global Analysis of Venture Funding, KPMG Private Enterprise. Data provided by PitchBook, 4/21/20.
At first glance, global venture financing for communications software companies is not having a banner start to the
year, even after a strong run in terms of volume. However, the primary reason we employed this dataset as a
backdrop is because that is obviously about to change as communications infrastructure from telecoms’ carrier loads
to streaming quality becomes strained for what could be months. Investors will likely either flee to safety with more-
established businesses or pursue the most viable business plans and products started up in the coming weeks.
“COVID-19 is the black swan event of our time. It is causing changes that will propel us further into the
digital age. Gaming is going through the roof. Online businesses are going through the roof. Delivery,
logistics, productivity, cybersecurity — these are taking center stage for almost every business.
Traditional organizations that have been lagging behind are going to go through a massive shift because
they have no other choice. They are seeing their weaknesses in a big way — and the world will be
changed because of it.”
Egidio Zarrella
Head of Clients and Innovation Partner,
KPMG China
© 2020 KPMG International Cooperative (“KPMG International”). KPMG International provides no client
services and is a Swiss entity with which the independent member firms of the KPMG network are affiliated. #Q1VC 20Global US Americas Europe Asia
Exits decline and are likely to diminish further
Global venture-backed exit activity
2012–Q1'20
$250 600
500
$200
400
$150
300
$100
200
$50
100
$0 0
Q1Q2Q3Q4Q1Q2Q3Q4Q1Q2Q3Q4Q1Q2Q3Q4Q1Q2Q3Q4Q1Q2Q3Q4Q1Q2Q3Q4Q1Q2Q3Q4Q1
2012 2013 2014 2015 2016 2017 2018 2019 2020
Exit value ($B) Exit count
Source: Venture Pulse, Q1’20, Global Analysis of Venture Funding, KPMG Private Enterprise. Data provided by PitchBook, 4/21/20.
The 3 quarter consecutive decline in exit volume was not necessarily promising for venture investors and mature
companies looking to achieve some liquidity for starters, but now things are looking much worse. The IPO market
has by, and large, fizzled, even as M&A volume becomes hard to predict given how much some tech giants may
be impacted by the global pandemic. Consequently, it is to be expected that exit volume is going to drop,
potentially sharply, for at least a short duration. What really matters is whether that duration ends up being much
longer for some venture-backed companies. Exits can be put off given private capital availability, but if late-stage
investors are also shying away, some businesses could face hard choices.
© 2020 KPMG International Cooperative (“KPMG International”). KPMG International provides no client
services and is a Swiss entity with which the independent member firms of the KPMG network are affiliated. #Q1VC 21Global US Americas Europe Asia
After near-record IPOs, anticipate some lows
Global venture-backed exit activity Global venture-backed exit activity
(#) by type ($B) by type
2012–2020* 2012–2020*
2,500 $450
$400
2,000
$350
$300
1,500
$250
$200
1,000
$150
$100
500
$50
0 $0
Strategic Acquisition Buyout IPO Strategic Acquisition Buyout IPO
Source: Venture Pulse, Q1’20, Global Analysis of Venture Funding, KPMG Private Enterprise. *As of 3/31/20. Data provided by PitchBook, 4/21/20.
At nearly $255 billion, the total exit value achieved by VC-backed startups going public in 2019 fell shy of the record haul
in 2018 of $269.3 billion. 2020 is hardly likely to match that tally at all now. The IPO market has fizzled given the sheer
degree of volatility in public equities that few companies would care to test. Right now, companies waiting to go public or
in M&A talks are grappling with a heightened degree of uncertainty that may at minimum prolong or pause processes. In
other cases, the talks or negotiations may collapse. The big question is how long this may take. And even PE shops
with hoards of dry powder may not be willing to snap up soon-to-be distressed startups.
© 2020 KPMG International Cooperative (“KPMG International”). KPMG International provides no client
services and is a Swiss entity with which the independent member firms of the KPMG network are affiliated. #Q1VC 22Global US Americas Europe Asia
Fundraising logs a solid Q1
Global venture fundraising
2012–2020*
$120 700
596 600
$100
571
549 543
537
516
500
$80
446
411 400
$60
300
$40
200
$20 119
100
$100.5
$39.8
$40.6
$54.4
$76.2
$76.9
$62.3
$81.8
$28.4
$0 0
2012 2013 2014 2015 2016 2017 2018 2019 2020*
Capital raised ($B) Fund count
Source: Venture Pulse, Q1’20, Global Analysis of Venture Funding, KPMG Private Enterprise. *As of 3/31/20. Data provided by PitchBook, 4/21/20.
Fundraising was quite strong in Q1 2020, belying the waves of negative news that spread worldwide in the closing
weeks of March. Despite that addition to venture firm coffers, however, the current market situation may not
benefit from VCs starting to put that money to work, however. Some will, of course, but caution is likely to be the
reigning new normal for at least a matter of weeks if not months. That said, the strength of recent fundraising does
mean that when VCs are able to deploy their capital, they will definitely have the resources to do so.
© 2020 KPMG International Cooperative (“KPMG International”). KPMG International provides no client
services and is a Swiss entity with which the independent member firms of the KPMG network are affiliated. #Q1VC 23Global US Americas Europe Asia
First-time funds likely to contract
Global venture fundraising (#) by size Global first-time vs. follow-on venture
2012–2020* funds (#)
600 2012–2020*
100%
90%
500
80%
400 70%
60%
300
50%
40%
200
30%
20%
100
10%
0 0%
2020*
2012
2013
2014
2015
2016
2017
2018
2019
2012 2014 2016 2018 2020*
Under $50M $50M-$100M $100M-$250M
$250M-$500M $500M-$1B $1B+ First-time Follow-on
Source: Venture Pulse, Q1’20, Global Analysis of Venture Funding, KPMG Private Enterprise. *As of 3/31/20. Data provided by PitchBook, 4/21/20.
Although not at the levels seen before, first-time funds did account for at least over 10 percent of all global venture
fundraising in 2019. However, conversations for first-time fund managers have definitely changed in tone. Unless
a distinct case can be made by the firms on the fundraising trail that they can capitalize even on this current period
of great uncertainty, the rate of closure for new vehicles is likely to contract considerably in Q2 2020.
© 2020 KPMG International Cooperative (“KPMG International”). KPMG International provides no client
services and is a Swiss entity with which the independent member firms of the KPMG network are affiliated. #Q1VC 24Global US Americas Europe Asia
Q1 sees early hints of retreats to safety
41
3 8
4 10
7
6
1
Top 10 global financings in Q1'20
GO-JEK — $3B, Jakarta Selatan Grab — $886M, Singapore
1 Ridesharing
6 Ridesharing
Series F Late-stage VC
Kuaishou — $3B, Beijing Quibi — $750M, Los Angeles
1 Application software 7 Media
Late-stage VC Early-stage VC
Waymo — $2.25B, Mountain View JUUL — $700M, San Francisco
3 Automotive 8 Electronics (B2C)
Late-stage VC Late-stage VC
Generate Capital — $1B, San Francisco Chime (Financial Software) — $700M, San
4 8 Francisco
Specialized finance
Late-stage VC Financial software
Series E
Yuanfudao — $1B, Beijing
4 Edtech 10 Joby Aviation — $590M, Santa Cruz
Late-stage VC Aerospace
Series C
Source: Venture Pulse, Q1’20, Global Analysis of Venture Funding, KPMG Private Enterprise. Data provided by PitchBook, 4/21/2020.
© 2020 KPMG International Cooperative (“KPMG International”). KPMG International provides no client
services and is a Swiss entity with which the independent member firms of the KPMG network are affiliated. #Q1VC 25Global US Americas Europe Asia In Q1‘20 US VC-backed companies raised $34.25B across 2,298 deals © 2020 KPMG International Cooperative (“KPMG International”). KPMG International provides no client services and is a Swiss entity with which the independent member firms of the KPMG network are affiliated.
Global               US   Americas   Europe   Asia

VC investment in the US rises in Q1’20
                    VC investment in the US rose in Q1’20, led by a $2.25 billion raise by autonomous mobility company
                    Waymo and a $1 billion raise by cleantech infrastructure provider Generate Capital. The relatively long
                    lead times for deals helped keep the VC market on an even keel, even as COVID-19 began to make
                    waves in the US economy and public markets.

                    First 2 months of 2020 mirror previous trends
                    The first 2 months of 2020 saw a continuation of the trends experienced in Q4’19. VC investors in the
                    US continued to have a significant amount of dry powder at their fingertips. Despite the failed WeWork
                    IPO and the weak performance of a number of IPOs during 2019, there continued to be a competitive
                    market for high quality VC deals. VC investors enhanced their focus on profitability, putting pressure on
                    companies within their portfolios to improve their bottom line and unit economics, particularly those
                    considering a 2020 IPO.

                    Deal sizes were quite robust in the early part of Q1’20, led by Waymo’s $2.25 billion round, a $1 billion
                    raise by cleantech infrastructure investor Generate Capital and a $700 million raise by e-cigarette
                    manufacturer Juul. The diversity of investments remained a hallmark of the VC market in the US with
                    the largest deals of the quarter going to companies in finance, B2B productivity, aerospace,
                    entertainment, network management, and autonomous driving.

                    As COVID-19 makes waves, VC investment remains strong
                    The sudden emergence of COVID-19 in different areas of the US created significant ripples within the
                    US economy and created major waves in the public markets. A significant amount of in-progress IPO
                    activity ground to a halt, with a number of companies due to file postponing their offerings indefinitely.

                    Despite surging uncertainty, VC investment in the US remained strong into March 2020, including the
                    massive $2.25 billion raise by Waymo, a $750 million raise by mobile video company Quibi, a $700
                    million raise by digital bank Chime, a $500 million raise by alternative meat company Impossible Foods,
                    and a $493 million raise by biotech company Lyell.

                    VC investors prioritizing existing portfolio companies
                    Given the unexpected turmoil in the US and global markets, US-based VC investors are poised to
                    become even more cautious with their investments moving forward. They will likely also need to
                    re-evaluate the needs of their existing portfolio companies given the changing business environment.
                    Most companies that had planned to exit in the near-term, whether through acquisition or IPO, are likely
                    changing or delaying their plans. Depending on the financial situation of these companies, VC investors
                    might need to use their dry powder to shore up companies so they have the resources to maintain
                    operations until the economy rebounds. This could significantly reduce the availability of funding for
                    early stage companies over the next quarter.

                    Increasing focus on digital solutions could spur pockets of investment
                    The significant push to have employees work from home is already having a significant impact on
                    companies with productivity solutions. For example, while most stocks have seen enormous hits,
                    videoconferencing solutions company Zoom has seen its stock price increase 100 percent since the
                    beginning of 2020 and 32 percent since the market began to sink in mid-February6. In addition to
                    productivity-focused companies, others that could see an uptick in investment include those focused on
                    biotech, delivery, online services, or digital entertainment.

                    6 https://www.fool.com/investing/2020/03/25/should-you-buy-zoom-stock-right-now.aspx

© 2020 KPMG International Cooperative (“KPMG International”). KPMG International provides no client
services and is a Swiss entity with which the independent member firms of the KPMG network are affiliated.                      #Q1VC        27
Global US Americas Europe Asia
VC investment in the US rises in Q1’20, cont’d.
Focusing on building companies, rather than growing companies
The current reality will make it extremely difficult for most US startups to grow their business in the near-
term. As a result, VC investors may find it an opportune time to work with their portfolio companies to
build their businesses, helping them to create new technologies or advance their R&D efforts. Given the
strength of the US economy prior to COVID-19, and the US government’s commitment of $2 trillion
dollars7 in economic relief, companies that are well-positioned from an operational perspective could be
in a strong position to resume their growth agenda in the second half of 2020 and into 2021.
Deal-making processes set to slow
The increasing restrictions on the movement of people in many US states is expected to cause a
significant slowdown in the VC deal-making process. With travel difficult, the logistics associated with
conducting deal due diligence could be a major barrier to finalizing deals. While VC investors and target
companies will likely adapt and embrace digital support solutions, it is expected the implementation of
such activities will take time. Given the uncertainty of COVID-19’s impacts, VC investors could also
simply put deal-making activity on hold until the pandemic runs its course.
It is expected that any deals that get completed moving into Q2’20 will include increased due diligence
in order to understand the impact of COVID-19.
Trends to watch for in the US
Looking forward, VC investment in the US is expected to slow substantially in Q2’20 as deals get more
difficult to complete and VC investors hold back from making major new investments in order to focus on
their existing portfolios. A small number of companies could see upticks in VC investment should their
products or services be particularly conducive to the current economic situation; for example, companies
in biotech, digital services, or delivery and logistics.
In the event the pandemic continues for several months, there could be an increase in distressed
investing as startups struggle to cope with the impact of COVID-19 and both VC and corporate investors
with large pocketbooks look for deals.
7 https://www.nytimes.com/article/coronavirus-stimulus-package-questions-answers.html
© 2020 KPMG International Cooperative (“KPMG International”). KPMG International provides no client
services and is a Swiss entity with which the independent member firms of the KPMG network are affiliated. #Q1VC 28Global US Americas Europe Asia
2020 starts with diminishing volumes
Venture financing in the US
2012–Q1'20
$50 3,500
$45
3,000
$40
$35 2,500
$30
2,000
$25
1,500
$20
$15 1,000
$10
500
$5
$0 0
Q1Q2Q3Q4Q1Q2Q3Q4Q1Q2Q3Q4Q1Q2Q3Q4Q1Q2Q3Q4Q1Q2Q3Q4Q1Q2Q3Q4Q1Q2Q3Q4Q1
2012 2013 2014 2015 2016 2017 2018 2019 2020
Deal value ($B) Deal count Angel/Seed Early VC Later VC
Source: Venture Pulse, Q1’20, Global Analysis of Venture Funding, KPMG Private Enterprise. Data provided by PitchBook, 4/21/20.
After a remarkably robust stretch of VC invested and a record peak in volume of the decade, 2020 may finally see some
significant slowing in the US. Q1 2020 volume hinted at such a trend, although the true ramifications of the COVID-19
pandemic really only began to be seen to considerable effect in the back half of March. It remains to be seen how much
multi-state lockdowns impede deal-making in Q2, though the extent is highly likely to be considerable.
“The VC market in the US was quite robust pre-COVID-19. Valuations were high. Dollar amounts
were high. Companies across sectors attracted funding, from plant-based meats to fintech. What
we’re experiencing now is not necessarily going to cause an investor that’s substantially complete
with due diligence to actually pull back financing, so we will likely see more deals come through, but
I’d expect April and May to be pretty bleak.”
Conor Moore
Co-Leader, KPMG Private Enterprise Emerging Giants Network, KPMG International and
National Lead Partner, KPMG Private Enterprise, KPMG in the US
© 2020 KPMG International Cooperative (“KPMG International”). KPMG International provides no client
services and is a Swiss entity with which the independent member firms of the KPMG network are affiliated. #Q1VC 29Global US Americas Europe Asia
The late stage slides once more
Median deal size ($M) by stage in the US
2012–2020*
$11.2
$10.0 $10.0 $10.0
$9.0 $9.3
$8.5
$7.1
$6.8 $6.7
$6.0 $6.0
$4.9 $5.0
$4.1
$3.5
$2.9 $3.0
$1.0 $1.0 $1.2 $1.0
$0.6 $0.7 $0.8
$0.5 $0.5
2012 2013 2014 2015 2016 2017 2018 2019 2020*
Angel/seed Early stage VC Later stage VC
Up, flat or down rounds in the US
2012–2020*
100%
90%
Up
80%
70%
60%
50%
Flat
40%
30%
20%
10% Down
0%
2012 2013 2014 2015 2016 2017 2018 2019 2020*
Source: Venture Pulse, Q1’20, Global Analysis of Venture Funding, KPMG Private Enterprise. *As of 3/31/20. Data provided by PitchBook, 4/21/20.
© 2020 KPMG International Cooperative (“KPMG International”). KPMG International provides no client
services and is a Swiss entity with which the independent member firms of the KPMG network are affiliated. #Q1VC 30Global US Americas Europe Asia
The latest stage slides ever so slightly
Median deal size ($M) by series in the US
2012–2020*
$22
$19
$16
$14
$11 $11
$9 $8.5
$7.5 $8.0
$7 $7
$5.7
$5.0
$3.5 $4.1
$2.7 $3.0 $2.5
$2.0 $2.2
$1.0 $1.4 $1.6
$0.5 $0.6 $0.7
2012 2013 2014 2015 2016 2017 2018 2019 2020*
Seed Series A Series B
$51 $50
$43
$38
$30 $30 $30
$25 $25 $26
$20 $21
$17 $16 $16
$14
$11 $12
2012 2013 2014 2015 2016 2017 2018 2019 2020*
Series C Series D+
Source: Venture Pulse, Q1’20, Global Analysis of Venture Funding, KPMG Private Enterprise. *As of 3/31/20. Data provided by PitchBook, 4/21/20.
Note: Figures rounded in some cases for legibility.
© 2020 KPMG International Cooperative (“KPMG International”). KPMG International provides no client
services and is a Swiss entity with which the independent member firms of the KPMG network are affiliated. #Q1VC 31Global US Americas Europe Asia
Record valuations to be put to the test
Median pre-money valuation ($M) by series in the US
2012–2020*
$75.0
$67.0
$55.0
$40.0
$37.0 $36.0
$30.0
$24.8
$20.8 $20.0 $21.5 $21.0
$14.0 $15.0
$10.7 $12.5
$7.8 $8.5 $7.0 $7.5 $7.5
$4.5 $4.8 $5.2 $5.6 $6.0
$4.0
2012 2013 2014 2015 2016 2017 2018 2019 2020*
Seed Series A Series B
$390.0
$300.0
$280.0
$204.0
$165.6
$137.9 $143.5 $147.5
$136.9
$110.0
$92.2 $98.3
$69.9 $80.0 $80.0
$45.4 $55.3 $54.6
2012 2013 2014 2015 2016 2017 2018 2019 2020*
Series C Series D+
Source: Venture Pulse, Q1’20, Global Analysis of Venture Funding, KPMG Private Enterprise. *As of 3/31/20. Data provided by PitchBook, 4/21/20.
Note: Figures rounded in some cases for legibility.
After record and near-record highs in VC valuations notched last year, it is difficult to know with certainty what will
happen when COVID-19 inevitably impacts the volume of deal-making. It is possible that the companies that are
best-placed to raise and that are able to close on funding rounds in the current climate may still be able to
command significant valuations. However, it is also likely investors may demand different terms and more
favorable valuations. Additional time resulting in more data will yield a clearer picture.
© 2020 KPMG International Cooperative (“KPMG International”). KPMG International provides no client
services and is a Swiss entity with which the independent member firms of the KPMG network are affiliated. #Q1VC 32Global US Americas Europe Asia
Earlier stages contract in VC invested
Deal share by series in the US Deal share by series in the US
2020*, VC invested ($B) 2019, VC invested ($B)
6.3% 6.8%
15.9%
33.1% 33.5% 20.5%
Angel/seed
Series A
Series B
Series C
Series D+
26.2%
22.7%
18.5% 16.4%
Deal share by series in the US Deal share by series in the US
2020*, number of closed deals 2019, number of closed deals
3.7% 3.8%
5.8% 5.2%
13.1% 12.0%
Angel/seed
Series A
Series B
54.4% 53.9%
Series C
Series D+ 25.0%
23.0%
Source: Venture Pulse, Q1’20, Global Analysis of Venture Funding, KPMG Private Enterprise. *As of 3/31/20. Data provided by PitchBook, 4/21/20.
© 2020 KPMG International Cooperative (“KPMG International”). KPMG International provides no client
services and is a Swiss entity with which the independent member firms of the KPMG network are affiliated. #Q1VC 33Global US Americas Europe Asia
Biotech remains unsurprisingly robust
Venture financing by sector in the US Venture financing by sector in the US
2013–2020*, number of closed deals 2014–2020*, VC invested ($B)
100% Commercial 100%
Services
90% Consumer 90%
Goods &
Recreation
80% 80%
Energy
70% 70%
HC Devices
& Supplies
60% 60%
HC Services
& Systems
50% 50%
IT Hardware
40% 40%
Media
30% 30%
Other
20% 20%
10% Pharma & 10%
Biotech
0% Software 0%
2020*
2013
2014
2015
2016
2017
2018
2019
2020*
2013
2014
2015
2016
2017
2018
2019
Source: Venture Pulse, Q1’20, Global Analysis of Venture Funding, KPMG Private Enterprise. *As of 3/31/20. Data provided by PitchBook, 4/21/20.
Even before the COVID-19 pandemic began impacting the US economy, more venture dollars were flowing to
biotech and healthcare in general, as the industry still poses very favorable dynamics for innovation. Now, that
appeal is only further underlined, from telehealth to antiviral research.
© 2020 KPMG International Cooperative (“KPMG International”). KPMG International provides no client
services and is a Swiss entity with which the independent member firms of the KPMG network are affiliated. #Q1VC 34Global US Americas Europe Asia
CVC notches a new high
Corporate participation in venture deals in the US
2012–Q1'20
$30 35%
30%
$25
25%
$20
20%
$15
15%
$10
10%
$5
5%
$0 0%
Q1Q2Q3Q4Q1Q2Q3Q4Q1Q2Q3Q4Q1Q2Q3Q4Q1Q2Q3Q4Q1Q2Q3Q4Q1Q2Q3Q4Q1Q2Q3Q4Q1
2012 2013 2014 2015 2016 2017 2018 2019 2020
Deal value ($B) % of total deal count
Source: Venture Pulse, Q1’20, Global Analysis of Venture Funding, KPMG Private Enterprise. Data provided by PitchBook, 4/21/20.
Finishing 2019 strong in continuation of an elevated plateau, Q1 2020 saw corporate players reach a new high in
terms of participation proportions. It is likely that statistics are skewed by the steadiness of late-stage rounds,
which typically see the involvement of corporates and larger CVC arms; accordingly, as overall VC volume looks
set to contract sharply, it’ll be interesting to see how corporate players behave in the environment, given what
their affiliated parent may be experiencing.
© 2020 KPMG International Cooperative (“KPMG International”). KPMG International provides no client
services and is a Swiss entity with which the independent member firms of the KPMG network are affiliated. #Q1VC 35Global US Americas Europe Asia
Off to a rough start
First-time venture financings of companies in the US
2012–2020*
3,774
3,574 3,609
3,251
3,173
3,088
2,995 2,939
560
$6.9 $7.0 $7.9 $9.1 $7.8 $8.4 $14.2 $11.8 $2.2
2012 2013 2014 2015 2016 2017 2018 2019 2020*
Deal value ($B) Deal count
Source: Venture Pulse, Q1’20, Global Analysis of Venture Funding, KPMG Private Enterprise. *As of 3/31/20. Data provided by PitchBook, 4/21/20.
First-time funding finished 2019 strong, at no less than $10.9 billion invested across a remarkably consistent
2,766 transactions. But now, 2020 is looking likely to be quite a different story. Even though venture
ecosystems often proclaim how recessions produce the most resilient startups that can be successful going
forward, that doesn’t mean that volume of first-time financings is likely to roar back anytime soon. For now, it
depends on the duration and the depth of the recession.
© 2020 KPMG International Cooperative (“KPMG International”). KPMG International provides no client
services and is a Swiss entity with which the independent member firms of the KPMG network are affiliated. #Q1VC 36You can also read