East Hants, Nova Scotia - RETAIL MARKET ANALYSIS - April 2018
←
→
Page content transcription
If your browser does not render page correctly, please read the page content below
East Hants, Nova Scotia
RETAIL MARKET ANALYSIS

                                                            April 2018
 Prepared for the Municipality of East Hants, Nova Scotia

 Prepared by Cushing Terrell Architecture Inc.
 In collaboration with Key Planning Strategies
RETAIL
       Market Analysis

Suite 216, 9525 201 Street | Langley, B.C. Canada | V1M 2M3 | 604.888.6680 p | www.CushingTerrell.com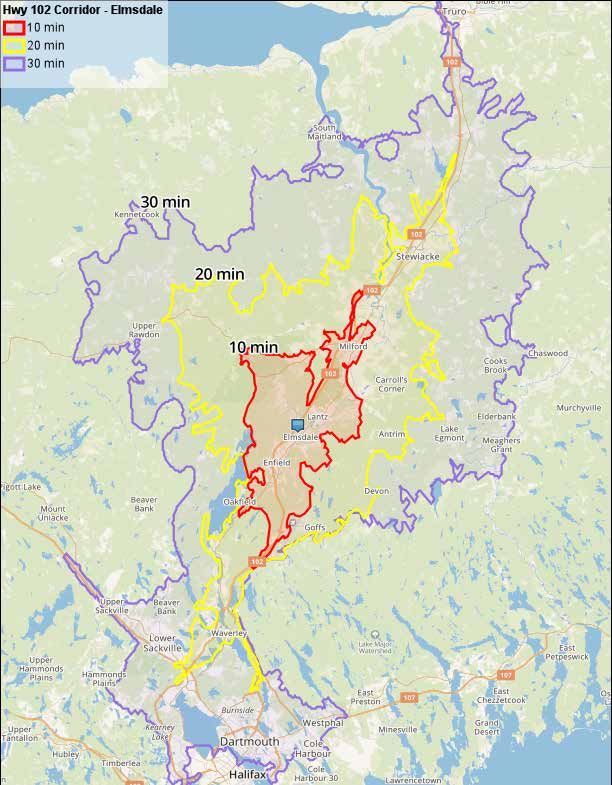
This page left intentionally blank
(for double-sided printing)
Table of
CONTENTS
PREFACE......................................................................................................................................................................i
EXECUTIVE SUMMARY........................................................................................................................................ii

1.0     INTRODUCTION...........................................................................................................................................1
1.1     Scope of Study & Project Background .......................................................................................................................1
1.2     Report Structure.................................................................................................................................................................1
1.3     Sources of Information.....................................................................................................................................................1

2.0     LOCATION CONTEXT...................................................................................................................................2
2.1     Introduction..........................................................................................................................................................................2
2.2     Local & Regional Context................................................................................................................................................2
2.3     Transportation Context....................................................................................................................................................4
2.4     Growth Management Areas...........................................................................................................................................6

3.0     RETAIL TRADE AREA................................................................................................................................. 11
3.1     Introduction........................................................................................................................................................................11
3.2     Population Projections...................................................................................................................................................15
3.3     Age Profile...........................................................................................................................................................................19
3.4     Household Income Profile.............................................................................................................................................19
3.5     Retail Spending Profile...................................................................................................................................................23

4.0     RETAIL SUPPLY.......................................................................................................................................... 33
4.1     Introduction........................................................................................................................................................................33
4.2     East Hants Retail Market................................................................................................................................................33
4.3     Retail Vacancy....................................................................................................................................................................33
4.4     Retail Inventory by Category........................................................................................................................................37
4.5     Retail Inventory by NAICS..............................................................................................................................................39
4.6     Retail Space Per Capita...................................................................................................................................................39

5.0 RETAIL DEMAND....................................................................................................................................... 45
5.1 Introduction........................................................................................................................................................................45
5.2 Retail Floor Space Demand...........................................................................................................................................45

6.0 CONCLUSIONS........................................................................................................................................... 53
6.1 Key Findings & Directions..............................................................................................................................................53
6.2 Retail Tenant Targets.......................................................................................................................................................54
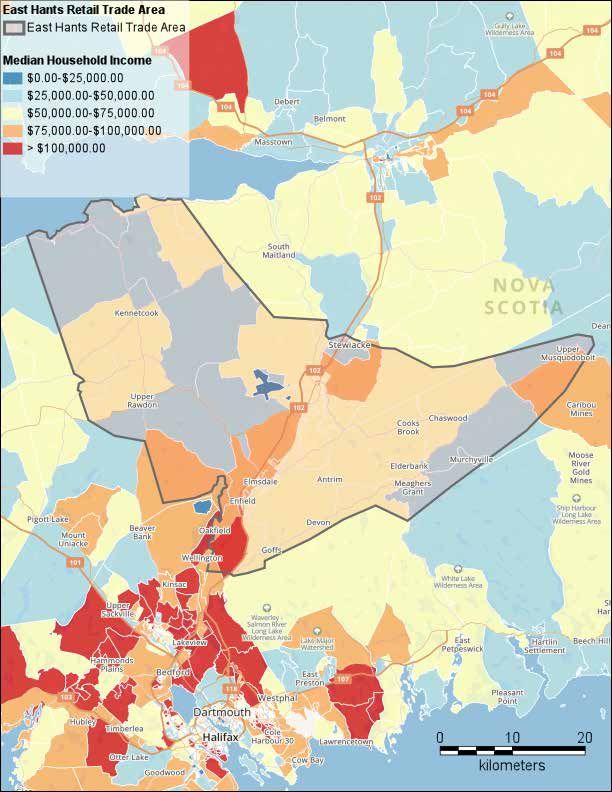
Table of
CONTENTS
 APPENDICES
 A Detailed Retail Inventory for Municipality of East Hants...................................................................................55

 TABLES......................................................................................................................................................................
 3.1 Trade Area Demographic Summary..........................................................................................................................14
 3.2 Trade Area Population Projections Summary 2017 - 2027................................................................................17
 3.3 Trade Area Population Age Breakdown...................................................................................................................18
 3.4 Trade Area Household Income Breakdown............................................................................................................21
 3.5 Trade Area Retail Spending 2017, 2022 & 2027......................................................................................................24

 4.1    Retail Market Snapshot...................................................................................................................................................33
 4.2    Municipality of East Hants Retail Inventory Summary By Category..............................................................34
 4.3    Municipality of East Hants Retail Inventory Summary By Community........................................................35
 4.4    Municipality of East Hants Retail Businesses Inventory by NAICS..................................................................36

 5.1 East Hants 2017 Estimated Retail Market Share & Sales Productivity.......................................................... 46
 5.2 East Hants Targeted Retail Market Share & Resulting Demand Forecast 2017 to 2022........................49
 5.3 East Hants Targeted Retail Market Share & Resulting Demand Forecast 2022 to 2027.......................51

 6.1 East Hants Target Retail Prospects.............................................................................................................................55

 FIGURES........................................................................................................................................................ ............
 2.1 10-20-30 Minute Drive Time from Junction of Hwy 102 & Rte 214 (Elmsdale).............................................3
 2.2 East Hants AADT Traffic Counts - Highway 102 Corridor.....................................................................................5
 2.3 East Hants Land Use Bylaw Map...................................................................................................................................8
 2.4 East Hants South Corridor and Commercial Growth Management Area......................................................9

 3.1    East Hants Retail Trade Area.........................................................................................................................................12
 3.2    East Hants Retail Trade Area with Population Density & Growth Forecasts 2017 - 2022.......................13
 3.3    East Hants Retail Trade Area with Population Growth Foreasts 2017 - 2022..............................................16
 3.4    Trade Area Population Age Breakdown...................................................................................................................18
 3.5    Trade Area Household Income Breakdown Map..................................................................................................20
 3.6    Trade Area Household Income by Income Segment..........................................................................................22
 3.7    Trade Area Retail Spending Summary......................................................................................................................24
 3.8    Trade Area Retail Spending By General Category................................................................................................25
 3.9    Trade Area Average Annual Household Spending 2017 - Grocery & Specialty Foods...........................26
 3.10   Trade Area Average Annual Household Spending 2017 - Personal Services.............................................27
3.11   Trade Area Average Annual Household Spending 2017 - Clothing & Apparel..........................................28
3.12   Trade Area Average Annual Household Spending 2017 - Home Furnishings & Accessories...............29
3.13   Trade Area Average Annual Household Spending 2017 - Home Improvement & Garden...................30
3.14   Trade Area Average Annual Household Spending 2017 - Restaurants.........................................................31
3.15   Trade Area Average Annual Household Spending 2017 - Auto/RV/Motorsports.....................................32

4.1    Representative East Hants Retail Imagery - Hwy 102 Corridor........................................................................38
4.2    Retail Space Per Capita Growth Continuum.......................................................................................................... 40
4.3    Provincial Major Retail Chain Sq. Ft. by Retail Sector..........................................................................................42
4.4    Shopping Centre Sq. Ft. Per Capita By Province...................................................................................................43

5.1 East Hants 2022 Net Potential Demand by Category........................................................................................ 48
5.2 East Hants 2027 Net Potential Demand by Category..........................................................................................50

                                                                        Retail Market Analysis - Municipality of East Hants, Nova Scotia                  |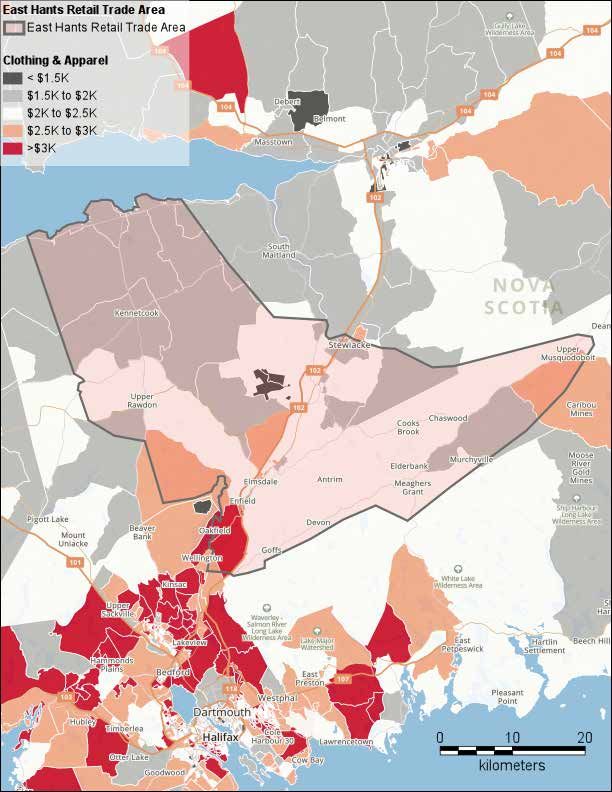
i       PREFACE

Cushing Terrell Architecture Inc. (“Cushing Terrell”),          Reference material for this report was obtained
in collaboration with Key Planning Strategies (“Key             from, but not limited to: the Municipality of
Planning”) was commissioned by the Municipality                 East Hants, Commercial Real Estate Brokerage
of East Hants (“East Hants”) in November 2017 to                Firms, Land Owners, Property Developers,
conduct a Retail Market Analysis for East Hants,                International Council of Shopping Centers (ICSC),
particularly the areas of Enfield, Elmsdale and                 Cushing Terrell Architecture Inc. and Key Planning
                                                                Strategies.
Lantz.

The study was carried out over the period of                    Cushing Terrell does not warrant that any
December 2017 - April 2018.                                     estimates contained within the study will be
                                                                achieved over the identified time horizons, but
The objective of this study is to thoroughly                    that they have been prepared conscientiously and
document East Hants’ current retail inventory.                  objectively on the basis of information obtained
It also estimates the realistic “Retail Trade                   during the course of this study.
Area” for which East Hants serves and the
retail expenditure profile across various retail                Also, any tenant references made in the report
categories/store types as an indication of retail               are for illustrative purposes only and should not
inflow/outflow and opportunities that East                      be taken as guarantees that they will locate in
Hants could potentially pursue. The information                 East Hants, but rather that they could represent
will be used to fill gaps and bolster the local                 compatible “target” category types to pursue
retail market by retaining or attracting greater                either for local businesses or external regional
market share of resident and passing motorists’                 businesses.
spending in the community.
                                                                This analysis was conducted by Cushing Terrell as
Retail spending (i.e. demand), East Hants’ retail               an objective and independent party, and is not an
                                                                agent of the Municipality of East Hants.
inventory, and its corresponding productivity
(i.e. supply) was estimated to identify gaps in the
                                                                As is customary in an assignment of this type,
current provision of shops and services.
                                                                neither our name nor the material submitted may
                                                                be included in a prospectus, or part of any printed
This document is intended to assist East Hants                  material, or used in offerings or representations
in promoting the community, working with                        in connection with the sale of securities or
developers and investors, particularly in the areas             participation interest to the public, without the
of future growth along the Hwy 102 corridor                     expressed permission of the Municipality of East
(Enfield/Elmsdale/Lantz) as well as attracting new              Hants, Cushing Terrell Architecture Inc. or Key
retail or business opportunities. It further aims               Planning Strategies.
to support and retain existing retailers as part
of a wider Economic Development Strategy for                    Cushing Terrell Architecture Inc.
business retention and attraction and succession                Key Planning Strategies
planning.                                                       2018

i        |   Key Planning Strategies & Cushing Terrell Architecture Inc.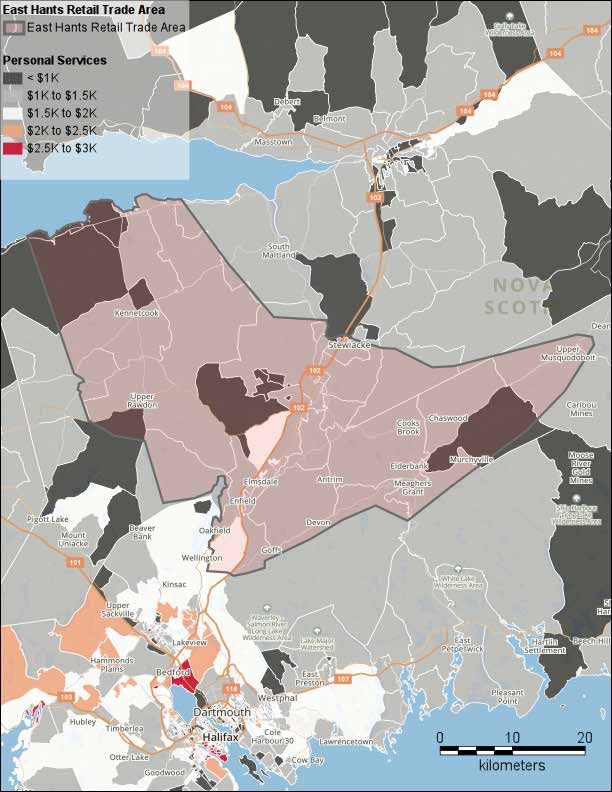
iiEXECUTIVE SUMMARY

 INTRODUCTION                                              higher north in-step with regional demand and
                                                           growth, driven in large part to the employment
 This document is intended to assist East Hants
                                                           activity spurred by the nearby presence of the
 in promoting the community, working with
                                                           Halifax International Airport. In particular, the
 developers and investors, particularly in the areas
                                                           interchange at Elmsdale is now averaging just
 of future growth along the Hwy 102 corridor
                                                           under 15,000 AADT.
 (Enfield/Elmsdale/Lantz) as well as attracting
 new retail or business opportunities. It further
                                                           In addition to traffic counts it is also worth noting
 aims to support and retain existing retailers as
                                                           that the Province and Municipality are finalizing
 part of a wider Economic Development Strategy
                                                           plans for a new Hwy interchange and overpass to
 for business retention, attraction and succession
                                                           be located at Lantz. This future Exit 8A will provide
 planning.
                                                           additional access and egress to future residential
                                                           and businesses on both sides of Hwy 102.
 LOCATION CONTEXT SUMMARY
 Retail shops and services of a larger scale               From a retail perspective, these traffic volumes are
 including larger format and junior box retailers          considered attractive for prospective retailers for
 are congregating in Elmsdale at the interchange           whom benchmarks of consistent volumes of daily
 of Hwy 102 and Rte 214 and include Grocery,               traffic are a requirement, particularly given the
 Pharmacy, Home Improvement, Quick Service                 continued pattern of growth along this corridor
 Food & Beverage (F&B) and Personal Services such          for residents and visitor flow.
 as banks and Financial Services.
                                                           In the near term and for the next 10+ years, this
 Until recently, Elmsdale has been sandwiched              particular study realizes the more nascent status
 between, or at the periphery of two (2) existing          of the corridor whereby rooftops and residential
 and strong “Retail Trade Areas”; one servicing            development may not yet exist in a format that
 Truro and one servicing Halifax, Dartmouth                necessarily will usurp the dominance of the
 and Lower Sackville. The drive times of around            automobile. As a bedroom community, the role
 30-minutes to each have made this possible. As            of the automobile, in the absence of transit, will
 will be seen in this study however, there is a valid      still be dominant and form the foundation for
 market-driven opportunity towards the end of              most retail and commercial developments.
 the next decade for Elmsdale to become a self-
 sufficient retail trade area of its own, that will        Therefore, opportunities in the near term for
 create a more powerful presence for residents             retail, given the nature of the commuting
 and businesses within a 20-minute drive time.             patterns and regional nodes (i.e. larger retail
                                                           destinations like Dartmouth Crossing) suggests
 Over the past decade traffic counts throughout            an auto-oriented environment for retail will
 the Hwy 102 corridor have steadily increased              follow a path of specifically desired businesses
 whereby volumes now consistently and easily               the developers and brokers can secure.
 surpass 10,000 Average Annual Daily Traffic
 (AADT) and these counts continue to migrate

                                           Retail Market Analysis - Municipality of East Hants, Nova Scotia   |   ii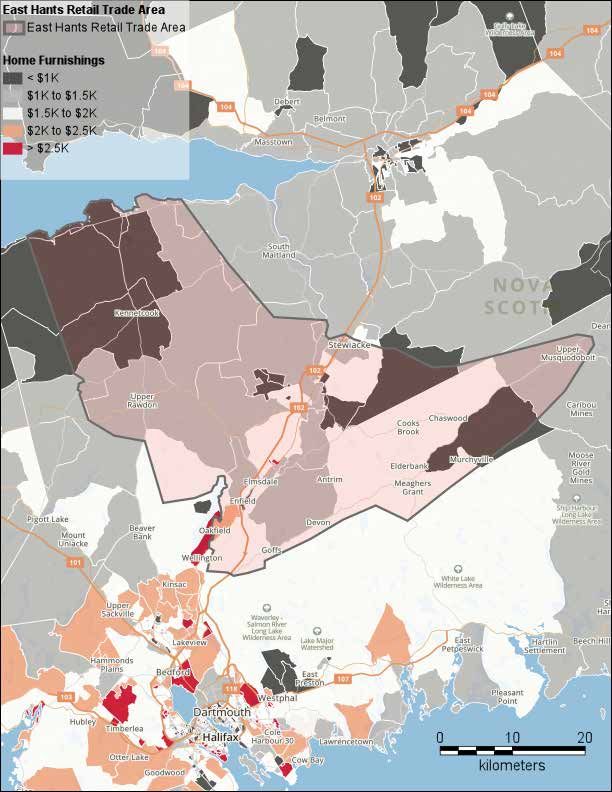
ii           EXECUTIVE SUMMARY

          An opportunity for East Hants, in advance of the                The patterns of population growth over the
          next evolution of retail demand over the next 5                 period 2017 to 2022 along with current density
          to 10 years would be to improve the wayfinding                  centroids as shown in Figures 3.2 and 3.3 reveals
          and a streetscape improvement program in the                    that growth is expected to continue migrating
          Village Cores, and in particular the Elmsdale                   north from the City and Halifax Regional
          Village Core to make the building frontages and                 Municipality (HRM) towards the Hwy 102 corridor
          streetscape more inviting and pedestrian-friendly.              and the communities of Enfield, Elmsdale and
          Decisions like this will make the Village Core a                Lantz, which bodes well for future residential
          more attractive and compact locale as well as                   and retail prospects in the region over the next
          making it competitive to other alternatives that                decade.
          will choose to locate at or near the Hwy 102/Rte
          214 interchange.                                                The Total Trade Area population is estimated
                                                                          for 2017 to be almost 26,670. This population
          RETAIL TRADE AREA SUMMARY                                       is forecast to grow at moderate rates over the
          In order to create a framework for evaluating retail            next decade and conservatively surpass 29,000
          demand and subsequent gaps in the provision of                  by 2027. This pace of population growth is
          shops and services, it is necessary to define and               considered conservative as it doesn’t take into
          identify the Trade Area from which East Hants’                  account potential economic-driven interventions
          retail sales are most frequently and likely to be               at the local and provincial level.
          sourced and generated. This is referred to as the
          “Retail Trade Area”. The resulting Trade Area for               As the Trade Area evolves, the aspirational nature
          East Hants, which focuses on the Hwy 102 corridor               of the market will become increasingly more
          in and around Elmsdale comprises a singular                     evident as the market attracts younger working
          trade area, rather than having multiple trade areas             families with a higher income and capacity/
          as would be common for a larger market. The                     propensity for more spending on categories other
          rationale behind this is influenced by the fact that            than conveniences.
          East Hants and Elmsdale in particular is currently
          located at overlap of two larger trade areas (Truro
          and Lower Sackville), which limitsCommunity
siness Name                                    the extent of              RETAIL    MARKET SNAPSHOT
                                                                           General Retail Category
                                                                                                                                    Est. Area
                                                                                                                                                  NAICS Sector #
          the resident market, though it does not discount                                                                            (SF)
          the nature of passing motorists traveling along
                                                                                                                         TOTAL          452,931 sq. ft.
          Hwy 102.
                                                                          TOTAL RETAIL (Excluding Non-Retail Streetfront)               444,931 sq. ft.
          As observed previously and given the growth
          forecasts for the Elmsdale/Enfield/Lantz/Milford
          corridor, it is not inconceivable to see the Retail                                                           VACANT           15,068 sq. ft.
          Trade Area evolve into a much more self sufficient
                                                                                                                    % VACANT
          prominent trade area of its own that has fewer                                   (of ALL streetfront commercial space)
                                                                                                                                           3.3%
          competitive limitations and greater resident retail
                                                                                                          Retail Space Per Capita
          spending capture/market share.                                                                                                    19.8 sq.ft./capita
                                                                                     (against East Hants Population 22,453 2016)

          iii      |   Key Planning Strategies & Cushing Terrell Architecture Inc.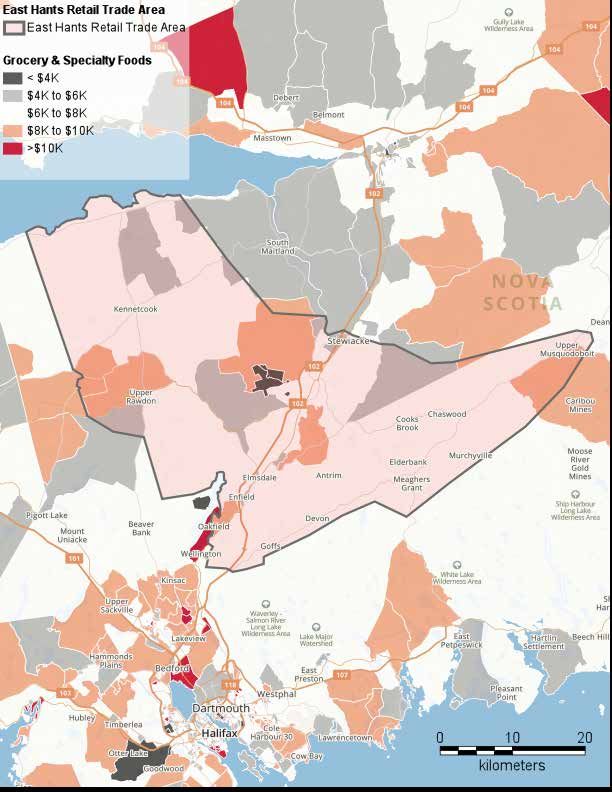
ii
 EXECUTIVE SUMMARY

     RETAIL TRADE AREA
     East Hants Retail Trade Area
        East Hants Retail Trade Area

     Residential Population Density
        1 dot = 100

     2017 to 2022 Pop Growth %
        < 0%
        0% to 5%
        5% to 10%
        10% to 15%

                                                                                          0       5        10
                                                                                              kilometers

                                       Retail Market Analysis - Municipality of East Hants, Nova Scotia     |   iv
iiEXECUTIVE SUMMARY
The Halifax and wider region’s future growth is Overall, the Municipality of East Hants has an
being predicated on attracting young families estimated streetfront floor space in the range
and retaining an educated youthful workforce for of 453,000 sf. This floor space is comprised of
whom other areas in the country may not offer business types that range from Grocery to Home
the quality of life and affordability attributes. Improvement, Restaurants, Personal Services
such as Salons as well as Professional Services.
Average Household Income in the Trade Area
is forecast to grow over the 5-year period
The overall vacancy rate for the retail area
2017 to 2022, to an estimated $93,000, in
inventoried and documented is estimated at just
conjunction with an improving provincial
economy. Approximately 25% of households over 3% which is below the industry standard for
have an average Household Income of between a healthy retail market that should be in the 4%
$60,000 and $100,000. Although the dominant to 5% level and thus suggests that there could
income brackets are as noted, there is a relatively be demand and opportunity for compatible
large component of the Total Trade Area (16%) retailers.
that have an average Household Income over
$125,000. Thus, the overall income profile Overall, the market would seem to be in balance
represents overall economic health and stability with the magnitude of spending and demand.
for retail opportunities. Well-located spaces along the east and west
sides of the Hwy 102 corridor at Elmsdale with
East Hants’ retail trade area has a spending profile
high visibility and as such have the potential
of almost $300 M in 2017 and is forecast to
to tap into not just the expected growing local
surpass $350 M by 2027.
market, but passing motorists and an evolving
The most consistent finding in Trade Area captive workforce in time. Elmsdale’s retail
spending is a noticeable northward migrating vacancy sits at 2.5% which is indicative of latent
trend of increasing spending that is soon to fall demand, particularly given that Elmsdale has
within the core area of the East Hants’ Hwy 102 approximately 67% of the Municipality’s retail
corridor Retail Trade Area. inventory.
RETAIL SUPPLY SUMMARY Consistent with an evolving retail community,
the Top 5 retail categories in terms of overall retail
The East Hants retail market comprises the floor space in East Hants are:
current streetfront retail businesses within the
jurisdictional boundary of the Municipality of 1. Grocery & Specialty Foods 130,040 sf
East Hants (as distinct from the delineated retail 2. Home Improvement & Gardening 58,423 sf
trade area). Retail floorspace is documented 3. Restaurant F&B 41,991sf
for each of the respective communities that 4. Specialty Retail 27,454 sf
comprise the Municipality - Enfield, Elmsdale,
5. Pharmacy 22,493 sf
Milford, Lantz, Shubenecadie, Mt Uniacke and
Kennetcook.
v | Key Planning Strategies & Cushing Terrell Architecture Inc.ii EXECUTIVE SUMMARY
East Hants is starting to slowly increase its If East Hants were to increase its current market
offerings within the Comparison or Department share penetration by 7% from an estimated
Store Type Merchandise Categories (DSTM), 34% to 41%, then the total demand by the year
though it is still expected that a further 2022, without new population growth could be
concentration or attraction of more notable approximately 99,000 sf.
brands is approximately 5 years away from
gaining traction. While certain merchandise If East Hants were to continue to increase its
categories may be worth pursuing in certain market share penetration from 2022 to 2027
circumstances, the majority of residents by 10% from an estimated 41% to 51%, then
nonetheless will continue to be drawn to the the incremental new demand by the year 2027,
Lower Sackville, Dartmouth Crossing or Truro without new population growth could be an
retail destinations. additional 129,000 sf.
The estimated retail space per capita ratio for the
Therefore, the cumulative impact of increasing
East Hants’ retail trade area is in the range of 20
market share from the current levels today of
sf/capita which includes all retail space.
34% to 50% 2027 could result in new demand for
If the industry standard space per capita of 20 approximately 227,000 sf of retail space.
sf were to be applied to population growth in
the Trade Area, the future additional retail space In combination with increased market shares of
supportable by new population growth by retail spending and natural demand attributed to
2027 could be approximately 50,000 sf. This is a population growth, East Hants’ Retail Trade Area
conservative figure that considers no economic could add in the range of 225,000 to 275,000 sf of
development or developer-driven interventions, new retail space by 2027.
but nonetheless would be an indicator at the
lower end of the spectrum whereby if population CONCLUSION
growth were to exceed current forecasted levels,
On the basis of the retail market analysis,
the resultant demand would increase accordingly.
the East Hants market is most accurately
characterized with cautious optimism as it
RETAIL DEMAND SUMMARY
pertains to its retail growth outlook.
East Hants currently garners only 34% market Overall the retail market is in already positioning
share of the total trade area retail spending, itself as a strong local convenience destination,
suggesting retail leakage of 66%. but it is soon to reach the tipping point to
becoming a more self-sufficient retail market
The key to East Hants’ future retail opportunity for the gradual introduction of more general
lies in incrementally and slowly increasing the merchandise and food & beverage offerings
overall market share of sales, realizing that the as well as specifically targeted comparison or
Trade Area for the Hwy 102 corridor is rapidly DSTM type categories/stores.
evolving into its own self-serving Retail Trade
Area.
Retail Market Analysis - Municipality of East Hants, Nova Scotia | viii EXECUTIVE SUMMARY
2022 TARGETED RETAIL MARKET SHARE AND RESULTING DEMAND FORECAST
2022
Miscellaneous 2022
2022 2022 2022
Spending 2022 Potential Net
Merchandise Category Total Trade Area Target Market Estimated
Potential Retail Future Retail
Inflow Factor 1 Retail Spending Share of Retail Retail Sales $
Inventory Floorspace
(with Misc Inflow) Spending (Inflow) 2
Demand
5% Grocery & Specialty Foods $78,933,618 75% $59,200,214 148,001 17,961
5% Pharmacy $9,234,146 85% $7,849,024 26,163 3,670
5% Alcohol & Tobacco $19,485,111 55% $10,716,811 23,815 4,815
5% Personal Services $14,495,599 20% $2,899,120 16,566 6,483
0% Clothing & Apparel $24,502,775 5% $1,225,139 6,126 4,366
0% Footwear $5,832,922 5% $291,646 1,458 1,256
0% Jewelry & Accessories $3,817,298 5% $190,865 1,527 1,527
0% Health & Beauty $7,060,312 5% $353,016 2,017 2,017
5% Home Furnishings & Accessories $20,951,224 10% $2,095,122 11,972 8,331
0% Home Electronics & Appliances $16,260,114 25% $4,134,966 27,566 2,547
10% Home Improvement & Gardening 4 $11,853,893 95% $11,264,932 64,371 5,948
0% Books & Multimedia $5,100,991 5% $255,050 1,700 1,700
0% Sporting Goods & Recreation $3,366,879 20% $673,376 5,387 1,068
0% Toys & Hobbies $3,862,340 10% $386,234 3,090 1,071
5% Miscellaneous Specialty $10,652,964 45% $4,793,834 38,351 10,897
10% Restaurant F&B $20,289,109 50% $10,144,554 50,723 8,732
5% Drinking Establishments $3,227,813 60% $1,936,688 15,494 3,494
0% Entertainment & Leisure $10,798,787 15% $1,597,620 15,976 1,476
5% Auto Parts & Accessories $6,266,450 55% $3,446,547 22,977 4,688
10% Auto/RV/Motorsports Dealership $63,233,150 5% $3,161,657 10,539 6,839
$339,225,495 41% $126,616,414 493,819 98,887
2027 TARGETED RETAIL MARKET SHARE AND RESULTING DEMAND FORECAST
2027
2027 2027
Miscellaneous 2027 2027 2027 Potential Potential
Spending 2027
Merchandise Category Total Trade Area Target Market Estimated Incremental Net Cumulative Net
Potential Retail
Inflow Factor 1 Retail Spending Share of Retail Retail Sales $ Future Retail Future Retail
Inventory
(with Misc Inflow) Spending (Inflow) 2 Floorspace Floorspace
Demand Demand 5
5% Grocery & Specialty Foods $86,301,096 80% $69,040,877 172,602 24,602 42,562
5% Pharmacy $10,096,039 85% $8,581,633 28,605 2,442 6,112
5% Alcohol & Tobacco $21,303,806 65% $13,847,474 30,772 6,957 11,772
5% Personal Services $15,848,584 25% $3,962,146 22,641 6,074 12,558
0% Clothing & Apparel $26,789,807 15% $4,018,471 20,092 13,967 18,333
0% Footwear $6,377,353 10% $637,735 3,189 1,730 2,987
0% Jewelry & Accessories $4,173,596 10% $417,360 3,339 1,812 3,339
0% Health & Beauty $7,719,305 10% $771,931 4,411 2,394 4,411
5% Home Furnishings & Accessories $22,906,762 15% $3,436,014 19,634 7,662 15,994
0% Home Electronics & Appliances $17,777,794 30% $5,333,338 35,556 7,989 10,536
10% Home Improvement & Gardening 4 $12,960,308 95% $12,316,374 70,379 6,008 11,956
0% Books & Multimedia $5,577,106 10% $557,711 3,718 2,018 3,718
0% Sporting Goods & Recreation $3,681,136 25% $920,284 7,362 1,975 3,043
0% Toys & Hobbies $4,222,842 15% $633,426 5,067 1,978 3,048
5% Miscellaneous Specialty $11,647,287 50% $5,823,643 46,589 8,238 19,135
10% Restaurant F&B $22,182,846 55% $12,200,565 61,003 10,280 19,012
5% Drinking Establishments $3,529,089 70% $2,470,362 19,763 4,269 7,763
0% Entertainment & Leisure $11,806,721 15% $1,746,738 17,467 1,491 2,967
5% Auto Parts & Accessories $6,851,345 60% $4,110,807 27,405 4,428 9,117
10% Auto/RV/Motorsports Dealership $69,135,183 10% $6,913,518 23,045 12,506 19,345
$370,888,005 51% $157,740,409 622,641 128,822 227,709
vii | Key Planning Strategies & Cushing Terrell Architecture Inc.The retail market analysis for the Municipality of East Hants recognizes the importance that economic-development driven, market- driven and developer-driven dynamics can have on a market’s respective opportunity. This study reflects cautious optimism whereby projections are premised without economic- development interventions, which can often stimulate even further opportunities.
1.0
    introduction
1.1                                                            Section 4 - Retail Supply:
SCOPE OF STUDY &                                               Assesses the location and characteristics of East
PROJECT BACKGROUND                                             Hants’ current nodes of retail activity (“supply”),
Cushing Terrell was commissioned by the                        including developing or future planned retail
Municipality of East Hants (“East Hants”)                      sites. Fieldwork assessments included identifying
to conduct a Retail Market Analysis for the                    and quantifying the entire East Hants retail
Municipality, with a focus on the Hwy 102                      inventory by retailer, merchandise category and
Corridor. The objective of this study is to                    NAICS industry classification.
thoroughly document East Hant’s current retail
inventory and define the realistic retail Trade                Section 5 – Retail Demand:
                                                               Quantifies the Trade Area spending and sales
Area area for which it serves today and is likely
                                                               productivities, resulting in “demand” associated
to serve over the next decade. The end result is
                                                               with each retail category over the next 5 and 10
to fill gaps and bolster the local retail market by
                                                               year increments for East Hants, with a focus on the
retaining or attracting greater market share of                Hwy 102 Corridor (Enfield/Elmsdale/Milford).
resident and passing motorists’ spending in the
community.                                                     1.3
                                                               SOURCES OF INFORMATION
1.2                                                            During the course of this study, a number of
REPORT STRUCTURE                                               resources were used to quantify retail market
Cushing Terrell conducted on-the-ground                        supply and demand conditions largely comprising
research in December 2017 to gain a firm                       primary and secondary research.
understanding of existing and future retail
prospects in East Hants. The purpose of this                   The following primary sources of information
research was to establish a solid foundation                   were used in this Retail Market Analysis:
and baseline for determining the depth of retail               • Province of Nova Scotia Traffic Volume History
opportunity, associated gaps in the market                     • Cushing Terrell/Key Planning Retail Inventory
provision of shops and services. The document is                   Fieldwork, December 2017.
presented in the following sections:                           • SitewisePro - Utilizing Pitney Bowes
                                                                   Demographics & Spending Data, 2017
Section 1 - Introduction:                                      • Statistics Canada
Introduces the study process and structure.                    • Municipality of East Hants
Section 2 - Location Context:                                  • Ryerson University Centre of Study for
Lays out the important regional and local context                  Commercial Activity
of the Municipality of East Hants and the Hwy 102              • International Council of Shopping Centers
Corridor in terms of geographic location, traffic
counts and future growth plans.                                The consulting team would also like to thank
                                                               the following for their valuable input on the East
Section 3 - Retail Trade Area Profile:                         Hants retail market and opportunities:
Identifies and defines the Retail Trade Area and               • Ryan Barkhouse - Director of Development
documents the population and expenditure                           Armco Capital
profiles generated from within these respective                • Laura Masching - Planner Armco Capital
trade areas, against which estimates of floor space            • Angela Cormier - Leasing Mgr Crombie REIT
demand can be attributed.                                      • Kevin Neatt - Director Planning &
                                                                   Development, Shaw/Clayton Developments.

1       |   Key Planning Strategies & Cushing Terrell Architecture Inc.
2.0
location context
2.1 The Airport has been very proactive in preparing
INTRODUCTION for and setting the stage for future groundside
Location factors are an essential foundation to commercial development. Presently, the Airport
retail success, and an understanding of these is actively marketing the Stanfield Landing
factors can help create the necessary conditions
retail development in the core of the airport
for attracting and retaining retail businesses in
near the terminal. This development is likely to
a community. This section identifies East Hants’
regional and local characteristics as they relate to provide shops and services for the on-site and
the attraction and retention of retail businesses adjacent Aerotech Business Park workforce as
and merchandise categories, with an eye to well as airport travelers. The Airport has also
future growth opportunities. been investigating the prospects of providing
2.2 larger scale regional retail on its lands fronting
LOCAL & REGIONAL CONTEXT Hwy 102. This could be a competitive threat
The Municipality of East Hants consists of to retail along the Hwy 102 corridor in East
466,426 acres of land, and includes 11 districts. Hants. However, this remains a longer term play
The most prominent of the districts are along for HIAA and may not be in the most optimal
Hwy 102, which is often referred to as “the location considering trade area overlap and
corridor” and is the rapidly evolving nexus from future growth along the corridor.
which the 10, 20 and 30-minute drive times
emanate and more importantly the epicentre of
future retail. Retail shops and services of a larger scale
including larger format and junior box retailers
East Hants, and in particular the districts are congregating in Elmsdale at the interchange
of Elmsdale, Enfield, Lantz, Milford and of Hwy 102 and Rte 214 and include Grocery,
Shubenecadie, along the Hwy 102 corridor are Pharmacy, Home Improvement, Quick Service
traditional bedroom communities.
Food & Beverage (F&B) and Personal Services such
as banks and Financial Services.
The Municipality of East Hants is encouraging
commercial development along the highway Elsewhere in the East Hants, smaller communities
where appropriate, and locally where
such as Kennetcook, Enfield, Milford and
commercial areas are already established, unless
Shubenecadie play an important role in providing
otherwise approved.
local “village” scale shops and services set in the
Although not in the Municipality, the proximity framework of a traditional main street culture.
of the Halifax International Airport (HIAA)
It is essential that these nodes be maintained and
is a significant asset that provides a closer
employment centre for residents of the enhanced where possible at a scale that is not
municipality. too large, but rather concentrated and walkable,
thereby providing a viable alternative to larger
retail that is likely to be more expensive.
Retail Market Analysis - Municipality of East Hants, Nova Scotia | 2Figure 2.1 10-20-30 MINUTE DRIVE TIME FROM JUNCTION OF HWY 102 & RTE 214 3 | Key Planning Strategies & Cushing Terrell Architecture Inc.
The Hwy 102 corridor benefits from
                      significant traffic counts that continue to
                      trend upwards and beyond 15,000 vehicles
                      per day in the vicinity of the emerging
                      Elmsdale retail cluster.

Local village nodes should focus on providing a         The most recent 2016 data documented in the
mix of 80% local to 20% branded, whereas the            form of Average Annual Daily Traffic (AADT) from
larger Hwy 102 corridor should represent a mix of       this Provincial source is shown in Figure 2.2 and
80% branded to 20% local.                               summarized as follows:
Until recently, Elmsdale has been sandwiched
                                                        1) Hwy 102 Exit 5 Interchange to Exit 5A
between, or at the periphery of two (2) existing
and strong retail trade area; one servicing Truro       Aerotech Park Interchange (2016)
and one servicing Halifax, Darmouth and Lower             Northbound = 21,500 AADT
Sackville. The drive times of around 30-minutes           Southbound = 22,700 AADT
to each have made this possible. As will be seen
                                                        2) Hwy 102 Exit 5A Aerotech Interchange to
in this study however, there is a valid market-
                                                        Exit 6 Halifax Int’l Airport Interchange (2016)
driven opportunity towards the end of the next
decade for Elmsdale to become a self-sufficient           Northbound = 23,400 AADT
retail trade area of its own, that will create a
                                                        3) Hwy 102 Exit 6 HIAA Interchange to Exit 7
more powerful presence for residents within a
                                                        Enfield Interchange (2014)
20-minute drive time.
                                                          Northbound = 16,000 AADT
2.3                                                       Southbound = 16,300 AADT
TRANSPORTATION CONTEXT
One of the most significant aspects to successful       4) Hwy 102 Exit 7 Enfield Interchange to Exit
commercial development relates to patterns              8 Rte 214 Elmsdale Interchange (2016)
of transportation. The ability to be accessible           Northbound = 14,200 AADT
as well as visible to high volumes of traffic are         Southbound = 14,040 AADT
among the most influential considerations for
retail businesses.                                      5) Rte 214 Elmsdale to Lantz (2016)
                                                          5,040 AADT
For a suburban or smaller secondary market such
as East Hants, a retail location relative to strong     6) Hwy 102 Exit 8 Rte 214 Elmsdale
and accessible transportation patterns remains          Interchange to Exit 9 Milford (2016)
an important component. This may be slightly              Northbound = 11,060 AADT
less essential for a local independent business.          Southbound = 11,600 AADT
                                                        7) Hwy 102 Exit 9 Milford to Exit 10 Rte 215
However, it is paramount for some of the more
recognized brand that it have access to as much         Shubenecadie (2016)
customer base as necessary, largely because the           Northbound = 11,900 AADT
cost overhead of either acquiring a Franchise             Southbound = 11,900 AADT
License or operating as a corporate entity has a
bottom line that must be adhered to.                    Traffic counts are important considerations
The Province of Nova Scotia through its                 for retailers and in particular branded or chain
OpenData website (data.novascotia.ca) provides
                                                        retailers.
detailed traffic counts on provincial highways
and interchanges.

                                        Retail Market Analysis - Municipality of East Hants, Nova Scotia   |   4
Figure 2.2
EAST HANTS AADT TRAFFIC COUNTS - HWY 102 CORRIDOR
(Source: data.novascotia.ca - Traffic Volumes - Provincial Highway System 2016)
7
6
5
4
3
2
1
5 | Key Planning Strategies & Cushing Terrell Architecture Inc.The anticipated concentration of new
residential formats and commercial activity
in and around the Enfield/Elmsdale/Lantz/
Milford corridor provides a foundation for
which an employment centre can succeed.
Over the past decade traffic counts throughout The anticipated concentration of new residential
the Hwy 102 corridor have steadily increased formats and commercial activity in and around
whereby volumes now consistently and easily the Enfield/Elmsdale/Lantz/Milford corridor
surpass 10,000 AADT and these counts continue provides an optimal foundation for which an
to migrate higher north in-step with regional employment centre can succeed. In fact, all
demand and growth, driven in large part to the these components have the great potential to
employment activity spurred by the nearby work together in creating a diverse and self-
presence of the Halifax International Airport. In sustaining retail market that will be attractive for
particular, the interchange at Elmsdale is now retail tenants; both recognized chains and local
averaging just under 15,000 AADT. independents.
In addition to traffic counts it is also worth noting The Municipality of East Hants has in its LUB
that the Province and Municipality are finalizing established commercial designations for:
plans for a new Hwy interchange and overpass
to be located at Lantz. This future Exit 8A will GC - General Commercial
provide additional access and egress to future HC - Highway Commercial
residential on both sides of Hwy 102. RC - Regional Commercial
BP - Business Park
From a retail perspective, these traffic volumes IC - Industrial Commercial
are considered attractive for prospective retailers
for whom benchmarks of consistent volumes Further, East Hants recognizes an important
of daily traffic are a requirement, particularly role that mixed-use will play in the longer
given the continued pattern of growth along this term vision by allocating for MC - Mixed Use
corridor for residents and visitor flow. Centre, VC - Village Core and WCDD - Walkable
Comprehensive Development District land uses.
2.4 The WCDD Land Use Designation is aspirational
GROWTH MANAGEMENT AREAS whereby the current status of East Hants’
Referring to Figures 2.3 and 2.4, East Hants’ development evolution suggests that achieving
Municipal Planning Strategy identifies a number WCDD in the near term (i.e. next 5 years) will
of Growth Management Areas (GMAs), most be challenging, but over the next 5 and more
of which are positioned strategically along the likely 10-20 years this form of land use will
Hwy 102 corridor. There is one Land Use Bylaw become increasingly more attractive for mixed
(LUB) adopted in July 2016 that controls land commercial and residential formats laid out in a
uses in the GMAs. It is clear from the LUB and pedestrian-oriented environment.
the GMAs that Hwy 102 is a core focus for future
residential and commercial growth as well as for While other similar Halifax region communities
the creation of a regional employment centre. may continue with a traditional model of
suburban growth, East Hants is at the forefront
Retail Market Analysis - Municipality of East Hants, Nova Scotia | 62
Village Cores like Elmsdale
and Enfield represent a link to
the past and are essential for
providing the place-making
necessities of a community.
of progressive thinking that encourages an The Village Cores, most notably those in
option for walkable, pedestrian oriented Elmsdale, Enfield and Milford and to a lesser
neighbourhoods that would also be marketable degree in Shubenecadie and Kennetcook will
to a wide array of demographics including be at the greatest risk as desired commercial
young families, millennials, baby boomers, growth occurs in Elmsdale. Therefore, a strategy
retirees and seniors. should be employed, as envisioned in the LUB
for Mixed-Use, that promotes more compact,
There is a reality of the East Hants region,
walkable Village Cores, using the buildings and
from a market-driven and developer-driven
historic attributes where possible to provide
perspective that over the next 5-10 years single
family housing will still be sought after, but the viable venues for local businesses that won’t be
rise of duplex or townhome/rowhousing is on able to afford the lease rates at new nodes or
the horizon. These latter formats are all likely even new mixed-use in future WCDDs.
to gain favour in conjunction with medium
density or low-rise multi-family which would The existing Village Cores represent a
be the basis for MC and WCDD areas. Multi- connection to the past for local shops and
family residential will become more popular in services that cannot be overlooked for the role
the market over time, particularly if options are they play in often providing the place-making
made available. necessities of a community. Every effort should
be made to ensure these valuable assets are
In the near term and for the next 10+ years, this maintained, even if at smaller scales where true
particular study realizes the more nascent status
pedestrian mobility can be prioritized and local
of the Hwy 102 corridor whereby rooftops
businesses can be incubated.
and residential development may not yet
exist in a format that necessarily will usurp the
dominance of the automobile. An opportunity for East Hants, in advance of the
next evolution of retail demand over the next 5
As a bedroom community, the role of the to 10 years would be to improve the wayfinding
automobile, in the absence of transit, will still and a streetscape improvement program in the
be dominant and form the foundation for Village Cores, and in particular the Elmsdale
most retail and commercial developments. Village Core to make the building frontages
This doesn’t preclude the need to ensure and streetscape more inviting and pedestrian-
compatibility for walkability and mobility. friendly. Decisions like this will make the Village
Core a more attractive and compact locale as well
Therefore, opportunities in the near term for as making it competitive to other alternatives
retail, given the nature of the commuting that will choose to locate at or near the Hwy 102/
patterns and regional nodes, suggests an auto-
Rte 214 interchange.
oriented environment for retail will follow a path
of specifically desired businesses the developers
and brokers can secure.
7 | Key Planning Strategies & Cushing Terrell Architecture Inc.Figure 2.3
EAST HANTS LAND USE BYLAW MAP
Retail Market Analysis - Municipality of East Hants, Nova Scotia | 82 Figure 2.4 EAST HANTS SOUTH CORRIDOR AND COMMERCIAL GROWTH MANAGEMENT AREA 9 | Key Planning Strategies & Cushing Terrell Architecture Inc.
Photo courtesy of Cushing Terrell Architecture Inc.

Retail Market Analysis - Municipality of East Hants, Nova Scotia   |   10
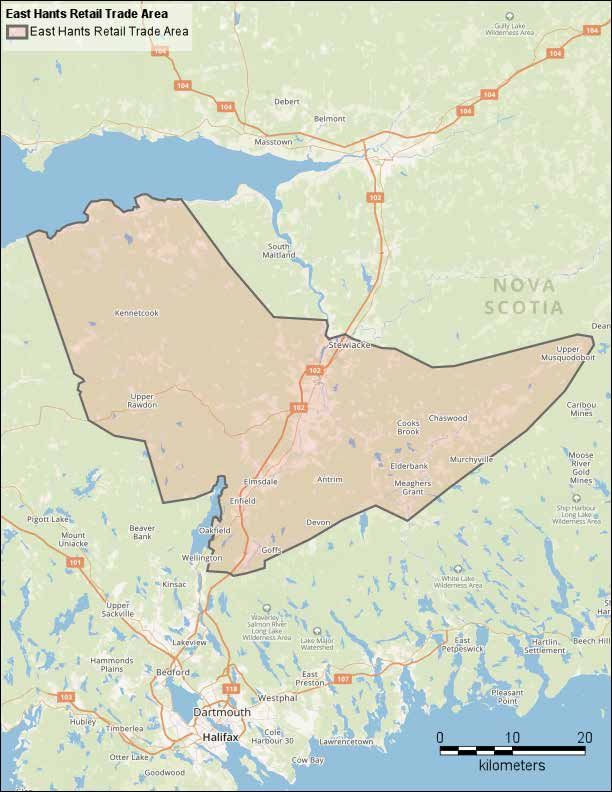
3.0
   retail trade area
3.1                                                            Major considerations in defining a Retail Trade
INTRODUCTION                                                   Area were applied to the Municipality of East
In order to create a framework for evaluating retail           Hants, as the retail centrality to determine its most
demand and subsequent gaps in the provision of                 realistic Trade Area, as well as to help sensitize
shops and services, it is necessary to define and              potential market share inputs of corresponding
identify the Trade Area from which East Hants’                 Trade Area retail spending.
retail sales are most frequently and likely to be
sourced and generated.                                         Retail Trade Area Determinants

The Trade Area recognizes drive times,                          i.   Transportation networks, including
demographics, spending attributes and                                streets and highways, which affect access,
competition, which collectively portray the                          drive times (Figure 3.1), commuting and
market to prospective tenants, developers and                        employment distribution patterns;
investors.
                                                                ii. Major infrastructure projects both planned
                                                                    or under development which could affect
Identifying the Trade Area is important for
                                                                    future travel patterns;
understanding the total market potential
available to current and future retailers. The                  iii. Overall Community development vision,
local and regional residential base has particular                   including an understanding of key nodes’
demographic and spending habits that provide                         characteristics;
insight as to the type of compatible retail tenants,
the amount of retail floor space supportable in                 iv. Local and regional competitive
the market, and the current inflow or outflow of                    environment, present and future;
retail sales, and for which categories such inflow
or outflow exists.                                              v. Proposed generative uses (retail, cultural,
                                                                   civic, etc.) and their relationship within the
As a first step, a Trade Area was delineated to                    wider market;
identify the geographic region from which
                                                                vi. Significant natural and constructed barriers
regular patronage could be expected, based on
                                                                    (e.g. water features, highways and industrial
a series of boundary determinants. This Trade
                                                                    areas);
Area is shown in Figure 3.1 and also provides a
visual representation in a general sense of how                 vii. De facto barriers resulting from notable
the Trade Area itself represents a centrality for                    socioeconomic differentiation;
residents to the north, south, east and west. In
particular it shows the proximity of population                 viii. Patterns of existing and future residential and
and resulting spending along the Hwy 102                              commercial development; and
corridor.
                                                                ix. Economic realities, such as provincial retail
                                                                    sales taxes, if and where applicable.

11      |   Key Planning Strategies & Cushing Terrell Architecture Inc.
Figure 3.1
EAST HANTS RETAIL TRADE AREA
(Emphasis on the Hwy 102 Corridor comprising Enfield/Elmsdale/Lantz/Milford)
HOUSEHOLDS: 2,349
POPULATION: 5,794
RETAIL SPENDING: $63.1 M
HOUSEHOLDS: 1,749
POPULATION: 4,417
RETAIL SPENDING: $44.9 M
HOUSEHOLDS: 1,049
POPULATION: 2,732
RETAIL SPENDING: $29.6 M
HOUSEHOLDS: 5,256
POPULATION: 14,119
RETAIL SPENDING: $156.1 M
Retail Market Analysis - Municipality of East Hants, Nova Scotia | 12Figure 3.2
EAST HANTS RETAIL TRADE AREA WITH POPULATION DENSITY & GROWTH
FORECASTS FOR 2017 TO 2022
East Hants Retail Trade Area
East Hants Retail Trade Area
Residential Population Density
1 dot = 100
2017 to 2022 Pop Growth %
< 0%
0% to 5%
5% to 10%
10% to 15%
0 5 10
kilometers
13 | Key Planning Strategies & Cushing Terrell Architecture Inc.Inter-provincial migration
should be pro-actively
targeted to achieving strong
population growth.
Table 3.1
TRADE AREA DEMOGRAPHIC SUMMARY
(Source: Pitney Bowes 2017 and Cushing Terrell Architecture Inc.)
East Hants East Hants
2017 Demographic Snapshot Halifax, NS Nova Scotia
Retail Trade Area (MD), NS
% % % %
2011 Census* 26,206 22,611 402,440 944,464
2017 Population estimate 26,670 22,707 426,842 951,970
2020 Population projection 27,444 23,253 446,268 977,364
2022 Population projection 27,959 23,614 459,171 994,261
2027 Population projection 29,085 24,381 490,629 1,032,435
Total % Population Change (2011-17) 1.8% 0.4% 6.1% 0.8%
Total % Population Change (2017-27) 9.1% 7.4% 14.9% 8.5%
2017 Population by Age 26,670 22,707 426,842 951,970
0 to 4 years 1,496 6% 1,239 5% 20,601 5% 44,162 5%
5 to 19 years 4,884 18% 4,022 18% 61,420 14% 140,260 15%
20 to 24 years 1,514 6% 1,306 6% 30,117 7% 59,742 6%
25 to 34 years 2,982 11% 2,445 11% 69,210 16% 119,088 13%
35 to 44 years 3,503 13% 2,903 13% 59,956 14% 114,957 12%
45 to 54 years 4,296 16% 3,665 16% 60,096 14% 135,996 14%
55 to 64 years 3,959 15% 3,686 16% 59,088 14% 148,649 16%
65 to 74 years 2,555 10% 2,188 10% 40,206 9% 112,244 12%
75 to 84 years 1,151 4% 996 4% 18,280 4% 54,451 6%
85 years and over 330 1% 257 1% 7,868 2% 22,421 2%
Median Age 42.2 43.3 40.2 44.8
2017 Families 8,308 7,116 126,446 291,888
Married couples 5,797 70% 5,181 73% 84,478 67% 197,528 68%
Without children at home 2,667 32% 2,522 35% 39,886 32% 103,732 36%
With children at home 3,130 38% 2,659 37% 44,592 35% 93,796 32%
Common-law couples 1,153 14% 1,033 15% 18,818 15% 40,550 14%
Without children at home 658 8% 611 9% 12,667 10% 24,837 9%
With children at home 495 6% 422 6% 6,151 5% 15,713 5%
Lone-parent families 1,358 16% 902 13% 23,150 18% 53,810 18%
Average Persons Per Family 2.8 2.8 2.7 2.7
Average Children Per Family 1.0 0.9 0.9 0.8
2017 Households 10,220 8,781 183,088 409,846
Persons per household 2.6 2.6 2.3 2.3
Average household income $ 83,872 $ 83,980 $ 90,673 $ 78,359
Median Estimated Household Income $ 59,827 $ 59,706 $ 63,578 $ 53,230
Retail Market Analysis - Municipality of East Hants, Nova Scotia | 143
Elmsdale is well-positioned
to become a self-sustaining
retail trade area as growth
continues north along the
Hwy 102 corridor.
For this particular study, the Retail Trade The Municipality of Hants’ most recent census
Area shown in Figures 3.1 and 3.2 utilized a data from the February 2017 Statistics Canada
combination of drive times and competitive forces release revealed an increasing population from
(e.g. Truro to the north and Lower Sackville to the 22,111 in 2011 to 22,453 (not including Indian
south). Because of the competitive influences to Brook) for 2017, representing an increase of 1.2%.
the north and south, the Retail Trade Area takes
and east-west orientation, whereby communities The patterns of population growth over the
more remote in the Municipality of East Hants and period 2017 to 2022 along with current density
neighbouring Halifax Regional Municipality are centroids as shown in Figures 3.2 and 3.3 reveals
included since their access to the north and south that growth is expected to continue migrating
is not as easy as it is to the Hwy 102 corridor at north from the City and Halifax Regional
Elmsdale. Municipality (HRM) towards the Hwy 102 corridor
and the communities of Enfield, Elmsdale and
The resulting Trade Area for East Hants, which Lantz, which bodes well for future residential
focuses on the Hwy 102 corridor in and around and retail prospects in the region over the next
Elmsdale comprises a singular trade area, rather decade.
than having multiple trade areas as would be
common for a larger market. The rationale behind Utilizing a trade area approach as shown in
this is influenced by the fact that East Hants Figures 3.1 and 3.2 and documented in Tables
and Elmsdale in particular is currently located 3.1 to 3.4 provides a more accurate depiction
at overlap of two larger trade areas (Truro and of the Total Trade Area for East Hants’ retail
Halifax, Dartmouth, Lower Sackville), which limits environment rather than being solely dependent
the extent of the resident trade area, though it upon the smaller localized population base.
does not discount the nature of passing motorists
traveling along Hwy 102. To that end, Tables 3.1 & 3.2 provide a
breakdown of the Retail Trade Area population
As observed previously and given the growth and one that is much more appealing to
forecasts for the Elmsdale/Enfield/Lantz/Milford the business community. The Retail Trade
corridor, it is not inconceivable to see the Retail Area population estimates and forecasts are
Trade Area evolve into a much more self sufficient benchmarked against the Municipality of East
prominent trade area of its own that has fewer Hants, City of Halifax and Provincial characteristics.
competitive limitations and greater resident retail
spending capture/market share. The Total Trade Area population is estimated
for 2017 to be almost 26,670. This population
3.2 is forecast to grow at moderate rates over the
POPULATION PROJECTIONS next decade and conservatively surpass 29,000
Using data sources that include the most recent by 2027. This pace of population growth is
Statistics Canada Census release as well as Pitney considered conservative as it doesn’t take into
Bowes (2017), population estimates and growth account potential economic-driven interventions
forecasts were tabulated for each of the identified at the provincial or municipal level.
Trade Area.
15 | Key Planning Strategies & Cushing Terrell Architecture Inc.You can also read