AMPRION MARKET REPORT 2021 - CURRENT TRENDS AND DEVELOPMENTS OF THE MARKET AND GRID SITUATION
←
→
Page content transcription
If your browser does not render page correctly, please read the page content below

AMPRION
MARKET REPORT
2021
CURRENT TRENDS AND DEVELOPMENTS OF THE
MARKET AND GRID SITUATION
AMPRION MARKET REPORT 2021

CONTENTS
        EXECUTIVE SUMMARY                  4

        INTRODUCTION                        8

        1.
           CURRENT TREND IN GENERATION
           ADEQUACY IN GERMANY             11

        2.	EXTRAORDINARY OCCURRENCES –
            IMPACT OF COVID-19 PANDEMIC    17

        3.
           MARKET ANALYSIS 2020            20

        4.	GRID OPERATION ANALYSIS 2020   37

        5.
           FUTURE DEVELOPMENTS             42

        7.
           CONCLUSION AND OUTLOOK          47

        LIST OF ABBREVIATIONS              50

2 | CONTENTS                                    CONTENTS   |3
AMPRION MARKET REPORT 2021 AMPRION MARKET REPORT 2021
EXECUTIVE SUMMARY
THE COVID-19 PANDEMIC MADE 2020 AN EXCEPTIONAL YEAR, WHICH IS
THEREFORE ONLY PARTIALLY COMPARABLE WITH PREVIOUS YEARS
As these characteristics of the electricity mar lified by the effects of the Covid-19 pandemic.
ket indicate, 2020 was exceptional. Moreover, This comprises, for example, the increasing
the impact on the energy sector corresponds import demands of Germany in relation to
As the energy infrastructure is a key enabler number of market parties and our association with general trends and developments in this current weather conditions and the solar/wind
of the European energy transition, transmis ENTSO-E (European Network of Transmission sector from previous years, which were amp power generation.
sion system operators (TSOs) play an import System Operators for Electricity). In a nut-
ant role in reaching the European Green Deal shell, close mutual cooperation is in our DNA.
objectives as well as in the implementation of Current Trends
a functioning internal energy market. Tackling However, 2020 was an unprecedented year
climate change and achieving climate neu in every respect. The effects of the Covid-19 Decreasing share of Trade in CWE and with European initiatives and
trality by 2050 poses significant challenges pandemic came along with a particular 2015 fossil and controllable other neighbouring regulations in relation to
for the entire European energy system. On a challenge for our society and for each one of energy sources in the countries is gaining the green deal are push
national level, the German energy system is us. Furthermore, the shut-down of public life 2016 electricity mix along with in importance. Due to ing the expansion of
undergoing an unprecedented transformation. in large parts of Europe over many months an increasing share of decreasing gas prices renewable and cross-
Electricity production from nuclear energy also had a huge impact on the energy sector, fluctuating renewable and the very low total sectoral technologies
2017
and coal will be phased out while an increasing resulting in1: energy sources (RES) load in 2020, prices in like power-to-gas con
share of renewable energies is integrated into •T
he lowest gross electricity consump- led to a very volatile net CWE were the lowest cepts which contribute
2018
the system. As generation and consumption tion (544 TWh) in Germany since the position of DE-LU which and most converging to building up a sus-
in the transmission system must always be year 19992 is heavily dependent on ones since the intro- tainable future power
in equilibrium in order to keep the network 2019 wind and solar power. duction of FB MC in supply in Europe.
•T
he highest share of renewable energies
stable, the task of ensuring this is the case CWE.
in electricity generation (49%) of Germany
will become much more demanding for the
ever 2020
transmission system operators. Even in times
of such a dynamic and changing environment, •T
he lowest electricity prices (€32/MWh)
since the introduction of Flow-Based Market Increasing demand Increasingly strong Offshore energy must
TSOs are ensuring a 24/7 electricity supply
Coupling (FB MC) in Central Western 2021 for controllable re- w e a t h e r- d e p e n d e n t be expanded to serve
and are thus enabling the energy transition.
Europe (CWE) in 2015 newable generation fluctuations of imports the system. In addition,
Efficient cooperation is a key prerequisite for
2022 in the future as well and exports, leading the integration of wind
this. Therefore, TSOs are jointly and coopera •T
he lowest gas prices (€12/MWh) since
as for additional to more frequent energy in northern Ger
tively working around the clock to ensure 20043
2023 flexibility, for ex- situations with high many must be ensured,
a secure network, promoting security and •T
he highest electricity imports (31 TWh ample via power-to-gas import demand as well for example with the
cross-zonal trade within the entire European of day-ahead commercial exchanges) in concepts. Moreover, as situations with high support of power-to-
electricity system. Germany since the introduction of FB MC 2024
increasing import exports. gas plants.
in CWE demand in Germany.
Amprion is – and has been for decades – 2025
•T
he highest price convergence (52% at max.
an integral part of this cooperation. We have
± €1/MWh) in CWE since the introduction of
been engaged in a large number of regional
FB MC in CWE
and European system operation, grid planning
•T
he highest amount of hours with negative Future Developments
and market integration initiatives. Our involve
electricity prices in Germany (298 h) since
ment in these initiatives has always been
the introduction of FB MC in CWE
based on a close, trustful and constructive
FUTURE NEED FOR ALTERNATIVES SOURCES WHICH ARE ABLE TO PROVIDE
collaboration with our neighbouring TSOs,
FLEXIBLE CONTINUOUS ELECTRICITY SUPPLY
National Regulatory Authorities (NRAs),
ACER (the Agency for the Cooperation of The future developments in generation ad withdrawal of the related power plants is not
Energy Regulators), power exchanges, a vast equacy reveal that situations in which Germany entirely compensated for by the gas-fired or
will rely on electricity imports from neigh renewable base load capable power generation
bouring countries will occur more often in capacities. Implications on system stability
the long term. This is primarily caused by the and security must be carefully monitored and
Source: https://transparency.entsoe.eu/
1 nuclear and coal phase-out in Germany. The evaluated.
2
Source: https://de.statista.com/statistik/daten/studie/256942/umfrage/bruttostromverbrauch-in-deutschland/
3
Source: https://www.bafa.de/DE/Energie/Rohstoffe/Erdgasstatistik/erdgas_node.html
4 | EXECUTIVE SUMMARY EXECUTIVE SUMMARY |5
AMPRION MARKET REPORT 2021
LOW NET POSITIONS OF CWE BIDDING ZONES AND INCREASING IMPORT
DEMAND IN GERMANY DURING SUMMER 2020
Especially during the summer months, the countries via Germany to Austria, Poland
capability of self-supply of Germany is increas and the Czech Republic. During the winter
ingly dependent on wind power generation, months, the German balance of trade is
which is statistically lower than in the winter generally characterised by exports based
months. In summer 2020, electricity imports on high wind power generation. However,
of Germany reached nearly 12 GW in sev in situations with low wind power generation
eral hours. The highest imports in 2020 have in combination with a higher average load
taken place from France, the Netherlands, during winter, Germany will also increasingly
Switzerland and Denmark. Frequently, there rely on imports in future.
were also transit flows monitored from these
LOWEST AVERAGE DAY-AHEAD PRICES AND HIGHEST PRICE CONVERGENCE
SINCE INTRODUCTION OF FB MC IN CWE
Due to a combination of low loads across market. However, the general grid situation in
Europe, low gas prices and increasing shares 2020 also led to an amplified trend towards
of solar and wind power generation, prices hours with negative prices in hours with high
in CWE were the lowest since introduction of power generation of fluctuating renewable
FB MC. Moreover, price convergence in CWE energies, which is sign for a lack of flexibility
reached the highest level ever monitored and in current power generation.
indicates a very well-functioning electricity
CONSEQUENCE: AMPRION IS INVESTING 24 BILLION EUROS OVER THE
NEXT TEN YEARS
In summary, the results show that the Euro In order to strengthen electricity trade in
pean electricity market is already working Europe and to enable the transition towards
quite well and Europe is becoming more and a fully renewable and sustainable energy
more interconnected. With regard to national supply, Amprion is substantially investing in
energy systems, it is still necessary to ensure expanding and reinforcing the existing trans
a secure, affordable and renewable energy mission grid. In addition, Amprion further
supply for a sustainable future. For this rea increases system planning expertise in the
son, future challenges such as generation and field of efficient and sustainable concepts
transmission adequacy have to be tackled. for the integration of renewable offshore
energy and sector coupling with power-
Amprion is very aware of its legal obligations to-gas technologies.
and its role in the European energy system.
6 | EXECUTIVE SUMMARY EXECUTIVE SUMMARY |7
AMPRION MARKET REPORT 2021 AMPRION MARKET REPORT 2021
AMPRION
Amprion is one of four transmission system
operators in Germany. Our extra-high-voltage
network (380 kV and 220 kV) is 11,000 kilo OUTLOOK CORE
metres long and transports electricity across In terms of market integration, Amprion
INTRODUCTION an area that extends from Lower Saxony to the
Alps. Around a third of Germany’s economic
output is generated there. Today, Amprion’s
will continue its strong commitment to the
ongoing activities in the capacity calculation
regions CWE and Core. The latter will en
grid is interconnected with other transmission compass the implementation of a flow-based
grids within Germany and also with the Nether capacity calculation and allocation at all Core
This market report provides evidence of the borders for the day-ahead (and at a later stage
lands, Belgium, Luxembourg, France, Switzer
dynamic electricity market environment in CENTRAL WESTERN EUROPE (CWE) intraday) time frame and long-term capacity
land and Austria. With ALEGrO, the first inter
which Amprion operates together with many In order to achieve the target model of a single calculation. Concepts of organising and fur-
connection between Germany and Belgium has
other institutions. European electricity market, local markets ther enhancing cross-zonal redispatch and
been operational since mid-November 2020.
have been gradually integrated and coupled sharing of the related costs amongst TSOs are
The report highlights the significant mutual at a regional level as from 2006 with the currently being developed. We are confident
benefits resulting from Amprion’s strong and first market coupling of the Belgian, Dutch that the current close cooperation amongst all
steadily enhanced cooperation with TSOs, and French day-ahead markets. The latest involved TSOs and regulatory authorities will
power exchanges and market parties of the major step towards the target model was the result in adequate and acceptable solutions
CWE region and beyond. introduction of Flow-Based Market Coup- for all parties involved.
ling (FB MC) in CWE back in 2015. Currently,
TSOs are working on the introduction of FB MC
in the capacity calculation region (CCR) Core,
Core
which encompasses Eastern Europe in addition
to Central and Western Europe.
Energy Markets – The Concept of Energy
Time Frames and Flow-Based Market
Coupling
Electricity is a commodity for which no effi
cient storage facility exists, thus it needs to
be produced at the point in time at which it is
consumed. Trading of electricity takes place
before and after this point in time. Figure A in
Annex ‘Overview Electricity Markets in Europe’
gives an overview of the current trading time CWE
sequence in wholesale and balancing markets.
In sequential order, energy can be traded one
or more years before the delivery (forward
and futures markets) up to the day after the
actual delivery. While in the day-ahead market
energy is traded one day before real time, the
intraday market enables market participants
to correct their nominations closer to the time
of delivery. Further information regarding the
flow-based market coupling concept can be
found via the Amprion homepage (link below).
Further information: https://www.amprion.
net/Market/Market-Report/
Amprion connects electricity
8 | INTRODUCTION markets across borders INTRODUCTION |9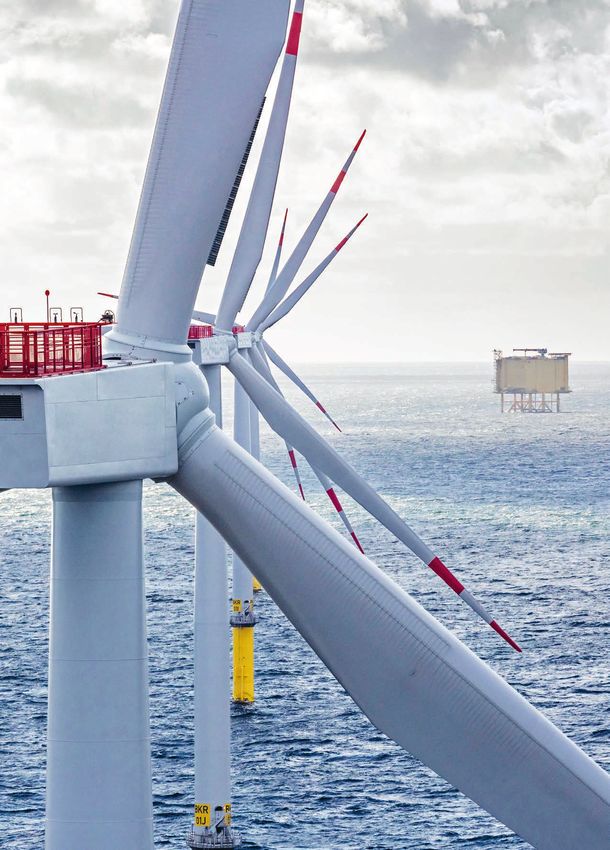
AMPRION MARKET REPORT 2021 AMPRION MARKET REPORT 2021
1. CURRENT TREND IN GENERATION
ADEQUACY IN GERMANY
THE DECREASE OF CONVENTIONAL CONTROLLABLE ELECTRICITY
PRODUCTION CAPACITY WILL HAVE FUNDAMENTAL CONSEQUENCES
FOR THE ELECTRICITY MARKET AND GENERATION PATTERN
In 2020, as in the past years and decades, a continuous balance between electricity supply and demand
has always been guaranteed by sufficient conventional electricity generation from coal, nuclear and gas-
fired power plants. These conventional energy sources have been providing the flexibility of continuously
adjusting their generation to the overall demand. The policy trend towards carbon-neutral electricity
production has already led to a decrease in conventional generation capacity. This trend will continue and
a flexible continuous electricity supply will have to be provided by alternatives sources in the future.
FUTURE NEED FOR ALTERNATIVES SOURCES WHICH ARE ABLE TO PROVIDE FLEXIBLE
CONTINUOUS ELECTRICITY SUPPLY
For the coming years, various European ana might end up in the situation that its electricity
lyses4 still show a comparatively high level of demand coverage can, during some hours
security of supply. However, there is a clear only be ensured by imports (see in Figure 1
trend indicating future import needs in dashed line ‘highest peak load’)5.
Germany. In the next few years, Germany
250 Solar
Wind (onshore)
Wind (offshore)
Inst. capacity in GW
200 Hydro
Biomass
volatile
Natural gas
150
Coal
Nuclear
100 Others
Highest
peak load
controllable
50 (2015–2020)
0
Year 2015 2020 2025
Figure 1: Installed power generation capacity in Germany 2015, 2020 and 20256
4
E.g. Generation Adequacy Assessment (PLEF); Midterm Adequacy Forecast (MAF)
5
See also Amprion Market Report 2020, Chapter 1 Development of the security of supply situation focusing on Germany: Leistungsbilanz-
bericht of the four German TSOs
6
Source: ENTSO-E Transparency Platform, NEP Szenariorahmen (2019) (https://www.netzentwicklungsplan.de/sites/default/files/
paragraphs-files/Szenariorahmen_2019-2030_Genehmigung_0_0.pdf)
10 | CURRENT TREND IN GENERATION ADEQUACY IN GERMANY CURRENT TREND IN GENERATION ADEQUACY IN GERMANY | 11
AMPRION MARKET REPORT 2021 AMPRION MARKET REPORT 2021
Figure 1 indicates the decrease of conventional CO2 prices and low gas prices are providing While the overall share of renewable energy transition is based mainly on the massive
controllable electricity production capacity incentives not only for hard coal-fired power generation is constantly increasing, their expansion of fluctuating renewable energy
with fundamental consequences for the plants but increasingly also for lignite-fired availability varying significantly depending sources (i.e. wind onshore, wind offshore and
electricity market and generation pattern7: power plants to leave the market. on daytime, season and general weather solar). Considering only these fluctuating
conditions. Figure 3 illustrates this by com renewable energy sources, on 04 July at
• In 2020 lignite and hard coal together • In parallel to the coal phase-out in Germany, paring the generation pattern for the day with 12 a.m. 74% of net electricity generation
contributed only 24% of net electricity nuclear generation capacities will be shut the hour with the highest share of renewable and on 27 November at 6 a.m. only 1% was
generation, less than wind power (wind down by the end of 2022, which leads to a energy production in 2020 (84% of net generated by wind and solar.
offshore and onshore 25.4%). In the past further decrease in conventional capacities electricity generation on 04 July at 12 a.m.)
five years, coal-fired power generation has of 8.1 GW compared to the end of 2020. to the day with the hour with the lowest In addition, Figure 3 shows that situations
nearly halved (214 TWh in 2015 and 119 TWh renewable energy production (14% of net with very low wind and solar power generation
in 2020)8 . This is a consequence of the coal The decreasing share of coal and nuclear electricity generation on 27 November at do not occur only in single hours. Instead,
phase-out in Germany. All coal generation energy production will have to be replaced by 6 a.m.). These values refer to aggregated they can last for days and even weeks. An
capacities are to be closed by 2038. an increasing share of volatile generation cap electricity generation of all renewable energy appropriate back-up must be available for
Tenders are organised in order to determine acities such as wind and solar energy in the sources (including wind, solar, biomass, such times.
the coal power plant decommissioning time coming years. In 2020, the share of electricity hydro and others). The German energy
and compensation payments. Even the generated from renewable energies has al
modern coal-fired power plants such as the ready reached almost 50%. Figure 2 highlights
one in Moorburg successfully participated in the increasing dependency of the German
Daytime on 4 July 2020
the first of these decommissioning tenders. electricity generation on renewable energies
70
This power station will be taken off the grid and illustrates the monthly average share of
in 2021 after only five years of operation. renewable energy generation in Germany 60
Generation in GW
84% 72%
Further to these regulatory measures, rising from 2018 until 2020. total volatile
50
RES RES
40
30
70
Share RE in net electricity
60 20
50 10
generation [%]
40 0 Wind
Solar
61.5
57.5
56.0
30
55.3
O ther RES
51.8
49.6
46.0
48.9
49.0
70
48.8
48.8
46.9
47.8
47.8
47.0
45.0
44.5
43.9
43.8
43.4
43.3
42.9
Conventional
40.0
41.0
41.3
41.6
40.1
40.1
39.8
41.1
38.7
37.5
36.9
20
35.4
35.6
generation
32.9
60
14% 1%
Generation in GW
10 volatile
total
50 RES
RES
0
40
January
February
March
April
May
June
July
August
September
October
November
December
January
February
March
April
May
June
July
August
September
October
November
December
January
February
March
April
May
June
July
August
September
October
November
December
30
2018 2019 2020 20
10
Figure 2: Share renewable energy generation in Germany 2018–20209
0
00:00 03:00 06:00 09:00 12:00 15:00 18:00 21:00 24:00
Daytime on 27 November 2020
Figure 3: Days with the lowest and highest renewable power generation in Germany 202010
It should also be noted that the graphs on installed capacities (Figure 1) do not take into consideration outages of power plants due
7
to failures or maintenance requirements. The amount of outages depends on the season and historically lies between 10–20% of the
installed capacity.
Source: https://transparency.entsoe.eu/
8
Source: https://transparency.entsoe.eu/
9 10
Source: https://transparency.entsoe.eu/
12 | CURRENT TREND IN GENERATION ADEQUACY IN GERMANY CURRENT TREND IN GENERATION ADEQUACY IN GERMANY | 13
AMPRION MARKET REPORT 2021 AMPRION MARKET REPORT 2021
Security of supply has to be ensured at all Renewable energy plants will also have to ASPECTS OF SYSTEM STABILITY MUST BE CONSISTENTLY TAKEN INTO ACCOUNT
times, also in situations with low renewable contribute to security supply in the future, IN SYSTEM DESIGN
electricity production (e.g. November day in for example by combining them with flexible
Figure 3 or the investigated week in Chapter storage facilities. Consumer-side flexibility, The current electricity system has been reliant compensation systems. Further information
3.2). In such situations flexible gas (hydrogen)- (aligned with the volatile feed-in of renewable on large power stations close to demand cen regarding the challenges of voltage control
fired power stations could in future support energies) will have to play a stronger role. tres. Those power stations could provide local are analysed in Chapter 4.2 of this report.
electricity generated by renewables. In order From 2025 onwards, high electricity demand ancillary services, i.e. reactive power, and sup
to develop the infrastructure required for (peak load indicated in Figure 1 for the refer port grid voltage at dedicated locations. With It is essential that balancing responsible
this purpose, the currently independent grid ence years 2015 until 2020) can no longer the closure of those power plants this support parties provide their contributions to such an
planning processes of the electricity and be ensured solely by conventional and will no longer be available. Together with the overall balanced electricity system. In order
gas infrastructure should in future be closely controllable power plants. progressive expansion of renewable energies to achieve this target, the market framework
aligned. and longer-distance electricity transmission, needs to provide the right incentives for
there is an increased demand for alternative balancing groups to balance their energy
support in the form of new controllable injections and withdrawals at all times.
HIGH LEVEL OF SECURITY OF SUPPLY REQUIRES SUFFICIENT TRANSMISSION
CAPACITY OF THE GRID
The previously shown generation adequacy processes of the electricity and gas infra
OUTLOOK IN EUROPE
situation does not consider whether the grid structure should in future be closely aligned.
is capable of transporting the capacity (trans
mission adequacy). Current security of supply The European Green Deal accelerates the
NOT ONLY IN GERMANY, BUT ALSO IN OTHER EUROPEAN COUNTRIES,
reports and analyses, in general, do not con- transformation of the European energy
A DECREASING TREND IN CONVENTIONAL POWER PLANTS IS VISIBLE
sider grid-related restrictions. However, insuffi- system to enable a fully integrated climate-
cient transmission capacity currently requires neutral system by 2050. As infrastructure is Similar efforts to achieve the Paris Climate potentially reducing conventional generation
market interventions on an almost daily basis a key enabler of the European energy transi Agreement targets and to shut down con by 5.9 GW 13. In the interconnected European
as described in Chapter 4.1. Grid reserve power tion, European TSOs play an important role in ventional capacities are being made in other electricity system, such individual changes in
plants are contracted and activated for this meeting the objectives of the Green Deal and countries across Europe. Exemplarily, France the generation capacities in different coun
purpose. Additional grid-relieving measures in implementing a functioning internal energy and UK have announced a coal phase-out tries have a substantial impact on the overall
such as operating equipment for active power market. Due to the usually high full-load hours by the end of 2022 and 2024, respectively, European security of supply during scarcity
flow control has been and will be installed of offshore wind farms, this technology is which would reduce conventional generation situations. In order to assess the current and
over the next years. However, the potential expected to contribute to the overall security by 3 GW in France11 and by 5.3 GW in Great future European security of supply situation,
for further short-term grid optimisation has of supply more than other renewable energy Britain12. Besides that, a nuclear phase-out Amprion is particularly involved in respective
its limits. An adequate level of transmission sources in future by generating electricity on by 2025 is being discussed in Belgium, ENTSO-E analyses.
capacity can only be ensured by mid and a rather constant level. The grid connection
long-term expansion of the transmission grid. of those offshore wind farms should be locat
Realising the relevant grid expansion projects ed as close as possible to the demand centres
included in the network development plan in order to provide customers with direct
and defined in applicable legislation is access to electricity supply. For this reason,
therefore required and mandatory. the offshore grid connection to the shore
is just one aspect. It is important to have
Security of supply has to be ensured also integrated grid concepts which consider the
in situations, with low renewable electricity further transport of the offshore wind power
production (e.g. in the investigated week in to the regions with high electricity demand.
Chapter 3.2). In such situations flexible gas In order to ensure the optimal interlinkage of
fired power stations could support electricity offshore wind farms a modular offshore grid
generated by renewables. In order to develop should be installed in Europe in the long term.
the infrastructure required for this purpose, See also Chapter 5 of this report for further
the currently independent grid-planning information on the topic.
See ‘France to close Havre coal power plant in April 2021’: https://www.reuters.com/article/us-france-electricity-coal/france-to-close-
11
havre-coal-power-plant-in-april-2021-idUSKBN1Z91IO
UK brings forward coal phase-out to 2024: https://www.argusmedia.com/en/news/2064277-uk-brings-forward-coal-phaseout-to-2024
12
See ‘Electrabel calls for clarity on Belgian phase-out’: https://www.world-nuclear-news.org/Articles/Electrabel-calls-for-clarity-on-
13
Belgian-phase-out
14 | CURRENT TREND IN GENERATION ADEQUACY IN GERMANY CURRENT TREND IN GENERATION ADEQUACY IN GERMANY | 15
AMPRION MARKET REPORT 2021 AMPRION MARKET REPORT 2021
2. EXTRAORDINARY
OCCURRENCES – IMPACT
OF COVID-19 PANDEMIC
THE COVID-19 PANDEMIC HAS SIGNIFICANT EFFECTS ON THE
ELECTRICITY SYSTEM AND THE ENERGY MARKET
The Covid-19 pandemic made 2020 an exceptional year in terms of many areas of everyday life,
including effects on the electricity supply and markets. To give an overview of these extraordinary
effects and the resulting lockdown measures, this chapter highlights some key figures.
THE COVID-19 PANDEMIC MADE 2020 AN EXCEPTIONAL YEAR, WHICH IS
THEREFORE ONLY PARTIALLY COMPARABLE WITH PREVIOUS YEARS
The lockdown measures across much of Eur Not only the decrease in actual total load but
ope in the beginning of 2020 had a significant also a mild winter and an oversupply of gas15
impact on the electricity markets. The actual resulting in an extreme decrease in gas prices
total electricity demand fell sharply in many caused a significant change in the generation
countries and in particular also in Germany structure. The aforementioned effects result
shortly after the first lockdown, i.e. in the last ed in the following deviations compared to
weeks of March and the months of April and 2019: on the one hand, the share of electricity
May 2020. Figure 4a shows this substantial generated by lignite reduced by –19%, hard
change for a representative week in April 2020. coal by –27% and nuclear by –14%, but on the
other hand, an increase in gas by +8%, solar
These clear differences on the demand side by +9%, onshore wind by +3% and offshore
persisted during the lockdown period (i.e. in wind generation by +11% could be observed.
April and May around a 10% decrease in the Firstly, this can be explained by the sharply
actual total load). During the summer the decreased natural gas prices (–24% compared
actual total load adjusted back to previous to 2019 and almost –36% compared to 2018).
years’ levels and reached a level comparable The corresponding merit order shift ‘coal-gas
to 2019 in August. Over the whole year of switch’ resulted in lower prices in all countries
2020, a decrease of 3% in actual total load – which also led to more similar prices due to
could be observed for Germany (478 TWh in the flattening of the merit order. Secondly,
2020 compared to 490 TWh in 2019)14. the share of renewable energies in net elec
Actual total load = actual total load (including losses without stored energy) = net generation – exports + imports – absorbed energy –
14
net generation is preferred, however gross generation could be used where it is available with greater precision (Source: ENTSO-E
transparency platform)
See ‘Der europäische Energiemarkt zwischen Zusammenbruch und schneller Erholung’ – EMW - Dr. Philipp Eggert, Trianel; 02.02.2021:
15
On an already oversupplied European gas market, new LNG from the USA kept arriving during the winter. According to GIE data, gas
storage levels in Europe were 88% full at the beginning of January. At the end of March, storage levels were at 54%.
Normal would have been around 35%.
16 | EXTRAORDINARY OCCURRENCES – IMPACT OF COVID-19 PANDEMIC EXTRAORDINARY OCCURRENCES – IMPACT OF COVID-19 PANDEMIC | 17
AMPRION MARKET REPORT 2021 AMPRION MARKET REPORT 2021
Load
70
Total actual load in
tricity generation reached a peak of 49.4% all CWE borders). While Germany was mainly
Germany in GW
in 2020. Especially wind and solar generation importing during this week, France com 60
increased significantly. The corresponding pensated for this with an average net export
shift away from fossil fuels led to a decrease position of approx. 7,000 MW. However, at 50
in greenhouse gas emissions of approx. the end of the depicted week (i.e. 12 April), Range 2015–2019
40 2020
80 million tonnes of CO2-eq and will thus situations occurred in which the reverse
be about 42.3% below the 1990 level16. situation was visible. On 12 April at 5 a.m.
30
Germany was importing with a net position
The pandemic and resulting lockdown of –2,400 MW, while France was export- Generation 18
measures imposed particular challenges on ing (net position of +10,200 MW). A few 70
Power generation in
grid operators who had to manage increased hours later at 1 p.m. the opposite picture 60
Germany in GW
volumes of fluctuating renewable energy in a emerged: Germany was exporting (net 50
low-demand environment with fewer thermal position of +9,000 MW) and France was im 40
Wind
power plants at the same time. Examples of porting (net position of –1,500 MW). Chapter 30 Solar
this are the minimum and maximum shares 3 of this report covers in more detail these O thers
20
of renewable energies that occurred in 2020. strong fluctuations in the net position and
10
The range is vast, with 84% on 4 July and only the underlying effects.
0
14% on 27 November (see Chapter 1). Overall, •F
igure 4d: In order to give an overview of
networks coped with the situation well and how the commercial exchanges behaved Net position
proved their ability to handle high levels during this April week, Figure 4d demonstrates 10
Net position in CWE
of renewable penetration, which at times Germany’s bilateral commercial exchanges 7.5
crossed 60% in Italy, 70% in Spain and the with all neighbouring countries revealing AT
5 BE
already mentioned 84% in Germany17.
in GW
massive transit flows. German imports from DE-LU
2.5
FR
France, Denmark and Switzerland are simul
0 NL
The following graphs in Figure 4 (a-e; top taneously offset by exports from Germany
-2.5
to bottom) proves the exceptional effects to Austria and the Czech Republic.
–5
of the Covid-19 pandemic based on analyses
•F
igure 4e: The corresponding day-ahead
of the example week 6 to 13 April 2020:
electricity prices in CWE also show signifi Import/export
cant fluctuations, with the very low average DE net position
Hourly import/export
•F
igure 4a: The actual total load of Germany DE ➞ AT
day-ahead price during the week of only
(DA SCE) in GW
10
in 2020 (pink line) decreased significantly DE ➞ BE
€19/MWh. However, the weekly average DE ➞ CH
compared to the previous years (2015–2019), 5 DE ➞ CZ
day-ahead price in the German bidding
which are represented by the pink shaded DE ➞ DK
zone (€21/MWh) was slightly higher than the 0 DE ➞ FR
area. DE ➞ LU
average CWE prices, reflecting the strong
DE ➞ NL
•F
igure 4b: The power generation pattern in imports. As a result, the lowest day-ahead –5
DE ➞ NO
Germany during this week can be charac prices (€14.4/MWh) were observed in DE ➞ PL
–10 DE ➞ SE
terised by low wind power generation and France during this week. Furthermore, the
average PV generation. observed price convergence in the week DA-prices
80
•F
igure 4c: This situation is reflected by the was approx. 35.1% and thus much lower than
Electricity DA-prices
70
net positions of France and Germany, which the average in 2020. This is an indicator
in CWE in ¤/MWh
60 AT
correspond to the overall effects. Figure 4c for trade limiting network elements and is BE
50
shows the correlation between the German a result of the exceptional grid situation in 40 DE-LU
FR
and France net positions (taking into account Europe based on the national lockdowns. 30 NL
20
10
0
–10
See ‘Jahresauswertung Agora Energiewende’ in 2020, greenhouse gas emissions decreased. The main reasons for the lower emissions
16
06 07 08 09 10 11 12 13
are the economic crisis (low energy demand, lower industrial production, slump in transport demand), higher CO2 prices in EU emissions Apr
trading and a mild winter. 2020 Date
See https://ec.europa.eu/energy/sites/ener/files/documents/quarterly_report_on_european_electricity_markets_q_2_2020.pdf
17
Share of power generation in the illustrated week: solar 19%, wind onshore 16%, wind offshore 4%, other renewable 16%, nuclear 15%,
18
Figure 4: Impact of Covid-19 and the resulting lockdown measures on total actual load
gas 9%, coal (lignite and hard) 17%
and power generation in Germany as well as on net positions and electricity prices in
Source: https://transparency.entsoe.eu/
19
CWE in an example week (6 until 13 April)19
18 | EXTRAORDINARY OCCURRENCES – IMPACT OF COVID-19 PANDEMIC EXTRAORDINARY OCCURRENCES – IMPACT OF COVID-19 PANDEMIC | 19AMPRION MARKET REPORT 2021 AMPRION MARKET REPORT 2021
Lockdown Import Export
3. MARKET ANALYSIS 2020
10
8
Net position in CWE
6
4
AT
in GW
2
LOW ELECTRICITY DEMAND AMPLIFIES MARKET TRENDS 0
BE
DE-LU
FROM 2019. –2
FR
NL
–4
-6
January
February
March
April
May
June
July
August
September
October
November
December
January
February
March
April
May
June
July
August
September
October
November
December
This chapter seeks to analyse and explain our main observations and the key trends in the electricity
wholesale market in 2020. With our control area located in the heart of CWE, our market monitoring
is focussed mainly on this region, where Amprion provides fundamental contributions to European
2019 2020
electricity trade and FB MC. Since the go-live of the ALEGrO cable in November 2020, which Date
represents the first interconnection between the German and Belgian transmission grid, Amprion
is now interconnected with every foreign TSO in CWE. This particular role in Germany and CWE
Figure 5: Comparison of day-ahead net positions in CWE in 2019 and 202020
requires our strong commitment to CWE and the overall European electricity market.
(considering all country borders except DC interconnectors, moving weekly averages)
3.1 EXPORTS AND IMPORTS IN CWE
LOW NET POSITIONS OF CWE BIDDING ZONES AND INCREASING IMPORT DEMAND
We analyse electricity exports and imports zone. In order to show the main effects of IN GERMANY DURING SUMMER 2020
by monitoring the day-ahead net positions the electricity wholesale market, our analysis
of all bidding zones in this region. In general, is focussed on flows which are exchanged In both years, the net position of the German/ comparison: the average net position of
these net positions show the difference between bidding zones the day before the Luxembourgian (DE-LU) bidding zone is DE-LU was around +400 MW in this period).
between all flows out of a particular bidding actual production and consumption takes consistently high during winter months and However, summer months in 2020 stand
zone (exports) or into a particular bidding place. These flows are determined by the day- low during summer months. In 2019, the low out due to comparatively low net positions
zone (imports) at one particular point in time. ahead market which is where currently the German power generation was especially not only in Germany, but in particular also
A positive net position indicates a (net) major part of electricity trading takes place. compensated for by the French (FR) bidding in France (e.g. average net position of FR:
exporting bidding zone, while a negative net Figure 5 illustrates the moving weekly average zone with an average net position of around +750 MW, DE: –300 MW from July till October
position shows a (net) importing bidding of CWE net positions in 2019 and 2020. +6,400 MW from July till October 2019 (for 2020).
Germany’s past high net exports of 36.8 TWh in 2019 have decreas … decrease of
ed by 39.3% to 22.3 TWh in 2020. These German net imports are net exports
composed of imports which have increased to 30.9 TWh (+36.8%) -39.3% of Germany
in 2020 and exports which have decreased to 53.2 TWh (–10.3%). As in 2020.
already in 2019, Germany has been a net importer during several
weeks in the summer time from May to October.
In order to provide more details of the mar will focus on one representative import week
ket behaviour in particular export and import in July and one representative export week in
situations, the following Chapters 3.2 & 3.3 December (cf. Figure 5).
20
Source: https://transparency.entsoe.eu/
Explanation: One representative Lockdown week (6 to 13 April), one representative import week (13 to 20 July) and one representative
export week (14 to 21 December) were analysed in detail.
20 | MARKET ANALYSIS 2020 MARKET ANALYSIS 2020 | 21AMPRION MARKET REPORT 2021 AMPRION MARKET REPORT 2021
Load
70
3.2 FOCUS SUMMER 2020 –
Total actual load in
Germany in GW
GERMANY BECOMING A NET IMPORTER 60
As in the summer of 2019, also in the summer months of May, July and August 2020, Germany 50
was importing significantly from France, Netherlands, Switzerland and Denmark. For a better Range 2015–2019
40 2020
understanding of this phenomenon, Figure 6 provides some insights into one of these weeks,
from 13 to 20 July 2020, in which Germany relied heavily on imports.
30
Generation
HIGH IMPORTS FROM FRANCE, NETHERLANDS, SWITZERLAND AND DENMARK 70
DURING SUMMER 2020
Power generation in
60
Germany in GW
50
In order to explain market behaviour in filled partly by coal and gas power generation23.
Wind
such situations, the following reflects the Furthermore, net imports have reached a level 40
Solar
interdependencies between load, generation, of on average 4,200 MW per hour24. Figure 6 30 O thers
day-ahead wholesale prices as well as shows that the CWE net position of DE-LU 20
imports and exports. during this week remains negative (importing), 10
except for a few hours on Monday, Saturday
0
The graph at the top shows the total actual and Sunday around noon. When taking a look
grid load in Germany which has been slightly at the day-ahead scheduled commercial Net position
lower than in the last years. In nearly every exchanges at all country borders (beyond 7.5
Net position in CWE
hour, the load in 2020 has been lower than CWE only), it becomes obvious upon which 5
AT
the lowest value of this hour in comparable countries Germany has been relying. With a 2.5
BE
in GW
calendar weeks from 2015 to 2019 (grey total amount of 461 GWh, the highest net 0 DE-LU
FR
shaded areas, on average: –5%). This is still a imports have come from the Netherlands -2.5
NL
result of Covid-19 pandemic and the related with a 4,500 MW peak, followed by France -5
restrictions in Germany. (276 GWh total, 5,700 MW peak), Denmark -7.5
(218 GWh total, 1,900 MW peak) and Switzer -10
While low loads are usually related to a sur land (119 GWh total, 2,800 MW peak).
plus in generation, this has not been the case Import/export
due to comparatively low generation of wind Although trading volumes in CWE have
Hourly import/export
10 DE net position
DE ➞ AT
power and below-average PV generation. been high, the average day-ahead whole-
(DA SCE) in GW
DE ➞ BE
5
For comparison, the hourly wind generation of sale prices were just slightly above average DE ➞ CH
DE ➞ CZ
onshore plus offshore power plants in Germany at around €35/MWh in CWE 25 with a high 0 DE ➞ DK
during this week was on average at 3,100 MW21. degree of price convergence of around 75%26. DE ➞ FR
–5 DE ➞ LU
Despite usually high PV generation in July, on Consequently, there were only 47 limiting
DE ➞ NL
15 and 16 July 2020 also the PV generation CNECs (critical network elements and –10 DE ➞ NO
DE ➞ PL
was comparatively low with an hourly average contingencies) monitored in CWE over the
DE ➞ SE
generation of around 8,100 MW22. whole week, which have limited trade in CWE.
DA-prices
Furthermore, none of those CNECs refers to
80
The gap between demand and comparatively internal network elements of Amprion.
Electricity DA-prices
70
in CWE in ¤/MWh
low generation from wind and PV has been 60
50 AT
BE
40
DE-LU
30 FR
21
Only 6.5% of the max. overall wind power generation in 2020: 47,700 MW 20 NL
22
Peak overall PV production in 2020: 30,300 MW, peak generation during the particular week 15,100 MW 10
23
Average generation from lignite plus hard coal power plants was around 12,900 MW and natural gas power generation was around 0
8,600 MW –10
24
Which sum up to 708 GWh over the whole week 13 14 15 16 17 18 19 20
25
Maximum: €58.7/MWh in DE-LU at 16/07/2020 10 a.m.; minimum: €15.0/MWh in BE at 20/07/2020 12 a.m. Jul
26
In 74.5% of hours the maximum price deviation is below ±€1/MWh in CWE and the maximum deviation is ±€10.9/MWh reached on
2020 Date
20/07/2020 at 12 a.m.
27
Source: https://transparency.entsoe.eu/
Figure 6: Example summer week with net imports to Germany27
22 | MARKET ANALYSIS 2020 MARKET ANALYSIS 2020 | 23AMPRION MARKET REPORT 2021 AMPRION MARKET REPORT 2021
Load
80
3.3 FOCUS WINTER 2020 –
Total actual load in
Germany in GW
WIND POWER AS MAJOR DRIVER FOR EXPORTS 70
60
As in 2019, in January, February and December of 2020 trade in CWE was significantlyaffected
Range 2015–2019
by net exports from Germany. In contrast to the summer months, a surplus in wind power gener
50 2020
ation during the winter months has been a key driver for these net exports. Figure 7 provides an
overview of one of these characteristic exporting weeks from 14 to 21 December 2020. 40
Generation
80
HIGH WIND GENERATION LED TO HIGH EXPORTS DURING WINTER 2020
Power generation in
70
Germany in GW
The total actual grid load in Germany during This high surplus of supply resulted in net 60
this period is depicted in the graph at the hourly exports of 6,700 MW on average 50 Wind
top of Figure 7. In 2020, it was on a level which add up to 1,128 GWh over the whole 40 Solar
O thers
comparable previous years, slightly below week. Figure 7 shows that the CWE net pos 30
the average of 2015 to 2019. The effects of ition of DE-LU during this week remained 20
the restrictions related to the Covid-19 positive (exporting), except for a few hours on 10
pandemic, which have been even more Wednesday morning and on Sunday around 0
restrictive than during the summer months, noon. By far the highest net exports in this
Net position
are not as obvious then during the lockdown week went to Austria (837 GWh at 5,800 MW
10
from March to May. On average, the load in peak), followed by France (286 GWh total,
Net position in CWE
8
December 2020 has just been 0.2% lower 4,500 MW peak). Due to the overall high
6
than in December 2019. wind power generation in northern Europe 4
in GW
AT
Denmark has additionally been exporting 2 BE
The second graph in Figure 7 shows a surplus to Germany (333 GWh in this week with a 0 DE-LU
FR
in generation related mainly to high wind 2,700 MW peak). -2
NL
power generation, while PV generation is -4
commonly low during winter months. The Compared to other weeks of the year, -6
hourly wind generation of onshore plus trading volumes in CWE were relatively high
Import/export DE net position
Hourly import/export
offshore power plants in Germany during this and the average day-ahead wholesale prices DE ➞ AT
(DA SCE) in GW
10
week was 19,000 MW28 on average. For com were significantly above average at around DE ➞ BE
DE ➞ CH
parison, the hourly average photovoltaics €42.7/MWh31 in DE-LU. Moreover, price 5 DE ➞ CZ
generation was just around 1,200 MW29 . convergence was rather low during the whole DE ➞ DK
DE ➞ FR
week at around 23% 32 . This was a result of 0
DE ➞ LU
Due to the higher average load of 57,300 MW high loads and a generation shift to northern DE ➞ NL
–5 DE ➞ NO
compared to only 51,100 MW in the summer Germany and Denmark due to high wind DE ➞ PL
week from Chapter 3.2, combined coal and power generation, which led to 444 limiting DE ➞ SE
–10
gas power generation was even higher during CNECs over this week. The share of internal
this week (average generation from lignite network elements of Amprion was 7.2% with DA-prices
80
plus hard coal power plants was around 32 monitored CNECs.
Electricity DA-prices
70
in CWE in ¤/MWh
17,600 MW and natural gas power generation
60
was around 7,500 MW). 30 50 AT
BE
40
DE-LU
30 FR
20 NL
10
28
With a peak at 36,000 MW. The average wind power generation over December 2020 was around 15,600 MW in contrast to 20,400 MW 0
in 2019.
–10
29
With a peak at 10,500 MW 14 15 16 17 18 19 20 21
30
Please note: the peak load in the winter week was 71.5 GW whereas the peak load in the summer week (chapter 3.2) was 67.0 GW. Dec
31
Maximum: €76.1/MWh in AT on 17/12/2020 at 6 p.m.; minimum: €0.0/MWh in DE-LU on 21/12/2020 at 11 p.m.
2020 Date
32
In only 22.9% of hours it the maximum price deviation below ±€1/MWh in CWE and the maximum deviation is ±€22.6/MWh reached on
21/12/2020 at 11 p.m.
33
Source: https://transparency.entsoe.eu/21/12/2020 at 11 p.m.
Figure 7: Example winter week with net exports of Germany33
24 | MARKET ANALYSIS 2020 MARKET ANALYSIS 2020 | 25AMPRION MARKET REPORT 2021 AMPRION MARKET REPORT 2021
3.4 INCREASING TREND OF PRICE CONVERGENCE IN CWE
The reduction of price differences within a region is one of the main targets of market coupling.
As explained in Chapter 2, the Covid-19 pandemic led to a 3.2% decrease in the total actual load in Sufficient cross-zonal transmission capacities are a crucial prerequisite for achieving price
Germany. The share of renewable energies in power generation increased to 49.3% compared to convergence (i.e. where price differences equal zero).
2019 and natural gas prices sank by –26%. Similar effects can be seen in other European countries.
All of these factors led to a significant decrease in average day-ahead prices in CWE from around The steady increase of hours with full price convergence in CWE provides evidence of the signifi
€39.5/MWh in 2019 to just €32/MWh in 2020, continuing the trend of decreasing prices since cant contribution of CWE TSOs in making transmission capacity available to the market, thereby
2018. Furthermore, the span between the average prices of CWE bidding zones decreased as achieving a cost-efficient balancing of supply and demand across the region35.
well, from €3.2/MWh in 2019 to €2.7/MWh in 2020. In both years, the average day-ahead prices in
DE-LU were the lowest in CWE of €37.7/MWh in 2019 and €30.5/MWh in 2020. The highest prices
in 2019 were observed in NL of €41.2/MWh. In 2020, the highest prices were observed in AT of
€33.1/MWh. The development of day-ahead prices in CWE is summarised in Table 1. An overall increasing trend for price conver zones have been further investigated in Figure 8.
gence in CWE is observed (cf. Figure 8). While Both full price convergence in all five bidding
the full price convergence in CWE reached zones and partial price convergence in only
LOWEST AVERAGE DAY-AHEAD PRICES AND HIGHEST PRICE CONVERGENCE 49% in 2019 for a maximum price span of two to four bidding zones has been assessed.
SINCE INTRODUCTION OF FB MC IN CWE ±€1/MWh, a further increase to 52% has been The results show that the level of convergence
observed in 2020. has raised in every category compared to
Bidding 2018 2018 2019. In case of increasing threshold levels
2016 2017 2019 2020 In order to provide a more from ±€1/MWh to ±€5/MWh, the hours of full
zone (DE-LU-AT) (DE-LU)
… increase in detailed evaluation of the price convergence in all five bidding zones
AT - - - 59.91 40.05 33.14
hours with full 3% CWE electricity market increase to 75.2%. For three out of five bidding
BE 36.61 44.58 49.94 71.06 39.34 31.88 price conver- efficiency, different price zones already 77.5% of the hours converge
DE-LU - - - 52.59 37.66 30.47 gence in CWE deviation thresholds and below or equal to ± €1/MWh and in 97.3% of
in 2020. combinations of bidding the hours below or equal to ±€5/MWh.
DE-LU-AT 28.98 34.18 41.72 - - -
FR 36.74 44.96 45.97 62.72 39.45 32.20
NL 32.24 39.30 49.80 60.60 41.19 32.24 Full price convergence Partial price convergence
100%
2020
ininCWE
per year)
Table 1: Day-ahead average price levels in CWE (in €/MWh)34 80%
in CWE
per year)
convergence
60%
of hours
The highest CWE day-ahead prices in negative prices increased as well by 56% to
100%
100%
97%
PriceConvergence
96%
96%
93%
89%
2020 were monitored on 21 September at 192 h. Again, this trend can be attributed to
(share(Hours
79%
78%
40%
75%
74%
65%
7 p.m. of €200.0/MWh in all CWE bidding an increasing share of fluctuating renewable
62%
57%
52%
49%
zones. The lowest price was monitored on energies paired with a low load in 2020 due 20%
13 April at 2 p.m. of –€115.3/MWh in BE. For to the Covid-19 pandemic.
Price
comparison, the highest price in 2019 was 0%
5 BZs 4 BZs 3 BZs 2 BZs
€121.5/MWh in whole CWE and the lowest In the case of sufficient cross-zonal exchange
was –€500/MWh in BE. capacities, no price differences between In x bidding zones
CWE bidding zones should occur. If commer
+
- ¤1/MWh (2019 – ref.) +
- ¤1/MWh +
- ¤3/MWh +
- ¤5/MWh
Although such an extremely negative cial exchanges are limited by transmission
price as in 2019 did not occur in 2020, the constraints, prices between CWE bidding
overall amount of hours with negative prices zones diverge. Accordingly, price conver Figure 8: Price convergence in CWE in 2020 and differentiation
increased by 41% to 298 h. The amount of gence is an indicator of the level of market between full and partial price convergence36
hours with at least six continuous hours with integration in the CWE region.
Other fundamental factors also significantly impact the market and prices as well. Examples are in particular the considerable changes
35
in the generation mix described in this report (i.e. the decommissioning of conventional generation units and the increase of renewable
energy production).
Source: https://transparency.entsoe.eu/
34
Source: https://transparency.entsoe.eu/
36
26 | MARKET ANALYSIS 2020 MARKET ANALYSIS 2020 | 27AMPRION MARKET REPORT 2021 AMPRION MARKET REPORT 2021
It is difficult to quantify the impact of the individual factors for this convergence rate as they DO CEP MINIMUM TARGETS FOR CROSS-ZONAL TRADING CAPACITY CREATE VALUE
cannot be analysed on a stand-alone basis37. The provision of an adequate transmission capacity FOR EUROPE?
level by TSOs does, however, positively impact the price convergence rate and hence market
integration. Providing a sufficient and appropriate level of transmission capacity for European electricity trading
is an essential joint European energy policy goal. Amprion shares and fully supports this target of
further market integration. Yet the currently applied general target values may require some further
EXCURSUS ON EU TRANSMISSION CAPACITY TARGET: GERMAN ACTION PLAN AND analytical assessment.
70% TARGET
Transmission capacity targets are one of the Germany, as well as Poland, the Netherlands, In particular, the consideration of the follow excludes full (100%) price convergence as
core elements of a piece of recently released Romania and Austria, will not implement this ing three economic principles seems to be a target of European market integration44.
legislation called ‘Clean Energy for All Euro 70% target immediately. These countries have beneficial:
peans Package’ (CEP)38 which entered into opted for an exemption clause, a so-called Our analysis has shown the increasing price
force on 4 July 2019. One of its main provisions ‘Action Plan’41. This Action Plan sets capacity •M
inimum capacity targets have an effect convergence in CWE where during the year
is that at least 70% of the capacity of internal targets which will start at a lower level and only if their application leads to a provision 2020 in 52% of all hours a full price conver
and cross-zonal critical39 network elements successively increase to 70% by 31 December of additional virtual trading capacity on gence (± €1 /MWh) was achieved (cf. Figure 8
has to be made available for cross-zonal 2025. Table 2 shows this increasing path (the network elements which are limiting the on page 27). Together with a further 13% of all
electricity trading from 1 January 202040. linear trajectory). electricity market. hours with at least moderate price convergence
• In such cases, value is created only if the (± €3/MWh), the CWE market was nearly
welfare gains due to increased cross-zonal unconstrained during 65% of all hours
trading do outweigh the redispatch costs (cf. Figure 8 on page 27).
% of the capacity of critical network elements (CNECs)
to cope with the overloads resulting from
providing virtual trading capacities to the This existing high price convergence rate has
From
2020 2021 2022 2023 2024 2025 31/12/2025 been achieved by providing the 20% minimum
market.
capacity target applied in the CWE region
German •M
inimum capacity targets can only serve as
CNECs 11.5 21.3 31.0 40.8 50.5 60.3 70.0 as well as the 11.5% minimum capacity tar
a transitionary solution, while target-orient
in Core get included in the Clean Energy Package.
ed investment into network infrastructure
Providing additional transmission capacity in
is the superior way in the long run.
Table 2: Percentage of the capacity of critical network elements compliance with the linear trajectory values
(CNECs) for Germany in the CCR Core indicated in Table 2 would increase price
On a yearly basis, ACER releases a market
convergence levels even further. Such an
monitoring report on the appropriateness of
increase would, however, require the use of
In addition to the 11.5% capacity target for security standards. Amprion has been able to transmission capacity provision to the Euro
costly remedial actions, a subject which will
2020, Amprion has guaranteed the 20% min fulfil both capacity targets on all CNECs at all pean market42. This report questions whether
be discussed in the subsequent chapters.
imum capacity introduced in the CWE region times during 2020. the transmission capacity provided by Euro
Ultimately, this also raises the question of the
in April 2018 in compliance with system pean TSOs in 2020 was sufficient, in particular
efficiency of such additional costly remedial
with regard to the 70% capacity target. While
measures, since their costs would have to be
this apparent shortcoming of transmission
compared to the achievable gains and bene
capacity provision can be explained by some
fits, i.e. further increasing price convergence.
specific analytical assumptions which ACER
has taken43, ACER’s report also explicitly
37
Instead, they have to be considered in the complex environment of changes, not only in the transmission capacity between bidding
zones, but also with regards to changes in CO2 and fuel prices as well as RES infeed, plant availabilities, electricity demand and weather
conditions.
Report on the result of monitoring the margin available for cross-zonal electricity trade in the EU in the first semester of 2020
42
38
Regulation (EU) 2019/943
E.g. focus only on the day-ahead timeframe without consideration of long-term, intraday and balancing capacity; no full consideration
43
39
A transmission network element is called “critical” when it is considered relevant for the European Market Coupling
of electricity exchanges with non-EU countries; exclusive focus only on some particularly low-margin network elements
40
cf. Article 16(8) of Regulation (EU) 2019/943
Reaching full price convergence [i.e. 100% of all hours] is not an objective as such, because it would require overinvestment in network
44
41
cf. Article 15 of Regulation (EU) 2019/943 infrastructures’, ACER Market Monitoring Report 2020 on page 23
28 | MARKET ANALYSIS 2020 MARKET ANALYSIS 2020 | 29You can also read