Locations for Data center enterprises (DCE) in Norway
←
→
Page content transcription
If your browser does not render page correctly, please read the page content below
Locations for Data center
enterprises (DCE) in Norway
Information to potential investors in Data center enterprises
and to developers of new sites for DCEs
DOCUMENT INFORMATION

For:     			Energy Norway

Title:				                  Locations for large datacenters in Norway

Version/date:      		5/ 25.02.2016

Filename:			                Locations for Data center enterprises (DCE).docx

Project: 			                603916-01– Data center enterprices (DCEs) in Norway

Consultant:			              Liv Bjørhovde Rindal

Department:        		       Renewable energy and Environmental issues, Sandvika

Area:    			Energy in industry

Written by:			              Liv Bjørhovde Rindal, Bjarne Follestad, Erling Gunnufsen,
				Bjørn Vik, Anders Granberg

Quality control:   		Lars Bugge

Asplan Viak AS     		www.asplanviak.no

                                         2
CONTENT

1         Foreword								 4

2         Introduction								 5

3         Summary						 		 6

4         Definitions and abbreviations						 8

5         Data center enterprices (DCE) – a growing
          industrial sector in the modern web-based world				 9

    5.1   Effects of establisments of DCEs Example:
          Facebook datacenter in Luleå, Sweden					 9

6         Advantages by choosing Norway as location for DCE 			10

    6.1   Access to renewable, reliable and favorably priced electricity			               10

    6.2   Fiber access and connectivity in Norway       				26

    6.3   Some important cost factors and general guidance				27

7         The Data center industry 						29

    7.1   Types of data centers							29

8         Description of site selection criteria – what are DCE developers looking for?   31

    8.1   Locations								31

    8.2   Set of criteria   							31

    8.3   Evaluation of criteria     						32

    8.4   Other physical criteria    						41

9         Appendix								43

    9.1   Appendix 1: Contact lists some regional grid companies         		43

    9.2   Appendix 2: Fiber / connectivity						44

    9.3   Appendix 3: Locations							50

                                                    3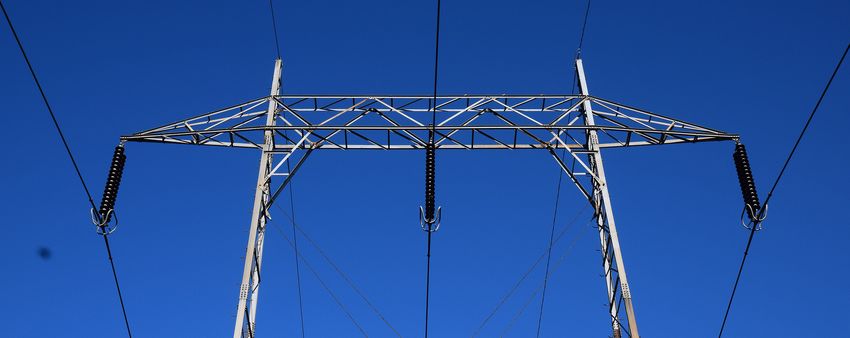
1 FOREWORD

This report has two main objectives:
   -- To provide important information about advantages by choosing Norway as location for Data
      center enterprises (DCE).
   -- To provide useful information for developers concerning the most common criteria used in
      international selection processes of locations for DCEs.
The report is produced for the Norwegian power industry in order to visualize the benefits for location
of DCEs in Norway as access to power based on renewable energy sources can give a competitive
edge.
The scope of the project has been to identify a set of criteria that possible data center sites need to
fulfill in order to be relevant for DCE investors. This can help communities, site developers and others
interested in attracting DCEs to develop well prepared business plans for international marketing.
Energy Norway has initiated the work and several power companies in Norway have been
contributing: Agder Energi, Akershus Energi, BKK, EB Nett AS, E-Co Energi, Eidsiva Energi,
Helgelandskraft, Lyse Energi, Nord-Trøndelag Energiverk, Ringerikskraft, Salten Kraftsamband, Sogn
og Fjordane Energi AS, Skagerak Energi, Statkraft Energi, Tafjord Kraft, Troms Kraft, Varanger Kraft
and Østfold Energi.
Atle Haga (Statkraft) has led the working group. Dag Roar Christensen (Energy Norway), Ann-Mari
Løberg Knudsen (BKK) and Øyvind Stakkeland (Agder Energi AS) have been part of the working
group and contributed with valuable insight. The project also has a reference group consisting of
representatives from the participating power companies.
Asplan Viak has been responsible of writing this report, in cooperation with Bjørn Vik and Anders
Granberg. Vik is an expert regarding connectivity and fiber networks, and Granberg has been involved
in the establishment of the Facebook data center in Luleå.

Sandvika, 15.03.2016

Liv Bjørhovde Rindal       			                                  Lars Bugge
Consultant          					                                       Senior consultant

                                                   4
2 INTRODUCTION

There is a growing international demand for new data centers. Due to positive underlying factors
such as stable governments, stable natural conditions such as climate and geophysical stability,
outstanding access to renewable power, and ease of doing business, the Scandinavian region is well
suited for this kind of industry.
Sweden, Finland and Denmark have already seen such establishments take place, represented by
Facebook in Luleå - Sweden, Google in Hamina – Finland and Apple in Viborg - Denmark.
Establishment of a Data center enterprise – DCE, with a need for power > 100 MW, in Norway would
pave the way for further establishments of other types of data centers and colocations, demonstrating
that Norway can offer competitive conditions for the data center industry.
This report is meant to stimulate processes that will lead to establishment of DCEs in Norway. On this
background, the report focuses primarily on two objectives:
   -- It gives relevant background information about advantages by choosing Norway as host country
      for new DCEs. This information is mainly intended for international investors. (Chapter 5)
   -- It describes the most common selection criteria used by international actors when identifying
      new DCE locations. These criterions may to a certain extent also be applicable for developers
      of smaller centers. This information is mainly targeted at Norwegian site developers. A number
      of Norwegian sites currently in development process are included, mainly to illustrate how the
      criteria may be applied. (Chapter 6 and 7)

As an illustration, and perhaps also as inspiration, chapter 4 describes some important aspects about
the Facebook establishment in Luleå, Sweden.

                                                  5
3 SUMMARY

For DCE investors, Norway scores relatively high on site selection criteria. Norway offers a stable
democratic, well educated society with a strong national economy. The nature of physical conditions
and climate are favorable, eliminating threats such as earth quakes, floods, hurricanes etcetera.
More important, Norway can offer vast amounts of power from renewable sources at favorable prices.
The country has hosted power intensive industry for decades and is well used to doing business
with foreign industrial investors. Based mainly on its hydropower resources, and its integration with
neighboring countries, Norway can offer strong security of supply. Current reliability in the high
voltage grid is 99,985%.
Norway is still expanding its renewable energy production capacity, thereby contributing to a climate
friendly future. Via the Norwegian / Swedish elcertificate scheme, a DCE establishment in Norway will
take part in this renewable expansion.
Norway has already a number of sites that offer well developed fiber access and connectivity.
The infrastructure is constantly expanding and the number of sites able to offer redundant fiber
connections to the European continent is growing accordingly.
Municipalities and regional authorities are generally positive towards DCE plans, offering necessary
infrastructure and cooperation when it comes to necessary building permits etcetera.
The country can offer qualified personnel, and for a number of potential sites, a DCE will be able to
connect to universities and/or R&D for developing technology and skill further.
Norwegians are used to communicate via foreign languages and do business with foreigners.
With easy access to substantial amounts of electricity from renewable sources, expanding fiber
capacity and large areas suitable for developments, Norway represents interesting possibilities
for DCE investors. A number of Norwegian actors are in the process of preparing sites that may be
developed within a relatively short timeframe.
In order to present a well prepared location for a Data center enterprise, the most important criteria
evaluated in this report are (not ranked):
   -- Access to power: redundant supply, N-1, voltage level >132 kV
   -- Access to fiber: N-2, direct routes to the international nodes, preferably dark fiber
   -- Area size: larger than 100 000 m2, preferably 400 000 – 500 000 m2
   -- Infrastructure:
      • Road access; paved 2-lane road
      • Airport: within 1 hour, preferably international airport
   -- City center < 40 minutes, with educational resources of relevant academic routes
   -- Proactive and professional landowner and regional cooperation in place
Also other criteria are used in the process of selecting locations for a DCE. The most common ones
are mentioned in the previous text.

                                                   6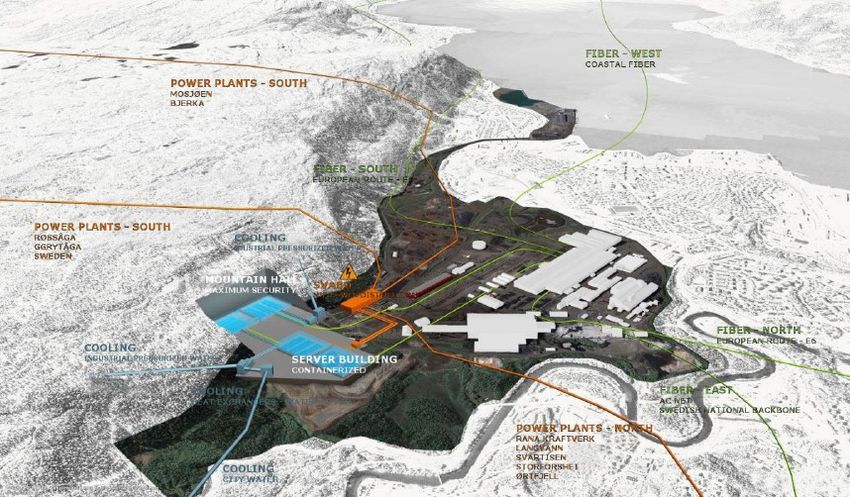
There is a rapid technological development within the data center industry. Thus, criteria that are
common today, may prove insufficient or less relevant in a few years, even months. It is therefore
important that the location developers take a responsibility to stay updated on new technology and
developments in the industry, in order to position their locations for future investors.
The perfect location for a large data center is hard to find, and often compromises must be made
in the location process. The criteria described in this report should be used as guidelines for
development, in order to for instance intensify zoning processes. If one location has many good
qualities, but lacks others, one should look for aspects that can compensate. This way, a good total
location can be presented to the market, even if some of the criteria are not fulfilled.
In the process of attracting the DCE, commitment and participation from municipalities, regional
authorities and government as well as energy companies, fiber suppliers etcetera is needed.
Locations distant from city centers are more difficult to market. For these locations, the economic
conditions as competitive parameters are of higher importance.
There is a lot of activity in development of the locations in Norway. A number of locations are not yet
sufficiently developed, but may be suitable for DCEs in the near future. Several of the locations may
also be well suited for smaller data centers or colocations.
There are probably also opportunities in locations not yet on the list that may be well suited for DCEs.
During the project period, new locations have come forward that was not initially part of the project.

                                                    7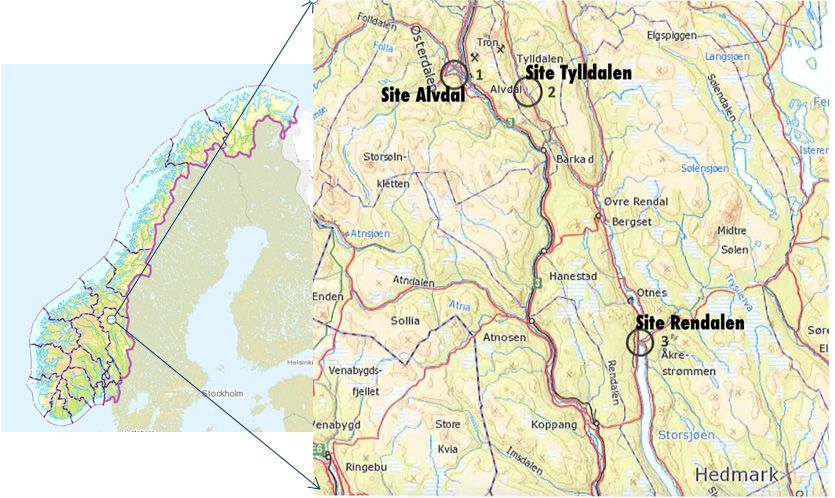
4 DEFINITIONS AND ABBREVIATIONS

Abelia              Business Association of Norwegian knowledge- and technology based enterprises,
                    associated with Norways largest employers’ organisation; the NHO (Confederation of
                    Norwegian Business and Industry).
                    http://abelia.no/english/category255.html

Colocation          Type of datacenter, see point 5.1.2 for definition

Dark fiber          Dark fiber refers to unused fiber-optic cable, which is available for a third party without
                    linking them to the fiber-owners services /
                    products. Dark fiber connected forward to Metro/POP

DCE                 Data Center Enterprise, see point 6.2 for definition

EEX                 European Energy Exchange

Energy act          The Act relating to the generation, conversion, transmission, trading, distribution
                    and use of energy etc. of 29 June 1990 No. 50 (the Energy Act) sets the framework for
                    organization of thepower supply in Norway.

ENTSO-E             European Network of Transmission System Operators for Electricity

Innovation Norway   Supports innovation and development of Norwegian enterprices and industry

Jernbaneverket      Jernbaneverket is the Norwegian government’s agency for railway services, providing
                    train companies with a safe and efficient transport system.

Latency             Time delay used as measuring concept in IT industry (delay from one site to another
                    site?)

METRO/POP (fiber)   Metro is a city network.
                    POP is an physical location where technical equipment can be defined as a demarcation
                    point or a location where network entities meet/connect. Definition on

MPE                 Ministry of Petroleum and Energy

Ms                  A millisecond (from milli- and second; symbol: ms) is a thousandth (0.001 or 10¯³ or
                    1/1000) of a second

NASDAQ OMX          Financial power trading exchange. At NASDAQ OMX, one can hedge prices for purchase
Commodities         and sale of power for up to ten years in advance.

Nord Pool           Nordic power exchange

N-1 related to      A location should be able to offer at least two redundant power lines to the site
power

N-2 related to      A location should be able to offer at least three redundant fiber routes to the site
fiber

NIX (IX)            National commercial fiber access point

NVE                 Norwegian Water Resources and Energy Directorate

Statnett            Norwegian TSO – 100 % government owned

TDC                 Tele Denmark Corporation

TSO                 Transmission System Operator (power), in Norway Statnett

TWh                 terawatt hour = 109 kWh = 1 billion kWh

WDM (DWDM)          In fiber-optic communications, wavelength-division multiplexing (WDM) is a technology
                    which multiplexes a number of optical carrier signals onto a single optical fiber by using
                    different wavelengths (i.e., colors) of laserlight. This technique enables bidirectional
                    communications over one strand of fiber, as well as multiplication of capacity. See point
                    7.3.2 for illustration

                                                      8
5 DATA CENTER ENTERPRICES (DCE) – A GROWING
  INDUSTRIAL SECTOR IN THE MODERN WEB-BASED WORLD.

Every time you click into a web-page from your mobile phone or lap top, pieces of information travels
at the speed of light, often between continents. Your information is processed and stored somewhere
- we might point at “the cloud”, but actually the information goes into computers in specialized
computer centers.
As this information flow increases, and more and more data needs to be processed, new data centers
are built around the world. Data centers need access to IT infrastructure (fiber), large amounts of
electric power and skilled personnel, all preferable available at places that can be described as
socially stable. They represent large investments providing jobs and economic development. That’s
why there is an international competition going on, between companies, cities, municipalities and
countries that all want to attract construction of new DCEs.
The following description of the Facebook DCE in Luleå, Sweden might explain the background for this
competition further.

5.1 Effects of establisments of DCEs Example:
Facebook datacenter in Luleå, Sweden
In October 2011, Facebook announced that Luleå in northern Sweden would be their site choice for
a new “Mega data center” in Europe, the company’s first large-scale investment outside the United
States. The planned investments includes three data centers, and a total estimated power demand of
120 MW. The Facebook data center in Luleå is an example of how establishment of a large data center
can create jobs, values and spin-off effects for a whole region.
The Facebook establishment has changed the regional self-image in the north of Sweden into
regional pride to succeed attracting one of the world’s strongest brands into the region. The new
forms of regional cooperation in a joint marketing company as well as concrete initiatives to develop
a new dynamic innovation environment are other results of a changed view concerning future
opportunities.
In simple terms, there are three phases in a data center creation: construction phase, deployment
phase and operational phase. A study from Swedish Agency for Economic and Regional Growth from
May 2014 describes the direct effects of the establishment in terms of
    -- jobs
    -- the impact on the local/regional economy as well as indirect effects
    -- changes in applications to higher education
    -- a change in the regional attractiveness outwards and a developed internal self-image
The quantitative effects estimate to (with one of three planned data centers operational) about
120 new direct jobs plus about 30 indirect jobs in the form of monitoring missions. In March 2014
Facebook decided to begin the second building which is currently under completion and therefore
not yet included in the study. The study forecast that a fully developed facility with three buildings will
result in additional 260 new jobs. It will also create up to 300 construction jobs per year during the
establishment period 2011-2017.
In another report the Boston Consulting Group predicts that the total economic impact of the
Facebook investment by 2020 will be 1 billion EUR and 4500 new jobs in a 10-year perspective.
Other results are tied to expanded regional cooperation in the sales and marketing company The
Node Pole. These results are based on a joint brand and participating municipality’s proactivity with
offerings that are priced and ready to build.
The Facebook investment paved way for further DCE investments in the region. In Boden, 35 km
west of Luleå, the establishment of KNC Miner in Feb. 2014 and the establishment of yet another
data center Hydro66, in May 2014, are effects of the proactive work by local and regional actors, also
supported by the Swedish government. In short time it has created 100 new jobs in Boden, and the
investments continue.
Research and Development at Luleå University, have led it into new areas and environments
generating new dynamic innovation.

                                                     9
6 ADVANTAGES BY CHOOSING NORWAY AS LOCATION
  FOR DCE

This chapter provides investors and companies considering investments in power intensive
industrial activity like DCEs in Norway, with background information about the Norwegian power
system.
It also gives a description about fiber access and connectivity.
Lastly it summarizes some important cost factors and gives some guidance for those who want to
investigate and follow up actual site candidates in Norway.

6.1 Access to renewable, reliable and favorably priced electricity
Access to stable, reasonably priced, renewable power is crucial when selecting sites for new DCEs.
Numerous Norwegian sites under development will meet the most demanding requirements in this
regard.
Having among Europe’s largest hydro power capacity, Norway can offer electricity based on renewable
sources, delivered via a grid with excellent operating performance. Increased renewable power
capacity, including wind power, will be developed in the years to come. The balance between supply
and demand will be favorable for DCEs, offering stable market conditions and reasonable prices. This
chapter will explain how and why.
Almost all Norwegian electricity is generated from hydropower. The hydropower system, including a
very well-functioning and stable grid has been developed since the late 1800s.
Norwegian hydro power resources have attracted energy intensive industry especially within
aluminum and ferro alloys production. It has formed basis for Norwegian initiated companies like
Elkem and Hydro.
Norway is the world’s sixth largest hydropower producer and the largest hydropower producer
in Europe. Metal-, together with pulp and paper industry has utilized roughly 30-40 TWh/year
corresponding to 25-30% of the national generating capacity, the last 30-40 years.
In order to evaluate Norway as host country for establishment of DCEs, a short view into its power
sector is therefore advisable.

6.1.1 HISTORICAL DEVELOPMENT
Since the energy act of 1991, the Norwegian power sector has been market based. In the period
following the liberalization, Norway has had a net export in 13 years and a net import in 8 years. Total
net export in the period 1991-2011 was 57 TWh.

                                                   10
6.1.2 ELECTRICITY RESOURCES
During the period 1998-2013, the average Norwegian electricity production has been approximately
135 TWh/year. In 2014 it totaled close to 142 TWh, of which 136 TWh was produced by hydropower, 2.2
TWh by windpower and 3.6 TWh by thermal power plants.
The corresponding capacity in beginning of 2013, was 32 860 MW, of which hydro power constitutes 30
509 MW, wind farms 705 MW and thermal power plants 1 646 MW.
FIGURE 6-1
Installed hydro power capacity in Norway, 2014.
The annual water inflow, largely determined by precipitation, adjusted for changes in reservoirs,
determines the produced power volume. The water inflow varies from year to year, as much as 60
TWh from a wet to a dry year.
FIGURE 6-2
Annual inflow in the Norwegian hydropower system, 1990-2013.
11The annual power production varies with the inflow, and is shown in the figure below. Note that
capacity has increased approximately 0.5-1 TWh/year the last 10 years.
FIGURE 6-3
Annual inflow in the Norwegian hydropower system, 1990-2013.
In principle, Norway has the possibility to expand its hydro power production significantly. But various
environmental, technical, financial and political factors determine the growth rate. In recent years,
the increase has come largely through upgrading and expanding existing hydropower plants.
In addition to its hydro power, Norway also has vast wind power resources.
Norway and Sweden have established a common support regime – the electricity-certificate market
with incentives for new power production based on renewable resources – mainly wind and hydro.
From 2012 to 2020 the aim is to increase the power production in Norway and Sweden by 28.4 TWh/
year, see 6.1.9.
50.9 Developed
Underdeveloped
Development permit granted
4,8 131,4 Licence applied for/application notified
13,9 Small power plants, incl. upgrades/expansions
Protected/rejected
7,7 New power production exceeding 10 MW, incl.
upgrades/expansion
3,6
1,5
FIGURE 6-4
Overview of the Norwegian hydropower potential as of January 2014, in TWh/year. | Source: NVE.
126.1.3 NORWEGIAN POWER SECTOR, ORGANIZATION AND OWNERSHIP.
The Norwegian power sector is owned and operated by a large number of actors within generation,
transmission and trading of power. In 2014 there were 183 producer companies, and 159 grid
companies (Ministry of Petroleum and Energy (MPE), 2015). A number of the actors are involved both
generation and trading.
Municipalities, counties and the Norwegian State own approximately 90% of Norway’s electricity
generation capacity. The State owns about one third of the capacity through the state owned
enterprise Statkraft. Many production companies have several owners and there is a significant level
of cross-ownership.
All producers, grid owners and/or traders of power must have an electrical license from the
Norwegian Water Resources and Energy Directorate (NVE).
6.1.4 ELECTRICITY INFRASTRUCTURE
The transmission grid links producers and consumers in a national system. The transmission grid is
tied to corresponding grids in the Nordic countries as well as mainland Europe.
In the Norwegian power sector, it is common to differentiate the transmission grid in three levels:
-- The central grid represents the “highways” in the power system. It normally carries a voltage of
300 to 420 kV, and down to 132 kV in some parts of the country. The total length of the central
grid is about 11 000 km.
-- The regional system links the central grid with the distribution grid (see below). It may also
include production and consumption radials carrying higher voltages. In other countries this
part of the grid is often given the term distribution grid, with voltage levels between 50 and 132
kV.
-- The distribution grid supplies power to end users (households, services and industry). It has a
normal voltage of up to 22 kV.
DCEs will normally be connected to the grid at voltage levels of 132 kV or more.
As other types of infrastructure, the electricity grid is operated as a natural monopoly, and grid
operations are therefore not exposed to competition. The monopoly role of the grid companies is
controlled through detailed legislation and control by the NVE. An important task for NVE is to make
sure that the grid companies operate the grid so that consumers experience high availability within
reasonable costs, and at the same time avoiding these companies to gain monopoly profit.
Statnett is a government owned enterprise, serving a role as the transmission system operator (TSO)
in Norway. Its main responsibilities include ensuring a stable and secure supply of electricity by
coordinating production and consumption, developing the transmission grid and offering equal access
to the transmission grid to market actors.
Its main tasks are to balance generation and consumption of electricity, and take responsibility for
operation and development of the transmission grid. Statnett is subject to monopoly controls by the
NVE. In addition, Statnett has so far been responsible for development and operation of cross-border
interconnectors. Statnett represents Norway in the European Network of Transmission System
Operators for Electricity, ENTSO-E.
136.1.5 SECURITY OF SUPPLY
Norwegian power supply is known to be very stable. During 1996-2013, the reliability was 99.99%, and
is currently at 99,985. See figure 6-5.
Over the years, interconnectors have integrated Norway into the Nordic and North European power
system. Initially, this was largely done to prevent shortages in years with precipitation below average.
More recently, new interconnectors have been built to tie Norway closer to other power markets
in order to optimize operation of the thermal power systems on mainland Europe with the storage
capacity in the Norwegian hydro power system. The import/export capacity is expected to increase in
the coming years, also contributing to strengthen security of supply.
High security of supply is also achieved by cooperation with power intensive industry actors. Such
actors can through a market solution offer important flexibility by reducing production levels in times
with low grid and/or generating capacity. This can also be a commercial opportunity for DCEs.
The Norwegian power system is already almost 100 % based on renewable sources. Unlike many
other European countries, Norway will therefore not need to undergo large system changes when
shifting from oil, coal and nuclear power to renewable generation. These transition processes are
believed to represents a risk element concerning security of supply – and that is not the situation in
Norway.
100,00%
99,99%
99,98%
99,97%
99,96%
99,95%
99,94%
notified interruptions
99,93%
not notified interruptions
99,92%
Total
99,91%
99,90%
1996
1997
1998
1999
2000
2001
2002
2003
2004
2005
2006
2007
2008
2009
2010
2011
2012
2013
2014
FIGURE 6-5
Delivered reliability in the Norwegian central grid. 99,985% in 2014 | STATNETT.NO
14FIGURE 6-6
Norwegian transmission grid overview map. | Source: Statnett.
A more detailed map can be studied at the NVE web-site: http://gis3.nve.no/link/?link=nettanlegg
156.1.6 GRID TARIFFS
Grid companies, being natural monopolists, may not collect tariff revenues that exceed a revenue cap
set by the NVE.
Grid tariffs on the central and regional levels consist of a variable charge component per kilowatt hour
(kWh), and a fixed capacity charge per kilowatt (kW) load. Grid companies may also collect investment
contribution charges from actors that need special investments (connection lines, substations
etcetera) in order to connect to the grid.
The grid tariff is supposed to cover costs occurring at all three grid levels. However, consumers
directly connected to the central grid, for example most power-intensive industry, pay a tariff based
solely on costs at this level. Consequently, the grid tariffs are normally lower for power-intensive
industry compared to other consumers.
In the central transmission grid operated by Statnett, the standard tariff for 2016 is 23 EUR/kW.
This tariff changes annually, usually with minor adjustments. The tariff is reduced on individual
basis depending on flexibility, up to a maximum of 90% for large consumers (more than 15 MW) with
constant load all year around. A DCE may typically qualify for such reduced tariffs. In addition, large
consumers may obtain reduced tariffs (up to 50%) in areas where the consumption is co-located to
power production, due to the co-location’s reduced demand for central grid capacity.
Many regional grid owners have implemented similar models for large customers. In order to
forecast the fixed component for a DCE one would need detailed knowledge of the grid level, the point
of connection and the consumption and production in that particular node. The grid tariff for each
location should be checked individually with the relevant regional grid owner.
If a DCE requires upgrading or building of extra grid capacity, a share of the total cost may be
allocated to the consumer. This cost will depend on the measures that need to be taken to build
suitable capacity and connection for the data center.
The regional grid tariff differs throughout the country. The differences are caused by factors like
challenging natural conditions and population distribution. The tariffs can be obtained from the
regional power company in the area. Contact list to some key regional grid owners can be found in
appendix 1.
166.1.7 THE NORWEGIAN AND NORDIC POWER MARKET
Since 1991, the Norwegian power sector has been market based. Determination of power prices has
been a question of supply and demand. Sweden, Denmark and Finland, and many other EU countries,
have followed suit with similar legislation. This market model has been instrumental in ensuring
cost-efficient utilization of the power system. The power trading takes place in a physical market and
a financial market.
In the physical market, price of power is determined every day on the Nord Pool Spot power exchange
(www.nordpoolspot.com). Prices in a shorter time frame are functions of parameters such as
precipitation and temperature, grid conditions (e.g. bottlenecks), and the inflow situation. In a more
distant time frame, prices are dependent on how capacity matches demand. In recent years the
Nordic power market has experienced relatively low prices due to power production increase, energy
efficiency measures and reduced demand from power intensive industry.
The prices also depend on transmission conditions, both between areas and countries within the
Nordic region and between the Nordic region and the rest of Europe. Since there are periodically
congestion / bottlenecks in the grid, power prices may vary from one area to another.
Norwegian authorities have chosen a market-based system for handling the bottlenecks which arise
in the grid as a result of the power market, so called “elspot areas”. This is a geographical area for
buying and selling power between other elspot areas. ”Elspot” refers to the spot market for physical
power turnover (wholesale) on the Nordic power exchange Nord Pool Spot AS. Norway is divided into
five such areas, Sweden into four and Denmark two, while Finland constitutes of one elspot area.
(Figure 6.7)
The physical Nordic power market consists of three separate markets:
-- “El-spot” constitutes the day-ahead market
-- “Elbas” represents the continuous intraday market.
-- “Balancing market” operated by Statnett and designed to maintain balance in the physical
market.
Each day, the Nord Pool Spot power exchange calculates the system price for each hour of the
following day. The system price is the same for the entire Nordic market and reflects the overall
generation and consumption conditions. The price of power in Norway is mainly determined by supply
and demand in the Nordic market, but also by power markets in countries outside the Nordic region,
in which the Nordic market interacts.
17FIGURE 6-7
The Nordic elspot areas, including import/export capacity between the areas, and
between the Nordic region and neighboring countries (in MW). | Source: Regional
Investment Plan 2014 Baltic Sea, ENTSO-E
18FIGURE 6-8
Norwegian area prices vs. system price 2000-2015. | Source: Nordpoolspot.com.
As figure 6-8 shows, the area prices will differ from the system price. Historically, area prices in south
and western Norway (NO2 and NO5) have in significant periods been lower than the system price.
The financial market includes future and forward contracts, contracts for difference and options.
Financial power trading can take place both bilaterally and on the power exchanges. In the Nordic
countries, financial trading takes place mainly on the NASDAQ OMX Commodities exchange. At
NASDAQ OMX, one can hedge prices for purchase and sale of power for up to ten years in advance.
Financial market Physical market
NORDPOOL
STATNETT STATNETT
NASDAQ-OMX SPOT
El-spot Elbas - Balancing
Balancing
- day intra power
accounting
ahead day market
market market
Time
10 years - 24 hours prior 35 hours - 1 hour prior Hour of operation After the hour of
to hour of operation to hour of operation (current hour) operation
FIGURE 6-9
The Norwegian power markets. | Source: Ministry of Petroleum and Energy (MPE)).
19FIGURE 6 -10
http://www.nordpoolspot.com/Market-data1/Elspot/Area-Prices/SYS1/Yearly/?view=table
6.1.8 THE NORWEGIAN AND NORDIC POWER MARKET- HISTORIC AND FUTURE
DEVELOPMENTS
Figure 6.10 shows historical power prices in the Nordic area 2000-2014. The Nordic power price
varies considerably mainly due to weather trends. This is mainly because the Nordic area has a very
high share of renewables in the electricity production, but also because electricity is the main energy
supply in households. In simple terms, the price tends to be high if it is a dry and cold year, and low in
wet and warm years. The Nordic power price also depends upon fuel prices and carbon price, largely
because the market is connected to thermal generation capacity in Germany, Poland and the Baltics.
As figure 6.10 shows, the power price increased dramatically after year 2000. This was mainly due
to increased fuel prices internationally, but also because of a strained power balance in the Nordic
market. The introduction of EU emissions trading system (EU ETS) in 2005 also affected the power
prices in the Nordic, as it increased the costs of fossil generation.
After a period of scarce power balance and high power prices in 2006-2009, the demand was gradually
affected by the structural change in pulp and paper sector and by the large downturn in industrial
activities caused by the financial crisis. The power prices are also largely affected by weaker fuel-
prices the last few years.
EUs 20-20-20 targets for renewables and energy efficiency has also affected the power balance in
the Nordics, by adding more renewables and focusing on energy efficiency measures and conversion
from fossil fuels to renewable energy sources. Norway was through the 20- 20- 20 targets, obliged to
increase the share of energy from renewable sources to 67.5 per cent of its gross end consumption
of energy in 2020. Norway chose to solve this mainly through the joint Swedish-Norwegian electricity
certificate scheme to encourage new renewable production adding up to 28.4 TWh generation
capacity. This increase will come in the period from 2012 till 2020 in Norway and Sweden combined.
The Norwegian government has also had an energy efficiency policy through the state enterprise
Enova and by imposing increasingly stricter building codes. This has resulted in reduced growth rate
in power consumption.
All these factors – and a similar development in Sweden - have led to a general market expectation
of a large surplus of power in the Nordic area the next 15-20 year. The size of the expected surplus
varies according to marked analysts’ forecasts, but a sketched area of expectations is outlined in
figure 6-11.
20FIGURE 6 -11
Expected surplus of power in the Nordice power market in coming years including highest and lowest expectations according to
external analysis companies | Source: Statkraft.
This expected power surplus, combined with the tumbling prices of fossil fuels, provides an outlook of
further weak Nordic power prices for the next years. The last few years there has been an increased
interconnection between the Nordic countries and Germany, but the utilization of the interconnections
has been declining. Because of the rapid expansion of new on- and offshore wind power in the north
of Germany along with lagging grid expansions in Germany, the grid operators have had to make
considerable restrictions on the usage of the interconnectors. This problem has been increasing over
the last few years, and the situation will probably persist until the German grid is adequately enforced
or German market has been split in several price areas.
There are several planned increments in interconnection capacity from the Nordic countries to both
Germany and UK within 2025.
As figure 6-12 shows, the market prices for the next 10 years reflects an expectation of persisting
weak prices in the Nordic market.
FIGURE 6-12
Nordic power contracts for the next ten years, currently trading at all time low at NasdaqOMX.
Closing prices 11. March 2016: http://www.nasdaqomx.com/commodities/market-prices/history
216.1.9 ELECTRICITY CERTIFICATES
As a measure to stimulate investments in renewable power production, the Norwegian-Swedish
electricity certificate (elcertificate) market was established 1 January 2012. Norway and Sweden have
a common goal of increasing the renewable electricity production by a total of 28.4 TWh in the period
2012-2020.
An elcertificate is an electronic document proving to a final customer that the corresponding 1 MWh
of electrical energy was produced from renewable sources. New built renewable power plants are
entitled to elcertificates following certain criteria and approval by NVE in Norway (and similar in
Sweden).
Power consumers, with some defined exceptions, are obliged to cover a certain amount of their
consumption with elcertificates (quota obliged consumption). This creates the demand for electricity
certificates in the market. In 2016, power consumers in Norway have to pay for electricity certificates
corresponding to 11.9 percent of their electricity consumption. When the quota curve peaks in
2020, the consumer will have to pay for electricity certificates for 19.7 percent of their electricity
consumption. From this peak level it will gradually be reduced towards zero in 2035, when the system
is scheduled to be phased out.
Electricity-intensive industries have an elcertificate cost only for the proportion of the electricity which
is not used in the manufacturing process. DCEs will have to pay for elcertificates – as is also the
situation in Sweden.
For most consumers the power suppliers handle the elcertificates obligation.
The actual additional costs for the consumer are determined by the electricity certificate price, which
will vary according to supply and demand.
For a DCE with an annual power consumption of 700 GWh, annual cost for elcertificates in 2016 - with
certificate prices in March 2016 – will be approximately 12 mill NOK and in 2020 approximately 19 mill
NOK.
DCEs will need to cover cost for elcertificates, thereby contributing to expansion of renewable power
capacity in Norway. For more information, see
http://necs.statnett.no/(S(3mpnez554bvae4v1pgr3bsue))/default.aspx
FIGURE 6-13
Certificate quotas for Norway.
221. 2. 3. 4. 5.
Electricity producers The electricity Demand for electricity It is the electricity end Each year, the body
receive one electricity certificates are sold certificates is users who finally pays with quota obligation
certificate for each on the electricity created by electricity for the expansion must cancel
megawatt-hour certificate market, suppliers and of the renewable electricity to fulfil its
(MWh) of renewable where supply and some electricity electricity production, quota obligation.
electricity produced demand govern the end users being as the cost of the
for a maximum of 15 price. In this way, the obligated ly law to buy electricity certificate
years. producers receive an electricity certificates is part of the
extra income from the corresponding to a electricity invoice.
electricity production certain proportion
in addition to the (quota) of their
price of the electricity. electricity sales or
usage.
FIGURE 6-14
Illustration of the electricity certificate market.
236.1.10 GUARANTEES OF ORIGIN
The European scheme of Guarantees of Origin (GO) is also relevant for increase in renewable
production. A GO is an electronic document proving to a final customer that a corresponding 1 MWh
of electrical energy was produced from renewable sources somewhere in the power system. This
guarantee is unique.
The Renewables Directive 2009/28/EC specifies that all producers of renewable power have a right to
receive guarantees of origin for their renewable power production, on a request from the producer.
The Norwegian Energy law § 4-3 states that Statnett has a duty to issue GOs.
A GO is in other words simply a product declaration guaranteeing that one MWh of electricity has
been produced from renewable energy sources. Customers who choose to purchase GOs can be
certain that a similar amount of electricity is produced based on renewable soruces as the amount of
electricity he has bought GOs for.
A large majority among Norwegian hydro power producers issue GOs, and the guarantees may be
purchased in the voluntary GO market. There is no fixed price for a GO, and their value depends on
market demand. The prices of standard Nordic GOs has been low the last few years, typically ranging
between 0.05-0.20 €/MWh. GOs of Nordic power are, however, currently trading at 0.30 €/MWh (Feb
2016).
FIGURE 6-15
Market development GOs in Europe Europe – TWh/year. | Source: AIB (Association of Issuing Bodies), February 2015.
24FIGURE 6-16
Price development of Nordic GOs 2013-2015. | Source: EEX.
256.2 Fiber access and connectivity in Norway
The fiber market or availability in Norway is characterized by a relatively large number of suppliers
with separate fiber grids and privately owned infrastructure. The main national market actors are
Telenor, Broadnet and Altibox. There are also several other semi-national fiber operators;
- TDC - Tele Denmark Corporation
- BKK - Bergenshalvøens Kommunale Kraftselskap
- NTE - Nord-Trøndelag Elektrisitetsverk
- Eidsiva Energi
There is no national entity with a responsibility for regulation or operation of the fiber infrastructure,
and the market of fiber capacity evolves in response to the market demand.
Telenor and Broadnet are the two national providers of fiber capacity in Norway. These suppliers
have coverage all around the country. Both suppliers have dark fiber in the portfolio to be rented on
request.
Regionally, many power companies have established separate entities that provide dark fiber for
rent. Examples may be Eidsiva who can provide dark fiber within own region, to Sweden and Oslo-
Trondheim.
BKK, Lyse Energi and others, including Statnett (Norwegian TSO), may also have available capacity on
request. On the route from Oslo to Europe dark fiber may be available from Level3, Ip-Only, Telenor
and others may also have available capacity on request.
Information about dark fiber is not publicly available, but suppliers such as Statnett and Broadnet
have indicated interest in selling capacity of dark fiber. Telenor is providing optical lines with their
WDM system.
266.3 Some important cost factors and general guidance
6.3.1 COST OF POWER FOR END USERS
The total electricity cost consists of the following elements:
-- Electricity wholesale price (power price)
-- Connection to and use of the power grid (grid tariff)
-- Consumption tax on electricity (electricity tax)
-- A fee earmarked for the Energy Fund (Enova)
-- Payment for elcertificates
-- Value added tax. Note that the value added tax is calculated on basis of all the other price
elements
The cost of electricity itself is determined in the power markets, see 6.1.7.
The grid costs will vary in accordance with actual grid owner tariffs, see 6.1.6
The electricity tax in general was set at NOK 0.16 per kWh for 2016. For certain industrial end users a
reduced rate was set at NOK 0.0048 pr kWh. The Norwegian Parliament has decided that DCEs with
power demand higher than 5 MW will be eligible for the reduced rate.
End users pay grid tariff, taxes and Enova fee (NOK 0.01/kWh) to the grid company.
The power supplier is responsible for collecting payment for electricity certificates. These vary
according to the certificate market which is described in 6.1.9
Below is a summary of cost component that make up the total power cost.
Example: Total cost of electricity for a DCE located in the Oslo area in Norway for the year 2017.
Assumptions: 100MW load 8760 hours per year, VAT not included.
Electricity wholesale price 16,50 €/MWh 1)
Adjustment for area price/basis risk - 0,60 €/MWh 2)
Electricity tax 00,49 €/MWh 3)
Energy Fund fee 01,03 €/MWh 4)
Elcertificate 02,08 €/MWh 5)
Guarantees of Origin 00,30 €/MWh 6)
Electricity cost exclusive grid tariff= 19,80 €/MWh
Grid tariff XX.XX €/MWh 7)
Total electricity cost: XX.XX €/MWh
1. Closing price NasdaqOMX 10/02-16.
2. Closing price NasdaqOMX 10/02-16.
3. Datacentres >5 MW pay 0,0048 NOK/kWh. EUR/NOK 9,70 (10/2-16)
4. Compulsory payment to ENOVA, 0,01 NOK/kWh. EUR/NOK 9,70 (10/2-16)
5. Closing price NasdaqOMX 10/02-16.
See chapter 6.1.9 for details. EUR/SEK 9,53 (10/2-16)
6. Not compulsory, but guarantees that a similar
amount of power is produced from renewable
sources. See chapter 6.1.10.
7. Dependent on various factors, and must be
calculated case by case.
276.3.2 CONNECTION TO THE NORWEGIAN POWER GRID
Large power consumers like DCEs will be connected to the high voltage grid owned by Statnett
and/or the local DSO (Norwegian terminology; regional grid operators). To clarify costs, connection
obligations and requirements etcetera one will need to contact the local grid company. A selection
of grid companies is listed in appendix 1. The local grid company will support DCEs concerning
concessions and other relevant issues towards regional and national rules and regulations.
When developing a DCE location, one will in most cases need a separate permit from Norwegian
Water and Resources directorate, NVE (Konsesjonsbehandling av nettanlegg) for construction and
operation of the DCEs part of the necessary power infrastructure.
6.3.3 FIBER CONNECTION
Within most Norwegian cities there is often more than one provider of physical fiber, and
consequently, there is also a market for «dark fiber». One example can be Oslo, where TDC/GET,
Broadnet and Telenor offer dark fiber lease. Further information in Appendix 2.
6.3.4 PROPERTY TAX
Norwegian municipalities can choose to avoid or impose a property tax, both on private property
and enterprises. The value of the property establishes the basis for the calculation of the tax. The
municipality each year determines the rate of the tax and basic allowance.
The property tax is normally 0.2% as a minimum and 0.7% as maximum for enterprises and
agriculture. On this basis, the total tax will depend upon how the value of the property is evaluated
and the taxation rate selected by each municipality. Property tax will vary from municipality to
municipality, and must therefore be investigated individually for each location.
Property tax is a political issue, and far from all municipalities have imposed such taxes.
The present general rule for taxation of industrial property is that machinery and equipment should
not be included when property is appraised. However, a special property category has been defined
in which machinery etcetera should be included in the appraised value. That is when machinery is an
integrated element in an industrial building complex.
Some of the locations mentioned in this report are situated in municipalities that presently collect
property tax, and some do not.
The Norwegian government has signaled an intention to end taxation of machinery and industrial
equipment as separate elements in taxation of business properties. Two alternative taxation proposals
were presented in June 2015, and a corresponding hearing process ended September 18, 2015.
Both alternatives will mean that the taxation of industrial machinery and equipment in the special
category no longer will be permitted. The Parliament has not yet concluded, but it is expected that
the new property tax reform in general will lead to lower taxation on industrial property, and a less
complex and more predictable tax regime. The issue has large impact on the taxation of DCEs and
should be closely followed up.
6.3.5 AREA PRICE LEVEL
The cost of buying land area is important because it directly influences the profitability of the DCE.
With reference to the DCE development in Luleå, it has been indicated a cost level of 3.0-8.0 EUR/m2.
6.3.6 INVESTMENT SUPPORT
Innovation Norway has generally different types of grants and loans that could be of interest, possibly
with regional differences, and further contact could be made to identify possibilities.
Regional business development funds may be available for planning and preparation of the locations.
Such funds may for example be used to cover part of costs for architects, city planner’s etcetera. The
general advice will be to clarify possibilities for investment support by contact with Innovation Norway,
governmental and regional authorities.
287 THE DATA CENTER INDUSTRY
This chapter is meant to give a short introduction about the data center industry to individuals,
developers, companies and municipalities, interested in developing locations to attract DCE.
7.1 Types of data centers
The nature of data centers vary, but in this report we have divided them into the following three
categories: In-house data centers, colocation data centers, and data center enterprises (DCE), like
Facebook, Google, Amazon etc.. This report focuses on the data center enterprises / DCE.
7.1.1 IN-HOUSE DATA CENTER
These are the most common type of data centers, mostly serving one customer and located within the
premises of the company using the center for its own business.
7.1.2 COLOCATION DATACENTERS
Colocation data centers are often developed by actors having such facilities as main core business,
e.g. a site developer, offering the following services:
-- Robust power supply including back up capacity
-- Robust cooling capacity
-- Connectivity
-- Safety (fire, crime, surveillance etcetera)
A colocation center can offer services to a number of different customers. Norwegian examples of
colocation centers are:
-- Green Mountain Datacenter in Rennesøy
-- Lefdal Mine Datacenter in Nordfjord
-- Digiplex in Oslo (Ulven, Rosenholm and Fetsund)
Colocation centers are normally developed step by step, depending on the client’s needs. The size
varies often between 1 – 10 MW.
7.1.3 LARGE DATA CENTERS, DATA CENTER ENTERPRICE - DCE
Large data centers are often called “Mega datacenters” or “Data center enterprises”, DCE.
The largest of DCEs consumes more than 100 MW on average. International companies establish their
own data centers by buying/renting large areas of land and build and operate the centers themselves.
DCE are connected to the company’s datacenters in other countries. Such centers have high emphasis
on cost efficiency and are often built in less than a year.
When developing a DCE, a large number of possible sites are evaluated by specialized selection
teams. After initial screening processes a number of sites are chosen for further evaluation. In order
to be short-listed, certain minimum criterions must be met. Power and fiber capacities are among the
most important ones.
Although Norway so far does not host any DCEs, it offers interesting qualities for DCE developers.
29Important criteria used in international rankings are:
-- Energy; availability of electricity from renewable sources, security of supply and costs
-- International connectivity (fiber availability and latency)
-- Ease of doing business
-- Tax levels, see also paragraph 6.3.1
-- Political stability
-- Robust, stable national economy
-- Stable climate and minor risks for natural disasters like flooding and earth quakes
-- High education level
-- Favorable cooling conditions with regard to outdoor temperatures and water resources
The ideal location for DCE would meet the following criteria:
-- N-1 access to high voltage electricity grid with sufficient capacity
-- Access to electricity from renewable sources
-- N-2 access to dark fiber routes to international nodes
-- Area size of 400 000 – 500 000 m2
-- Final zoning prepared – ready to build
-- Located close to city center with university
-- Access to road, international airport and harbor/railroad
-- Proactive and professional regional cooperation partners
-- Low costs (grid, electricity, fiber, taxes etcetera)
-- Low risk for natural hazards
-- The following chapter discusses these issues in more detail.
308 DESCRIPTION OF SITE SELECTION CRITERIA –
WHAT ARE DCE DEVELOPERS LOOKING FOR?
This chapter is meant for individuals, companies and municipalities, interested in developing
locations to attract DCEs.
A number of Norwegian locations available for DCEs are in the planning phase. Some commercial
entities are already offering sites and the necessary infrastructure, while others need more
developing work.
8.1 Locations
Specific locations referred to in chapter 8 are taken from the location list in appendix 3.
8.2 Set of criteria
This report defines criterions that presumably need to be fulfilled in order to attract site selection
teams for a DCE development. Such criterions will be a matter of individual evaluation, and may be
changed. The criterions below are set up on basis of input from sources like Data Centre Risk Index,
Innovation Norway, Anders Granberg (representing experience from the Facebook DCE in Luleå)
Statnett, Abelia etcetera.
In the identification and development of suitable locations, some requirements are essential, whereas
others are less important. In the following these criteria will be defined, and examplified.
Criteria numbered 1-10 below have been prioritized in this project analysis, based on the assumption
that these have greater importance than the others in the selection processes. There will be
differences of opinions and investor preferences differ. This list is therefore to be used as a guide, and
not as a final blueprint.
Criteria Specifications Lower limit Chapter
Priority criteria
1 Grid connection point Minimum 132 kV grid point nearby, at 132 kV, N-1 8.3.1
least two lines connected grid point
2 Fiber access and Dark fiber access, with three lines Plans for dark fiber, N-2 8.3.2
connectivity available, with low latency
3 Area size >100.000 m² : 400.000-500.000 m² >100.000 m² horizontal 8.3.3
terrain
4 Road access 2 lane road 8.3.4
5 Infrastructure Airport nearby8.3 Evaluation of criteria
In the following section, the above mentioned criteria including minimum requirements are described.
Locations described in appendix 3 are shown as examples.
8.3.1 GRID CONNECTION POINT
Stable connections of high voltage capacity are essential for DCEs. In this report, the minimum
criterion for power access has been set at redundant high voltage grid close to the location (N-1) with
a capacity of 132 kV or higher. 132 kV, 300 KV and 420 kV are common in Norway.
The process of building new high voltage capacity takes time; therefore locations with nearby access
to high voltage grid will be an advantage.
The stability of the grid is often challenged when large consumers are connected, and detailed flow
analysis should be carried out prior to the establishment, to evaluate the consequences on the
operation of the grid. This aspect must be dealt with by the local and/or regional grid operator in
cooperation with the TSO, Statnett.
It is also important to identify the distance from the location to the connecting high voltage grid, in
order to estimate the cost of the connection. When new substations are needed, suitable locations
must be found.
When developing a DCE location, one will in most cases, need a separate permit from Norwegian
Water and Resources directorate, NVE.
Example: Redundant power supply in Eide site, near Molde.
The grid structure surrounding the location Eide in Molde Region, N-1 fulfilled. Supply lines are 132
KV (blue line) and one is 420 KV (red line) passing the site. There are two sites within the red circle,
see fig 8-1, multiple mountain halls and one greenfield 188 000 m².
Molde
FIGURE 8-1
The grid structure surrounding the location Eide in Molde Region, N-1 fulfilled. Supply line are 132 KV
(blue line) and one is 420 KV (red line) passing next to the site. There are two sites within the red circle.
One multiple mountain halls and one greenfield option188 000 m2
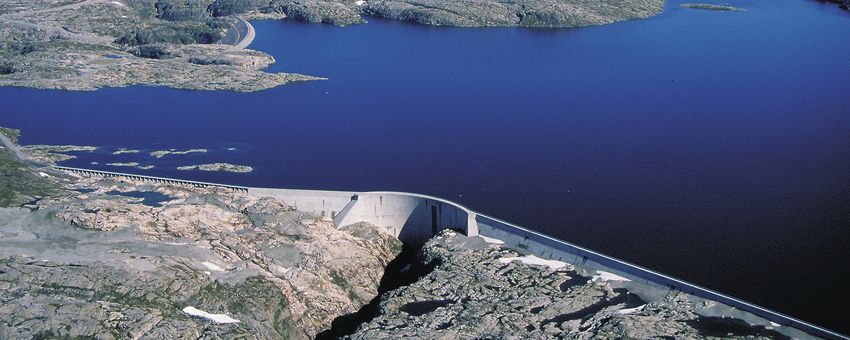
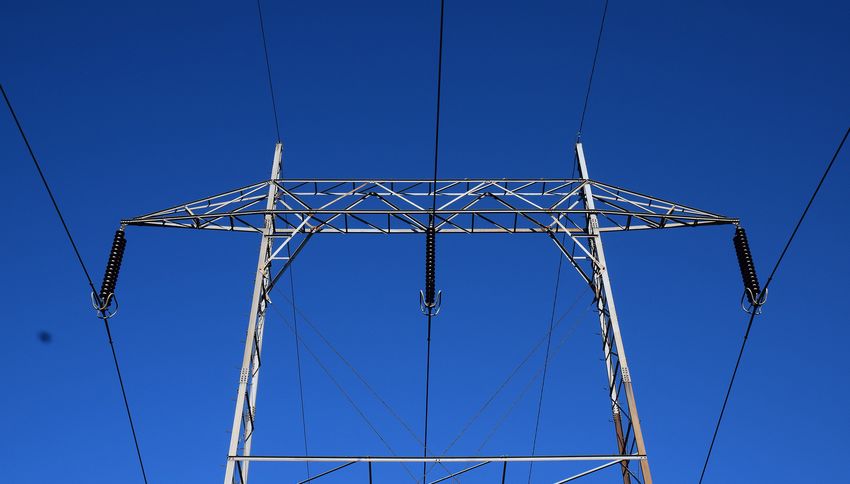
32Example: Redundant power supply in Arctic Cloud Data Center in Mo i Rana.
There is a significant power surplus in the Mo i Rana region. Whereas the annual production
connected to the transmission grid is about 15 TWh per year, the regional consumption is about 10
TWh per year. There are several possible DCE locations; Location 1, in connection to Mo Industrial
Park (MIP), has more than 500 MW available. Location 2 has 35 MW available, and can be upgraded
to 100 MW within a year. Existing infrastructure offers high redundancy (N-1 criterion fulfilled) for
additional delivery of power.
FIGURE 8-2
Location Arctic Cloud Data Center in Mo I Rana, N-1 fulfilled.
8.3.2 FIBER ACCESS AND CONNECTIVITY
For a data center site the connectivity to the European continent is of great importance. In order to
meet the market demand, a DCE location should be able to offer at least three redundant fiber routes
(N-2) from the location to various international fiber nodes, such as Stockholm, Rostock, Helsinki and
Amsterdam.
By actual testing, developers should show route and the latency of the data transmission from
the location to international nodes. Further, for the locations that wish to attract DCEs, dark fiber
connections having the correct standard, should be in place within a maximum of 9-12 months.
Figure 8-3 shows all three types of Tier connections.
33You can also read