OMI total bromine monoxide (OMBRO) data product: algorithm, retrieval and measurement comparisons - Atmos. Meas. Tech
←
→
Page content transcription
If your browser does not render page correctly, please read the page content below
Atmos. Meas. Tech., 12, 2067–2084, 2019
https://doi.org/10.5194/amt-12-2067-2019
© Author(s) 2019. This work is distributed under
the Creative Commons Attribution 4.0 License.

OMI total bromine monoxide (OMBRO) data product:
algorithm, retrieval and measurement comparisons
Raid M. Suleiman1 , Kelly Chance1 , Xiong Liu1 , Gonzalo González Abad1 , Thomas P. Kurosu2 , Francois Hendrick3 ,
and Nicolas Theys3
1 Harvard-Smithsonian   Center for Astrophysics, Cambridge, MA, USA
2 Jet
    Propulsion Laboratory, California Institute of Technology, Pasadena, CA, USA
3 Royal Belgian Institute for Space Aeronomy, Brussels, Belgium

Correspondence: Raid M. Suleiman (rsuleiman@cfa.harvard.edu)

Received: 3 January 2018 – Discussion started: 30 January 2018
Revised: 11 March 2019 – Accepted: 19 March 2019 – Published: 4 April 2019

Abstract. This paper presents the retrieval algorithm for         1013 molecules cm−2 , respectively. Global distribution and
the operational Ozone Monitoring Instrument (OMI) total           seasonal variation of OMI BrO are generally consistent with
bromine monoxide (BrO) data product (OMBRO) developed             previous satellite observations. Finally, we confirm the ca-
at the Smithsonian Astrophysical Observatory (SAO) and            pacity of OMBRO retrievals to observe enhancements of
shows comparisons with correlative measurements and re-           BrO over the US Great Salt Lake despite the current retrieval
trieval results. The algorithm is based on direct nonlinear       setup considering a stratospheric profile in the AMF calcula-
least squares fitting of radiances from the spectral range        tions. OMBRO retrievals also show significant BrO enhance-
319.0–347.5 nm. Radiances are modeled from the solar ir-          ments from the eruption of the Eyjafjallajökull volcano, al-
radiance, attenuated by contributions from BrO and interfer-      though the BrO retrievals are affected under high SO2 load-
ing gases, and including rotational Raman scattering, addi-       ing conditions by the sub-optimum choice of SO2 cross sec-
tive and multiplicative closure polynomials, correction for       tions.
Nyquist undersampling and the average fitting residual spec-
trum. The retrieval uses albedo- and wavelength-dependent
air mass factors (AMFs), which have been pre-computed us-
ing a single mostly stratospheric BrO profile. The BrO cross      1   Introduction
sections are multiplied by the wavelength-dependent AMFs
before fitting so that the vertical column densities (VCDs) are   Bromine monoxide (BrO) is a halogen oxide, predominantly
retrieved directly. The fitting uncertainties of BrO VCDs typ-    located in the stratosphere and upper troposphere, where,
ically vary between 4 and 7×10¹² molecules cm−2 (∼ 10 %–          like chlorine monoxide (ClO), it is a catalytic element in
20 % of the measured BrO VCDs). Additional fitting uncer-         the destruction of stratospheric ozone (von Glasow et al.,
tainties can be caused by the interferences from O2 -O2 and       2004; Salawitch et al., 2005) but with higher efficiency per
H2 CO and their correlation with BrO. AMF uncertainties are       molecule. Sources of tropospheric BrO include bromine re-
estimated to be around 10 % when the single stratospheric-        lease (“explosions”) during the polar spring (Hausmann and
only BrO profile is used. However, under conditions of high       Platt, 1994; Hollwedel et al., 2004; Simpson et al., 2007; Be-
tropospheric concentrations, AMF errors due to this assump-       goin et al., 2010; Salawitch et al., 2010; Abbatt et al., 2012;
tion of profile can be as high as 50 %.                           Blechschmidt et al., 2016), volcanic eruptions (Bobrowski et
   The retrievals agree well with GOME-2 observations             al., 2003; Chance, 2006; Theys et al., 2009), salt lakes (Hebe-
at simultaneous nadir overpasses and with ground-based            streit et al., 1999; Hörmann et al., 2016) and stratospheric
zenith-sky measurements at Harestua, Norway, with mean            transport (Salawitch et al., 2010). Global BrO measurements
biases less than −0.22 ± 1.13 × 10¹³ and 0.12 ± 0.76 ×            from space were first proposed for the Scanning Imaging Ab-
                                                                  sorption Spectrometer for Atmospheric Cartography (SCIA-

Published by Copernicus Publications on behalf of the European Geosciences Union.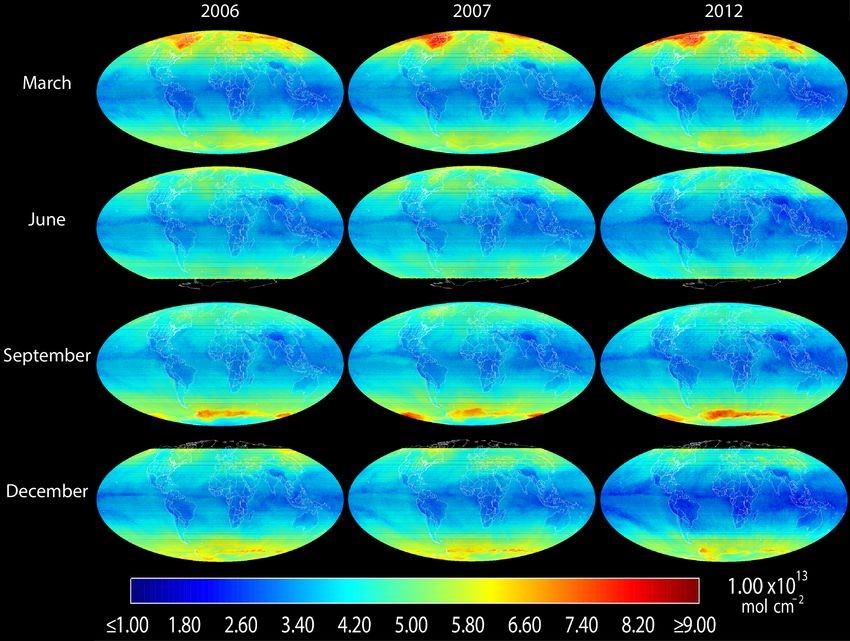
2068                  R. M. Suleiman et al.: OMBRO data product: Algorithm, retrieval and measurement comparisons

MACHY) instrument (Chance et al., 1991) and were first              brym volcano, measured by OMI (Chance, 2006). Theys et
demonstrated with Global Ozone Monitoring Experiment                al. (2009) reported on GOME-2 detection of volcanic BrO
(GOME-1) measurements (Chance, 1998; Platt and Wagner,              emission after the Kasatochi eruption. Hörmann et al. (2013)
1998; Richter et al., 1998; Hegels et al., 1998), and since with    examined GOME-2 observations of BrO slant column den-
SCIAMACHY nadir (Kühl et al., 2008), Global Ozone Mon-              sities (SCDs) in the vicinity of volcanic plumes; the study
itoring Experiment 2 (GOME-2) measurements (Theys et al.,           showed clear enhancements of BrO in ∼ one-quarter of the
2011; Toyota et al., 2011) and TROPOMI (Seo et al., 2018).          volcanos and revealed large spatial differences in BrO/SO2
Initial observations of BrO by the Ozone Monitoring Instru-         ratios.
ment (OMI) were first reported by Kurosu et al. (2004). Polar          The purpose of this paper is to describe the OMI BrO op-
spring BrO enhancements are known to be associated with             erational algorithm and the data product, compare it with
boundary layer O3 depletion (Hausmann and Platt, 1994;              ground-based and other satellite measurements and analyze
von Glasow et al., 2004; Salawitch et al., 2005, 2010; Simp-        its spatiotemporal characteristics. This paper is organized as
son et al., 2007; Abbatt et al., 2012). OMI measurements of         follows: Sect. 2 describes the OMI instrument and the data
BrO have been used together with chemical and dynamical             product. Section 3 gives a detailed description of the oper-
modeling to investigate stratospheric versus tropospheric en-       ational algorithm including algorithm and product history,
hancements of atmospheric BrO at high northern latitudes            spectral fitting, air mass factor (AMF) calculations, destrip-
(Salawitch et al., 2010). OMI BrO retrieval using the Differ-       ing and fitting uncertainties. Section 4 presents results and
ential Optical Absorption Spectroscopy (DOAS) method has            discussion including comparison with GOME-2 and ground-
been used to study the seasonal variations of tropospheric          based zenith-sky measurements at Harestua, Norway, and
bromine monoxide over the Rann of Kutch salt marsh (Hör-            global distribution, seasonality and enhanced BrO from the
mann et al., 2016). The Arctic Research of the Composition          US Great Salt Lake and Iceland’s Eyjafjallajökull volcano.
of the Troposphere from Aircraft and Satellites (ARCTAS)            Section 5 concludes this study.
campaign (Choi et al., 2012) found consistency between BrO
column densities calculated from Chemical Ionization Mass
Spectrometer (CIMS) measurements with the tropospheric              2     OMI instrument and OMBRO data product
BrO columns derived from OMI using our operational re-
                                                                    2.1    OMI instrument
trieval algorithm. BrO has been observed from the ground
in Harestua, Norway (Hendrick et al., 2007); Lauder, New            OMI (Levelt et al., 2006) was launched on the NASA
Zealand (Schofield et al., 2004a, b); Antarctica (Schofield et      Earth Observing System (EOS) Aura satellite into a sun-
al., 2006); Utqiaġvik (formerly Barrow), Alaska (Liao et al.,      synchronous orbit on 15 July 2004. It is a push-broom imag-
2011, 2012; Frieß et al., 2011; Sihler et al., 2012; Peterson       ing spectrometer that observes solar backscattered radia-
et al., 2016); Eureka, Canada (Zhao et al., 2015); Summit,          tion in the visible and ultraviolet from 270 to 500 nm in
Greenland (Stutz et al., 2011); and the Arctic Ocean (Burd et       three channels (UV1: 270–310 nm, UV2: 310–365 nm, vis-
al., 2017).                                                         ible: 350–500 nm) at a spectral resolution of 0.42–0.63 nm
   Enhancement of BrO in the vicinity of salt lakes like            and spatial resolution in the normal (global sampling)
the Dead Sea and the Great Salt Lake has been observed              mode ranging from 13 km × 24 km at direct nadir to about
from ground-based measurements (Hebestreit et al., 1999;            28 km × 150 km at the swath edges. The global mode (GM)
Matveev et al., 2001; Stutz et al., 2002; Tas et al., 2005; Holla   has 60 ground pixels with a total cross-track swath of
et al., 2015). The active bromine compound release is due to        2600 km.
the reaction between atmospheric oxidants with salt reser-             Since June 2007, certain cross-track positions of OMI data
voirs. Satellite observation of salt lake BrO was first reported    have been affected by the row anomaly (http://projects.knmi.
over the Great Salt Lake and the Dead Sea by OMI (Chance,           nl/omi/research/product/rowanomaly-background.php, last
2006; Hörmann et al., 2016). Seasonal variations of tropo-          access: 20 November 2017): some loose thermal insulating
spheric BrO over the Rann of Kutch salt marsh have been ob-         material likely appeared in front of the instrument’s entrance
served using OMI from an independent research BrO prod-             slit, which can block and scatter the light, thus causing errors
uct (Hörmann et al., 2016). Bobrowski et al. (2003) made            in level 1b data and subsequently the level 2 retrievals (Kroon
the first ground-based observations of BrO and SO2 abun-            et al., 2011). Initially, the row anomaly only affected a few
dances in the plume of the Soufrière Hills volcano (Montser-        positions, and the effect was small. But since January 2009,
rat) using multi-axis DOAS (MAX-DOAS). BrO and SO2                  the anomaly has become more serious, spreading to ∼ one-
abundances as functions of the distance from the source             third of the positions, and retrievals at those positions are not
were measured by MAX-DOAS in the volcanic plumes of                 recommended for scientific use. A flagging field has been
Mt. Etna in Sicily, Italy, and Villarica in Chile (Bobrowski et     introduced in the OMI level 1b data to indicate whether an
al., 2007). The BrO/SO2 ratio in the plume of Nyiragongo            OMI pixel is affected by this instrument anomaly.
and Etna was also studied (Bobrowski et al., 2015). The
first volcanic BrO measured from space was from the Am-

Atmos. Meas. Tech., 12, 2067–2084, 2019                                               www.atmos-meas-tech.net/12/2067/2019/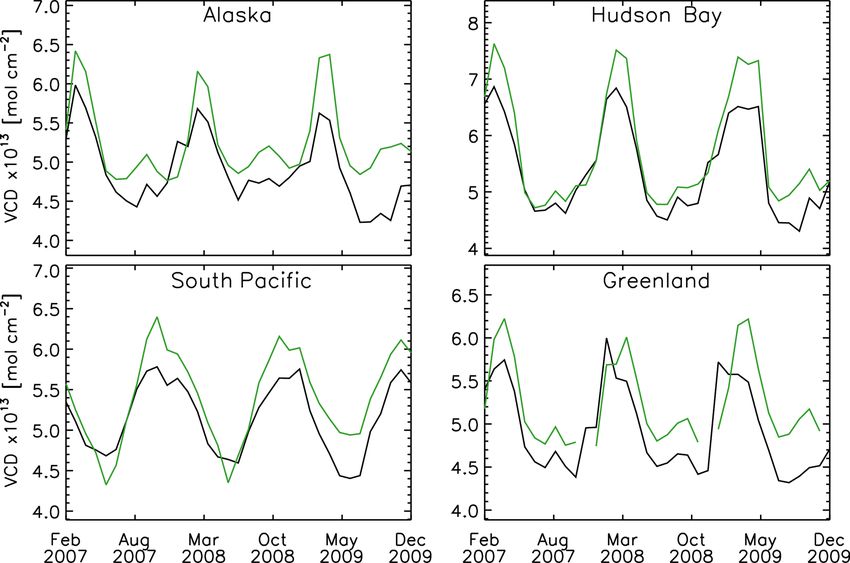
R. M. Suleiman et al.: OMBRO data product: Algorithm, retrieval and measurement comparisons                                 2069

    OMI measures O3 and other trace gases, aerosols, clouds       SCD/VCD is computed. Diagnostic cloud information from
and surface properties. Products developed at the SAO             the OMCLDO2 product (Acarreta et al., 2004) was added,
include operational BrO, chlorine dioxide (OClO), and             and the row-anomaly-indicating flags were carried over from
formaldehyde (H2 CO; González Abad et al., 2015) that             the level 1b product. We recommend not using pixels affected
are archived at NASA Goddard Earth Sciences (GES) Data            by the row anomaly despite being processed by the retrieval
and Information Services Center (DISC) and offline (“pre-         algorithm.
operational”) O3 profile and tropospheric O3 (Liu et al.,            The current algorithm is described in detail in the rest of
2010; Huang et al., 2017, 2018), glyoxal (C2 H2 O2 ) (Chan        this section, with spectral fitting in Sect. 3.2, AMF calcula-
Miller et al., 2014, 2016) and water vapor (H2 O) (Wang et        tion prior to spectral fitting in Sect. 3.3, post-processing de-
al., 2014, 2016) that are available at the Aura Validation Data   stripping to remove cross-track-dependent biases in Sect. 3.4
Center (AVDC). All the products except for the O3 profile         and fitting uncertainties and error estimates in Sect. 3.5.
product are produced using nonlinear least squares (NLLS)
fitting methods based on those previously developed at the        3.2   Spectral fitting
SAO for the analysis of measurements from the GOME (now
GOME-1) (Chance, 1998; Chance et al., 2000) and SCIA-             Most aspects of the algorithm physics for the direct fitting of
MACHY instruments (Burrows and Chance, 1991; Chance               radiances by the BOAS method were developed previously
et al., 1991; Martin et al., 2006).                               at SAO for analysis of GOME and SCIAMACHY satellite
                                                                  spectra (Chance, 1998; Chance et al., 2000; OMI, 2002; Mar-
2.2    OMBRO data product                                         tin et al., 2006) and in the various algorithm descriptions of
                                                                  other SAO OMI products (Wang et al., 2014; Chan Miller et
The current operational BrO product, OMBRO version 3,             al., 2014; González Abad et al., 2015).
contains BrO vertical column densities (VCDs), slant col-            The spectral fitting in the SAO OMI BrO retrieval is based
umn densities (SCDs), effective air mass factors (AMFs) and       on a Gauss–Newton NLLS fitting procedure, the CERN EL-
ancillary information retrieved from calibrated OMI radiance      SUNC procedure (Lindström and Wedin, 1987), which pro-
and irradiance spectra. Each BrO product file contains a sin-     vides for bounded NLLS fitting. Processing begins with
gle orbit of data, from pole to pole, for the sunlit portion of   wavelength calibration for both irradiance and radiance. In
the orbit. The data product from 26 August 2004 through the       each case the wavelength registration for the selected fitting
present is available at GES DISC. Data used in this study         window is determined independently for each cross-track po-
cover the period from 1 January 2005 to 31 December 2014.         sition by cross-correlation of OMI spectra with a high spec-
                                                                  tral resolution solar irradiance (Caspar and Chance, 1997;
                                                                  Chance, 1998; Chance and Kurucz, 2010) using the pre-
3     Retrieval algorithm
                                                                  flight instrument slit functions (Dirksen et al., 2006). Radi-
3.1    Algorithm and product history                              ance wavelength calibration is performed for a representative
                                                                  swath line of radiance measurements (usually in the middle
OMBRO Version 1.0 was released on 1 February 2007,                of the orbit) to determine a common wavelength grid for ref-
based on a spectral fitting window of 338–357 nm. Ver-            erence spectra.
sion 2.0 was released on 13 April 2008. It included major            Following wavelength correction, an undersampling cor-
adjustments for Collection 3 level 1b data, improved de-          rection spectrum is computed to partially correct for spec-
striping measures, a change of the fitting window to 340–         tral undersampling (lack of Nyquist sampling: Chance, 1998;
357.5 nm, improvements to radiance wavelength calibration,        Slijkhuis et al., 1999; Chance et al., 2005). The calculation
and several improvements for processing near-real-time data.      of the corrections for the undersampling is accomplished
In both Version 1 and 2, total BrO VCDs were retrieved            by convolving the preflight slit functions with the high-
in two steps: first performing spectral fitting using the ba-     resolution solar spectrum and differencing its fully sampled
sic optical absorption spectroscopy (BOAS) method to de-          and undersampled representations (Chance et al., 2005).
rive SCDs from OMI radiance spectra and then converting              To process each OMI orbit, it is split into blocks of 100
from SCDs to VCDs by dividing AMFs. This is similar to            swath lines. Spectral fitting is then performed for each block
current SAO H2 CO, H2 O and C2 H2 O2 , as mentioned previ-        by processing the 60 cross-track pixels included in each
ously. The latest Version 3.0.5, released on 28 April 2011,       swath line sequentially before advancing to the next swath
includes major algorithm changes: the fitting window was          line. The spectra are modeled as follows:
moved to 319.0–347.5 nm, and BrO cross sections are mul-                (                ! P
                                                                                           − (βj Bj )
tiplied by wavelength-dependent AMFs, which are a func-                           X
                                                                  I=        aI0 +  ∝ i Ai e j
tion of albedo, before fitting, for a direct retrieval of BrO
                                                                                  i
VCDs. SCDs are similarly retrieved in a separate step by                   )
fitting BrO cross sections that have not been multiplied
                                                                     X
                                                                    + γk Ck Polyscale + Polybaseline ,                        (1)
with wavelength-dependent AMFs, and an effective AMF =                  k

www.atmos-meas-tech.net/12/2067/2019/                                                 Atmos. Meas. Tech., 12, 2067–2084, 2019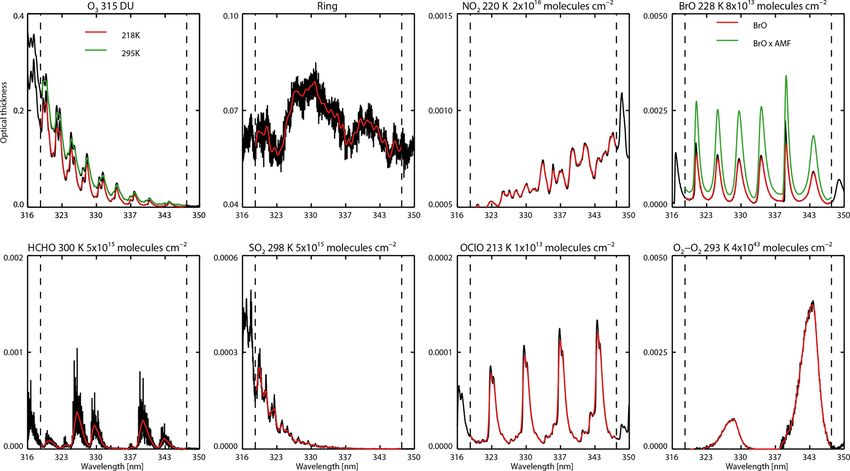
2070                  R. M. Suleiman et al.: OMBRO data product: Algorithm, retrieval and measurement comparisons

where I0 is the solar irradiance (used in our operational BrO       squeeze (not normally used). The operational parameters and
retrieval) or radiance reference measurement, I is the Earth-       the cross sections used are provided in Table 1.
shine radiance (detected at satellite), a is albedo, αi , βj and        As part of the development of the OMBRO retrieval al-
γk are the coefficients to the reference spectra of Ai , Bj and     gorithm, a significant amount of effort was dedicated to al-
Ck (for example, trace gas cross sections, Ring effect, vi-         gorithm “tuning”, i.e., the optimization of elements in the
brational Raman, undersampling correction, common mode)             retrieval process, including interfering absorbers like O2 -O2 .
of model constituents. To improve cross-track stripe biases         The spectral region of 343 nm, where O2 -O2 has an absorp-
(Sect. 3.4), the OMI daily solar irradiance (I0 ) is substituted    tion feature larger than the BrO absorption, essentially is im-
by the first principal component of the solar irradiances mea-      possible to avoid in BrO retrievals: the fitting window would
sured by OMI between 2005 and 2007 (one for each cross-             have to either terminate at shorter wavelengths or start past
track position). The principal component derived between            this feature, and both approaches yield low information con-
2005 and 2007 is used to process the entire mission. The ref-       tent that is too unacceptable for the BrO retrievals to suc-
erence spectra are derived separately for each cross-track po-      ceed. During the tuning process, we investigated the effects
sition from original high-resolution cross sections convolved       of, among many other things, including or excluding O2 -O2 ,
with the corresponding pre-launch OMI slit functions (Dirk-         the use of different spectroscopic data sets (Greenblatt et al.,
sen et al., 2006) after correcting for the solar I0 effect (Ali-    1990; Hermans et al., 1999, cross sections), shorter or longer
well et al., 2002). Figure 1 shows the trace gas cross sec-         wavelength windows for the retrieval and even extending the
tions and Ring spectra used in the current operational algo-        retrieval window beyond the O2 -O2 absorption feature but
rithm. The black lines are the original high-resolution refer-      excluding the approximate wavelength slice of the feature
ence spectra, and the colored lines show the corresponding          itself. The only approach that provided quantitatively satis-
spectra convolved with the OMI slit function, which are used        factory results – i.e., stability of the retrieval under a wide
in the fitting.                                                     range of conditions, minimized correlation with clouds, low
    For improved numerical stability, radiances and irradi-         fitting uncertainties, consistency of OMI global total column
ances are divided by their respective averages over the fitting     BrO with published results, and low noise in pixel-to-pixel
window, renormalizing them to values of ∼ 1. BrO is fitted in       retrievals – was to exclude O2 -O2 from the OMBRO V3. It
the spectral window 319.0–347.5 nm, within the UV-2 chan-           is difficult to quantify O2 -O2 atmospheric content from the
nel of the OMI instrument. The switch from the previous fit-        absorption feature around 343 nm alone, and its correlation
ting window of 340–357.5 nm to this shorter and wider fitting       with absorption bands of BrO and H2 CO leads to spectral
window is based on extensive sensitivity analysis following         correlations in the course of the nonlinear least squares min-
the method described by Vogel et al. (2013). This new fitting       imization process that are detrimental to the OMI BrO re-
window aims at reducing the fitting uncertainty by including        trievals. Lampel et al. (2018) provide spectrally resolved O2 -
more BrO spectral structures as shown in Fig. 1 and reducing        O2 cross sections not only at 343 nm but also at 328 nm (see
retrieval noise while preserving the stability of the algorithm.    Fig. 1), which is about 20 % of the absorption at 343 nm and
An analysis of the retrieval sensitivity to different windows       has not been shown in previous O2 -O2 cross sections. Future
is included in Sect. 3.5.                                           updates to the operational OMBRO algorithm will investi-
    The rotational Raman scattering (Chance and Spurr, 1997;        gate the effect of including Lampel et al. (2018) O2 -O2 cross
Chance and Kurucz, 2010) and undersampling correction               sections on the fitting.
spectra, Ai , are first added to the albedo-adjusted solar ir-
radiance aI0 , with coefficients αi as shown in Eq. (1). Ra-
                                                                    3.3   Air mass factors
diances I are then modeled as this quantity attenuated by
absorption from BrO, O3 , NO2 , H2 CO, and SO2 , with co-
efficients βj fitted to the reference spectra Bj as shown in        Due to significant variation in O3 absorption and Rayleigh
Eq. (1). A common mode spectrum Ck , computed online, is            scattering in the fitting window AMFs vary with wavelength
added by fitting coefficient γk after the Beer–Lambert law          by 10 %–15 % as shown in Fig. 2. At large solar and viewing
contribution terms. For each cross-track position, an initial fit   zenith angles it is difficult to identify a single representative
of all the pixels along the track between 30◦ N and 30◦ S is        AMF ad hoc. The wavelength-dependent AMFs are intro-
performed to determine the common mode spectra, derived             duced to take into account for such strong variation within
as the average of the fitting residuals. The common mode            the BrO fitting window. They are applied prior to fitting to
spectra include any instrument effects that are uncorrelated to     the BrO cross sections, and the spectral fit retrieves VCDs di-
molecular scattering and absorption. This is done to reduce         rectly. This direct fitting approach is a major departure from
the fitting root-mean-square (rms) residuals and the overall        the commonly employed two-step fitting procedure (OMI,
uncertainties. These are then applied as reference spectra in       2002). It was first developed for retrievals of trace gases from
fitting of the entire orbit. The fitting additionally contains      SCIAMACHY radiances in the shortwave infrared (Buch-
additive (Polybaseline ) and multiplicative closure polynomi-       witz et al., 2000) and has been demonstrated for total O3 and
als (Polyscale ), parameters for spectral shift and, potentially,   SO2 retrievals from GOME/SCIAMACHY measurements in

Atmos. Meas. Tech., 12, 2067–2084, 2019                                               www.atmos-meas-tech.net/12/2067/2019/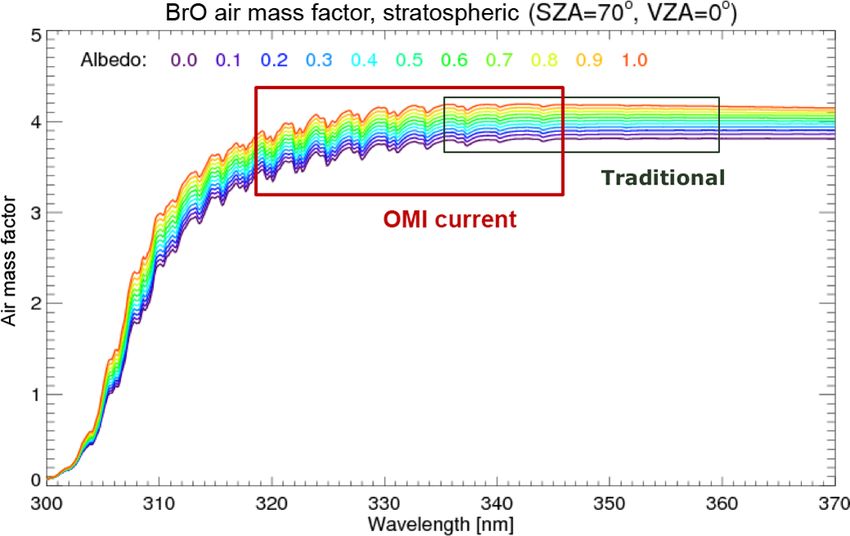
R. M. Suleiman et al.: OMBRO data product: Algorithm, retrieval and measurement comparisons                                                         2071

Figure 1. Cross sections used in the current operational BrO algorithm except for the SO2 cross section at 298 K which is to be used in
the next version. The black lines are the original cross sections, and the colored lines show the cross sections convolved with approximate
OMI slit function (which is assumed to be a Gaussian with 0.42 nm full width at half maximum). The O2 -O2 calculation is based on Lampel
et al. (2018) cross sections. The BrO cross section after multiplication with the wavelength-dependent AMFs used these parameters for the
AMF calculation: albedo = 0.05, SZA = 5.0◦ and VZA = 2.5◦ . The rms of the fitting residuals is on the order of 9 × 10⁻⁴ , indicating that
BrO spectral features are slightly bigger than typical fitting residuals.

Table 1. Fitting window and parameters used to derive BrO vertical column densities.

        Parameter                                          Description/value
        Fitting window                                     319.0–347.5 nm
        Baseline polynomial                                Fourth-order
        Scaling polynomial                                 Fourth-order
        Instrument slit function                           Hyper-parameterization of preflight measurements; Dirksen et al. (2006)
        Wavelength calibration                             Spectral shift (no squeeze)
        Solar reference spectrum                           Chance and Kurucz (2010)
        BrO cross sections                                 Wilmouth et al. (1999), 228 K
        H2 CO cross sections                               Chance and Orphal (2011), 300 K
        O3 cross sections                                  Malicet et al. (1995), 218, 295 K
        NO2 cross sections                                 Vandaele et al. (1998), 220 K
        SO2 cross sections                                 Vandaele et al. (1994), 295 Ka ; Hermans et al. (2009); Vandaele et al. (2009), 295 Kb
        OClO cross sections                                Kromminga et al. (2003), 213 K
        Molecular Ring cross sections                      Chance and Spurr (1997)
        Undersampling correction                           Computed online; Chance et al. (2005)
        Residual (common mode) spectrum                    Computed online between 30◦ N and 30◦ S
      a Used in the current operational algorithm.
      b Used for testing sensitivity to SO cross sections and will be used in the next version.
                                          2

www.atmos-meas-tech.net/12/2067/2019/                                                                   Atmos. Meas. Tech., 12, 2067–2084, 2019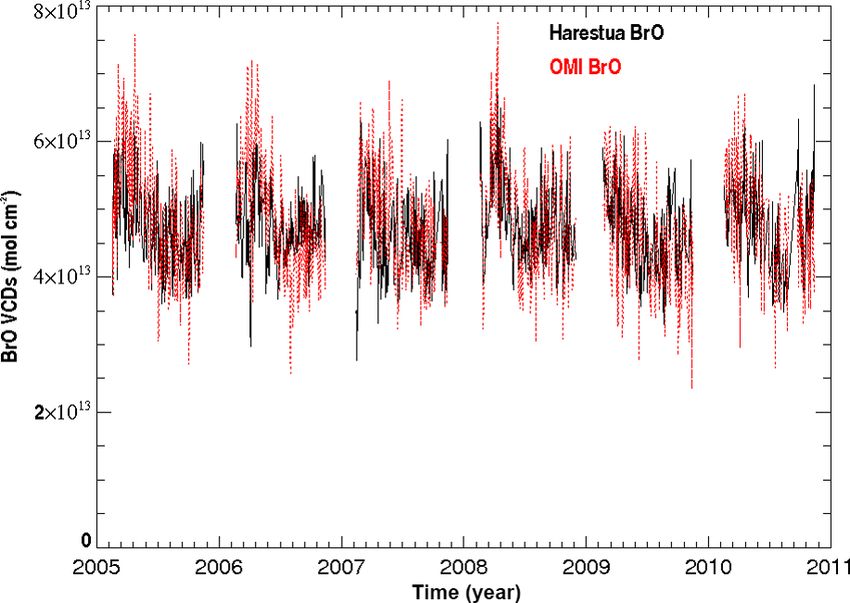
2072                   R. M. Suleiman et al.: OMBRO data product: Algorithm, retrieval and measurement comparisons

Figure 2. Wavelength- and albedo-dependent air mass factors cal-
culated using a mostly stratospheric fixed BrO profile. The blue box
shows the fitting window used in our previous versions, and the red
box shows the fitting window used in the current operational algo-     Figure 3. (a) A mostly stratospheric vertical BrO profile used
rithm.                                                                 for air mass factors calculations in OMBRO V3. Total BrO, BrO
                                                                       < 15 km, BrO < 10 km and BrO < 5 km are 2.05 × 10¹³ , 5.06 ×
                                                                       1012 , 1.55 × 10¹² and 2.87 × 10¹¹ molecules cm−2 , respectively.
the ultraviolet (Bracher et al., 2005; Coldewey-Egbers et al.,         (b) A stratospheric tropospheric vertical BrO profile used to in-
                                                                       vestigate the impact of high tropospheric BrO columns on air
2005; Weber et al., 2005; Lee et al., 2008).
                                                                       mass factors calculations. Total BrO, BrO < 15 km, BrO < 10 km
   The albedo- and wavelength-dependent AMFs were pre-                 and BrO < 5 km are 6.99 × 10¹³ , 5.45 × 10¹³ , 5.10 × 10¹³ and
computed with the Linearized Discrete Ordinate Radiative               4.97 × 10¹³ molecules cm−2 , respectively.
Transfer code (LIDORT, Spurr, 2006) using a single mostly
stratospheric BrO profile (Fig. 3, left panel). The BrO pro-
file, based on the model of Yung et al. (1980), has ∼ 30 %             ted molecules is small (typically less than 0.12), except with
BrO below 15 km, ∼ 10 % BrO below 10 km and ∼ 2 % BrO                  H2 CO (0.43). However, it is safe to assume that in most polar
below 5 km. It should be noted that a fixed profile is incon-          regions with enhanced BrO there are no high concentrations
sistent with the varying tropopause height (both with latitude         of formaldehyde. It will be worthwhile for future studies to
and dynamically, e.g., Salawitch et al., 2010) and therefore           assess the interference of H2 CO under high H2 CO and back-
with the profile shape in the stratosphere, but the impact on          ground BrO conditions, similar to De Smedt et al. (2015).
the AMF is typically small as the scattering weight does not           In addition, the AMF wavelength dependence increases with
change much in the stratosphere. For conditions with en-               the increase of solar and viewing zenith angles and surface
hanced BrO in the lower troposphere, using this profile will           albedo, which increases the correlation between modified
overestimate the AMFs and therefore underestimate the BrO              BrO cross sections and O3 cross sections. However, the cor-
VCDs as discussed in Sect. 3.5. Surface albedos are based on           relation with O3 only becomes noticeable (∼ 0.10) at SZAs
a geographically varying monthly mean climatology derived              above ∼ 80◦ .
from OMI (Kleipool et al., 2008). Although AMFs based
on this BrO profile only slightly depend on surface albedo,            3.4   Destriping
albedo effects can be significant over highly reflective snow
or ice surfaces, reducing VCDs by 5 %–10 %.                            OMI L1b data exhibit small differences with cross-track po-
   In order to provide the AMF in the data product for consis-         sition, due to differences in the dead/bad pixel masks (cross-
tency with previous versions based on a two-step approach, a           track positions are mapped to physically separate areas on
second fitting of all OMI spectra is performed with unmod-             the CCD), dark current correction and radiometric calibra-
ified BrO cross sections, which yields SCDs. An effective              tion, which lead to cross-track stripes in the level 2 product
AMF can then be computed as AMF = SCD/VCD.                             (Veihelmann and Kleipool, 2006). Our destriping algorithm
   The green line in the top right panel of Fig. 1 shows               employs several methods to reduce cross-track striping of the
the modified BrO cross section after multiplication with               BrO columns. First, we screen outliers in the fitting residu-
the wavelength-dependent AMF (albedo = 0.05, SZA (so-                  als. This method, originally developed to mitigate the effect
lar zenith angle) = 5.0◦ , and VZA (viewing zenith an-                 of the South Atlantic Anomaly in SAO OMI BrO, H2 CO, and
gle) = 2.5◦ ). The wavelength dependence in AMF is visible             OClO data products, is now also being employed for GOME-
from the varying differences near BrO absorption peaks and             2 (Richter et al., 2011). Screening outliers is done through
the right wings at different wavelengths. The correlation of           computing the median, rmed , and the standard deviation σ
the unmodified BrO cross sections with the rest of the fit-            of residual spectra r(λ) and in subsequent refitting excluding

Atmos. Meas. Tech., 12, 2067–2084, 2019                                                   www.atmos-meas-tech.net/12/2067/2019/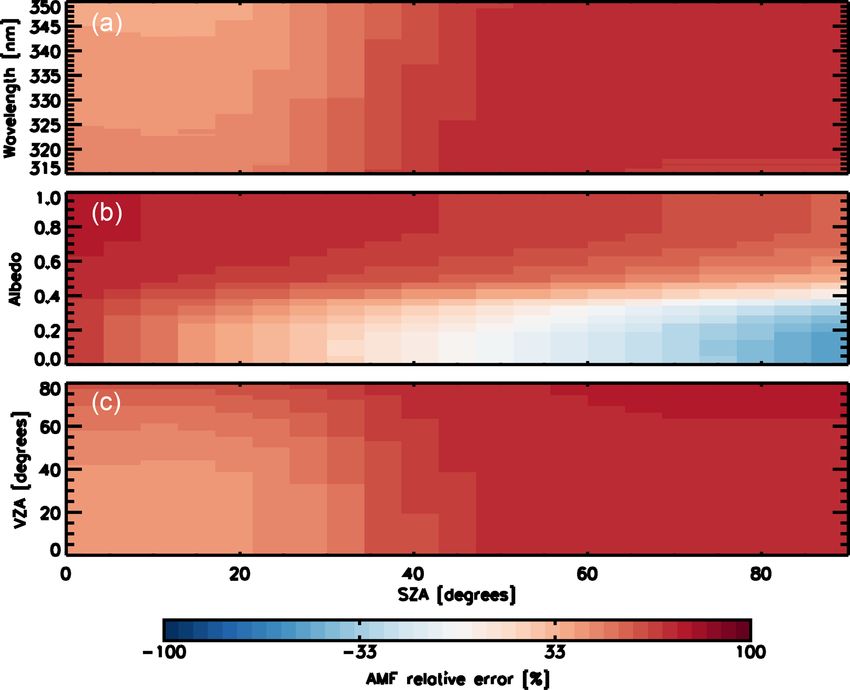
R. M. Suleiman et al.: OMBRO data product: Algorithm, retrieval and measurement comparisons                                      2073

any spectral points for which r (λ) ≥ |rmed ± 3σ |. This can be
done repeatedly for every ground pixel, which makes the pro-
cessing slow. However, we do it once for a reference swath
line, recording the positions of the bad pixels and excluding
them by default in each subsequent fit. Second, after the com-
pletion of the spectral fitting process for all ground pixels in
the granule, a post-processing cross-track bias correction is
performed: an average cross-track pattern is calculated from
the along-track averages of all BrO VCDs for each cross-
track position within a ±30◦ latitude band around the Equa-
tor, to which a low-order polynomial is fitted. The differences
between the cross-track pattern and the fitted polynomial are
then applied as a cross-track VCD correction (or “smooth-
ing”) factor. The smoothed VCDs are provided in a sepa-
rate data field, ColumnAmountDestriped. Smoothed SCDs
are derived in an analogous fashion and are also included in
the data product.
                                                                   Figure 4. The percentage of relative AMF errors as a function of the
3.5   BrO VCD error analysis                                       SZA and the wavelength (a), albedo (b) and VZA (c) when using
                                                   √               the stratospheric-only BrO profile (Fig. 3a) in the case there is a
Estimated fitting uncertainties are given as σi = Cii , where      significant tropospheric BrO column as shown in the stratospheric–
C is the covariance matrix of the standard errors. This defi-      tropospheric BrO profile (Fig. 3b).
nition is only strictly true when the errors are normally dis-
tributed. In the case in which the level 1 data product uncer-
tainties are not reliable estimates of the actual uncertainties,   the total uncertainties of the BrO vertical columns typi-
spectral data are given unity weight over the fitting window,      cally range within 15 %–30 %. To estimate the AMF error
and the 1σ fitting error in parameter i is determined as           associated with enhanced tropospheric concentrations, we
          s                                                        have studied the difference between AMFs calculated us-
                cii × n points                                     ing the stratospheric-only BrO profile and a stratospheric–
σi = εrms                        ,                           (2)
             n points − n varied                                   tropospheric profile as shown in Fig. 3b. Figure 4 shows the
                                                                   dependency of the relative AMF difference with respect to
where εrms is the root mean square of the fitting residuals,       wavelength (panel a), albedo (panel b) and VZA (panel c)
“n points” is the number of points in the fitting window and       as a function of the SZA between calculations performed
“n varied” is the number of parameters varied during the fit-      using these two profiles. The use of the stratospheric-only
ting.                                                              BrO profile can lead to AMF errors up to 50 % depend-
   The fitting uncertainties for single measurements of            ing on albedo and viewing geometry. On average, using the
the BrO VCDs typically vary between 4 × 10¹² and                   stratospheric-only BrO profile overestimates AMF and un-
7 × 10¹² molecules cm−2 , consistently throughout the data         derestimates VCD by 41 %.
record. The uncertainties vary with cross-track positions,            We have performed sensitivity analysis of OMI BrO VCD
from ∼ 7 × 10¹² at nadir positions to ∼ 4 × 10¹² at edge po-       with respect to various retrieval settings using orbit 26564 on
sitions due to the increase of photon path length through          13 July 2009. Table 2 shows the median VCDs, median fit-
the stratosphere. Relatively, the VCD uncertainties typically      ting uncertainties and the number of negative VCD pixels for
range between 10 % and 20 % of individual BrO VCDs but             each configuration. Table 3 summarizes the overall fitting er-
could be as low as 5 % over BrO hotspots. This is roughly          ror budget including the random fitting uncertainty, cross sec-
2–3 times worse that what was achieved from GOME-1 data.           tion errors (as reported in the literature) and various retrieval
   The BrO VCD retrieval uncertainties listed in the data          settings. We studied five wavelength windows including the
product only include random spectral fitting errors. Error         current operational window (319.0–347.5 nm) version 2 win-
sources from AMFs (i.e., BrO climatology), atmospheric             dow (323.0–353.5 nm), version 1 (340.0–357.5 nm) and two
composition and state (pressure–temperature vertical pro-          extra windows, exploring the impact of extending the win-
files, total O3 column, etc.) and other sources of VCD uncer-      dow to shorter wavelengths (310.0–357.5 nm) and reducing
tainty are not included. We provide error estimates for these      it by limiting its extension to wavelengths above 325 nm
additional error sources here.                                     (325.0–357.5). The choice of fitting window can cause sig-
   Uncertainties in the AMFs, used to convert slant to verti-      nificant differences in BrO VCDs of up to 50 %. The current
cal columns, are estimated to be 10 % or less except when          window results in the most stable retrievals with the smallest
there is substantially enhanced tropospheric BrO. Hence            number of pixels with negative VCD values.

www.atmos-meas-tech.net/12/2067/2019/                                                 Atmos. Meas. Tech., 12, 2067–2084, 2019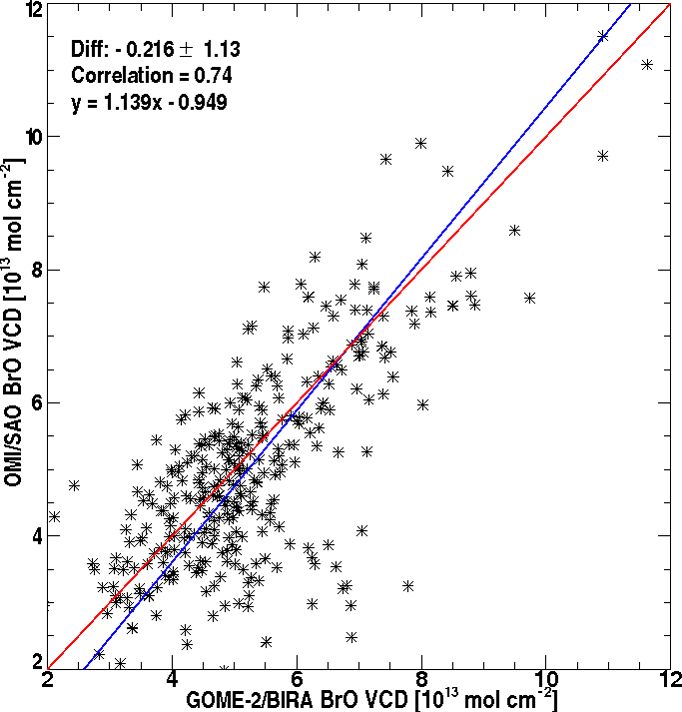
2074                    R. M. Suleiman et al.: OMBRO data product: Algorithm, retrieval and measurement comparisons

Table 2. Error analysis studies. For reference, the total number of retrieved pixels not affected by the row anomaly is 58 112.

                             Description                     Median VCD        Median uncertainty     Number of
                                                         (molecules cm−2 )      (molecules cm−2 )      negatives
                             319–347.5 nm Op. (V3)             4.02 × 10¹³            7.11 × 10¹²             88
                             323.0–353.5 nm (V2)               2.65 × 10¹³            9.27 × 10¹²           1604
                             340.0–357.5 nm (V1)               2.86 × 10¹³            1.19 × 10¹³           3351
                             310.0–357.5 nm                    1.97 × 10¹³            6.18 × 10¹²           2728
                             325.0–357.5 nm                    3.16 × 10¹³            8.02 × 10¹²           1416
                             With O2 -O2                       3.54 × 10¹³            7.80 × 10¹²            319
                             Online slit function              5.09 × 10¹³            7.16 × 10¹²             68
                             Without common mode               3.89 × 10¹³            1.02 × 10¹³            116
                             Without H2 CO                     2.52 × 10¹³            6.27 × 10¹²            816

Table 3. Summary of different errors sources in the BrO vertical column.

     Error source               Type           Parameter uncertainty       Averaged uncertainty       Evaluation method – reference
                                                                           on BrO VCD
     Measurement noise          Random         S/N 500–1000                4–7 ×                      Error propagation
     random                                                                1012 molecules cm−2
     H2 CO                                                                 5%                         Chance and Orphal (2011), 300 K
     O3                                                                    2%                         Malicet et al. (1995), 218, 295 K
     BrO                                                                   8%                         Wilmouth et al. (1999), 228 K
                                               Based on literature re-
     NO2                        Systematic                                 3%                         Vandaele et al. (1998), 220 K
                                               ported error estimates
     SO2                                                                   5%                         Vandaele et al. (1994), 295 K
     OClO                                                                  5%                         Kromminga et al. (2003), 213 K
     Ring                                                                  5%                         Chance and Spurr (1997)
     Order of baseline poly-    Systematic     Vary polynomial order       10 %
     nomial
                                                                                                      Sensitivity analysis
     Order of scaling poly-     Systematic     Vary polynomial order       10 %
     nomial
     Instrumental slit func-    Systematic     Preflight and online slit   27 %
     tion and wavelength                       function
     calibration
     Wavelength interval        Systematic     Varying fitting window      50 %

    Including the interference of O2 -O2 leads to a decrease of            scaling and baseline polynomials; it can cause uncertainties
the median VCD by ∼ 12 % and an increase of the median                     of ∼ 10 % as shown in Table 3.
fitting uncertainty by ∼ 10 % with respect to the operational                 To study the impact of the radiative transfer effects of the
setup. Excluding H2 CO from the fitting significantly reduces              O3 absorption in our retrieval, we have adopted the correc-
the retrieved BrO columns by ∼ 37 %, given that the strong                 tion method described by Puķı̄te et al. (2010). We find that
anticorrelation between both molecules is not taken into ac-               between 60◦ S and 60◦ N, the average difference is smaller
count. Fitting the mean residual (common mode) has a small                 than 10 %, with values around 2 % near the Equator. How-
impact on the retrieval results; the median VCD only changes               ever, as we move near the poles with solar zenith angles
∼ 3 % but reduces the median fitting uncertainty by ∼ 30 %                 above 60◦ , the differences start to be bigger, arriving at mean
with respect to the exclusion of the common mode. To study                 values around 30 %.
the impact of the slit functions, we have performed the re-
trieval using both online slit functions, modeled as a Gaus-
sian, and the preflight instrument slit functions. The median              4   Results and discussions
difference between these two retrievals is 27 % for orbit num-
ber 26564. We have investigated the impacts of the order of                Comparisons of the OMI OMBRO product with GOME-2
                                                                           satellite retrievals and remote sensing ground-based mea-
                                                                           surements over Harestua, Norway, as well as monthly mean

Atmos. Meas. Tech., 12, 2067–2084, 2019                                                      www.atmos-meas-tech.net/12/2067/2019/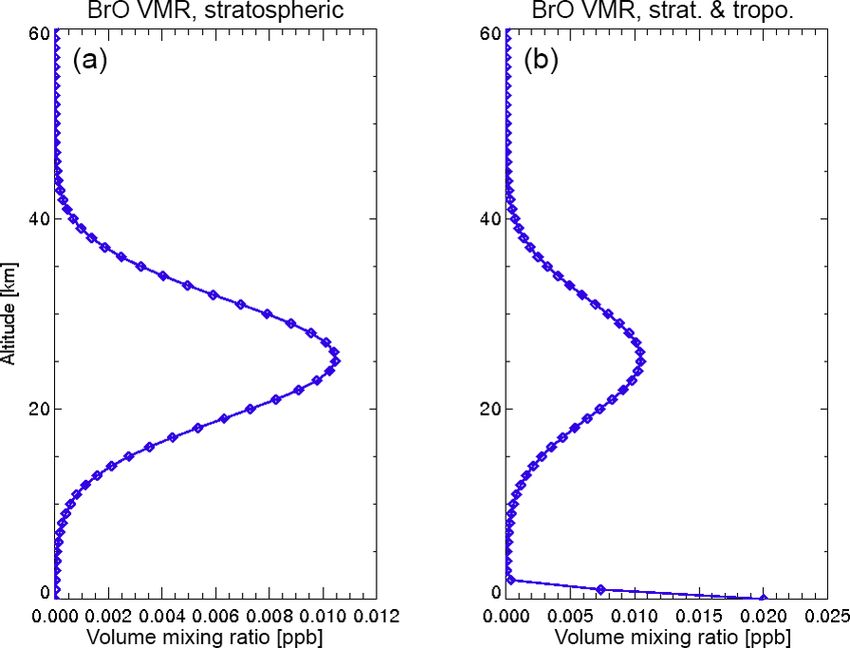
R. M. Suleiman et al.: OMBRO data product: Algorithm, retrieval and measurement comparisons                                   2075

averages illustrate the quality of the retrieval on a global
scale. On a local scale, recent scientific studies looking at
BrO enhancements in volcanic plumes and over salt lakes
are pushing the limits of the current OMBRO setups. In
the following sections, we provide details of these compar-
isons (Sect. 4.1) and discuss OMI OMBRO global distribu-
tion (Sect. 4.2) and local enhancements over salt lakes and
volcanic plumes observations (Sect. 4.3) and their applica-
bility and strategies to correctly use the publicly available
OMBRO product.

4.1   Comparisons with GOME-2 and ground-based                  Figure 5. Time series comparison of SAO OMI (red) BrO and
      observations                                              BIRA/GOME-2 (blue) BrO VCDs from February 2007 to Novem-
                                                                ber 2008 using simultaneous nadir overpasses occurring at high lat-
                                                                itudes, around 75◦ S and 75◦ N, and within 2 min between OMI and
To assess the quality of the OMBRO product, we first com-       GOME-2 observations.
pared OMI BrO VCDs with BIRA/GOME-2 BrO observa-
tions (Theys et al., 2011). GOME-2 has a descending or-
bit with a local Equator crossing time (ECT) of 09:30, and
OMI has an ascending orbit with an ECT of 13:45. To
minimize the effects of diurnal variation, especially under
high SZAs (e.g., McLinden et al., 2006; Sioris et al., 2006),
on the comparison, we conduct the comparison using si-
multaneous nadir overpasses (SNOs) within 2 min between
GOME-2 and OMI predicted by NOAA National Calibra-
tion Center’s SNO prediction tool (https://ncc.nesdis.noaa.
gov/SNOPredictions, last access: 15 October 2017). Given
Aura and Metop-A satellite orbits, all these SNOs occur
at high latitudes around 75◦ S and 75◦ N. Figure 5 shows
the time series of comparison of individual OMI/GOME-2
BrO retrievals from February 2007 through November 2008.
The temporal variation of BrO at the SNO locations is
captured similarly by OMI and GOME-2 BrO. The scatter
plot in Fig. 6 quantifies the comparison between OMI and
GOME-2 BrO. OMI BrO shows excellent agreement with
GOME-2 BrO, with a correlation of 0.74 and a mean bias
of −0.216 ± 1.13 × 10¹³ molecules cm−2 (mean relative bias
of −2.6 ± 22.1 %). Considering very different retrieval algo-
rithms including different cross sections and BrO profiles,
such a good agreement is remarkable. GOME-2 retrievals use      Figure 6. Correlation and orthogonal regression of OMI and
the BrO cross sections of Fleischmann et al. (2004), while      GOME-2 BrO for the data shown in Fig. 5. The legends show the
our BrO retrievals use the BrO cross sections of Wilmouth et    mean bias and standard deviation of the differences, correlation and
al. (1999). According to the sensitivity studies by Hendrick    the orthogonal regression.
et al. (2009), using the Fleischmann cross section increases
BrO by ∼ 10 %. So, accounting for different cross sections,
OMI BrO underestimates the GOME-2 BrO by ∼ 10 %. In             differences. Figure 7 shows the VCD monthly averages of
addition, the GOME-2 algorithm uses a residual technique        GOME-2 data (green) and OMBRO (black) from Febru-
to estimate tropospheric BrO from measured BrO SCDs by          ary 2007 to December 2009, for which the seasonal varia-
subtracting a dynamic estimate of stratospheric BrO clima-      tions are clearly seen. Our study shows that OMI has negative
tology driven by O3 and NO2 concentrations and by using         mean biases of 0.35 × 10¹³ molecules cm−2 (12 %), 0.33 ×
two different tropospheric BrO profiles depending on sur-       1013 molecules cm−2 (10 %), 0.25 × 10¹³ molecules cm−2
face albedo conditions. This is very different from the ap-     (17 %) and 0.30 × 10¹³ molecules cm−2 (10 %) for Alaska,
proach of using a single BrO profile in the OMI BrO al-         the South Pacific, Hudson Bay and Greenland, respectively.
gorithm and can contribute to some of the BrO differences.         We also used ground-based zenith-sky measurements of
Furthermore, additional algorithm uncertainties in both al-     total column BrO at Harestua, Norway (Hendrick et al.,
gorithms and different spatial sampling can also cause some     2007) to estimate the quality of the OMI BrO. We com-

www.atmos-meas-tech.net/12/2067/2019/                                              Atmos. Meas. Tech., 12, 2067–2084, 2019
2076 R. M. Suleiman et al.: OMBRO data product: Algorithm, retrieval and measurement comparisons
Figure 7. VCD of GOME-2 (green) comparison to OMI (black) over four regions from February 2007 to December 2009 for four regions.
Each region is defined by a square with the following latitude and longitude boundaries: Alaska (50–70◦ N, 165–135◦ W), Hudson Bay
(50–65◦ N, 95–75◦ W), the South Pacific (70–50◦ S, 135–155◦ E) and Greenland (60–80◦ N, 60–15◦ W).
pared daily mean total BrO at Harestua with the mean OMI
BrO from individual footprints that contain the location of
Harestua site. Figure 8 shows the time series of the compar-
ison between OMI total BrO and Harestua total BrO from
February 2005 through August 2011 with the scatter plot
shown in Fig. 9. Ground-based BrO shows an obvious sea-
sonality with high values in the winter–spring and low val-
ues in the summer–fall. Such seasonality is well captured by
OMI BrO. OMI BrO shows a reasonable good agreement
with Harestua BrO, with a correlation of 0.46 and a mean
bias of 0.12±0.76×10¹³ molecules cm−2 (mean relative bias
of 3.18 ± 16.30 %, with respect to individual Harestua BrO).
Sihler et al. (2012) compared GOME-2 BrO to ground-based
observations at Utqiaġvik (formerly Barrow), finding the cor-
relation to be weaker (r = 0.3), likely due to both elevated
and shallow surface layers of BrO. However, their correla- Figure 8. Time series comparison of ground-based zenith-sky total
tion between GOME-2 BrO and ground-based measurements BrO (black) at Harestua, Norway, and coincident SAO OMI BrO
made from the icebreaker Amundsen, in the Canadian Arctic (red) from February 2005 through August 2011.
Ocean (r = 0.4), is closer to our correlation here. From the
Harestua data, tropospheric BrO typically consists of 15 %–
30 % of the total BrO, larger than what we have assumed in 4.2 Global distribution of BrO VCDs
the troposphere. The use of a single BrO profile in the OMI
Figure 10 presents the global distribution of monthly mean
BrO algorithm will likely underestimate the actual BrO. Ac-
BrO VCDs for selected months (March, June, Septem-
counting for the uncertainty due to profile shape, OMI BrO
ber, December), showing BrO seasonality for three dif-
will have a larger positive bias relative to Harestua measure-
ferent years (2006, 2007 and 2012). BrO typically in-
ments, which can be caused by other algorithm uncertain-
creases with latitude, with minimal values in the trop-
ties and the spatiotemporal differences between OMI and
ics (∼ 2 × 10¹³ molecules cm−2 ) and maximum values
Harestua BrO.
(∼ 1014 molecules cm−2 ) around polar regions especially in
the Northern Hemisphere winter–spring. In the tropics, BrO
shows little seasonality, but at higher latitudes in polar re-
Atmos. Meas. Tech., 12, 2067–2084, 2019 www.atmos-meas-tech.net/12/2067/2019/R. M. Suleiman et al.: OMBRO data product: Algorithm, retrieval and measurement comparisons 2077
Figure 10. Global distributions of monthly mean BrO VCDs in
March, June, September and December (in different rows) of 2006,
2007 and 2012 (different columns). Bromine release “explosions”
during the polar spring months can be seen clearly.
Figure 9. Correlation and orthogonal regression of OMI and 4.3 Salt lakes and volcanic plumes enhancements of
Harestua BrO for the data in Fig. 8. The legends show the mean BrO
biases and standard deviations of the differences, correlation and
the orthogonal regression. Following recent work by Hörmann et al. (2016) over the
Rann of Kutch using OMI BrO retrievals from an indepen-
dent research product, we have explored the capability of our
gions, BrO displays evident seasonality. The seasonality is OMBRO product to observe similar enhancements in other
different between the Northern and Southern Hemisphere. salt lakes. Figure 11 shows monthly averaged OMI BrO over
In the Northern Hemisphere, BrO values are larger in spring the Great Salt Lake for June 2006, the corresponding surface
(March) with widespread enhancement and are smaller in fall albedo used in the retrieval, cloud cover (assuming a cloud
(September/December). In the Southern Hemisphere, BrO filter of 40 %), and the cloud pressure. Over the Great Salt
values are larger in southern hemispheric spring and sum- Lake, BrO enhancement occurs predominantly over the lake
mer (i.e., September and December) and smaller in the win- bed, with enhancements of ∼ 5–10 × 1012 molecules cm−2
ter (June). Such global distribution and seasonal variation over background values (3–4 × 10¹³ molecules cm−2 ). De-
are generally consistent with previous satellite measurements spite observing these enhancements, the users of OMBRO
(cf. Chance, 1998; http://bro.aeronomie.be/level3_monthly. for these kinds of studies should be aware of three limitations
php?cmd=map, last access: 15 October 2017). BrO in the of the current retrieval algorithm. First, the BrO columns
tropics shows consistent zonal distributions, with lower val- assume a mostly stratospheric BrO profile (Fig. 3a) for the
ues over land and in the intertropical convergence zone. This AMF calculation. Second, the OMI-derived albedo climatol-
might be related to the impacts of clouds on the retrievals ogy (Kleipool et al., 2008) used in OMBRO has a resolu-
(e.g., BrO below thick clouds cannot be measured; there are tion of 0.5◦ . At this resolution OMBRO retrievals can have
uncertainties in the AMF calculation under cloudy condi- biases given the size of OMI pixels and the inherent sub-
tions) and will be investigated in detail in future studies. The pixel albedo variability. Finally, high albedos inherent to salt
global distribution and seasonal variation are consistent from lakes surface yield abnormally high cloud fractions and low
year to year, but the distributions from different years dis- cloud pressures over the salt lakes (Hörmann et al., 2016).
close some interannual variation. For example, BrO values All these factors should be considered in studies addressing
in 2007 are smaller in January but are larger in March com- the spatiotemporal distribution of BrO over salt lakes using
pared to those in 2006. Although OMI data since 2009 have OMBRO.
been seriously affected by the row anomaly at certain cross- During our analysis of volcanic eruption scenarios, it was
track positions, the monthly mean data derived from good discovered that the currently implemented SO2 molecular
cross-track positions are hardly affected by the row anomaly absorption cross sections (Vandaele et al., 1994) are a sub-
as shown by the very similar global distribution and season- optimum choice (see Fig. 12). Compared to more recent lab-
ality in 2012. oratory measurements (Hermans et al., 2009; Vandaele et al.,
www.atmos-meas-tech.net/12/2067/2019/ Atmos. Meas. Tech., 12, 2067–2084, 20192078 R. M. Suleiman et al.: OMBRO data product: Algorithm, retrieval and measurement comparisons
Figure 12. Comparison of BrO absorption (red) and SO2 absorp-
tions under volcanic scenarios based on cross sections used in the
operational algorithm (Vandaele et al., 1994) as shown in black
and the recent laboratory cross sections (Vandaele et al., 2009) as
shown in purple. For BrO, a SCD of 1.0 × 10¹⁴ molecules cm−2
is assumed; for SO2 , a SCD of 15 Dobson units (i.e., 4.03 ×
1017 molecules cm−2 ) is assumed. Cross sections have been con-
volved with the OMI slit function (which is assumed to be a Gaus-
sian with 0.42 nm full width at half maximum).
Figure 11. Mean June 2006 BrO VCD over the Great Salt Lake
area. Averages have been calculated on a 0.2◦ × 0.2◦ grid includ-
ing only pixels with cloud fractions smaller than 0.4. The straight
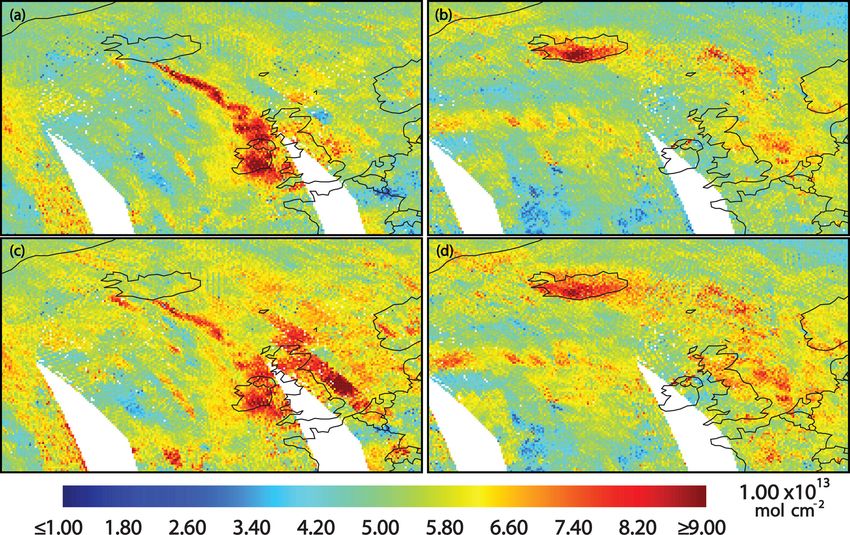
lines are borders of the state of Utah, and the curving lines represent 5 and 17 May 2010, respectively. Enhanced BrO values in
the Great Salt Lake (eastern oval area) and Salt Flats (western oval excess of 8.0×10¹³ molecules cm−2 are detected in the vicin-
area). ity of this volcano (e.g., plume extending southeastward from
the volcano on 5 May and high BrO over Iceland on 17 May).
Some of these enhanced BrO values correspond to the loca-
2009), the original SO2 cross sections implemented in OM- tions of enhanced SO2 as shown on the NASA global SO2
BRO do not extend over the full BrO fitting window and ex- monitoring website (https://so2.gsfc.nasa.gov/, last access:
hibit the wrong behavior longward of 324 nm, overestimating 7 October 2017). This enhancement of BrO is not related
the most recent measurement by up to a factor of 3. As the to the seasonal variation of BrO as no such BrO enhance-
correlation between BrO and both SO2 cross sections is very ment is detected over Eyjafjallajökull during 5–17 May 2011
small (−0.03 for the current SO2 and 0.11 for the latest SO2 (a year after the eruption), with BrO values of only up to
cross sections) over the spectral range of SO2 cross sections, ∼ 5.3 × 10¹³ molecules cm−2 (not shown). Figure 13c and d
interference by SO2 in BrO retrievals is usually not an issue show the same BrO retrievals using SO2 cross sections by
at average atmospheric SO2 concentrations, but strong vol- Vandaele et al. (2009). Using the improved SO2 cross sec-
canic eruptions will render even small SO2 absorption fea- tions increases the BrO over a broader area on both days, sup-
tures past 333 nm significant. Around 334 nm, the Vandaele porting the theory that the choice of SO2 cross sections can
et al. (2009) data show an SO2 feature that correlates with affect the BrO retrievals. However, BrO enhancement around
BrO absorption when SO2 concentrations are significantly the volcano can still clearly be seen with the improved SO2
enhanced. As a consequence of this spectral correlation, SO2 cross sections. This suggests that this BrO enhancement is
may be partially aliased as BrO, since the implemented SO2 not totally due to aliasing of SO2 as BrO but potentially real
cross sections cannot account for it. Figure 13 presents an BrO from the volcanic eruption.
example from the 2010 Eyjafjallajökull eruption to show that
the BrO retrieval can be affected by the choice of SO2 cross
sections. The next version of the OMBRO public release will 5 Conclusions
be produced using the updated SO2 absorption cross sec-
tions. Until then, caution is advised when using the OMI BrO This paper describes the current operational OMI BrO re-
product during elevated SO2 conditions. We recommend us- trieval algorithm developed at SAO and the corresponding
ing the OMBRO product together with the operational OMI V3 OMI total BrO (OMBRO) product in detail. The OMI
SO2 product (Li et al., 2013) to flag abnormally high BrO BrO retrieval algorithm is based on nonlinear least squares
retrievals. direct fitting of radiance spectra in the spectral range 319.0–
Figure 13a and b show daily average operational BrO 347.5 nm to obtain vertical column densities (VCDs) directly
VCDs from the eruption of the Eyjafjallajökull volcano on in one step. Compared to previous versions of two-step al-
Atmos. Meas. Tech., 12, 2067–2084, 2019 www.atmos-meas-tech.net/12/2067/2019/R. M. Suleiman et al.: OMBRO data product: Algorithm, retrieval and measurement comparisons 2079
Figure 13. Daily average BrO VCDs from Eyjafjallajökull on 5 May 2010 (a) and 17 May 2010 (b) produced using the operational SO2
cross sections for the same days (c) and using the Vandaele et al. (2009) SO2 cross sections (d).
gorithms, the fitting window was moved to shorter wave- sure polynomials and instrument slit functions. Uncertain-
lengths, and the spectral range was increased to reduce the ties in the AMF calculations are estimated at ∼ 10 % unless
fitting uncertainty. Because air mass factors (AMFs) vary the observation is made over a region with high tropospheric
significantly with wavelength as a result of significant vari- BrO columns. In this case, the use of a single stratospheric
ation of O3 absorption, the wavelength- and surface-albedo- BrO profile is another source of uncertainty, overestimat-
dependent AMF, which is precomputed with the Linearized ing AMFs (up to 50 %) and therefore underestimating BrO
Discrete Ordinate Radiative Transfer (LIDORT) code using VCDs.
a single mostly stratospheric BrO profile, is applied prior to We compared OMI BrO VCDs with BIRA/GOME-2
fitting to BrO cross sections for direct fitting of VCDs. Prior BrO observations at locations of simultaneous nadir over-
to the spectral fitting of BrO, wavelength calibration is per- passes (SNOs), which only occur around 75◦ N and 75◦ S.
formed for both irradiance and radiance at each cross-track OMI BrO shows excellent agreement with GOME-2 BrO,
position ,and reference spectra are properly prepared at the with a correlation of 0.74 and a mean bias of −0.216 ±
radiance wavelength grid. Then radiances are modeled from 1.13 × 10¹³ molecules cm−2 (mean relative bias of −2.6 ±
the measured solar irradiance, accounting for rotational Ra- 22.1 %). Monthly mean OMBRO VCDs during 2007–2009
man scattering, undersampling and attenuation from BrO and show negative biases of 0.25–0.35 × 10¹³ molecules cm−2
interfering gases and including additive and multiplicative (10 %–17 %) over Alaska, the South Pacific, Hudson Bay
closure polynomials and the average fitting residual spec- and Greenland, respectively. We also compared OMI BrO
trum. To maintain consistency with previous versions, a sec- with ground-based zenith-sky measurements of total BrO at
ond fitting of all OMI spectra is performed with unmodified Harestua, Norway. The BrO seasonality in Harestua is well
BrO cross sections to derive SCDs and the effective AMFs. captured by the OMI BrO and OMBRO retrieval, showing a
Then a destriping step is employed to reduce the cross-track- reasonable good agreement with the ground-based measure-
dependent stripes. ments. The correlation between both datasets is 0.46, and the
The uncertainties of BrO VCDs included in the data prod- mean bias is 0.12 ± 0.76 × 10¹³ molecules cm−2 (mean rela-
uct include only spectral fitting uncertainties, which typically tive bias of 3.18 ± 16.30 %).
vary between 4 and 7 × 10¹² molecules cm−2 (10 %–20 % of The global distribution and seasonal variation of OM-
BrO VCDs; this could be as low as 5 % over BrO hotspots), BRO are generally consistent with previous satellite mea-
consistent throughout the data record. The uncertainties vary surements. There are small values in the tropics with little
with cross-track positions, from ∼ 7 × 10¹² at nadir posi- seasonality and large values at high latitudes with distinct
tions to ∼ 4 × 10¹² at edge positions. We have investigated seasonality. The seasonality is different between the North-
additional fitting uncertainties caused by interferences from ern and Southern Hemisphere, with larger values in the hemi-
O2 -O2 , H2 CO, O3 , and SO2 , the impact of the choice of fit- spheric winter–spring (spring–summer) and smaller values
ting window, the use of common mode, the orders of clo- in summer–fall (winter) for the Northern (Southern) Hemi-
www.atmos-meas-tech.net/12/2067/2019/ Atmos. Meas. Tech., 12, 2067–2084, 20192080 R. M. Suleiman et al.: OMBRO data product: Algorithm, retrieval and measurement comparisons
sphere. This spatiotemporal variation is generally consistent References
from year to year and is hardly affected by the row anomaly
but does show some interannual variation. Finally, we have Abbatt, J. P. D., Thomas, J. L., Abrahamsson, K., Boxe, C., Gran-
explored the feasibility of detecting enhanced BrO column fors, A., Jones, A. E., King, M. D., Saiz-Lopez, A., Shep-
son, P. B., Sodeau, J., Toohey, D. W., Toubin, C., von Glasow,
over salt lakes and in volcanic plumes using OMBRO re-
R., Wren, S. N., and Yang, X.: Halogen activation via interac-
trievals. We found enhancement of the BrO with respect to tions with environmental ice and snow in the polar lower tropo-
the background levels of 5–10 × 1012 molecules cm−2 over sphere and other regions, Atmos. Chem. Phys., 12, 6237–6271,
the US Great Salt Lake. We also observed a significant en- https://doi.org/10.5194/acp-12-6237-2012, 2012.
hancement from the eruption of Eyjafjallajökull volcano al- Acarreta, J. R., De Haan, J. F., and Stammes, P.: Cloud
though BrO retrievals under high SO2 conditions can be af- pressure retrieval using the O2 -O2 absorption band
fected by the current use of a sub-optimal choice of SO2 cross at 477 nm, J. Geophys. Res.-Atmos., 109, D05204,
sections. https://doi.org/10.1029/2003JD003915, 2004.
Several important retrieval issues in the current opera- Aliwell, S. R., Van Roozendael, M., Johnston, P. V., Richter, A.,
tional algorithm that affect the quantitative use BrO VCDs Wagner, T., Arlander, D. W., Burrows, J. P., Fish, D. J., Jones, R.
have been raised in this paper such as the exclusion of O2 - L., Tornkvist, K. K., Lambert, J.-C., Pfeilsticker, K., and Pundt,
I.: Analysis for BrO in zenith-sky spectra: An intercomparison
O2 , nonoptimal SO2 cross sections, the neglect of the ra-
exercise for analysis improvement, J. Geophys. Res., 107, 4199,
diative effect of O3 absorption and the assumption of the https://doi.org/10.1029/2001JD000329, 2002.
stratospheric-only BrO profile. Users are advised to pay at- Begoin, M., Richter, A., Weber, M., Kaleschke, L., Tian-Kunze, X.,
tention to these issues so that the product can be used prop- Stohl, A., Theys, N., and Burrows, J. P.: Satellite observations
erly. Future versions of OMBRO will include updated SO2 of long range transport of a large BrO plume in the Arctic, At-
and O2 -O2 cross sections, corrections for the radiative trans- mos. Chem. Phys., 10, 6515–6526, https://doi.org/10.5194/acp-
fer effect of the O3 absorption, and reoptimization of the 10-6515-2010, 2010.
spectral fitting windows to mitigate the interferences of other Blechschmidt, A.-M., Richter, A., Burrows, J. P., Kaleschke, L.,
trace gases. We will also improve the AMF calculation ac- Strong, K., Theys, N., Weber, M., Zhao, X., and Zien, A.: An
counting for clouds and O3 and will consider the use of exemplary case of a bromine explosion event linked to cyclone
model-based climatological BrO profiles. These updates will development in the Arctic, Atmos. Chem. Phys., 16, 1773–1788,
https://doi.org/10.5194/acp-16-1773-2016, 2016.
increase the capabilities of the OMBRO retrieval to quantita-
Bobrowski, N., Hönninger, G., Galle, B. and Platt, U.: Detection of
tively estimate enhancements over salt lakes and in volcanic bromine monoxide in a volcanic plume, Nature, 423, 273–276,
plumes. 2003.
Bobrowski, N., von Glasow, R., Aiuppa, A., Inguaggiato, S.,
Louban, I., Ibrahim, O. W., and Platt, U.: Reactive halogen chem-
Data availability. SAO OMI BrO retrievals were per- istry in volcanic plumes, J. Geophys. Res. Atmos., 112, D06311,
formed using radiance data publicly accessible at https://doi.org/10.1029/2006JD007206, 2007.
https://doi.org/10.5067/Aura/OMI/DATA1002 (Dobber, Bobrowski, N., von Glasow, R., Giuffrida, G. B., Tedesco, D.,
2007). SAO OMBRO data are publicly available at Aiuppa, A., Yalire, M., Arellano, S., Johansson, M., and
https://doi.org/10.5067/Aura/OMI/DATA2006 (Chance, 2007). Galle, B.: Gas emission strength and evolution of the mo-
lar ratio of BrO/SO2 in the plume of Nyiragongo in com-
parison to Etna, J. Geophys. Res.-Atmos., 120, 277–291,
Competing interests. The authors declare that they have no conflict https://doi.org/10.1002/2013JD021069, 2015.
of interest. Bracher, A., Lamsal, L. N., Weber, M., Bramstedt, K., Coldewey-
Egbers, M., and Burrows, J. P.: Global satellite validation of
SCIAMACHY O3 columns with GOME WFDOAS, Atmos.
Acknowledgements. This study is supported by the NASA Chem. Phys., 5, 2357–2368, https://doi.org/10.5194/acp-5-2357-
Atmospheric Composition Program/Aura Science Team 2005, 2005.
(NNX11AE58G) and the Smithsonian Institution. Part of the Buchwitz, M., Rozanov, V. V., and Burrows, J. P.: A near-infrared
research was carried out at the Jet Propulsion Laboratory, Cali- optimized DOAS method for the fast global retrieval of atmo-
fornia Institute of Technology, under a contract with NASA. The spheric CH4 , CO, CO2 , H2 O, and N2 O total column amounts
Dutch–Finnish OMI instrument is part of the NASA EOS Aura from SCIAMACHY Envisat-1 nadir radiances, J. Geophys. Res.,
satellite payload. The OMI project is managed by NIVR and KNMI D105, 15231–15245, 2000.
in the Netherlands. We acknowledge the OMI International Science Burd, J. A., Peterson, P. K., Nghiem, S. V., Perovich, D. K., and
Team for providing the SAO OMBRO data product used in this Simpson, W. R.: Snowmelt onset hinders bromine monoxide het-
study. erogeneous recycling in the Arctic, J. Geophys. Res.-Atmos.,
122, 8297–8309, 2017.
Burrows, J. P. and Chance, K. V.: Scanning Imaging Absorption
Review statement. This paper was edited by William R. Simpson Spectrometer for Atmospheric ChartographY, Proc. SPIE, Future
and reviewed by Johannes Lampel and three anonymous referees. European and Japanese Remote Sensing Sensors and Programs,
1490 146–154, 1991.
Atmos. Meas. Tech., 12, 2067–2084, 2019 www.atmos-meas-tech.net/12/2067/2019/You can also read