Application of the ECT9 protocol for radiocarbon-based source apportionment of carbonaceous aerosols - Recent
←
→
Page content transcription
If your browser does not render page correctly, please read the page content below
Atmos. Meas. Tech., 14, 3481–3500, 2021
https://doi.org/10.5194/amt-14-3481-2021
© Author(s) 2021. This work is distributed under
the Creative Commons Attribution 4.0 License.

Application of the ECT9 protocol for radiocarbon-based source
apportionment of carbonaceous aerosols
Lin Huang1 , Wendy Zhang1 , Guaciara M. Santos2 , Blanca T. Rodríguez2 , Sandra R. Holden2 , Vincent Vetro1 , and
Claudia I. Czimczik2
1 ClimateResearch Division, Atmospheric Science & Technology Directorate, Environment and Climate Change Canada,
Toronto, ON M3H 5T4, Canada
2 Department of Earth System Science, University of California, Irvine, CA 92697-3100, USA

Correspondence: Lin Huang (lin.huang@canada.ca) and Claudia Czimczik (czimczik@uci.edu)

Received: 20 May 2020 – Discussion started: 4 August 2020
Revised: 22 February 2021 – Accepted: 23 February 2021 – Published: 17 May 2021

Abstract. Carbonaceous aerosol is mainly composed of or-          (rice char EC) to evaluate the effectiveness of OC and EC
ganic carbon (OC) and elemental carbon (EC). Both OC and          separation. Consensus F14 C values were reached for all OC
EC originate from a variety of emission sources. Radiocar-        (∼ 5–30 µg) and EC (∼ 10–60 µg) fractions with an uncer-
bon (14 C) analysis can be used to apportion bulk aerosol,        tainty of ∼ 5 % on average. We found that the ECT9 protocol
OC, and EC into their sources. However, such analyses re-         efficiently isolates OC or EC from complex mixtures. Based
quire the physical separation of OC and EC.                       on δ 13 C measurements, the average contribution of charred
    Here, we apply of ECT9 protocol to physically isolate OC      OC to EC is likely less than 3 % when the OC loading amount
and EC for 14 C analysis and evaluate its effectiveness. Sev-     is less than 30 µg C.
eral reference materials are selected, including two pure OC         Charring was further assessed by evaluating thermograms
(fossil “adipic acid” and contemporary “sucrose”), two pure       of various materials, including aerosol samples collected in
EC (fossil “regal black” and “C1150”), and three complex          the Arctic and from tailpipes of gasoline or diesel engines.
materials containing contemporary and/or fossil OC and EC         These data demonstrate that the ECT9 method effectively re-
(“rice char”, NIST urban dust standards “SRM1649a” and            moves pyrolyzed OC. Thus, the ECT9 protocol, initially de-
“SRM8785”, i.e., fine fraction of resuspended SRM1649a on         veloped for concentration and stable isotope measurements
filters). The pure materials were measured for their OC, EC,      of OC and EC, is suitable for 14 C-based apportionment stud-
and total carbon (TC) mass fractions and corresponding car-       ies, including µg C-sized samples from arctic environments.
bon isotopes to evaluate the uncertainty of the procedure. The
average accuracy of TC mass, determined via volumetric in-
jection of a sucrose solution, was approximately 5 %. Ratios
of EC/TC and OC/TC were highly reproducible, with ana-            Copyright statement. The works published in this journal are dis-
lytical precisions better than 2 % for all reference materials,   tributed under the Creative Commons Attribution 4.0 License. This
                                                                  licence does not affect the Crown copyright work, which is re-
ranging in size from 20 to 100 µg C. Consensus values were
                                                                  usable under the Open Government Licence (OGL). The Creative
reached for all pure reference materials for both δ 13 C and      Commons Attribution 4.0 License and the OGL are interoperable
fraction modern (F14 C), with an uncertainty of < 0.3 ‰ and       and do not conflict with, reduce, or limit each other. © Crown copy-
approximately 5 %, respectively. The procedure introduced         right 2021
1.3 ± 0.6 µg of extraneous carbon, an amount compatible to
that of the Swiss_4S protocol.
    In addition, OC and EC were isolated from mixtures of         1   Introduction
pure contemporary OC (sucrose) with pure fossil EC (regal
black) and fossil OC (adipic acid) with contemporary EC           Carbonaceous aerosol is a major component (15 %–90 %)
                                                                  of airborne particulate matter (PM) (Jimenez et al., 2009;

Published by Copernicus Publications on behalf of the European Geosciences Union.
3482                                          L. Huang et al.: ECT9 protocol for radiocarbon-based source apportionment

Putaud et al., 2010; Yang et al., 2011a, b; Hand et al., 2013;     However, 13 C data cannot distinguish emissions from mixed
Ridley et al., 2018) and is a complex mixture composed             fossil fuel combustion and live C3 plant biomass (Huang
of mainly light-scattering organic carbon (OC) and highly-         et al., 2006; Winiger et al., 2016). Thus, isotope-based source
refractory, light-absorbing elemental carbon (EC, also re-         apportionment studies become particularly insightful when
ferred to as black carbon) (Pöschl, 2005). The OC and EC           both 14 C and stable carbon isotopes are considered (Ander-
fractions play important and often distinct roles in climate       sson et al., 2015; Winiger et al., 2016, 2017) or when com-
(Bond et al., 2013; Hallquist et al., 2009; Kanakidou et al.,      bined with analyses of specific source tracers, such as lev-
2005; Laskin et al., 2015), air pollution, and human health        oglucosan or potassium for wood burning emissions (Szidat
(Cohen et al., 2017; Grahame et al., 2014; Janssen et al.,         et al., 2006; Zhang et al., 2008) and/or remote sensing data
2012). Moreover, both OC and EC were identified as short-          and modeling analysis (Barrett et al., 2015; Mouteva et al.,
lived climate forcers (SLCFs) by the IPCC expert meet-             2015b; Wiggins et al., 2018).
ing (https://www.ipcc-nggip.iges.or.jp/public/mtdocs/1805_            The objective of this study is to evaluate the effective-
Geneva.html, 15 April 2021) in 2018. To develop and mon-           ness of separating OC and EC via the ECT9 (EnCan-Total-
itor the efficiency of mitigation strategies for both climate      900) protocol (Huang et al., 2006; Chan et al. 2010, 2019)
change and air pollution, it is required to have a better under-   for 14 C-based source apportionment studies of carbonaceous
standing of the temporal and spatial dynamics of OC and EC         aerosols. The ECT9 technique was originally developed to
emission sources.                                                  physically separate OC and EC mass fractions for concentra-
   The majority (> 50 %) of carbonaceous aerosol is OC,            tion quantification and stable carbon isotope analysis. This
which has a wide size range. Coarse OC (in PM10 ) consists of      protocol has been used since 2006 to monitor carbonaceous
plant debris, microorganisms, fungal spores, and pollen. Fine      aerosol mass concentrations and stable isotope composition
OC (in PM2.5 ) is formed predominantly via the oxidation or        over Canada, including in the Arctic at Alert, as part of
nucleation and coagulation of volatile organic compounds,          the Canadian Aerosol Baseline Measurements (CABM) Net-
such as mono- and sesquiterpenes, from both biogenic and           work by Environment and Climate Change Canada (Chan
anthropogenic sources (Shrivastava et al., 2017) but can also      et al., 2010, 2019; Eckhardt et al., 2015; Sharma et al., 2017;
be directly emitted from combustion sources (Hallquist et al.,     Xu et al., 2017; Leaitch et al., 2013, 2018; Huang, 2018).
2009; Fuzzi et al., 2015; Liggio et al., 2016). In contrast, EC    It has also been used to monitor carbonaceous aerosol over
is found primarily in fine particles, e.g., PM1.0 or smaller       China (Yang et al., 2011a, b). Furthermore, EC concentration
(Chan et al., 2013; Bond et al., 2013). It is emitted through      measurements made with the ECT9 protocol correlate well
incomplete combustion of fossil fuels and biomass and bio-         with those derived from light absorption by an aethalome-
fuels (Bond et al., 2013; Huang et al., 2010; Evangeliou et al.,   ter and refractory black carbon (rBC) using a Single Parti-
2016; Winiger et al., 2016, 2017, 2019).                           cle Soot Photometer (SP2) (Sharma et al., 2017; Chan et al.,
   Measuring the isotopic signature and composition, i.e., ra-     2019). It was demonstrated that the ECT9 protocol can be
diocarbon (14 C) content and stable isotope ratio (13 C/12 C) of   used to quantify OC/EC concentrations and provide source
aerosol, offers a powerful tool for quantifying the sources of     information at the same time.
bulk aerosol and its OC and EC fractions. Aerosol 14 C con-           The ECT9 protocol is a thermal evolution analysis (TEA)
tent can be used to quantify the relative contributions from       protocol that is different from commonly used thermal opti-
contemporary biomass and fossil sources (Heal, 2014). 14 C is      cal analysis (TOA) methods for monitoring air quality, such
a naturally occurring radioisotope (5730 year half-life) pro-      as the Interagency Monitoring of Protected Visual Environ-
duced in the atmosphere. After its oxidation to carbon diox-       ments (IMPROVE) protocol (Chow et al., 2001; Watson
ide (14 CO2 ), 14 C enters the food chain through photosyn-        et al., 2007), the National Institute for Occupational Safety
thesis so that all living organisms are labeled with a char-       and Health protocol (NIOSH method 5040, Birch, 2002), and
acteristic 14 C/12 C ratio and described as “modern” carbon.       the European Supersites for Atmospheric Aerosol Research
Materials containing carbon older than about 50 000 years          (EUSAAR) protocol (Cavalli et al., 2010). In those protocols,
(14 C  12 C) are described as “fossil” carbon. Over the past      the OC fraction is thermally desorbed from filter samples in
centuries, the 14 C content of the atmosphere has under-           an inert helium (He) atmosphere at relatively low temper-
gone distinct changes (Graven, 2015; Graven et al., 2020;          atures, and the EC fraction is combusted at higher temper-
Levin et al., 2010): anthropogenic combustion of fossil fu-        atures by introducing oxygen (O2 ) into the He stream while
els emits 14 C-depleted carbon into the atmosphere (i.e., di-      the filter reflectance or transmittance for a laser signal is con-
lutes the proportion of 14 C relative to 12 C). In contrast, nu-   tinuously monitored. During the analysis, a fraction of the
clear weapons testing doubled the 14 C content of CO2 in the       OC may char (forming pyrolyzed OC or PyOC), causing the
Northern Hemisphere in the mid-20th century, followed by           transmittance or reflectance to decrease. While TOA meth-
mixing of this bomb-derived 14 C-enriched carbon into the          ods use the changes in laser signal to mathematically cor-
ocean and biosphere. Similarly, aerosol stable isotope ratios      rect for PyOC within the measured EC fraction, the ECT9
provide insight to different types of anthropogenic sources        protocol aims to minimize or remove PyOC, together with
(e.g., combustion of solid and liquid vs. gaseous fossil fuels).   carbonate carbon (CC), during an intermediate temperature

Atmos. Meas. Tech., 14, 3481–3500, 2021                                              https://doi.org/10.5194/amt-14-3481-2021
L. Huang et al.: ECT9 protocol for radiocarbon-based source apportionment                                                    3483

step of 870 ◦ C in pure He via high-temperature evaporation         (99.9999 % purity), (2) PyOC and CC at 870 ◦ C for 600 s in
(Chan et al., 2019). With much longer retention times at each       pure He, and (3) EC at 900 ◦ C for 420 s in a mixture of 2 %
temperature step (see Sect. 2) and without either reflectance       O2 with 98 % He. All fractions are fully oxidized to CO2
or transmittance used, the ECT9 protocol effectively isolates       by passing through a furnace containing MnO2 maintained
OC, PyOC + CC, and EC.                                              at 870 ◦ C. For concentration determination, the CO2 passes
   It should be noted that other methods have been also de-         through a methanator at 500 ◦ C, is converted to CH4 , and is
veloped mainly for 14 C analysis of OC and EC, such as              quantified with a flame ionization detector. For isotope anal-
the CTO-375 (Zencak et al., 2007), the Swiss_4S proto-              ysis, the CO2 is cryo-trapped with liquid N2 (−196 ◦ C) in a
col (Mouteva et al., 2015a; Zhang et al., 2012; Szidat et           U-shaped glass trap, purified on a vacuum system (to remove
al., 2004), or hydropyrolysis (Meredith et al., 2012; Zhang         He), sealed into a Pyrex ampoule, and analyzed for its δ 13 C
et al., 2019), which use distinct temperature protocols and         ratio with an Isotopic Ratio Mass Spectrometer (IRMS), i.e.,
gas mixtures and/or remove water-soluble OC or inorganic            MAT253 or F14 C with an Accelerated Mass Spectrometer
carbon prior to EC analysis. In contrast to the ECT9 protocol,      (AMS).
however, these approaches differ substantially from the pro-
tocols that are widely used for monitoring OC/EC mass con-          2.2   Reference materials and their composition
centrations in the field, which limits the relevance of this data
for improving the representation of carbonaceous aerosols in        To evaluate the ECT9 method for separating OC and EC for
chemical transport models.                                          14 C analysis, we isolated and measured the 13 C and 14 C con-

   Here we analyzed the 14 C content of OC and EC fractions         tent of the OC or EC fraction or total carbon (TC) from five
(< 100 µg C) isolated with the ECT9 protocol from four pure         to six modern or fossil reference materials (Table 1), includ-
fossil and contemporary reference materials. These materi-          ing two pure OC (adipic acid, sucrose), two EC (C1150, regal
als were analyzed on their own to quantify the amount and           black), and two natural OC/EC mixtures (rice char and urban
source (modern or fossil) of extraneous carbon introduced           dust SRM1649a).
by the procedure, as well as its reproducibility. Mixtures of          Some of the reference materials have previously been uti-
two reference materials were measured to elucidate how ef-          lized to compare different protocols that quantify OC/EC
ficiently the ECT9 protocol isolates OC from EC. In addi-           fractions (Hammes et al., 2007; Willis et al., 2016) and to
tion, we investigated the laser signals of three reference ma-      determine the mass of extraneous carbon introduced during
terials and three aerosol samples (tailpipe emissions, ambi-        OC/EC isolation from carbonaceous aerosol (Mouteva et al.,
ent aerosol from Alert, and SRM8785) to assess how effi-            2015a). Table 1 provides an overview of their chemical com-
ciently the ECT9 protocol removes PyOC. Our evaluation of           positions, i.e., total carbon contents and relative fraction of
the ECT9 protocol on its ability to physically separate OC          OC and EC, respectively (for individual measurements, see
from EC for 14 C-based source apportionment studies signif-         Table S1 in the Supplement). Primary methods (i.e., gravi-
icantly expands the existing opportunities for characterizing       metric or volumetric) are used for mass loading of the ma-
and monitoring sources of carbonaceous aerosol at regional          terials, whereas the mass of TC, OC, and EC are quantified
or global scales while at the same time providing a solid base      via the ECT9 thermal protocol. Based on repeat injections
for EC and OC concentration measurements.                           of sucrose results (20–80 µg sucrose, n = 117), the accuracy
                                                                    of the TC mass is about 5 %. The reproducibilities of both
                                                                    OC/TC and EC/TC percentages are 2 % or better. Although
2     Methods                                                       uncertainties of weighing pure EC mass (i.e., regal black and
                                                                    C1150) via microbalances are relatively large (due to static
2.1    The ECT9 protocol for the physical separation of             electricity and variable relative humidity), the EC/TC and
       OC and EC                                                    OC/TC ratios for all reference materials are highly repro-
                                                                    ducible (one SD < 2 %). The results show that the two EC
The ECT9 protocol was developed at the carbonaceous                 materials (i.e., regal black and C1150) contain 97 % and 98 %
aerosol and isotope research (CAIR) lab of Environment and          EC, with only 3 % and 2 % OC, respectively. The two OC
Climate Change Canada (ECCC) to quantify the amount of              materials (i.e., sucrose and adipic acid) are 99 % and 100 %
OC and EC in carbonaceous aerosol and their δ 13 C values           OC and less than 1 % EC (likely due to charred OC contri-
(Huang et al., 2006; Chan et al., 2010, 2019). Carbon frac-         bution), respectively. Thus, the materials are suitable for the
tions are isolated with an OC/EC analyzer (Sunset Labora-           purpose of this study.
tory Inc.) coupled to a custom-made gas handling and cryo-             We also analyzed the 13 C and 14 C isotopic composition of
genic trapping system for CO2 collection from OC and EC             each reference material, using offline combustions and ECT9
fractions (Fig. 1a). The fractions are separated from each          coupled with cryo-purification to convert them into CO2 . The
other, according to their degree of refractoriness. Specifi-        results are summarized in Table 2 (for individual results see
cally, carbon fractions are released by the ECT9 protocol in        Tables S2 and S3 in the Supplement). The 14 C analysis of
three steps (Fig. 1b): (1) OC at 550 ◦ C for 600 s in pure He       µg C-sized carbonaceous aerosol samples requires the as-

https://doi.org/10.5194/amt-14-3481-2021                                             Atmos. Meas. Tech., 14, 3481–3500, 2021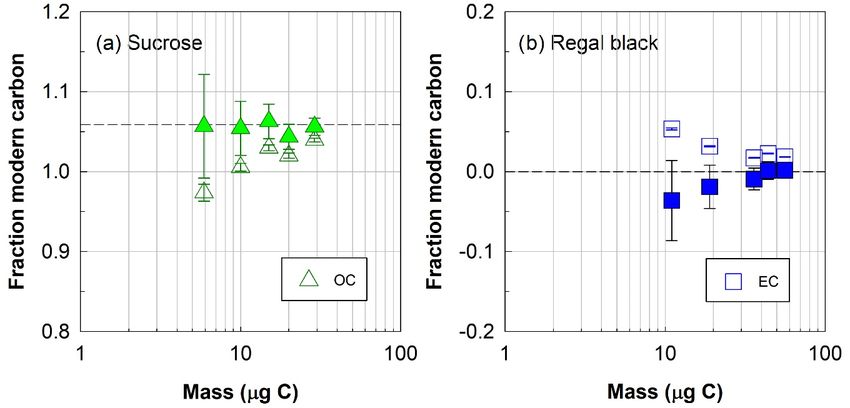
3484                                            L. Huang et al.: ECT9 protocol for radiocarbon-based source apportionment

Figure 1. Overview of the carbonaceous aerosol measurements (concentration and isotopes) via EnCan-Totol-900 (ECT9). (a) Schematic
procedures for 13 C and 14 C measurements of OC/EC via ECT9, including (1) OC/EC isolation and CO2 collection via cryo-trapping,
(2) CO2 purification, and (3) isotope analysis with IRMS (13 C/12 C of CO2 ) or AMS (13 C/12 C and 14 C/12 C of graphite targets). (b) Ther-
mogram of the ECT9 protocol on a Sunset OC/EC analyzer. First, organic carbon (OC) is thermally desorbed at 550 ◦ C for 600 s in 100 %
He, and then any pyrolyzed OC (PyOC), refractory OC, and carbonate carbon (CC) is released at 870 ◦ C in 100 % He for 600 s. Finally,
elemental carbon (EC) is combusted at 900 ◦ C for 420 s by introducing 2 % O2 in He. All carbon fractions are oxidized to CO2 followed by
reduction to CH4 and quantification via flame ionization detection (FID) for carbon content or purified and cryo-trapped in Pyrex ampoules
for isotope analysis. Example FID signals are shown for a pure OC reference material (sucrose) mixed with a pure EC material (regal black)
and the internal standard (CH4 ).

Atmos. Meas. Tech., 14, 3481–3500, 2021                                                    https://doi.org/10.5194/amt-14-3481-2021
L. Huang et al.: ECT9 protocol for radiocarbon-based source apportionment                                                                                                                          3485

Table 1. Overview of the bulk reference materials analyzed with the ETC9 method for their total carbon (TC), organic carbon (OC), and
elemental carbon (EC) contents.

  Reference                                   EC                                                         OC                                                   EC + OC mixture
  material
                    Regal black                            C1150                         Sucrose                  Adipic acid                     Rice char                      SRM-1649a
                   mean         SD                 mean               SD        mean                 SD          mean         SD                mean        SD                   mean      SD
  TC (%)               96                 9           98               12        101a                   4          43b                 5          52c                 1           17.9d            1.1
  OC/TC                 3                 1            1                2          99                   1          100                 0           14                 1            51.5            0.8
  (%)
  EC/TC                97                 1           99                 2           1                  1             0                0            86                1            48.5            0.8
  (%)
  n                    41                             24                          117                                 5                              6                                 6
  Bulk                                Fine powder                                      Solution                                                   Fine powder
  mate-
  rial
  Loading                         Gravimetric                                        Volumetric                                                  Gravimetric
  method             (via a balance with 1–0.1 µg accuracy)                           injection                                               (1–0.1 µg accuracy)
  Loading 16–134                                   4–104                       20–80                          30–250                         70–210                         440–1100
  range (µg)
  Analysis 2015–2017                               2006, 2013, 2015            2013–2018                      2015, 2019                     2018                           2004–2005
  period
  Supplier       Aerodyne Research,                McMaster Univ.,             Sigma-Aldrich,                 Fisher-Scientific,             Univ. of Zurich,               NIST, MD, USA
                 MA, USA                           ON, Canada                  MO, USA                        NH, USA                        Switzerland
 a The total of 101 % is obtained from the ratio of TC measured to TC calculated from the injected solution of sucrose; b A total of 49 % of TC to bulk material in adipic acid based on its molecular
 mass. c A total of 58.6 % of TC to bulk material in rice char obtained from Hammes et al. (2006). d A total of 17 % of TC to bulk material in SRM 1649a obtained from a critical evaluation of
 inter-laboratory data by Currie et al. (2002).

sessment of extraneous carbon (Santos et al., 2010). This is                                             (5–10 µL) of OC solution was very carefully applied onto a
achieved by measuring multiple smaller-sized materials with                                              pre-cleaned quartz filter surface (1.5 cm2 , Pall Canada Lim-
known 14 C content. Consequently, the results in Table 2 are                                             ited) via a syringe injection. After the injection, the quartz
critical, as those 14 C values provide the reference for quan-                                           boat holding the punch is pushed to the right position inside
tifying the extraneous carbon introduced during the isotope                                              of the analyzer. The volume of OC solution used does not sat-
analysis procedures.                                                                                     urate the filter but merely moistens the surface. After purging
                                                                                                         the filter for about 20 min ensuring the water is gone, the fil-
2.3    Isolation of OC, EC, or TC with the ECT9 protocol                                                 ter is ready for analysis. EC (i.e., regal black and C1150)
       and purification of CO2                                                                           and mixed materials (rice char or SRM 1649a), which can-
                                                                                                         not be completely dissolved in water, were directly weighed
The isotopic analysis of carbonaceous aerosol via the ECT9                                               onto pre-cleaned quartz filter punches in the form of solids
system involves three steps (Fig. 1a): (1) OC and EC isola-                                              (powders). Adipic acid was also loaded as powder. The final
tion and CO2 collection, (2) CO2 purification, and (3) isotope                                           power mass was determined by the difference weighted be-
analysis for either 13 C/12 C by IRMS or 14 C by AMS (i.e.,                                              fore and after analysis. A filter punch with the loaded mass
coupled measurements of 13 C/12 C and 14 C/12 C of µg C-                                                 was carefully carried to the Sunset analyzer by a Pyrex glass
sized graphite targets), as desired.                                                                     Petri dish with a cover for analysis with the ECT9 protocol.
   The initial masses of the pure reference materials ranged                                                OC and EC were separated and the combusted OC or EC
from 5 to 47 µg C (n = 3–13; Table S6 in the Supplement),                                                fractions (as CO2 ) were cryo-collected in a U-shaped flask
whereas those for the mixed materials ranged from 5–30 µg C                                              submerged in liquid N2 (Fig. 1a, step 1). Following this, the
for OC and 5–60 µg C for EC (n = 5–6; Table S7 in the Sup-                                               flask containing CO2 and He was connected to a vacuum line
plement). The loaded mass of each material was determined                                                with four cryo-traps and several open ports (Fig. 1a, step 2),
via a microbalance (MX5, Mettler Toledo or CCE6, Sarto-                                                  where the CO2 is purified by sequential distillation when
rius) with the lowest reading being 1 or 0.1 µg C, respectively.                                         passing cryo-traps 1 through 3. Finally, the pure CO2 is trans-
Filters before mass loading were pre-combusted at 900 ◦ C in                                             ferred and sealed into a 6 mm glass ampoule for 13 C or 14 C
a muffle furnace overnight and wrapped into pre-fired alu-                                               analysis. Pressure is read by a Pirani gauge before sealing the
minum foil before cooling below 200 ◦ C. Usually, OC ma-                                                 ampoule for an estimation of the amount of gas, and conse-
terials were first dissolved in Milli-Q water with known vol-                                            quently sample size could be determined as µg C.
ume to obtain its concentration, and then a known amount

https://doi.org/10.5194/amt-14-3481-2021                                                                                             Atmos. Meas. Tech., 14, 3481–3500, 2021
3486 L. Huang et al.: ECT9 protocol for radiocarbon-based source apportionment
Table 2. Overview of the isotopic composition of the reference materials used in this study. Radiocarbon (14 C/12 C, reported as fraction
modern, FM14 C) was measured at the KCCAMS facility, and δ 13 C was measured at the CAIR lab.
Reference material EC OC EC + OC mixture
Regal black C1150 Sucrose Adipic acid Rice char SRM-1649a
mean SD mean SD mean SD mean SD mean SD mean SD
14 C analysis
FM14 C_TC −0.0001 0.0006 0.0027 0.0008 1.0586 0.0016 0.0000 0.0002 1.0675 0.0007 0.5118 0.001
n 2 3 2 5 3 1
Loading range (µg) 700–750 60–560 730–770 740–1050 900–960 760
CO2 isolation and Reference material is combusted in 6 mm O.D. quartz tubes with 80 mg CuO for 3 h at 900 ◦ C.
14 C/12 C analysis Sample CO2 is purified cryogenically and reduced to graphite (Xu et al., 2007).
δ 13 C analysis
δ 13 CVPDB (‰) −27.61 0.08 −23.06 0.08 −12.22 0.16 n/a −26.74 −25.84 0.07
n 5 5 9 n/a 1 2
Loading range 15–70 20–50 20 n/a 160 600
(µg or µg C*)
CO2 isolation Material is loaded on a quartz filter and combusted in a n/a See description for regal black, C1150,
Sunset OC/EC aerosol analyzer (http://www.sunlab.com, and sucrose.
last access: 19 April 2021) using the ECT9 method.
Sample CO2 is collected in a U-shaped flask submerged in
liquid N2 at −196 ◦ C (Fig. 1b).
CO2 extraction and Sample CO2 is cryogenically purified on a vacuum line n/a
13 C/12 C analysis and sealed into an ampoule for analysis with a MAT253
Isotopic Ratio Mass Spectrometer (Huang et al., 2013).
* Sucrose was loaded as a solution (µg C), and regal black, C1150, adipic acid, rice char, and SRM-1649a were loaded as a fine powder (µg dry mass); n/a stands for not applicable
2.4 14 C measurements evacuated, and combusted at 900 ◦ C for 3 h. The resulting
CO2 was cryogenically purified on a vacuum line, reduced
At the KCCAMS facility, the OC and EC fractions or TC to graphite using a closed-tube zinc-reduction method (Xu
(in form of CO2 ) were reduced to graphite on iron powder et al., 2007), and analyzed as described above.
via hydrogen (H2 ) reduction using equipment and protocols
specifically developed for smaller-sized (≤15 µg C) samples 2.5 Quantification of extraneous carbon
(Santos et al., 2007a, b). Briefly, sample- CO2 was introduced
Any type of sample processing and analysis introduces ex-
into a vacuum line, cryogenically isolated from any water
traneous carbon (Cex ). Therefore, the measured mass of any
vapor, monometrically quantified, and then transferred to a
sample will include the mass of this sample and of any Cex
heated reaction chamber, where it was mixed with H2 and
incorporated throughout the analysis (Eq. 1):
reduced to filamentous graphite. To characterize the graphi-
tization, handling, and AMS analysis, two relevant standards mspl_meas = mspl + mex , (1)
(oxalic acid II as modern carbon and adipic acid as fossil
carbon), with similar size ranges to the samples prepared where mspl_meas , mspl , and mex are the measured and theoret-
via ECT9, were also processed into graphite. The graphite ical mass of the sample and of Cex , respectively. For small
was then pressed into aluminum holders and loaded into the samples (with a mass of a few µg C), the mass of Cex can
AMS unit alongside measurement standards (Table S6) and compete with or overwhelm the sample mass and cause the
blanks for 14 C measurement (Beverly et al., 2010). The data measured F14 C value of a sample to deviate from its consen-
are reported as a fraction of modern carbon (F14 C), follow- sus value.
ing the conventions established by Stuiver and Polach (1977) Here, we estimated the mass of Cex introduced during the
and also described elsewhere (Reimer et al., 2004; Trumbore ECT9 protocol and the 14 C analysis following Santos et al.
et al., 2016). (2010), where Cex is understood to consist of a modern and
To establish consensus values (Table 2), we also analyzed of fossil component (Eq. 2):
the 14 C content of the bulk reference materials ranging in mex = mmex + mfex , (2)
size from 0.06 to 1 mg C, using our standard combustion
and graphitization methods. Larger aliquots of material were where mmex and mfex is the mass of the modern and fossil
weighed into a pre-combusted quartz tube with 80 mg CuO, Cex , respectively.
Atmos. Meas. Tech., 14, 3481–3500, 2021 https://doi.org/10.5194/amt-14-3481-2021L. Huang et al.: ECT9 protocol for radiocarbon-based source apportionment 3487
Following an isotope mass balance approach, the mea- Fspl_cor is determined from counting statistics and by propa-
sured isotopic ratio (14 C/12 C) of a sample (Rspl_meas ) can be gating the quantified blanks using a mass balance approach.
expressed as Eq. (3). Long-term and continuous measurements of various types of
blanks indicate that the mass of Cex within one analytical
mspl Rspl + mmex Rm + mfex Rf method or system can vary as much as 50 % (see Santos et al.,
Rspl_meas = , (3)
mspl_meas 2010; Fig. 1). Therefore, we applied a 50 % error in mfex and
mmex from long-term measurements of variance in mex of
where Rspl is the theoretical isotopic ratio of the sample, and
small samples (Santos et al., 2007a).
Rm and Rf are the consensus isotopic ratios of a modern
In this study, we used a multi-step approach to quantify
and fossil standard, respectively. This equation can be further
mex introduced by the ECT9 protocol and 14 C analysis (i.e.,
simplified because Rf is 0. Rm is determined by measuring
graphite target preparation for CO2 sample plus AMS anal-
regular-sized aliquots of this reference material. In addition,
ysis). First, we quantified mex introduced during 14 C sample
all 14 C/12 C ratios are corrected for isotope fractionation us-
preparation and analysis by analyzing different masses of our
ing their δ 13 C measured alongside 14 C on the AMS (Beverly
bulk reference materials without involving ECT9 protocol.
et al., 2010).
Extraneous carbon is introduced during sealed tube combus-
The mass of modern Cex can be quantified by analyzing
tion and graphitization followed by graphite target handling
fossil reference materials, which are highly sensitive to mod-
and AMS measurement at the KCCAMS facility. Typically,
ern pollutants and insensitive to fossil pollutants. Based on 14 C sample preparation and AMS measurement contributes
Eq. (3), the measured isotopic ratio of the fossil reference
a small portion to mex (Mouteva et al., 2015a; Santos et al.,
(Rf_meas ) can be expressed as Eq. (4):
2010). Second, we quantified the portion of mex added dur-
mmex Rm ing the isolation of OC and EC with the ECT9 protocol. This
Rf_meas = . (4) portion of mex allows us to determine the practical minimum
mspl_meas
sample size limit for the entire method, including mex contri-
The smaller the mass of the fossil reference material, the butions from filter handling before OC/EC analysis, instru-
greater the effect of the constant mass of modern Cex on the ment separation, and transfer to the cryo-collection system
isotope ratio of the fossil reference material, i.e., Rf_meas de- and Pyrex ampoules. To isolate this portion, we quantified
viates toward Rm . mex of the entire procedure (ECT9 protocol plus 14 C analy-
Similarly, the mass of fossil Cex can be quantified sis) by analyzing the 14 C signature of OC and EC from dif-
by analyzing modern reference materials. With decreas- ferent masses of a large set of reference materials and then
ing mass, the measured isotopic ratio of the modern refer- subtracted the portion of mex introduced during 14 C analy-
ence (Rm_meas ) will deviate more strongly from Rm (toward sis.
Rf ). Based on Eqs. (1)–(3) and assuming mspl
mmex , the
Rm_meas can be expressed as Eq. (5):
3 Results and discussion
mspl Rm + mmex Rm (mspl_meas − mfex )Rm
Rm_meas = ≈ . (5)
mspl_meas mspl_meas 3.1 Recovery estimation
Finally, we can calculate the Cex -corrected isotope ratio
The reference materials used in this study, including the mod-
of an unknown sample (Fspl_cor ). This value is reported as
ern and fossil end-members (i.e., the major carbon sources)
the ratio between the theoretical isotopic ratio of this sample
found in carbonaceous aerosol and their TC, OC, and EC
and the accepted value of a modern standard (R/Rm ), also
concentrations are shown in Table 1. Reference materials
known as “fraction modern” (F ; with all R corrected for sta-
were separated into OC, EC, or TC using the ECT9 method
ble isotope fractionation). This data are reported as Eq. (6):
at ECCC’s CAIR lab (Fig. 1) and analyzed for their 14 C con-
Rspl Rspl_meas − Rf_meas tent at UC Irvine’s KCCAMS facility, including graphitiza-
Fspl_cor = ≈ tion and AMS analysis.
Rm Rm_meas − Rf_meas
h i Figure 2 shows the cross-validation of carbon mass be-
Rspl_meas mmex tween the mass determined at ECCC’s CAIR lab and the
Rm − mspl_meas
≈ Fm∗ · h i, (6) mass quantified at UC Irvine’s KCCAMS lab indicating a
mmex mfex
1 − mspl_meas − mspl_meas very good positive correlation (R 2 = 0.93 for pure materials
and R 2 = 0.95 for two-material-mixtures in Fig. 2a and b, re-
where Fm∗ is determined from the direct measurement of spectively). Reassessment of sample masses by manometric
the modern primary reference material (OX1) used to pro- measurements at UC Irvine (UCI) show good agreement with
duce six time-bracketed graphite targets measured in a single initial mass loaded at ECCC’s CAIR lab via gravimetric or
batch after isotopic fractionation correction and normaliza- volumetric methods (Fig. 2a and b and Tables S6 and S7). It
tion (Santos et al., 2007a, b). The individual uncertainty of is suggested that no major losses or gains of carbon occurred
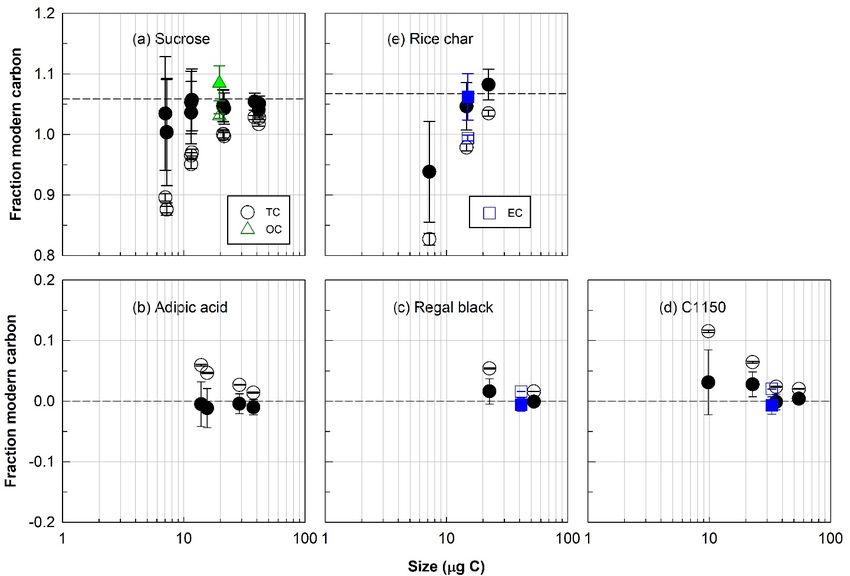
https://doi.org/10.5194/amt-14-3481-2021 Atmos. Meas. Tech., 14, 3481–3500, 20213488 L. Huang et al.: ECT9 protocol for radiocarbon-based source apportionment Figure 2. Cross-validation of carbon mass processed by the ECT9 protocol and collected via cryo-trapping at ECCC and the carbon mass retrieved during the purification and graphitization on a KCCAMS vacuum line. Carbon fractions (OC, EC, or TC) were isolated from two reference materials for OC (sucrose, adipic acid) and for EC (regal black, C1150) and one OC and EC mixture (rice char). Most of the points deviating from the 1 : 1 line are carbon-rich reference materials, e.g., regal black and C1150 (> 90 % TC), wherein there are usually greater uncertainties in initial mass determination via weighing using microbalance. Figure 3. Radiocarbon (14 C) compositions, expressed as fraction of modern carbon, total carbon (TC, circles), organic carbon (OC, triangles), and elemental carbon (EC, squares) isolated with the ECT9 protocol from individual modern or fossil reference materials. (a) Sucrose and (b) adipic acid are modern and fossil OC, respectively; (c) regal black and (d) C1150 are fossil EC; and (e) rice char is a mixture of modern OC and EC. Open and solid symbols represent 14 C data before and after correction for extraneous carbon introduced during OC/EC isolation and subsequent 14 C analysis, respectively. The dashed line indicates the consensus value determined from regular-sized bulk samples of these materials undergoing offline combustions (see Table 2). Atmos. Meas. Tech., 14, 3481–3500, 2021 https://doi.org/10.5194/amt-14-3481-2021
L. Huang et al.: ECT9 protocol for radiocarbon-based source apportionment                                                                                         3489

Table 3. Comparison of the OC and EC ECT9 and Swiss-4S isolation protocols.

   Carrier gas       Carbon fraction         Temperature (◦ C)          Duration (s)        Comments
   ETC9a
   He purge                                                 20–50                   90      Purging of volatile and semi-volatile OC
   He                OC                                       550                  600
   He                PyOC + CC                                870                  600      Minimizing charred OC contribution to EC
   O2 /Heb           EC                                       900                  420
   Swiss-4Sc
   O2 purge                                                 20–50                   90      Purging of volatile and semi-volatile OC
   O2                S1_OC                                    375                  240
   O2                S2_OC                                    475                  120
   He                S3_OC                                    650                  180
   O2                S4_EC                                    760                  160      Water-soluble OC is removed by water extraction prior to ther-
                                                                                            mal analysis
 a PyOC + CC = pyrolysis OC + carbonate carbon. b The flow of 10 % O + 90 % He mixing with the flow of 100 % He, resulting in 2 % O + 98 %He. c The EC punch is
                                                                    2                                                              2
 flushed with Milli-Q water prior the analysis to remove the water-soluble OC and minimize charring (Zhang et al., 2012; Mouteva et al., 2015a).

during the entire analytical process and the overall recovery                              als with different sizes. Figure 3 demonstrates that regardless
was close to 100 %, with a 5 % uncertainty for samples rang-                               what 14 C content is in carbon fractions isolated from the ref-
ing in size from about 5 to 60 µg C.                                                       erence materials and what size it is, the corrected F14 C val-
                                                                                           ues match with the consensus value within propagated uncer-
3.2   Quantification of extraneous carbon and its sources                                  tainty.
                                                                                              To evaluate the suitability of ECT9 for 14 C analysis of
All types of samples, regardless of size, show deviations in                               aerosol samples, a comparison is made between the results of
their measured F14 C value from their consensus values to                                  a published method (i.e., Swiss_4S) and those of ECT9. The
certain degree due to Cex introduced during sample analy-                                  two protocols are listed in Table 3, and their Cex distribution
sis. In µg C-sized samples (mass < 15 µg C), significant bias                              is shown in Table 4. The total amount of Cex introduced by
from any Cex can be observed because Cex constitutes a large                               the complete procedure through ECT9 and determined based
fraction of the total sample. Previous work (using solvent-                                on all reference materials was 1.3 ± 0.6 µg C, with 70 % orig-
free analytical protocols) has shown that modern Cex is intro-                             inating from contamination with modern carbon (Table 4).
duced mostly through instrumentation and sample handling                                   The isolation of OC and EC with the ECT9 protocol intro-
techniques, while fossil Cex originates from iron oxide used                               duced 65 % of total Cex (0.85 out of 1.35 µg C), with 65 %
as a catalyst for the reduction of CO2 to graphite prior to                                derived from modern carbon. Overall, the total amount of Cex
AMS analysis (Santos et al., 2007a, b).                                                    introduced during OC/EC isolation with the ECT9 protocol
    The F14 C values of the pure modern or fossil reference                                is comparable to that for the Swiss_4S protocol established
materials generally agreed with their accepted F14 C values                                at UCI within uncertainties (Table 3, Mouteva et al., 2015a).
for both OC and EC fractions (within approximately 5 % un-                                 Thus, it is demonstrated that the ECT9 protocol serves as a
certainty on average; see Fig. 3 and Table 2, S6, and S7) af-                              suitable alternative for the 14 C analysis of aerosol samples
ter applying a constant amount Cex correction in F14 C de-                                 with masses > 5 µg C.
termination. Specifically, the overall agreements for all in-
dividual pure (Table S6) and mixed reference materials (Ta-                                3.3     Effectiveness of OC/EC separation
ble S7, excluding the OC data from adipic acid + bulk rice
char) are within 2 ± 3 % of their corresponding values (Ta-                                To investigate the effectiveness of the ECT9 for separating
ble 2). On average, for samples containing > 10 µg C the                                   OC from EC in more complex mixtures while minimizing
agreements are within 1 ± 1 %, whereas samples containing                                  OC into the EC fraction via pyrolysis, mixtures of the mod-
between > 5 µg C and < 10 µg C are around 7 ± 5 %. This                                    ern and fossil reference materials (Table 2) were used for
constant Cex is a critical prerequisite for accurately correct-                            measuring δ 13 C (Tables S4 and S5 in the Supplement) and
ing the F14 C value of unknown samples. Hence, our data                                    F14 C (Table S7).
demonstrated that the ECT9 method (and subsequent 14 C                                        First, it was found that the F14 C values of OC and EC frac-
analysis) introduces a small, reproducible amount of Cex .                                 tions isolated from mixtures of pure sucrose (modern OC)
    According to Eqs. (4) and (5) in Sect. 2.5, Cex can be quan-                           and pure regal black (fossil EC) were within the measure-
tified by measuring F14 C of pure modern or fossil materi-                                 ment uncertainty of their accepted F14 C values after correc-

https://doi.org/10.5194/amt-14-3481-2021                                                                           Atmos. Meas. Tech., 14, 3481–3500, 2021
3490 L. Huang et al.: ECT9 protocol for radiocarbon-based source apportionment
Figure 4. Radiocarbon (14 C) composition, expressed as fraction of modern carbon, of (a) organic (OC, triangles) or (b) elemental (EC,
squares) carbon fractions isolated with the ECT9 protocol from mixtures of pure modern OC (sucrose) with fossil EC (regal black). Open
and solid symbols represent 14 C data before and after correction for extraneous carbon introduced during OC/EC isolation via ECT9 and
subsequent 14 C analysis via AMS, respectively (see Table S7). The dashed line indicates the consensus value (see Table 2).
Table 4. Comparison of the procedural contamination with extrane- and analyzed. It was found that after correction for Cex , the
ous carbon for aerosol reference materials partitioned into organic F14 C values of the OC (from the mixture) were systemati-
carbon (OC) and elemental carbon (EC) with the ECT9 or Swiss_4S cally greater than the consensus value of the pure adipic acid,
protocols based on their 14 C contents. We assume a measurement i.e., a F14 C of zero (Fig. 5a), indicating that there was cer-
uncertainty of 50 % (see Sect. 2). tain level of modern fraction contributed to the measured OC
from the modern rice char. Based on an elevated mean value
Contamination Source ECT9 Swiss_4Sa of 0.1081 ± 0.0259 (n = 6) after blank corrections, a mass
µg C
balance calculation indicates that 10 ± 3 % of rice char OC
OC/EC isolation + trapping is present. The high end of this estimation is close to ∼ 14 %,
Modern 0.55 0.37
within a validity range of what one would expect.
Fossil 0.30 0.13 To confirm that ECT9 could remove OC contained in rice
Total 0.85 0.50 char, an additional step was taken before mixing modern rice
char’s EC with the fossil OC (adipic acid). Specifically, we
14 C analysisb
stripped the OC fraction of rice char by running rice char (on
Modern 0.35 0.43 a filter) through the ECT9 protocol. Adipic acid (fossil OC)
Fossil 0.10 0.53 was then injected onto the filter with the remaining rice char
Total 0.45 0.97 EC. The results show that the F14 C of OC values of this mix-
Full set-up
ture lie well within the expected range of the consensus value
(Fig. 5b) after a Cex correction as described above, demon-
Modern 0.90 0.80 strating an excellent removal of rice char OC.
Fossil 0.40 0.67 In both mixtures (fossil adipic acid with modern bulk rice
Total 1.30 1.47 char or rice char EC), the corrected F14 C values of the iso-
a From Mouteva et al. (2015a). b Carbon introduced during sample lated EC fractions were within the expected range for the
combustion, CO2 purification and graphitization, and measurement rice char reference material (Fig. 5c and d). This provides
with 14 C AMS.
further evidence that the ECT9 protocol isolates modern EC
from fossil OC with no obvious evidence of transferring fos-
sil OC into the EC fraction. Together, the three sets of mixing
tion for a constant amount of Cex (Fig. 4) for samples with 5– experiments (Figs. 4 and 5) provide strong evidence for the
34 µg OC carbon and 10–60 µg EC carbon, showing a good effectiveness of separating OC from EC via ECT9 protocol.
separation of OC from EC. This amount of Cex was iden- In addition to F14 C measurements, δ 13 C measurements in
tical to that applied to the pure reference materials above, mixtures of OC and EC can also provide quantitative infor-
further corroborating the constant background introduced by mation on the effectiveness of OC and EC separation via
the ECT9 protocol and 14 C analysis. ECT9. Various amounts of sucrose (pure OC, 10–30 µg C)
Next, the mixtures of fossil adipic acid (pure OC) and were first mixed with varying amounts of regal black (pure
modern rice char (mixture of OC and EC) were isolated
Atmos. Meas. Tech., 14, 3481–3500, 2021 https://doi.org/10.5194/amt-14-3481-2021L. Huang et al.: ECT9 protocol for radiocarbon-based source apportionment 3491
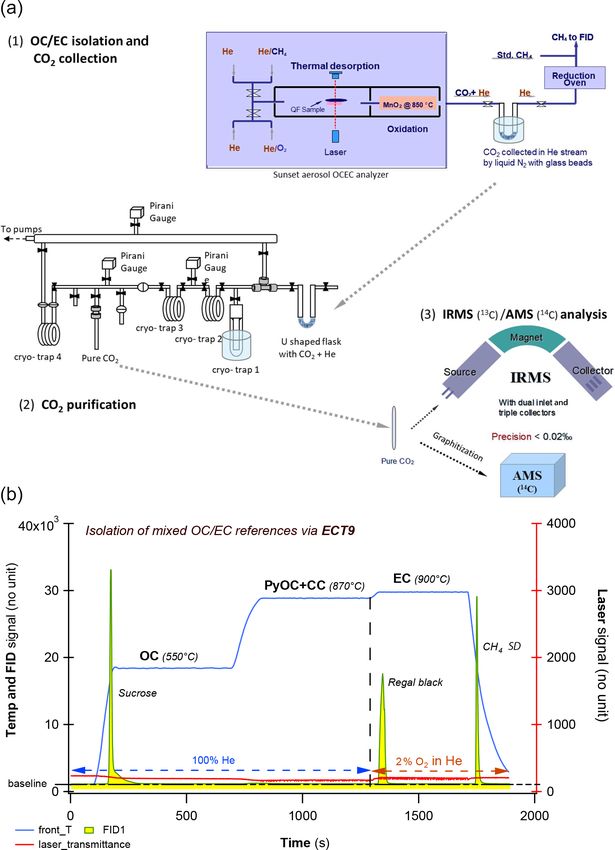
Figure 5. Radiocarbon (14 C) compositions, expressed in fraction modern carbon, of organic (OC, triangles) and elemental (EC, squares)
carbon fractions isolated with the ECT9 protocol from the mixtures of reference materials. Fraction of modern carbon (a) OC and (c) EC
isolated from mixtures of pure fossil OC (adipic acid) with modern bulk rice char (made of 14 % OC and 86 % EC) and of (b) OC and (d) EC
isolated from mixtures of pure fossil OC (adipic acid) with modern EC from rice char_EC (rice char_OC has been removed before mixing).
Open and solid symbols represent data before and after correction for extraneous carbon introduced during OC/EC isolation via ECT9 and
subsequent 14 C analysis via AMS, respectively (Table S7). The dashed line indicates the consensus value (see Table 2).
EC, 20–66 µg C). The mixtures were then physically sepa- contribute to EC when O2 is added. However, PyOC can
rated into OC and EC fractions by ECT9 for δ 13 C measure- be also be gasified and released as CO at high temperatures
ments. The measured δ 13 C values of OC and EC from these (> 700 ◦ C) with limited O2 supply, e.g., oxygenated OC at
mixing experiments are listed in Table S4. Based on the δ 13 C 870 ◦ C (Huang et al., 2006; Chan et al., 2010, 2019). Most
values of individual pure reference materials (Table S3) and TOA protocols estimate PyOC by quantifying the mass as-
a two end-member mixing mass balance, it is estimated that sociated with reflectance and transmittance changes, i.e., the
the average fraction contributed into each other in the mix- mass released between the time when O2 is introduced and
tures (i.e., sucrose fraction into regal black or vice versa) was the OC/EC split point (where the reflectance and transmit-
likely less than 3 % (Table S5). tance returns to the initial value). In contrast to other TOA
protocols, ECT9 defines PyOC as the mass released at the
3.4 Charring evaluation and PyOC removal using the temperature step of 870 ◦ C (during a period of 600 s). This
ECT9 protocol includes charred OC, calcium carbonate (CaCO3 ) that de-
composes at 830 ◦ C, and any refractory OC not thermally
It is known that some of OC (e.g., oxygenated OC or water- released at 550 ◦ C (Huang et al., 2006; Chan et al., 2010,
soluble OC) would char to form pyrolyzed organic carbon 2019).
(PyOC) when heated in an inert He atmosphere, darkening Although ECT9 does not use laser signals to quantify
the filter (Chow et al., 2004; Watson et al., 2007) and caus- PyOC, it is expected that the changes of laser signals during
ing decreased laser signals due to light absorption of charred the stage of 870 ◦ C would provide useful information about
OC. In most TOA protocols, this PyOC would combust and PyOC. Thus, four sets of samples were selected, including
https://doi.org/10.5194/amt-14-3481-2021 Atmos. Meas. Tech., 14, 3481–3500, 20213492 L. Huang et al.: ECT9 protocol for radiocarbon-based source apportionment Figure 6. Thermograms of pure or bulk references: (a) regal black, (b) sucrose, and (c) rice char. Temperature (solid blue line) and FID signals (integrated yellow area with green line) on the left axes and laser (solid red line) on the right axis. It is observed that on the three thermograms during the temperature stage of 870 ◦ C, the laser transmittance signals decrease first and increase again before the next temperature stage, minimizing PyOC fraction, i.e., possible charred OC contribution to EC. those of pure reference materials and ambient aerosol sam- and that they return to their initial values just before EC is ples from different sources with heavy or light mass loading released at the next step of 900 ◦ C. This demonstrates that (e.g., those arctic sample filters from different seasons) to the ECT9 method minimizes PyOC contributions to the EC evaluate the possible charring via ECT9. Their thermograms fraction. are shown in Figs. 6 to 9. The thermograms of aerosol (on filters) collected directly Figure 6a–c show thermograms of pure or bulk references from tailpipe exhaust of a diesel engine vehicle and a gaso- for regal black, sucrose, and rice char, respectively. It is ob- line engine passage car, respectively are shown in Fig. 7. served in all three panels that the laser transmittance signals These data suggest that the amount of PyOC generated dur- first decrease and then increase again during the 870 ◦ C step ing analysis are sample/matrix dependent. Specifically, the Atmos. Meas. Tech., 14, 3481–3500, 2021 https://doi.org/10.5194/amt-14-3481-2021
L. Huang et al.: ECT9 protocol for radiocarbon-based source apportionment                                                                 3493

Figure 7. Thermograms of the filters directly collected from tailpipe exhaust of a diesel engine vehicle in (a) and a gasoline engine passage
car in (b). The legends are the same as Fig. 6. Note that the mass fraction from the temperature stage of 870 ◦ C in (b) is obviously larger
than that in (a). The latter is negligible, indicating that the amount of PyOC fraction is sample matrix dependent. The amount of PyOC from
gasoline vehicle emissions is likely larger than that from diesel vehicle emissions. Note that the laser signal reaches the initial value before
the 900 ◦ C stage for EC releasing, demonstrating that the charring contribution to EC is minimized.

mass fraction during the 870 ◦ C temperature is larger for the            with a fine fraction < 2.5 µm collected on quartz filter) an-
gasoline than the diesel engine. This finding supports previ-             alyzed with ECT9 and Swiss_4S are shown in Fig. 9. Both
ous work showing that PyOC is proportional to the amount of               thermograms obtained with the ECT9 method (Fig. 9a and b)
oxygenated OC (Chan et al., 2010). It is noticed that the laser           show the similar patterns as those in Figs. 6–8, i.e., the laser
signal reaches the initial value before the EC step, further              signals reaching the initial value just before the EC release
demonstrating that the charring contribution to EC is mini-               at 900 ◦ C, suggesting that the charring contribution to EC
mized.                                                                    is minimized during the stage of 870 ◦ C even though some
   Another set of thermograms of two total suspended parti-               PyOC might remain.
cle filter samples collected during the summer (August) and                  In the thermogram obtained with the Swiss-4S protocol
winter (December) of 2015 at an arctic site (i.e., Alert) are             (Fig. 9c), the laser signal increases from the beginning of the
shown in Fig. 8. More details about these samples can be                  run while the first two stages (375 and 475 ◦ C) are under the
found in Wex et al. (2019). The laser signal patterns are sim-            conditions of pure O2 stream, inferring that light absorbing
ilar to those shown in Figs. 6 and 7, yet more pronounced.                carbon is released during the first two OC stages. The laser
During the 550 ◦ C step, the laser signals decrease. During               signal continues to increase while the temperature increases
the 870 ◦ C step, the signals further decrease, then increase,            up to 650 ◦ C (the third stage) under the pure He gas stream,
and finally increase to their initial point before EC is released         indicating that no charred OC is formed. However, when the
at 900 ◦ C. These thermograms further demonstrate ECT9 is                 temperature starts decreasing from 650 ◦ C, the laser signal
able to minimize PyOC by gasification.                                    decreases, indicating PyOC formation below that tempera-
   Finally, the thermographs of NIST urban dust reference                 ture. This signal decrease continues until the beginning of
material SRM 8785 (the resuspended SRM 1649a urban dust                   the next pure O2 stage. It is important to note that to ob-

https://doi.org/10.5194/amt-14-3481-2021                                                      Atmos. Meas. Tech., 14, 3481–3500, 2021
3494                                             L. Huang et al.: ECT9 protocol for radiocarbon-based source apportionment

Figure 8. Thermograms of fine particles (PM1.0 µm) from the filter samples collected at an arctic site, i.e., Alert, NU, Canada, in summer (a)
and winter (b) 2015. The legends are the same as Fig. 6. It is clearly shown on both thermograms that during 550 ◦ C stage, the laser
signal starts decreasing (implying charred OC formation) and begins increasing at 870 ◦ C and reaches the initial value before the EC stage
(indicating the contribution to EC by charred OC is minimized or removed).

tain EC fraction, the Swiss-4 (Table 3) method calls for fil-            filter samples to be pre-extracted with water before EC anal-
ter sample pre-treatment, i.e., extraction with water before             ysis (to reduce PyOC).
the thermal separation of OC/EC to minimize the contribu-
tion of charred OC from the 3rd stage to EC at the 4th stage
(Zhang et al., 2012). However, for a method comparison, the              4    Conclusions
thermogram shown in Fig. 9c was from a filter without pre-
treatment. While it is difficult to make direct comparisons              We demonstrate the effectiveness of the ECT9 protocol to
between OC and EC from Fig. 9a and c, the laser profiles                 physically isolate OC and EC from aerosol samples for 14 C
from those thermograms in Fig. 9a and b indicate that in both            and 13 C analysis by using OC and EC reference materials on
cases charred OC is negligible or minimum via ECT9.                      their own and as mixtures. It was found that the ECT9 pro-
   Together, the thermograms (Figs. 6–9) elucidate that the              tocol successfully separates OC and EC fractions with a low
ECT9 protocol can effectively remove or minimize charred                 (but largely modern) total carbon blank of 1.3 ± 0.6 µg C.
OC (PyOC) to achieve good physical separation of OC and                  The majority (65 %) of this extraneous carbon originates
EC. Another great advantage of using ECT9 to separate OC                 from the isolation with the ECT9 protocol, with 35 % con-
from EC for isotope analysis (both 13 C and 14 C) is its con-            tributed from graphitization and 14 C measurement of the
sistency with the protocol used for OC and EC concentration              samples at the KCCAMS facility. After mass balance back-
measurements. Moreover, the ECT9 method does not require                 ground corrections, the F14 C results from both bulk pure ma-
                                                                         terials and mixtures (with sample size as small as 5 µg C) can

Atmos. Meas. Tech., 14, 3481–3500, 2021                                                     https://doi.org/10.5194/amt-14-3481-2021
L. Huang et al.: ECT9 protocol for radiocarbon-based source apportionment 3495 Figure 9. Thermograms of the SRM 8785 filters (the fine fraction (PM2.5 ) of resuspended urban dust particles from SRM 1649a and collected on quartz filters) with various amount of materials ranging from 614 to 1723 mg via two different thermal protocols. Panels (a) and (b) were obtained by ECT9. The legends are the same as Fig. 6. Thermograms in (a) and (b) show the similar patterns as in Figs. 6–8 that the laser signals reaching the initial value are just before the temperature stage of EC, suggesting that the charred OC contribution to EC is minimized. The thermogram in (c) is obtained from the same filter in (b) but by Swiss-4 protocol for comparison. The legends are similar except for the integrated area with green line, which stands for CO2 in parts per million (by non-dispersive infrared) instead of FID signals. reach the consensus values (Table 2) with an average uncer- ods/protocols widely used in long-term national monitoring tainty of about 5 %. network for OC/EC contents, ensuring a consistency in mea- In addition, we evaluated potential PyOC formation during surements between OC/EC concentrations and their corre- ECT9 by investigating thermograms of a variety of reference sponding isotopic compositions. materials and ambient filter samples. It is demonstrated that ECT9 provides a good alternative for carbonaceous aerosol source apportionment studies, including ultra small sized (5– 15 µg C) samples obtained from arctic regions. To increase the application of isotope data (14 C or 13 C) in atmospheric research, future efforts should be focused on the comparison on OC/EC separation via different methods/protocols using the same sets of reference materials. At the same time, the isolation results should be also compared among those meth- https://doi.org/10.5194/amt-14-3481-2021 Atmos. Meas. Tech., 14, 3481–3500, 2021
3496                                      L. Huang et al.: ECT9 protocol for radiocarbon-based source apportionment

Appendix A: Nomenclature

 AMS         Accelerator Mass Spectrometry
 ASTD        Atmospheric Science and Technology Directorate
 BC          Black carbon
 CABM        Canadian Aerosol Baseline Measurement
 CAIR        Carbonaceous Aerosol and Isotope Research
 CCMR        Climate Chemistry Measurements and Research
 CC          Carbonate carbon
 CRD         Climate Research Division
 EC          Elemental carbon
 ECCC        Environment and Climate Change Canada
 ECT9        EnCan-Total-900 protocol
 EUSAAR      European Supersites for Atmospheric Aerosol Research
 FID         Flame ionization detector
 F14 C       Fraction Modern Carbon
 ICP         Inter-comparison study
 IRMS        Isotopic Ratio Mass Spectrometer
 IMPROVE     Interagency Monitoring PROtected Visual Environments
 KCCAMS      W.M. Keck Carbon Cycle Accelerator Mass Spectrometry Facility
 MAC         Mass absorption coefficient
 NIST        National Institute of Standard and Technology
 OC          Organic carbon
 PM          Particulate matter
 PyOC        Pyrolyzed organic carbon
 PSAP        Particle Soot Absorption Photometer
 rBC         Refractory Black Carbon
 SP2         Single Particle Soot Photometer
 SRM         Standard Reference Material
 TC          Total carbon
 TEA         Thermal evolution analysis
 TOA         Thermal optical analysis
 UCI         University of California, Irvine

Atmos. Meas. Tech., 14, 3481–3500, 2021                                      https://doi.org/10.5194/amt-14-3481-2021
L. Huang et al.: ECT9 protocol for radiocarbon-based source apportionment                                                                3497

Data availability. All data presented in this article are included in     louin, N., Guttikunda, S. K., Hopke, P. K., Jacobson, M. Z.,
the supplement.                                                           Kaiser, J. W., Klimont, Z., Lohmann, U., Schwarz, J. P., Shin-
                                                                          dell, D., Storelvmo, T., Warren, S. G., and Zender, C. S.: Bound-
                                                                          ing the role of black carbon in the climate system: A scientific
Supplement. The supplement related to this article is available on-       assessment, J. Geophys. Res.-Atmos., 118, 5380–5552, 2013.
line at: https://doi.org/10.5194/amt-14-3481-2021-supplement.           Cavalli, F., Viana, M., Yttri, K. E., Genberg, J., and Putaud, J.-P.:
                                                                          Toward a standardised thermal-optical protocol for measuring at-
                                                                          mospheric organic and elemental carbon: the EUSAAR protocol,
Author contributions. Conceptualizing and designing the study:            Atmos. Meas. Tech., 3, 79–89, https://doi.org/10.5194/amt-3-79-
LH, CIC, and GMS. Developing analytical methods and ensuring              2010, 2010.
data quality: LH, GMS, WZ, CIC, BTR. Performing the experi-             Chan, T. W., Huang, L., Leaitch, W. R., Sharma, S., Brook, J. R.,
ments and data acquisition: WZ, GMS, SRH, VV, BTR. Data or-               Slowik, J. G., Abbatt, J. P. D., Brickell, P. C., Liggio, J., Li, S.-
ganizing/analysis and interpretation: LH, CIC, BTR, GMS, WZ.              M., and Moosmüller, H.: Observations of OM/OC and specific
Writing the paper, including editing and preparing figures and ta-        attenuation coefficients (SAC) in ambient fine PM at a rural site
bles: LH, CIC, BTR, GMS, WZ.                                              in central Ontario, Canada, Atmos. Chem. Phys., 10, 2393–2411,
                                                                          https://doi.org/10.5194/acp-10-2393-2010, 2010.
                                                                        Chan, T. W., Meloche, E., Kubsh, J., Brezny, R., Rosenblatt,
                                                                          D., and Rideout, G.: Impact of Ambient Temperature on
Competing interests. The authors declare that they have no conflict
                                                                          Gaseous and Particle Emissions from a Direct Injection Gaso-
of interest.
                                                                          line Vehicle and its Implications on Particle Filtration, SAE
                                                                          International Journal of Fuels and Lubricants, 6, 350–371,
                                                                          https://doi.org/10.4271/2013-01-0527, 2013.
Acknowledgements. This research was supported by A-base fund-           Chan, T. W., Huang, L., Banwait, K., Zhang, W., Ernst, D.,
ing from Environment and Climate Change Canada and the KC-                Wang, X., Watson, J. G., Chow, J. C., Green, M., Czim-
CAMS Facility at the University of California, Irvine through             czik, C. I., Santos, G. M., Sharma, S., and Jones, K.: Inter-
G.M.S. We thank Darrell Enrst (ECCC) and John Southon (KC-                comparison of elemental and organic carbon mass measurements
CAMS) for supporting 13 C IRMS and 14 C AMS analyses, respec-             from three North American national long-term monitoring net-
tively.                                                                   works at a co-located site, Atmos. Meas. Tech., 12, 4543–4560,
                                                                          https://doi.org/10.5194/amt-12-4543-2019, 2019.
                                                                        Chow, J. C., Watson, J. G., Crow, D., Lowenthal, D. H., and Mer-
Review statement. This paper was edited by Pierre Herckes and re-         rifield, T.: Comparison of IMPROVE and NIOSH Carbon Mea-
viewed by three anonymous referees.                                       surements, Aerosol Sci. Technol., 34, 23–34, 2001.
                                                                        Chow, J. C., Watson, J. G., Chen, L. W. A., Arnott, W. P., Moos-
                                                                          müller, H., and Fung, K.: Equivalence of elemental carbon
                                                                          by thermal/optical reflectance and transmittance with different
References                                                                temperature protocols, Environ. Sci. Technol., 38, 4414–4422,
                                                                          https://doi.org/10.1021/es034936u, 2004.
Andersson, A., Deng, J., Du, K., Zheng, M., Yan, C.,                    Cohen, A. J., Brauer, M., Burnett, R., Anderson, H. R., Frostad, J.,
  Sköld, M., and Gustafsson, Ö.: Regionally-Varying Com-                  Estep, K., Balakrishnan, K., Brunekreef, B., Dandona, L., Dan-
  bustion Sources of the January 2013 Severe Haze Events                  dona, R., Feigin, V., Freedman, G., Hubbell, B., Jobling, A., Kan,
  over Eastern China, Environ. Sci. Technol., 49, 2038–2043,              H., Knibbs, L., Liu, Y., Martin, R., Morawska, L., Pope, C. A.,
  https://doi.org/10.1021/es503855e, 2015.                                Shin, H., Straif, K., Shaddick, G., Thomas, M., van Dingenen, R.,
Barrett, T. E., Robinson, E. M., Usenko, S., and Sheesley, R.             van Donkelaar, A., Vos, T., Murray, C. J. L., and Forouzanfar, M.
  J.: Source Contributions to Wintertime Elemental and Or-                H.: Estimates and 25-year trends of the global burden of disease
  ganic Carbon in the Western Arctic Based on Radiocarbon and             attributable to ambient air pollution: an analysis of data from the
  Tracer Apportionment, Environ. Sci. Technol., 49, 11631–11639,          Global Burden of Diseases Study 2015, Lancet, 389, 1907–1918,
  https://doi.org/10.1021/acs.est.5b03081, 2015.                          https://doi.org/10.1016/S0140-6736(17)30505-6, 2017.
Beverly, R. K., Beaumont, W., Tauz, D., Ormsby, K. M., Von Re-          Currie, L. A., Benner, B. A. J., Kessler, J. D., Klinedinst, D. B.,
  den, K. F., Santos, G. M., and Southon, J. R.: The Keck Carbon          Klouda, G. A., Marolf, J. V., Slater, J. F., Wise, S. A., Cachier,
  Cycle AMS laboraoty, University of California, Irvine Status re-        H., Cary, R., Chow, J. C., Watson, J., Druffel, E. R. M., Masiello,
  port, Radiocarbon, 52, 301–309, 2010.                                   C. A., Eglinton, T. I., Pearson, A., Reddy, C. M., Gustafsson,
Birch, M. E.: Applied Occupational and Environmen-                        Ö., Quinn, J. G., Hartmann, P. C., Hedges, J. I., Prentice, K. M.,
  tal Hygiene Occupational Monitoring of Particulate                      Kirchstetter, T. W., Novakow, T., Puxbaum, H., and Schmid, H.:
  Diesel Exhaust by NIOSH Method 5040, Applied Oc-                        A Critical Evaluation of Interlaboratory Data on Total, Elemen-
  cupational and Environmental Hygiene, 17, 400–405,                      tal, and Isotopic Carbon in the Carbonaceous Particle Reference
  https://doi.org/10.1080/10473220290035390, 2002.                        Material, NIST SRM 1649a, J. Res. Natl. Inst. Stan., 107, 279–
Bond, T. C., Doherty, S. J., Fahey, D. W., Forster, P. M., Berntsen,      298, 2002.
  T., DeAngelo, B. J., Flanner, M. G., Ghan, S., Kärcher, B., Koch,     Eckhardt, S., Quennehen, B., Olivié, D. J. L., Berntsen, T. K.,
  D., Kinne, S., Kondo, Y., Quinn, P. K., Sarofim, M. C., Schultz,        Cherian, R., Christensen, J. H., Collins, W., Crepinsek, S.,
  M. G., Schulz, M., Venkataraman, C., Zhang, H., Zhang, S., Bel-

https://doi.org/10.5194/amt-14-3481-2021                                                    Atmos. Meas. Tech., 14, 3481–3500, 2021
You can also read