Degradation of Ecosystem Services and Deforestation in Landscapes With and Without Incentive-Based Forest Conservation in the Ecuadorian Amazon
←
→
Page content transcription
If your browser does not render page correctly, please read the page content below
Article
Degradation of Ecosystem Services and Deforestation
in Landscapes With and Without Incentive-Based
Forest Conservation in the Ecuadorian Amazon
Paúl Eguiguren 1,2, * , Richard Fischer 2 and Sven Günter 1,2
 1    Institute of Silviculture, Department of Ecology and Ecosystem Sciences,
      TUM School of Life Sciences Weihenstephan, Technische Universität München, 85354 Freising, Germany;
      sven.guenter@thuenen.de
 2    Thünen Institute of International Forestry and Forest Economics, 21031 Hamburg, Germany;
      richard.fischer@thuenen.de
 *    Correspondence: paul.eguiguren@tum.de

 Received: 20 March 2019; Accepted: 17 May 2019; Published: 22 May 2019

 Abstract: Anthropogenic activities such as logging or forest conversion into agricultural lands
 are affecting Ecuadorian Amazon forests. To foster private and communal conservation
 activities an economic incentive-based conservation program (IFC) called Socio Bosque was
 established. Existing analyses related to conservation strategies are mainly focused on deforestation;
 while degradation and the role of IFC to safeguard ecosystem services are still scarce. Further on, there
 is a lack of landscape-level studies taking into account potential side effects of IFC on different forest
 types. Therefore we assessed ecosystem services (carbon stocks, timber volume) and species richness
 in landscapes with and without IFC. Additionally, we evaluated potential side-effects of IFC in
 adjacent forest types; hypothesizing potential leakage effects of IFC. Finally, we tested if deforestation
 rates decreased after IFC implementation. Forest inventories were conducted in 72 plots across eight
 landscapes in the Ecuadorian Central Amazon with and without IFC. Plots were randomly selected
 within three forest types (old-growth, logged and successional forests). In each plot all individuals
 with a diameter at breast height greater than 10 cm were measured. Old-growth forests in general
 showed higher carbon stocks, timber volume and species richness, and no significant differences
 between old-growth forests in IFC and non-IFC landscapes were found. Logged forests had 32% less
 above-ground carbon (AGC) and timber volume in comparison to old-growth forests. Surprisingly,
 logged forests near IFC presented higher AGC stocks than logged forests in non-IFC landscapes,
 indicating positive side-effects of IFC. Successional forests contain 56% to 64% of AGC, total carbon
 and timber volume, in comparison to old-growth forests, and 82% to 87% in comparison to logged
 forests. Therefore, successional forests could play an important role for restoration and should receive
 more attention in national climate change policies. Finally, after IFC implementation deforestation rate
 decreased on parish level. Our study presents scientific evidence of IFC contribution to conserving
 ecosystem services and species richness. In addition IFC could help indirectly to reduce degradation
 effects attributed to logging, indicating potential compatibility of conservation aims with forest
 activities at a landscape level.

 Keywords: carbon stocks; timber volume; species richness; forest integrity; Socio Bosque program

1. Introduction
    Tropical forests provide a wide range of ecosystem services, including supporting, provisioning,
regulating and cultural services [1]. Whereas at local level provisioning services such as food,
timber and medicine are of high importance for single land users and communities, regulating

Forests 2019, 10, 442; doi:10.3390/f10050442                                    www.mdpi.com/journal/forests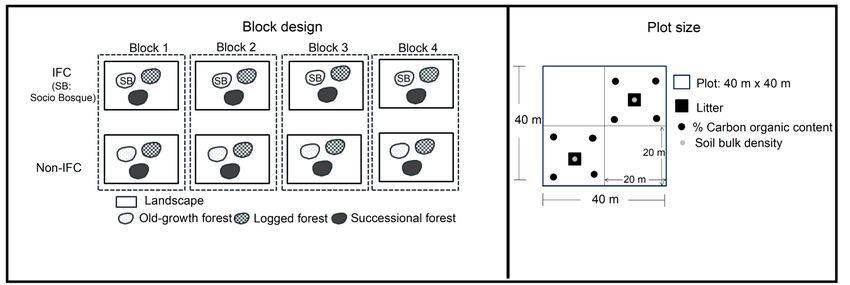
Forests 2019, 10, 442                                                                               2 of 26

services related to climate regulation and carbon sequestration play a central role at the global
level [1]. Tropical ecosystems can store between 208 Gt C and 288 Gt C of carbon in above and below
ground biomass [2–4]. Latin America’s forests hold 49% of the total carbon biomass in the tropics [4].
Additionally, tropical forest ecosystems are considered hotspots of biodiversity; it is estimated that
between 50–80% of all terrestrial species are located in these ecosystems [5,6].
     Anthropogenic activities have affected tropical forests in terms of degradation, forest cover loss
and fragmentation [7,8]. Deforestation and forest degradation contributed between 10% and 20%
of global anthropogenic greenhouse emissions between 1990–2005 [4,9]. Globally the annual rate
of net forest loss has declined from 7.3 M ha year−1 in the 1990s to 3.3 M ha year−1 between 2010
and 2015. This decreasing tendency has been also observed in tropical forests, with a decline from 9.5
(1990s) M ha year−1 to 5.5 M ha year−1 (2010–2015) [10]. Despite a recent trend of reduced deforestation
rates in the tropics, the annual loss is still remarkably high, and an unknown amount of carbon is
possibly being emitted by degradation rather than by deforestation processes [11,12].
     The Amazon Basin and Ecuadorian forest ecosystems have experienced similar dynamics since
1990. Deforestation in the Amazon Basin was specifically high with an annual rate of net deforestation
of −0.45% for the 1990s, whereas annual deforestation for Ecuador was −0.65% during the same
period [2,13]. Although for Ecuador the annual rate of net deforestation has decreased to −0.48% for
the period 2014–2016, it remains high in contrast to other countries of the region [13,14]. The main
drivers that lead to deforestation are road construction, oil extraction, land use change from forests
to agricultural crops and grasslands, and finally a growing population density in formerly forested
areas [15–18].
     Besides the negative effect of deforestation, it is important to highlight the impact of forest
degradation on ecosystem integrity by reducing the availability of goods and services; such as carbon
or water regulation [19–22] and biodiversity [23–28], due to species extinction, loss of natural habitats
and changes in species distribution [29]. In Latin America, around 70% of forest degradation is driven
by logging activities, followed by firewood, charcoal extraction and forest fires [30,31]. The intensity
of harvesting activities has a direct influence on forest structure, which is related to the reduction of
carbon stocks, timber volume and species composition through vegetation loss and tree damage [32–34].
A logging intensity of 4.5 to 5.7 trees ha−1 could result in a reduction of aboveground stand biomass
by 17% to 26%; meanwhile, a high logging intensity of 10 trees ha−1 reduced biomass by 48% [33,35].
According to Rutishauser et al. [36], when forests lose between 10% to 25% of above carbon stocks
due to logging, forest recovery will take among 12 to 43 years, which shows the significant impact of
logging activities.
     Due to the anthropogenic impact on forest ecosystems in recent decades, there has been a continuous
debate on what kind of conservation strategies would provide a better solution for ecosystem services’
conservation. It has been shown that governmental conservation strategies (e.g., protected areas)
can contribute to the protection of tropical ecosystems by reducing deforestation [37–39]. These areas
have expanded around the tropics and today represent almost 27% of the forest area [40,41]. In Ecuador,
protected areas represent almost 20% of the territory [42]. However, due to use restrictions, protected
areas do not always generate benefits for local communities [43–45]. Therefore, strategies based on
incentives for forest conservation (IFC) can be more attractive to local people as they are assumed to
contribute to alternative income and poverty alleviation. Such strategies could also be an adequate
way of combining ecosystem conservation and the provision of natural resources [46–48]. This is
key since local communities play an important role in the management and conservation of natural
resources. For example, in Ecuador it is estimated that between 5 and 7.5 M ha of forest belongs to
indigenous communities [49,50]. This emphasizes how important these actors are for land use decisions.
On the other hand, community land forest traditionally aiming to preserve forest lands for future
generations, has as well shown promising results for conservation. Some studies indicate that forest
loss can be lower in these cases or even similar to protected areas [51–53]. In Ecuador, Jones et al. [54]
and Mohebalian and Aguilar [55], found that areas with IFC (Socio Bosque program) in the Amazon
Forests 2019, 10, 442                                                                                 3 of 26

region are less deforested than areas that are not part of the program. However, Sánchez-Azofeifa et al. [56]
and Pfaff et al. [57] found that areas with IFC do not have lower deforestation rates than other areas.
      Many studies analyzing conservation measures such as IFC or protected areas have been focused
on assessing effects of deforestation [51–56,58,59]. However information on forest cover change does
not take into account forest integrity parameters in order to measure potential degradation effects
of ecosystem services. In our study we incorporated both into our assessment since we evaluated
deforestation after the implementation of IFC and the potential degradation effects. Forest degradation
is defined as the reduction of goods and ecosystems services (e.g., timber or carbon) due to anthropogenic
disturbances [60–62]. As indicators of forest degradation we used carbon stocks, total tree volume
and species richness. Species richness was selected as a basic indicator related to forest ecosystem
composition and function [23,25–28]. Due to the fact that IFC poses restrictions of access and use of
protected old-growth forests, it is possible that anthropogenic pressures could be deviated towards
adjacent forests, leading to higher pressure on logged or successional forests. Under this scenario,
IFC could create leakage effects at a landscape level, which to our knowledge is an important research
gap, and of particular importance for the Ecuadorian Central Amazon region. Therefore, we assessed if
IFC has an influence on ecosystem services degradation beyond the areas which are under conservation.
This is an important scientific contribution to the land sparing/land sharing debate for tropical
lowland ecosystems [63–67]. The results could improve the understanding of compatibility or
incompatibility of conservation measures and timber production at a landscape level as basis for
multifunctional landscapes.
      In our study area logging activities are an important potential driver of degradation, especially
when sustainability criteria are not applied in practice. Despite the considerable logging activities
that are taking place in the lowland forests of Ecuador, scientific information related to the impacts
of timber extraction on ecosystems services is still scarce. For this reason, we analyzed how logging
activities affect ecosystem services in landscapes with and without the presence of IFC. While logging
is an important driver of degradation in many areas of the world, agricultural use and pasture
management are important drivers of deforestation. These activities can lead to the establishment of
mosaics of successional forest stages, with rather unknown potential to contribute to forest ecosystem
services. In the Central Amazon region, many successional forests result mainly from abandoned
pastures; nevertheless, the potential contribution of this forest type has been overlooked. We took
into consideration this knowledge gap and we evaluated the contribution of these forests types to
the maintenance of ecosystem services in landscapes with and without IFC. The comprehensive
consideration of all dominant forest types (old-growth, logged and successional forests) in combination
with IFC, allows for a better decision-making process in the context of forest landscape conservation,
sustainable use and restoration.
      We focused on the Socio Bosque program in Ecuador which is an IFC program that began in
2008 with the aim of conserving forest, reducing deforestation and improving living conditions in
local communities [68,69]. Communities that voluntarily join the program sign a 20-year contract
with the Ecuadorian government in order to protect their forest (no extractive use being allowed in
the forest). In turn, communities receive cash compensations ranging from USD 0.70 to USD 35.00 per
ha year−1 , depending on the total size of the conserved forest [68–70]. Since the program holds
almost 1.6 M ha under long-term protection, Socio Bosque has become an important conservation
strategy in Ecuador [69].
      We tested five research questions and hypotheses related to forest degradation and deforestation.
(1) The IFC-regime has a general positive effect on carbon stocks, timber volume and species richness
in forest landscapes across all forest types (old-growth, logged and successional forest). The second
and third hypotheses are related to assessing interactions between forest types and landscapes with
and without IFC. (2) Old-growth forests under IFC have higher amounts of carbon stocks, timber volume
and species richness than old-growth forest in non-IFC landscapes. (3) Logged and successional
forests adjacent to old-growth forest under IFC have lower carbon stocks, timber volumes and species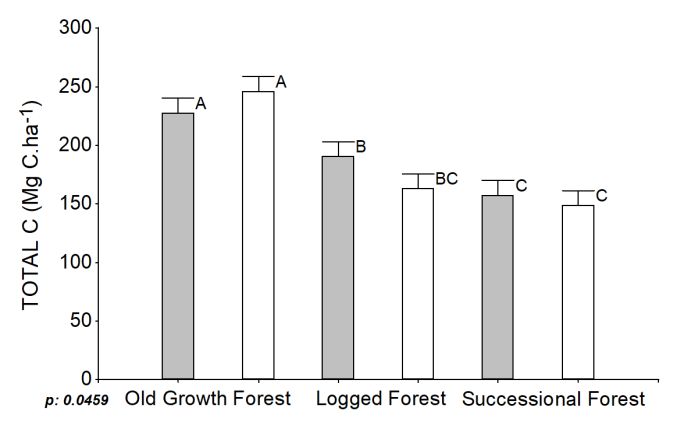
Forests 2019, 10, 442
x FOR PEER REVIEW 4 of 27
26
forest might have a negative side-effect causing higher pressure on nearby forest types. (4) Further
richness
on, we aimthanto logged
show how andlogged
successional forest in non-IFC
and successional forestslandscapes, hypothesizing
differ in amounts of carbon,potential
timber leakage
volume
effects. We assumed that the presence of IFC regimes on old-growth forest might
and species richness in comparison to old-growth forests in order to provide estimates of potential have a negative
side-effect
degradation causing
effects.higher
Finally,pressure on nearby
we hypothesize forest
that: types.
(5) the annual (4)rate
Further
of neton, we aim to before
deforestation show howand
logged and successional forests differ in amounts of carbon, timber volume
after the establishment of the Socio Bosque program was different in IFC and non-IFC landscapes and species richnessat
in comparison to old-growth forests in order to provide estimates of potential
a parish level, assuming that the IFC program contributed to reducing deforestation rates on the degradation effects.
Finally,
landscapewe hypothesize
level. In IFCthat: (5) the annual
landscapes rate of net deforestation
use restrictions only applied before and after the
to old-growth establishment
forests under theof
the Socio Bosque program was different in IFC and non-IFC landscapes at a parish
Socio Bosque program; while logged and successional forests were not part of the program and had level, assuming that
the IFC program
no land contributed to reducing deforestation rates on the landscape level. In IFC landscapes
use restrictions.
use restrictions only appliedof
The following sections to the
old-growth
manuscript forests
are under
divided theinSocio
four Bosque
parts: inprogram;
section 2while logged
we provide
and successional forests were not part of the program and had no land use restrictions.
contextual information related to the study area, to the IFC program and to logging procedures in
The following
the Central Amazonsections
region ofof Ecuador;
the manuscript are divided
in addition, in fourour
we describe parts:
dataincollection
Section 2methods
we provide
and
contextual information related to the study area, to the IFC program and
statistical analyses. In sections 3 and 4 we present the results and we discuss the implications to logging procedures
of the
in the Central
influence of IFCAmazon
on theregion of Ecuador;
degradation in addition,
of ecosystem we describe
services our data
and species collection
richness; as methods
well as,
and statistical Finally,
deforestation. analyses.in In Sections
section 5 we3 present
and 4 we thepresent
relevant the results andofwe
conclusions ourdiscuss
study. the implications
of the influence of IFC on the degradation of ecosystem services and species richness; as well as,
deforestation.
2. Materials and Finally, in Section 5 we present the relevant conclusions of our study.
Methods
2. Materials and Methods
2.1. Study Area
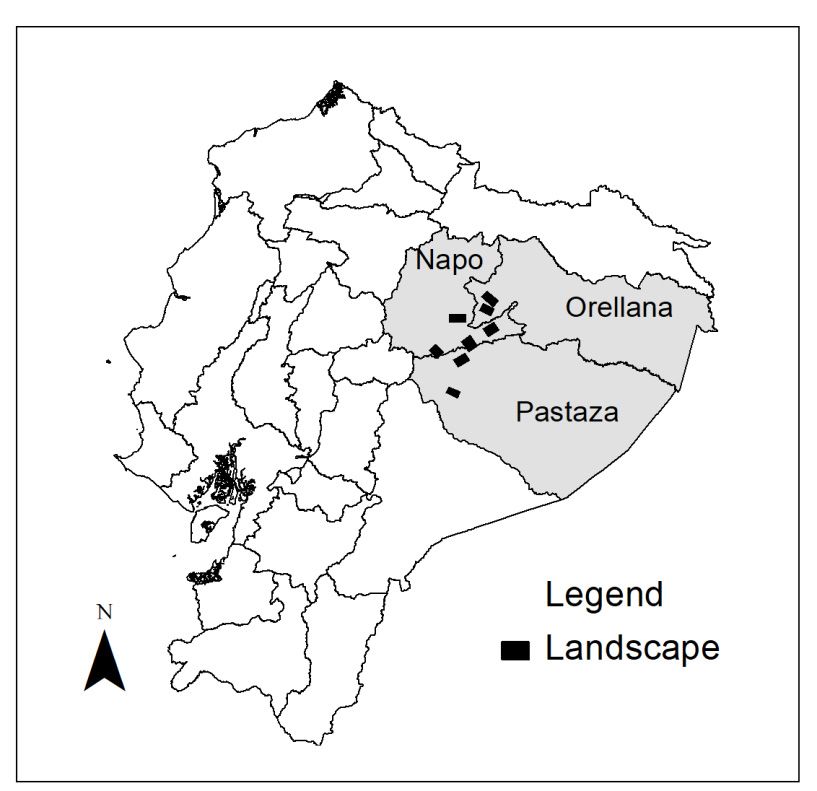
2.1. Study Area was conducted in the Central Amazon region of Ecuador, in the provinces of Pastaza,
The study
NapoTheand Orellana
study (Figure 1).inThe
was conducted theregion
CentralisAmazon
still characterized by highinforest
region of Ecuador, cover, representing
the provinces of Pastaza,
Napo and Orellana (Figure 1). The region is still characterized by high forest cover,a representing
almost 43% (5.5 M ha) of the total forest area of the country [71]. In addition, it hosts high level of
biodiversity
almost andMaha)
43% (5.5 species
of therichness of area
total forest up toof200 tree species
the country [71]. per hectare [72,73].
In addition, it hosts aHowever,
high levelthe
of
selected provinces also have interesting land use change dynamics which influence
biodiversity and a species richness of up to 200 tree species per hectare [72,73]. However, the forest cover loss,
selected
showing an
provinces annual
also net deforestation
have interesting land userate up todynamics
change −0.87% at a parish
which level forest
influence for thecover
period
loss,2014–2016
showing
[13,17,18].
an annual net deforestation rate up to −0.87% at a parish level for the period 2014–2016 [13,17,18].
Figure 1.
Figure Selected landscapes
1. Selected landscapes in
in Ecuadorian
Ecuadorian Amazon
Amazon region.
region.
2.2. Data Collection
2.2. Data Collection
2.2.1. Plot Design
2.2.1. Plot Design
Throughout the three provinces, eight landscapes (sites) of approximately 10 × 10 km were selected
Throughout the three provinces, eight landscapes (sites) of approximately 10 × 10 km were
(four IFC and four non-IFC landscapes); they were characterized by lowland forests between 335
selected (four IFC and four non-IFC landscapes); they were characterized by lowland forests
between 335 and 1100 m above sea level and were allocated in different parishes which represent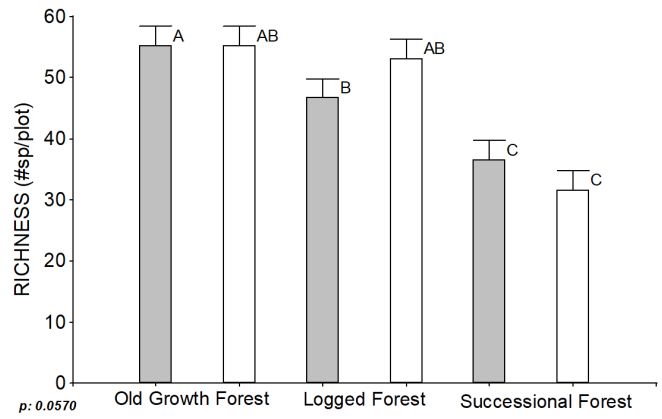
Forests 2019, 10, 442                                                                               5 of 26

and 1100 m above sea level and were allocated in different parishes which represent independent
administrative units. Since our aim was to evaluate whether IFC have an influence on forest degradation
and deforestation, we used a randomized block design. Each block was composed of one landscape
where Socio Bosque was stablished (hereafter referred to as IFC landscape) and one landscape without
this conservation program (hereafter called non-IFC landscape) (Figure 2a). The Socio Bosque program
protects approximately 1.6 M ha through collective and individual contracts, 64% of the conservation
area of the program is concentrated in the provinces of Pastaza, Napo and Orellana. Within the three
provinces 98.4% of the area conserved by Socio Bosque program is covered by collective contracts
(linked to communities) [68–70], which is related to the large extension of community forests in
the country (5 to 7.5 M ha of total forest) [49,50]. It is important to highlight that in IFC landscapes,
Socio Bosque has been implemented only in old-growth forests. Due to the fact that this is a voluntary
program there may be confounding variables that could influence our results. To address this
issue our blocked landscapes were randomly selected across the Central Amazon region in Ecuador.
Moreover, we controlled potential confounding variables (Tables A1 and A2) such as forest cover,
percentage of agricultural land, ecosystem type, altitude, soil type and demographic characteristics
(population density, distance from landscape to large cities and distance from households within
landscapes to forest). Through analysis of variance we confirmed that all those variables were similar
and comparable between landscapes within blocks (Table A3). As a result, the randomized block
design used in this study ensured that confounding variables were balanced across the treatment (IFC
landscapes/with Socio Bosque) and control (non-IFC landscapes/without Socio Bosque). Consequently,
the main difference of degradation effects on ecosystem services and species richness can be attributed
to the presence or absence of the IFC program and not to confounding variables.
      Each landscape included three forest types. The first type was old-growth forest, which is
a mature forest with low or not known human disturbance [74,75]. Secondly, logged forests were
considered, which were defined as areas with forest interventions carried out in the last two to four
years mainly under the Simplified Forest Harvesting Program (Spanish acronym PAFSI). The PAFSI
program is characterized by non-mechanized activities where timber is harvested under a selective
logging procedure; after the forest intervention, the area cannot be logged for the following five years.
According to records from the Ministry of Environment of Ecuador (MAE), this program is performed in
relatively small areas (11 to 24 ha on average) with average intensity of 11–24 m3 ha−1 (standing volume
approved by MAE) [76–79]. Logged forests with interventions older than four years were not included
in our study, this means that logged forests in our study are comparable in regard to time and that
intervention and differences in our target variables can therefore be attributed to differences in logging
intensity. The third type of forest was successional forest, resulting from abandoning previously cleared
forest (second growth forest) [74,80]. We randomly selected successional areas; this resulted in areas of
abandoned pastures between 12 and 28 years of recovery. In order to ensure that the comparison of
the successional forests in landscapes with IFC and without IFC is adequate, an analysis of variance
was carried out considering the age of the successional forests as a dependent variable, resulting in no
statistical differences between the ages of the successional forests near IFC and successional forest in
landscapes without the program (Table A4).
      In our IFC landscapes, only old-growth forests were under the Socio Bosque program and extractive
use is not allowed in these areas. In IFC landscapes, logged and successional forests are located
outside the Socio Bosque program and have no land use restrictions; therefore, can be used by their
owners. For simplicity and to facilitate the interpretation from now on, logged and successional forests
will be called as logged forests near IFC and successional forests near IFC. Old-growth forests in
non-IFC landscapes were communal areas with no current use that communities set aside for future
needs (e.g., to satisfy land demands from upcoming generations). These were mature forests reported
by local people during mapping exercises. However, the absence of previous human interventions in
these sites cannot be assured. In order to map the aforementioned forest types, we used secondary
information (e.g., land cover maps and PAFSIs records) available from the Ministry of Environment of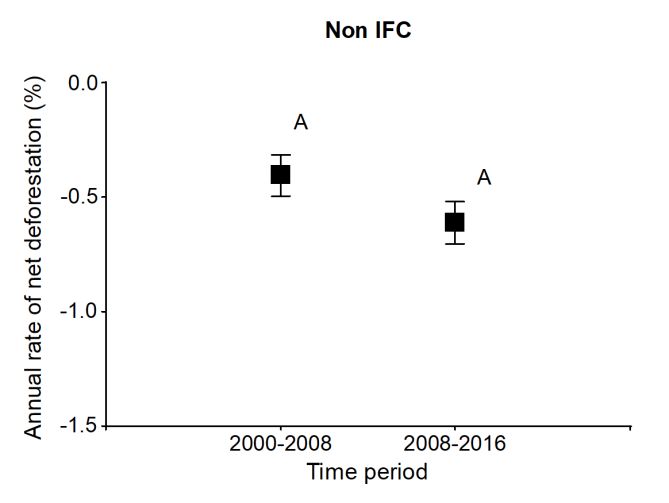
Forests 2019, 10, 442 6 of 26
Forests 2019, 10, x FOR PEER REVIEW 6 of 27
Ecuador (MAE), and mapping exercises during participatory community workshops performed in
each landscape.
records) available from the Ministry of Environment of Ecuador (MAE), and mapping exercises
Within landscapes, for each of the three forest strata, three plots were randomly selected using
during participatory community workshops performed in each landscape.
a grid of 200 m × 200 m in order to secure an adequate distribution [81,82]. This resulted in a total
Within landscapes, for each of the three forest strata, three plots were randomly selected using a
of 72 inventory plots: 24 for old-growth forest (12 in IFC and 12 in non-IFC landscapes), 24 in
grid of 200 m × 200 m in order to secure an adequate distribution [81,82]. This resulted in a total of 72
logged areas (12 near IFC old growth forest, 12 in non-IFC landscapes) and 24 in successional forest
inventory plots: 24 for old-growth forest (12 in IFC and 12 in non-IFC landscapes), 24 in logged areas
(12 near IFC old growth forest, 12 in non-IFC landscapes). Plots had a size of 40 m × 40 m (1600 m2 )
(12 near IFC old growth forest, 12 in non-IFC landscapes) and 24 in successional forest (12 near IFC
(Figure 2b). We kept a minimum distance of 100 m between plots and the forest border to avoid edge
old growth forest, 12 in non-IFC landscapes). Plots had a size of 40 m × 40 m (1600 m2) (Figure 2b).
effects due to anthropogenic activities like agriculture and roads, as well as natural influences like
We kept a minimum distance of 100 m between plots and the forest border to avoid edge effects due
rivers [83,84].
to anthropogenic activities like agriculture and roads, as well as natural influences like rivers [83,84].
(a) (b)
Figure2.2.(a)(a)
Figure Randomized
Randomized block
block design
design for thefor the selection
selection of the
of the study study
areas. areas.
(b) Plot (b)implemented
design Plot design
to assess information
implemented oninformation
to assess carbon stocks, total timber
on carbon volume
stocks, and species
total timber volumerichness.
and species richness.
We
We assessed
assessed aa varietyvariety ofofcarbon
carbonpools poolsforfor eacheach plot,
plot, including
including above-ground
above-ground carbon carbon in
in trees
trees (AGC ), above-ground carbon
(AGCtree), above-ground carbon in palms (AGCpalm), soil
tree in palms (AGC ), soil organic carbon (SOC)
organic carbon (SOC) at a depth of 30 cm
palm at a depth
of 30 cmand
[85–87] [85–87] and dead
dead organic organic
matter (DOM).matterDOM (DOM).
included DOM included
downed deaddowned
wood (DDW),dead woodstanding (DDW),
dead
standing
wood (SDW) deadand wood (SDW)
litter (L). A and litterconversion
carbon (L). A carbon conversion
factor of 0.47 was factor of 0.47
used [88].was used [88].
In
Inorder
ordertotoestimate
estimate total carbon
total carbon stocks, we first
stocks, calculated
we first biomass
calculated (Table (Table
biomass 1). Above-ground
1). Above-groundcarbon
(AGC)
carbonwas(AGC)obtained as the sum
was obtained asoftheAGCsum treeofand
AGC AGC and .AGC
tree palm AGCpalmtree. was
AGCcalculated applying applying
tree was calculated the equation the
from Chave et al. [89] (Table 1, Equation (1)). Diameter at breast height
equation from Chave et al. [89] (Table 1, Equation 1). Diameter at breast height (or above the (or above the buttresses, if present)
of individuals
buttresses, greater than
if present) 10 cm andgreater
of individuals species thanwood10density
cm andwerespecies used as input
wood parameter
density were usedfor this case.
as input
For the wood
parameter fordensity
this case. of tree species,
For the wood we used datasets
density from thewe
of tree species, Global
used Wood
datasets Density
from theDatabase
Global[90,91],
Wood
MAE [92] and Aguirre et al. [93]. For tree species not included in either
Density Database [90,91], MAE [92] and Aguirre et al. [93]. For tree species not included in either of these databases, we used of
the genus
these average.weFor
databases, a genus
used represented
the genus average. by For
a single individual,
a genus represented the average per family
by a single was used,
individual, the
and for those
average representing
per family was used, oneandfamily, mean
for those wood density
representing oneby plot was
family, meanconsidered.
wood density AGC plot was
bypalm was
determined based on Goodman et al. [94] taking into consideration
considered. AGCpalm was determined based on Goodman et al. [94] taking into consideration the the diameter at breast height (Table 1).
DDWatwas estimated 3
diameter breast heightby volume
(Table 1). and three wood density classes (sound: 0.45 gr/cm , intermediate:
0.34 gr/cm 3 and rotten: 0.25 gr/cm3 ) (Table 1, Equation (3)). Core samples for these classes were3
DDW was estimated by volume and three wood density classes (sound: 0.45 gr/cm ,
extracted in the forest and oven dried0.25 in the laboratory
3) (Tableto1,a Equation
constant 3). mass at 105 ◦ C, following
intermediate: 0.34 gr/cm 3 and rotten: gr/cm Core samples for these
Chave
classes[95]
wereand Williamson
extracted in theandforest
Wiemann and [96].
oven In the case
dried of SDW,
in the laboratory volume to and wood density
a constant mass atwas 105also
°C,
considered (Table 1, Equation (4)). For volume, a taper function
following Chave [95] and Williamson and Wiemann [96]. In the case of SDW, volume and wood was used to estimate the minimum
diameter
density was at aalso
known height (Table
considered (Table 1, 1, Equation
Equation4). (9)).
ForMean
volume,wood density
a taper of allwas
function living
used trees within
to estimate
the
the plot was used
minimum as proxy.
diameter All DDW
at a known and(Table
height SDW pieces on the
1, Equation 9).plots
Mean(40 × 40density
wood m) were of recorded.
all living
Litter samples
trees within thewere
plotcollected
was usedfrom two subplots
as proxy. All DDWofand × 0.5 pieces
0.5 SDW m eachon(Figure 2b).(40Dry
the plots × 40 mass was
m) were
calculated in the samples
recorded. Litter laboratory were[85–87].
collected from two subplots of 0.5 × 0.5 m each (Figure 2b). Dry mass
was calculated in the laboratory [85–87].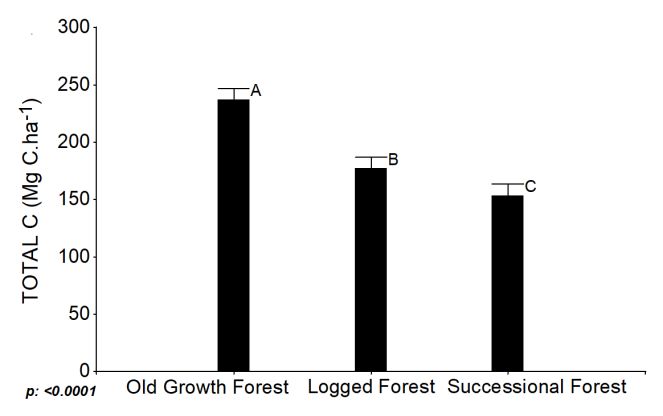
Forests 2019, 10, 442                                                                                                        7 of 26

                             Table 1. Equations for biomass and carbon stock calculation.

                                       Equation                                                  Reference
                      "                                                 #
         AGBtree = exp
                               −1.803−0.976E+0.9676h ln(ρ) i                 (1)             Chave et al. [89]
                            +2.673 ln(DBH) − 0.0299 ln(DBH)2
              AGBpalm = exp(− 3.3488 + (2.7483 × ln(DBH))                    (2)           Goodman et al. [94]
                                                                                          Pearson et al. [86]
                          DDWbiomass = V × ρclass                            (3)
                                                                                    Ravindranath and Ostwald [87]
                                                                                          Pearson et al. [86]
                             SDWbiomass = V × ρ                              (4)
                                                                                    Ravindranath and Ostwald [87]
                               L = dry matter                                (5)            Pearson et al. [86]
                                                                                          Pearson et al. [86]
                  DOM = DDWbiomass +SDWbiomass +L                            (6)
                                                                                    Ravindranath and Ostwald [87]
                                                                                          Pearson et al. [86]
                        SOC = BD × %CO × Deep                                (7)
                                                                                    Ravindranath and Ostwald [87]
                                        (D21 +D22 )                          (8)                  FAO [97]
                             V = π4 ×       2         ×l
                          dh = 1.59 × D × h−0.091                            (9)            Chamber et al. [98]
                                                                                          Pearson et al. [86]
                  Total Biomass = TAGB + DOM + SOC                          (10)
                                                                                    Ravindranath and Ostwald [87]
      AGBtree: Above-ground carbon in trees. AGBpalm: Above-ground carbon in palms. DDWbiomass: Downed dead wood.
      SDWbiomass : Standing dead wood. L: Litter. DOM: Dead organic matter. SOC: Soil organic carbon. TAGB: Total above
      ground biomass. V: Volume. WD: Wood density. D1: Diameter minimum. D2: Diameter maximum. l: Length.
      BD: Bulk density. %CO: Carbon organic content. DBH: Diameter at breast height. ρ: Wood density. E: environmental stress.
      h: height. Carbon conversion factor: 0.47 [88].

     SOC was estimated from bulk density, the concentration of organic carbon content (%), and the soil
depth (0–30 cm). Bulk density was calculated from the oven-dried weight of soil from a known volume
of sampled material at 105 ◦ C until reaching a constant weight. In this case, two samples were taken
from each of the plots (40 m × 40 m). For concentration of organic carbon content (0–30 cm horizon),
samples were taken at the corners of two subplots (Figure 2b). The wet digestion method of Walkley
and Black was used for this purpose [86,87,99].
     Total tree volume was calculated considering the DBH (≥10 cm), the total tree height and the form
factor (0.56) [97]. A total of 668 trees total heights were measured. Log–log linear regression considering
total height as the dependent variable and DBH as the independent variable provided the best fit to
estimate the height of the remaining trees (Equation (11)).

                             lnHt =0.786+0.5956(lnDBH) p < 0.0001; R2 = 0.69                                                     (11)

where:

      Ht = Total tree height;
      DBH = Diameter at breast height.

     We also determined the species richness (number of species of trees and palms per plot) [100,101]
and the importance value index (IVI) (Equation (12)) [100,102] since these variables can be interpreted
as an indicator of conservation, ecosystem function and, therefore, diversity-related ecosystem
services [23,25–28,103].
                                        IVI= DoR + DR + FR                                         (12)

where:

      IVI = Importance index value;
      DoR = Relative dominance;
Forests 2019, 10, 442                                                                               8 of 26

      DR = Relative density;
      FR = Relative frequency.

     The annual rate of net deforestation was calculated following the procedure specified by MAE [13]
comparing the forest area at parish level between 2000–2008 and 2008–2016 and using Equation (13).
We used land use and land cover maps from 2000, 2008 and 2016, which can be downloaded from
the platform of the interactive environmental map provided by the Ministry of Environment of Ecuador
(http://mapainteractivo.ambiente.gob.ec/portal/).
                                                                  1/(t2 − t1)
                                                             A2

                                 Deforestation rate =                            −1                  (13)
                                                             A1

where:

      A1 = Forest area at the beginning of the period;
      A2 = Forest area at the end of the period.

2.2.2. Statistical Analysis
     General mixed models were used to test the degradation effects. Analyses of variance (ANOVA LSD
Fisher p ≤ 0.05) were performed considering the fixed effects conservation regime (IFC and non-IFC),
forest type (old-growth, logged and succession forest) and their interaction. As random effects,
we considered block and landscape. Assumptions of normality and homoscedasticity were evaluated,
and criteria penalized likelihood (AIC–BIC) was applied to select the best model for AGC stocks
(Mg C·ha−1 ), DOM (Mg C·ha−1 ), SOC (Mg C·ha−1 ), total carbon stocks (Mg C·ha−1 ), timber volume
(m3 ha−1 ) and species richness. For AGC, DOM and timber volume outliers were excluded.
We considered those plots as outliers which had a value greater than twice the standard deviation
from the mean of each one of the forest types.
     With regard to the hypothesis of deforestation, ANOVA was performed to check for statistical
differences in annual rates of net deforestation between the periods 2000–2008 and 2008–2016 for IFC
and non-IFC, respectively. Normality and homoscedasticity assumptions were evaluated.
     In addition, cluster analysis taking into account species importance index value (IVI, a measure
of ecological importance) [100,102] was applied in order to evaluate the similarity of the forest types
between IFC and non-IFC landscapes.

3. Results

3.1. Degradation
      Regarding the hypothesis of ecosystem services’ degradation, we present analyses of variance for
carbon stocks, total tree volume and species richness comparing IFC vs. non-IFC landscapes; as well
as forest types and their interaction with and without IFC (Table 2, Figures 3 and 4). In addition,
we conducted a similarity analysis considering the IVI per species for the different forest types under
IFC and non-IFC (Figure 5).
      IFC vs. non-IFC landscapes did not show statistical effects on ecosystem services independently
from the forest type in terms of carbon stocks, timber volume and species richness (Table 2). This implies
that IFC-regime does not have a general effect on carbon stocks, timber volume and species richness in
forest landscapes across all forest types (old-growth, logged and successional forest).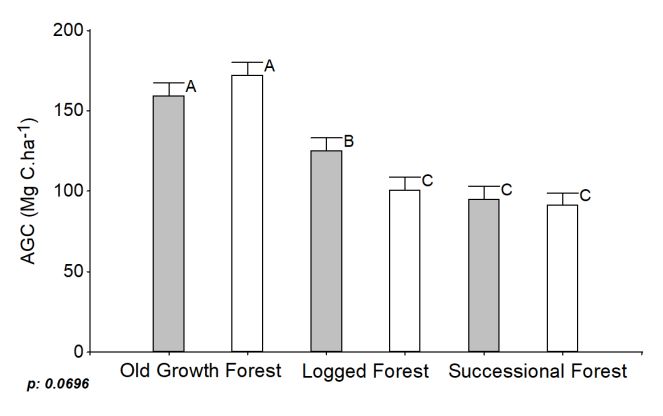
Forests 2019, 10, 442                                                                                                   9 of 26

                Table 2. Analysis of variance for carbon stocks, timber volume and species richness.

                                                                          Interaction: Forest Types
                                     IFC vs. non-IFC   Forest Type
        Dependent Variable                                            Influenced by IFC and Non-IFC                 n
                                                                                                           R2
                                        p-Value         p-Value                   p-Value
         AGC (Mg C·ha−1 )                0.4624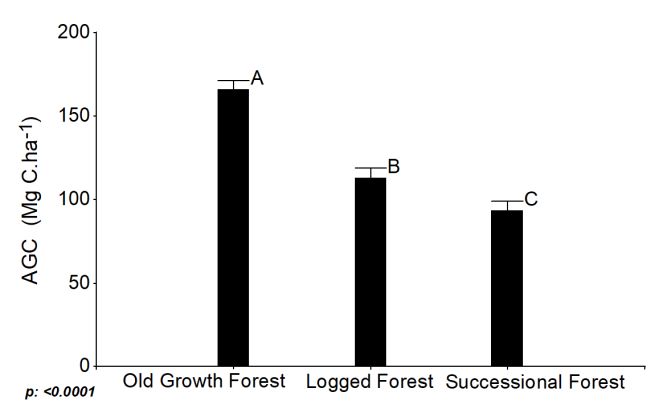
Forests 2019, 10, 442                                                                                    10 of 26

3.1.1. Influence of Forest Types on Ecosystem Services Degradation
      In this section, we analyze potential degradation effects of logging activities and the restoration
potential of successional forests in comparison to old-growth forests. The following results show
means by forest types independent of whether plots were located in IFC or non-IFC landscapes.
      There were statistical differences (p ≤ 0.05) between old-growth, logged and successional forest with
respect to AGC, total carbon, timber volume and species richness (Table 2). These results show that there
is a degradation of ecosystem services (carbon and volume) and species richness in the logged forest
when compared to old-growth forest (Figure 3). In the case of DOM, there is a significant difference
at p ≤ 0.10. SOC did not show significant differences (Table 2). Old-growth forest had the highest mean
of AGC with 166 Mg C·ha−1 , followed by logged forest with 113 Mg C·ha−1 and successional forest
with 93 Mg C·ha−1 .
      Total carbon stocks were about 237 Mg C·ha−1 for old-growth forest, 177 Mg C·ha−1 , for logged
forest and 153 Mg C·ha−1 in the successional forest. As expected, timber volume was higher in
the old-growth forest with 387 m3 ha−1 as well as statistically different from logged (265 m3 ha−1 )
and successional forest (228 m3 ha−1 ). DOM across the forest types was between 10–12 Mg C·ha−1 ,
whereas SOC for all forest types ranged between 48–53 Mg C·ha−1 (Table A6).
      Species richness differed between the evaluated forest types. We found an average of 55 species
per plot in old-growth forests, 50 species in logged forests and 34 species in successional forests
(Figure 3, Table A6).

3.1.2. Influence of IFC, Non-IFC and Forest Types on Ecosystem Services Degradation
     Here we present results of interactions between forest types and landscapes with and without
IFC. We analyze whether old-growth forests under IFC have higher amounts of carbon stocks, timber
volume and species richness than old-growth forest in non-IFC landscapes. Moreover, we present
information on logged and successional forests adjacent to old-growth forest under IFC and logged
and successional forest in non-IFC landscapes.
     Statistical differences were found for interactions between IFC landscapes, non-IFC landscapes
and forest types, namely for AGC (p ≤ 0.10), total carbon (p ≤ 0.05) and richness (p ≤ 0.10) (Table 2, Figure 4).
The mean AGC for old-growth forest under IFC was 159 Mg C·ha−1 , whereas for old-growth forest with
non-IFC it was 172 Mg C·ha−1 , showing no statistical difference between them. However, when comparing
AGC from different forest types, we found significant differences. An interesting result was that logged
forests near areas under IFC (Socio Bosque) had higher amounts of AGC (125 Mg C·ha−1 ) than logged
forest in non-IFC landscapes (101 Mg C·ha−1 ). Successional forest near IFC and in non-IFC landscapes
had the lowest AGC of between 95–91 Mg C·ha−1 . Old-growth forest total carbon stocks were similar,
having 228 Mg C·ha−1 for IFC and 246 Mg C·ha−1 for non-IFC landscapes; but, were much higher
compared to other forest types. Logged forest near IFC stored 190 Mg C·ha−1 and 163 Mg C·ha−1 in
non-IFC areas; the successional forest had 157 Mg C·ha−1 and 149 Mg C·ha−1 respectively (Figure 4;
Table A7).
     No significant differences were found for species richness of old-growth forest under IFC
and non-IFC (55 species each per plot), and logged forests in non-IFC landscapes (53 species).
In contrast, species richness of logged forests near IFC (46 species) were statistically different from
old-growth forests nearby. Surprisingly, these significances did not occur between logged forests
and old-growth forests in non-IFC landscapes. Successional forests had the lowest number of species
per plot with 36 species in IFC and 31 species in non-IFC landscapes (Figure 4).
Successional forest near IFC and in non-IFC landscapes had the lowest AGC of between 95–91 Mg
C·ha−1. Old-growth forest total carbon stocks were similar, having 228 Mg C·ha−1 for IFC and 246 Mg
C·ha−1 for non-IFC landscapes; but, were much higher compared to other forest types. Logged forest
ForestsIFC
near 10, 442 190 Mg C·ha−1 and 163 Mg C·ha−1 in non-IFC areas; the successional forest had
2019,stored 11 of
15726
Mg C·ha−1 and 149 Mg C·ha−1 respectively (Figure 4; Table A7).
(a) (b)
(c)
Figure
Figure 4.
4. Analysis
Analysisof ofvariance
varianceofofcarbon
carbonstocks
stocksand
andrichness
richnessconsidering
consideringthetheinteraction
interactionbetween
betweenIFC,
IFC,
non-IFC landscapes and
non-IFC landscapes andforest
foresttypes.
types.(a)(a) AGC:
AGC: Above-ground
Above-ground carbon
carbon stocks.
stocks. (b) Total
(b) Total C:carbon
C: Total Total
carbon
stocks. stocks. (c) Species
(c) Species richness.
richness. Different
Different letters letters indicate
indicate significant
significant differences
differences fromother
from each each (p
other (p
≤ 0.05
≤or0.05 or p ≤ 0.10). Grey bars represent landscapes with IFC and white bars non-IFC
p ≤ 0.10). Grey bars represent landscapes with IFC and white bars non-IFC landscapes. Within IFC landscapes.
Within IFC landscapes
landscapes only old
only old growth growth
forest forest
is under is under
Socio Bosque Socio Bosque
program andprogram
extractiveand extractive
use use is
is not allowed,
not allowed,
in the case ofin the case
logged andof logged andforests
successional successional forests
there are there are and
no restrictions no restrictions
can be usedand can be
by their used
owners.
by their owners.
Cluster analysis for species composition separated successional forests (near IFC and non-IFC)
fromNo old-growth
significant anddifferences
logged forests.
wereOld-growth
found for forests
speciesunder IFC and
richness non-IFC landscapes
of old-growth wereIFC
forest under grouped
and
non-IFC
together,(55 species each
suggesting thatper plot),compositions
species and logged forests inareas
in these non-IFC landscapes (53
are comparable. species).
Species In contrast,
composition in
species richness
logged forests in of logged
areas nearforests nearwas
IFC forests IFCmore
(46 species) were
similar to statistically
old-growth different
forests than tofrom old-growth
logged forests in
forests
non-IFCnearby.
landscapes,Surprisingly, these
implying that
Forests 2019, 10, x FOR PEER REVIEW
significances
there may be lessdid not occur
degradation between
if logging loggedout
is carried forests and
near12areas
of 27
old-growth forests5).
under IFC (Figure in non-IFC landscapes. Successional forests had the lowest number of species per
plot with 36 species in IFC and 31 species in non-IFC landscapes (Figure 4).
Cluster analysis for species composition separated successional forests (near IFC and non-IFC)
from old-growth and logged forests. Old-growth forests under IFC and non-IFC landscapes were
grouped together, suggesting that species compositions in these areas are comparable. Species
composition in logged forests in areas near IFC forests was more similar to old-growth forests than
to logged forests in non-IFC landscapes, implying that there may be less degradation if logging is
carried out near areas under IFC (Figure 5).
Figure 5. Similarity analysis based on species important index value (IVI) for different forest types in
IFC landscapes
Figure andanalysis
5. Similarity non-IFCbased
landscapes.
on species important index value (IVI) for different forest types in
IFC landscapes and non-IFC landscapes.
3.2. Deforestation
The annual rate of net deforestation at the parish level was statistically reduced in parishes
where IFC was implemented. Before the implementation of the program, parishes with IFC had an
average annual rate of net deforestation of −1.09% (2000–2008). This rate decreased to −0.18% (2008–Figure 5. Similarity analysis based on species important index value (IVI) for different forest types in
IFC landscapes and non-IFC landscapes.
Forests 2019, 10, 442 12 of 26
3.2. Deforestation
3.2. Deforestation
The annual rate of net deforestation at the parish level was statistically reduced in parishes
where IFC
The was implemented.
annual Before theatimplementation
rate of net deforestation the parish level of
wasthe program, reduced
statistically parishesinwith IFC had
parishes wherean
average annual rate of net deforestation of −1.09% (2000–2008). This rate decreased
IFC was implemented. Before the implementation of the program, parishes with IFC had an average to −0.18% (2008–
2016)
annualafter
rate the implementation
of net deforestation of of−1.09%
the IFC(2000–2008).
program (Figure 6a).decreased
This rate In contrast, in parishes
to −0.18% withoutafter
(2008–2016) IFC
(Figure 6b), annual of
the implementation deforestation was lower
the IFC program (Figurein6a).
the In
beginning
contrast, and increased
in parishes from IFC
without −0.41% for 6b),
(Figure the
period 2000–2008, to −0.61% for 2008–2016. The increase was, however, not significant.
annual deforestation was lower in the beginning and increased from −0.41% for the period 2000–2008,
to −0.61% for 2008–2016. The increase was, however, not significant.
(a) (b)
Figure 6.6. Analysis
Analysisofof
variance of annual
variance net deforestation
of annual rate (%)rate
net deforestation at the
(%)parish level.
at the (a) IFC
parish landscapes
level. (a) IFC
(p = 0.04). (b) Non-IFC landscapes (p = 0.15). Different letters indicate significant differences
landscapes (p = 0.04). (b) Non-IFC landscapes (p = 0.15). Different letters indicate significant from each
other (p ≤ 0.05).
differences from each other (p ≤ 0.05).
4. Discussion
4. Discussion
4.1. Degradation
4.1. Degradation
4.1.1. Influence of Forest Types on Ecosystem Services Degradation
4.1.1. Influence of Forest Types on Ecosystem Services Degradation
The main difference found in our study can be attributed to forest types. Mean total carbon stocks
The
(AGC + DOM main+difference found in forests
SOC) in old-growth our study
werecan
237 be
Mgattributed
C·ha−1 , andtofor
forest
AGCtypes. Mean
they were 166total
Mg carbon
C·ha−1 .
stocks (AGC + DOM + SOC) in old-growth forests were 237 Mg C·ha −1, and for AGC they were 166
These results are consistent with other studies of tropical lowland forests in the Pan-Amazon
Mg C·ha
region
−1. These results are consistent with other studies of tropical lowland forests in the
which ranged between 175 Mg C·ha−1 and 238 Mg C·ha−1 for total carbon stocks [2,4,104]
Pan-Amazon region
and among 120 Mg C·ha which−1 ranged
and 165between
Mg C·ha175 MgAGC
−1 for C·ha−1[2,4,105,106].
and 238 Mg With
C·ha−1regard
for total
to carbon stocks
provisioning
[2,4,104] and among 120 Mg C·ha −1 and 165 Mg C·ha−1 for AGC [2,4,105,106]. With regard to
3 −1
services, we estimate an average timber volume in old-growth forests of 387 m ha , which is within
the range of other studies from the Pan-Amazon region reporting between 240 m3 ha−1 and 425 m3
ha−1 [14,34]. Therefore, our results for carbon stocks and volume suggest that the sampled old-growth
forests have an adequate conservation status, with carbon and volume levels similar to the ones
reported for undisturbed old-growth forest or with minimal impact [104–106].
As reported by Hososuma et al. [30] and Kissinger et al. [31], 70% of the forest degradation effects
in Latin America are related to timber extraction, which is consequently the main degradation driver.
Our analyses also revealed that logged forests show signs of degradation due to timber extraction,
which were reflected in 25% less total carbon stocks, 32% less AGC and timber volume compared with
old-growth forests. Logged areas followed mainly the criteria of PAFSI program (selective logging);
in this sense, harvest intensity and the extent of damage caused by intervention are important factors
that influence the forest’s ability to recover and maintain ecological functions [34,107]. According to
Sist and Nascimiento [34], only 50% of the commercial stand volume would recover after 30 years,
under reduced impact logging (RIL) techniques with an average extraction intensity of 6 trees ha−1
and 20% of damage caused by harvest. West et al. [35] compare above-ground biomass (AGB) ofForests 2019, 10, 442 13 of 26
conventional logging (CL) and RIL and show that plots under CL lose 26% of AGB while those with RIL
lose 17%. They conclude that after 16 years RIL plots recovered by 100% (2.8 Mg ha−1 year); whereas
CL plots only recovered 77% (0.5 Mg ha−1 year). While Rutishauser et al. [36], mention that a forest
may require 12, 43 or 75 years of recovery if logging activities reduce 10%, 25% or 50% of the ACG.
Logging activities cause considerable degradation in forest stands and can produce significant
changes in the structure. In addition, in the Amazon region logging activities could contribute to
land use change [108]. Forest degradation and deforestation are important factors in our study area
since in Ecuador 63% of the volume containing high-quality timber that can be logged legally is
located in Amazon lowland forests [109]. Therefore, the Amazon lowland forest is attractive for timber
harvesting. Considering the substantial degradation of these ecosystems due to logging, it is important
to prevent further illegal timber extraction in logged areas. In addition, a cascading use (Cascading use:
“is a strategy to use raw materials such as timber or other biomass, in chronologically sequential steps
as long, often and efficiently as possible for materials and only to recover energy from them at the end of
the product life cycle. It is the intention that the increased cascading use of wood will contribute to more
resource efficiency and consequently reduce pressure on the environment” [110] ) of timber products
can be an adequate strategy for reducing further carbon losses in order to increase forest resource
efficiency and reduce pressure on forest ecosystems [110]. Since cascading use is a strategy that requires
efficiency within industries for processing timber after harvesting, any planning of large-scale use of
Amazon timber potential has to be accompanied by strict control of logging intensities and recovery
periods as well as the setting up of an efficient timber processing infrastructure. As a complement
thereto, the conservation of old-growth forest areas through IFC programs (Socio Bosque) is necessary.
This is particularly relevant to the area that was studied, since Pastaza, Napo and Orellana contain
about 5.5 M ha of forest, corresponding to 43% of the total forest area of the country [71,109].
Successional forests in our study areas were between 12 and 28 years. In comparison to
the other forest types, they had the lowest values of AGC, total carbon, timber volume and species
richness. They were statistically different from old-growth and logged forests (except for volume in
logged forest) (Figure 3). According to our results, successional forest could hold between 56–64%
of AGC (Mg C·ha−1 ), total carbon stocks (Mg C·ha−1 ) and timber volume (m3 ha−1 ) in contrast to
old-growth forest, and among 82% to 87% in comparison to logged forest. Despite these low amounts
(93 Mg C·ha−1 average) compared with the other forest types, it is important to highlight the potential
of naturally regenerated forests for landscape restoration and carbon sequestration [111], especially in
landscapes where logging is carried out in order to compensate carbon losses from forest interventions.
For example, if we consider that in the provinces of Pastaza, Napo and Orellana a total of 3597
ha year−1 of forest have been regenerated between 2014 and 2016 [13], the potential sequestered
carbon for the next three decades would be 334,521 Mg C considering the AGC average of our data
(successional forest between 12 to 28 years). It is noteworthy to mention that our successional forests
can sequester around 71 Mg C·ha−1 in AGC between 12 and 16 years; while after 25 and 28 years
of regeneration this amount reaches 140 Mg C·ha−1 . Therefore, the potential for carbon stock can
be higher if those forests reach a middle age of regeneration, with most likely additional positive
side-effects on biodiversity indicators.
Based on our results, successional forests contribute to compensate carbon losses from logging on
a landscape scale. Moreover, they can serve as an effective tool for biological corridors to improve
connectivity; and in addition, provide goods and services to local communities helping with livelihoods
diversification [74,112].
4.1.2. Influence of IFC, Non-IFC and Forest Types on Ecosystem Services Degradation
We found that, in the Ecuadorian Amazon lowland forest, there was no difference in carbon
stocks, timber volume and species richness between old-growth forest with IFC and old-growth
forest in non-IFC landscapes. Old-growth forests in IFC and non-IFC showed no degradation of
ecosystem services since they had carbon stocks and volume contents similar to mature forests withForests 2019, 10, 442 14 of 26
adequate conservation in other Amazonian forests [104–106]. As we note in the previous sections,
there is a lack of studies analyzing the effects of conservation policies and degradation in Ecuador.
In our extensive search, we found the work of Mohebalian and Aguilar [55] who detected degradation
effects in areas not enrolled in the Socio Bosque program, but the differences were statistically not
significant. They also found a higher presence of timber species in Socio Bosque areas than in other
areas, which indicates harvesting activities in non-Socio Bosque lands. However is important to point
out that this study was performed in private landholdings, whereas our study was performed in
communal lands. In the Central Amazon region (Pastaza, Napo and Orellana) 98% of Socio Bosque
program area is under communal tenure, which highlights the importance of our results.
Other studies in the tropics mention that areas without a conservation strategy could have positive
outcomes for community forestry compared to state protection. When people have ownership or
management rights over ecosystem resources, they will genuinely support conservation objectives in
comparison to a situation of restricted access [52,113,114]. Yet, such community protection will only
function if embedded in a context where utilization of resources is possible, e.g., in nearby designated
areas [115,116]. Bray et al. [51], Naughton-Treves et al. [117] and Porter et al. [53] found that forest loss
on communal lands was lower or equal to that in protected areas. Despite the fact that old-growth
forests in non-IFC landscapes do not show evidence of degradation, it is important to consider that
the Ecuadorian Central Amazon currently has a low population density [118], and households still
manage a considerable amount of land, so they resort to their own forests in order to satisfy the demand
for forest products. Nevertheless, as soon as the resources in private lands are depleted, it is likely
that the remaining forests, especially those without any protection status, will be more vulnerable.
In that context, IFC can become more important for maintaining forest integrity, especially when forest
pressure increases in the future. Given the fact that currently there are still areas of old-growth forest
which have not been protected, the importance of policies aiming to conserve or otherwise manage
forests sustainably is significant. Such policies can take the form of programs like Socio Bosque,
governmental or communal protected areas, or any other strategy.
Our study identified an unexpected positive effect for logged forests near IFC forests, as these forests
had higher AGC stocks (125 Mg C·ha−1 ) than logged forests in non-IFC landscapes (101 Mg C·ha−1 ).
When these forests were compared with old-growth forests, we estimated a reduction in AGC of 21% in
logged forests near IFC and 41% in logged forests in non-IFC landscapes. Such findings are surprising
and suggest that the presence of a conservation program in the area has effects on how logging is
performed. The adequate conservation of old-growth forest, as well as less degradation of logged
forests on IFC landscapes, can be related to a greater presence of governmental representatives who
are negotiating, monitoring and controlling IFC areas. Consequently, people living close to those
areas could feel more pressure to follow the forest regulations, since there is a higher probability of
being caught breaking the law than in non-IFC landscapes, where government presence could be more
scarce. Jones et al. [54] reported that people living around Socio Bosque areas perceive more restrictions
and a fast response by environmental authorities when illegal activity occurs. Our results show that is
possible to balance and integrate forest conservation and timber production [66]. Nevertheless, it is
necessary to implement improved forest management procedures, like reduced impact logging (RIL),
which may result in lower forest degradation. Runting et al. [66] show that extreme land use sharing
or extreme land use sparing in forest landscapes is not necessarily the optimal solution. At landscape
level, mixed land use with both approaches is probably the better option to guarantee conservation of
ecosystem services [66,67].
Species richness is an important attribute that can influence ecosystems services and also reflects
anthropogenic impact. Studies show a positive relationship between species richness and ecosystem
services [23,25–28]. The number of species per plot that we found in old-growth forests under IFC
versus non-IFC was the same. Cluster analyses showed that they were also similar in composition,
suggesting that there is no species loss when we compare old-growth forests across landscapes.
In contrast, Shahabuddin and Rao [114] mentioned that areas without conservation strategies “fallYou can also read