WARKWORTH NORTH PROPOSED PLAN CHANGE ECONOMIC ASSESSMENT - TURNSTONE CAPITAL LTD
←
→
Page content transcription
If your browser does not render page correctly, please read the page content below
WARKWORTH NORTH PROPOSED PLAN
CHANGE
ECONOMIC ASSESSMENT

REPORT PREPARED FOR

TURNSTONE CAPITAL LTD

MCDERMOTT CONSULTANTS

January 2019
WARKWORTH NORTH PROPOSED PLAN CHANGE
Economic Assessment
Report Prepared for
Turnstone Capital Ltd

McDermott Consultants Ltd
January 2019

The information in this report is presented in good faith using the best information available to us at the time of
preparation. It is provided on the basis that McDermott Consultants Ltd and its associates are not liable to any
person or organisation for any damage or loss which may occur in relation to that person or organisation taking or
not acting (as the case may be) in respect of any statement, information, or advice conveyed within this report.
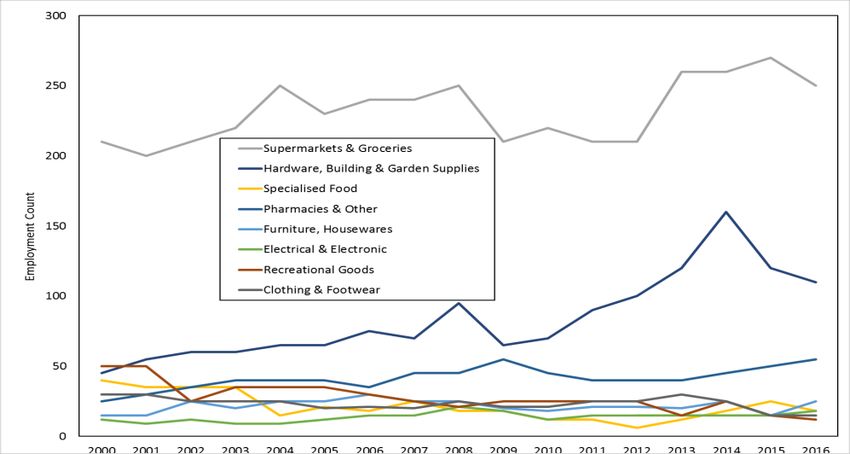
TABLE OF CONTENTS

Summary

1.   Introduction ................................................................................................................................... 1
     1.1     The Proposal................................................................................................................... 1
     1.2     Policy Guidance ........................................................................................................... 1
             Overs and Unders ......................................................................................................... 3
             Emphasis on Housing .................................................................................................... 4
     1.3     Draft Report Review ..................................................................................................... 4
             More industrial land?.................................................................................................... 4
             The need for a local centre ........................................................................................ 5
     1.4     Objectives and Outline ............................................................................................... 5
2.   Population and Labour Force Prospects ................................................................................. 6
     2.1     Methodology ................................................................................................................. 6
             Residential Land ............................................................................................................ 6
             Employment Land ........................................................................................................ 6
     2.2     Development Potential and Prospects .................................................................... 8
             Population and Workforce potential ........................................................................ 8
             Housing ........................................................................................................................... 8
     2.3     The Contribution of the Proposed Plan Change .................................................. 10
3.   Employment Performance and Prospects ............................................................................ 11
     3.1     Approach and Data .................................................................................................. 11
     3.2     Employment Performance ........................................................................................ 12
             Caveat .......................................................................................................................... 12
             The Labour Market, 2001-2018 ................................................................................. 12
             Employment Structure ............................................................................................... 14
     3.3     Employment Prospects .............................................................................................. 16
             Population Driven Growth......................................................................................... 16
             Industry .......................................................................................................................... 16
             Business Services.......................................................................................................... 19
             Retailing ........................................................................................................................ 20
             The Impact of Modern Logistics ............................................................................... 21
             Public and Personal Services .................................................................................... 22
     3.4     The Future of Work ...................................................................................................... 23
     3.5     The Significance of Decentralisation ...................................................................... 24
     3.6     Occupations ................................................................................................................ 25
4.   Proposed Zones........................................................................................................................... 26
     4.1     Overview ...................................................................................................................... 26
     4.2     Employment Zones in the Proposed Warkworth North PPC ............................... 26
             The Light Industry Zone .............................................................................................. 27
     4.3     Employment Capacity .............................................................................................. 27
5.   The Impact on Other Centres .................................................................................................. 29
     5.1     Zoned Business Land .................................................................................................. 29
     5.2     Warkworth Town Centre ............................................................................................ 29
     5.3     Woodcocks Rd and Surrounds ................................................................................. 30
     5.4     The Grange .................................................................................................................. 31
     5.5     Conclusion ................................................................................................................... 31

     Attachment 1: Demographic Assumptions
     Attachment 2: Retail Spending and Floorspace
List of Tables
Table 1. Changing Expectations – Future Urban Land Supply Strategy, 2015 & 2017 2
Table 2. Development Potential of the Future Urban Zone 8
Table 3. Population and Workforce Prospects, Warkworth North PPC Area 10
Table 4. Indicative Employment Capacity, Warkworth North Business Land 28
Table 5. Warkworth Business Land by Area 29
List of Figures
Figure 1 Warkworth North, Proposed Plan Change Zones 1
Figure 2 Labour Supply Based Employment Land Need Estimation 7
Figure 3 Labour Demand Based Employment Land Estimation 7
Figure 4 : Projected Annual Dwelling Completions Based on Past Consents 9
Figure 5 : Alternative Projections of New Dwelling Completions 9
Figure 6 : Employment Trends, Principal Sectors Warkworth 2001-2018 12
Figure 7 Changing Age Distribution of Residents, 2001-2016 13
Figure 8 Employment Shares, Principal Sectors, Warkworth & Auckland
2001 and 2018 15
Figure 9 Population and Employment Growth Cycle 16
Figure 10 Industrial Employment, 2001-2018 17
Figure 11 Significant Manufacturing Activities, 2000-2016 18
Figure 12 Employment Shifts, Business Sub-sectors Warkworth 2001-2018 19
Figure 13 Employment Shifts, Retail Sub-sectors Warkworth 2001-2018 20
Figure 14 Employment Shifts, Public Services Sub-sectors Warkworth 2001-2018 22
Figure 15 Charting Decentralisation in Auckland, 2001-2016 24
Figure 16 Comparing Residents’ Occupations, Auckland & Warkworth,
2006 & 2013 25SUMMARY
Purpose
This report describes economic growth expectations for Warkworth North and implications of
the land use provisions in the Warkworth North Proposed Plan Change (PPC).
Section 1 outlines the background to the assessment (Section 1). Subsequent sections
address the following objectives:
• Assess the additional population and labour supply associated with the PPC (Section 2);
• Identify commercial and business development prospects in Warkworth to inform the
zoning of business land (Section 3);
• Identify appropriate land uses for the PPC area (Section 4);
• Assess the possible impact of proposed land use in the PPC on existing and future
investment and employment in other centres in Warkworth (Section 5).
Findings
The policy setting for this exercise include the provisions of the Auckland Unitary Plan
(Operative in Part) ("Unitary Plan") and the underlying Future Urban Land Supply Strategy
adopted in July 2017 ("FULSS"); the response by Council officers to a draft of the economic
assessment (11 May 2017); and the written response by Council consultants, Market
Economics Ltd (report dated 16 June 2017).
This material and additional reports dealing with Warkworth (and Hibiscus Coast) business
land needs suggest that the policy context at the time of preparation was partial and fluid,
but has firmed up through the period of report drafting and completion.
Dwellings, Population, and Labour Supply
Section 2 identifies potential Warkworth population and workforce numbers and estimates
the contribution that the Warkworth North Proposed Plan Change (PPC) will make to them.
Warkworth North (2,300) and Northeast (1,600) districts have joint capacity for around 3,900
dwellings, a population of around 10,600, and a labour force that could reach 5,000 people.
Analysis of dwelling consents issued over the recent past demonstrates the practical
challenges of achieving these figures within the Unitary Plan timeframe. Water supply
constraints cited in the 2015 FULSS have been resolved with the commissioning of the new
Sanderson Rd treatment plant. Watercare also has the consents in place for a sewage line to
an upgraded Snells Beach treatment plant any wastewater constraints will resolved in if not
before 2022. Finally, the Northern Motorway extension will be completed in 2022. These
developments ensure alignment of the PPC with the necessary infrastructure investment.
Consequently, the Warkworth North Proposed Plan Change can be seen as making an early
and significant start towards the Unitary Plan development targets target, helping the
Council to achieve its housing objectives for Warkworth. At capacity it could add between
1,000 and 1,100 dwellings (45% or thereabouts of the total for Warkworth North), increase the
local population by over 3,000 and labour supply by 1,300 people.
Summary: Warkworth North Proposed Plan Change: Economic Assessment 1Labour Demand Section 3 reviews recent trends to inform expectations for the quantum and nature of future employment. It emphasises the likelihood of significant change and uncertainty over future sectors and work practices. Heavy reliance on industry in Warkworth relative to services is a notable feature of the town’s economy. Specialist manufacturing, construction, population- related services, and logistics activity are likely to sustain reasonable demand for industrial land and labour, although it is unrealistic to attempt to quantify future employment growth. At the same time, there is considerable uncertainty over the character of future work. The disruptions associated with the application of new technologies for production, distribution, and fulfilment of final demand goods raise questions over the rate and character of growth in traditional retailing, the prospects for significant logistics investment, and the likelihood of decentralisation of personal services. These uncertainties and the changing nature of work and workplaces call for a degree of flexibility in employment-related land use. So, too, does the evidence of some imbalance in the Warkworth economy, with its emphasis on manufacturing, and limited (and declining) public service employment (including health, social care, and education). The vocational mix of residents also shows a bias away from managerial and professional employment, reflected in the dearth of business services. While these structural attributes may be typical of a rural service centre, the Unitary Plan is based on transformation of Warkworth to a significant satellite town. The PPC is a significant step in this transformation. Ideally, land zoned for employment in the vicinity will be able to accommodate the greater diversity of investment and occupations locally that this implies. Business Land Section 4 outlines the areas in the PPC set aside for employment activity. These are the outcomes of consultation with the Auckland Council Policy Team and its preference for the Light Industry Zone for employment over the General Business Zone proposed initially. The inference is that the team favours an emphasis on secondary (quasi-industrial) rather than tertiary (quasi-commercial) services as the basis for new employment. The 13ha Light Industrial Zone in the PPC will accommodate additional manufacturing, yard-based activities, logistics (storage, warehousing, and fulfilment), trade supplies, and ancillary office and retail activity. It will also allow a limited set of consumer and community activities (as discretionary uses). It should cater for 400 jobs (or thereabouts) when developed. Provision is also made for a 3,000m2 Neighbourhood Centre to meet local household needs for convenience and community goods and services. This could cater for the bulk of convenience needs of residents of the PPC area, depending on site coverage (40% appears appropriate in the first instance). It would accommodate perhaps 20 jobs. Given the growth of local specialty shops, neighbourhood child care centres, and increased hospitality (both eat -in food facilities and motel-style accommodation) in suburban areas there is likely to be a need for additional neighbourhood activities in the surrounding Residential – Mixed Housing Urban Zone. These would be subject to discretionary planning requirements. This could account for another 20 or so jobs in the future. Summary: Warkworth North Proposed Plan Change: Economic Assessment 2
The employment capacity of the two PPC zones, the adjoining General Business Zone (held
by Foodstuffs NZ), and the 64ha Light Industrial Zone east of the Great North Road/SH1 and
north of the Showgrounds (Warkworth Northeast) is around 2,600 jobs jobs. This is more than
enough for the PPC development (which would increase labour supply by around 1,300
jobs), but insufficient for Warkworth North (around 2,900 in total), assuming that the Council
favours at least nominal self-sufficiency of employment. Council officers suggested a ratio of
1:1 (capacity for one more job for every additional worker) in discussion (11 May 2017).

However, these provisions for future employment do not address the issue of “fit”, They cater
primarily for industrial employment and for limited retail jobs whereas much future investment
and consequently many future jobs will be in a variety of service sectors. Not only does it
make sense to provide adequate land for a variety of non-industrial activities but large share
of the future labour supply in Warkworth North (and Northeast with perhaps 1,900 additional
resident workers in due course) can be expected to be better suited or qualified to non-
industrial employment. It is assumed that the additional capacity required and the
imbalance in the current zoning of employment land will be addressed elsewhere in the
Auckland Council’s Structure Plan for Warkworth.

Impacts on Other Centres

Section 5 considers the impacts on other centres of the land use provisions of the PPC. It
concludes that the Town Centre is likely to benefit from the additional household and
personal demand for goods and services associated with the increase in population with no
adverse impacts.

The employment land provided for in the Warkworth North PPC simply increases Light
Industrial Zone capacity. Hopefully, it will contribute to employment growth and
diversification based on its location. It is not expected to adversely impact on business zones
further to the south – Woodcocks-Mansel Drive and The Grange. Indeed, the demand
associated with the implementation of the PPC area may provide the certainty needed for
the Kowhai Falls centre to progress, while development of the area will increase demand for
the goods and services currently provided in and around Woodcocks Rd.

In conclusion, the PPC offers the opportunity to take a significant step forward towards the
housing aspirations contained in the FULSS and facilitated by the Unitary Plan. Through its
focus on housing and a range of housing types, it will increase demand for local businesses in
existing centres. It should boost the development of the existing light industrial land in
Warkworth North while requiring that the forthcoming Council initiated Warkworth structure
plan allows for the need for further business-zoned land that facilitates diverse investment
and employment.

Summary: Warkworth North Proposed Plan Change: Economic Assessment                            3
1. INTRODUCTION
1.1 The Proposal
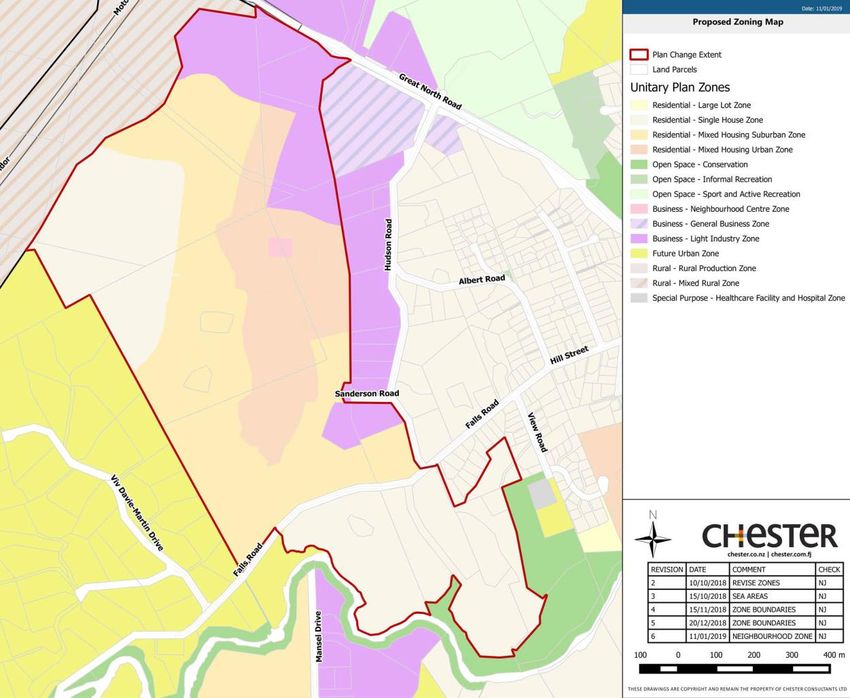
The Warkworth North Proposed Plan Change (PPC) aims to zone 99ha lying east to west
between State Highway 1 and Falls Rd and north to south between the Northern Motorway
extension and Hudson Rd for residential (Single House, Mixed Housing Suburban, and Mixed
Housing Urban) and business use (a Neighbourhood Centre and an extension of the existing
Hudson Road Light Industry Zone).
Figure 1 Warkworth North, Proposed Plan Change Zones
This configuration has been determined through several iterations of technical reports, public
consultation, including with affected land owners (including two earlier versions of this
assessment); and consultation with the Council’s Policy Team.
1.2 Policy Guidance
The original Future Urban Land Supply Strategy (FULSS, Auckland Council, 2015) provided for
3,200-3,800 dwellings and 3,270 jobs, including a Local Centre, on 432ha to be rezoned in
Warkworth North and Northeast (p.20). The PPC accounts for 23% of the combined
Warkworth North and North East Future Urban Zone (FUZ). Warkworth North is scheduled to
be “development ready” by 2022, the completion year for the Northern Motorway extension.
Warkworth North Proposed Plan Change: Economic Assessment 1Following the adoption by Auckland Council of the Independent Hearings Panel's
Recommendations on the Proposed Auckland Unitary Plan, 64ha of land identified as Future
Urban in the notified Plan was zoned to Light Industry. This lies east of SH1 and north of the
existing built-up area, between the Warkworth Showgrounds and Goatley Rd
The Auckland Future Urban Land Supply Strategy revision (July 2017) confirmed the provisions
for Warkworth in the original 2015 FULSS document. However, unlike that version and the
draft “refresh” placed before the Auckland Council Planning Committee in March 2017, the
July 2017 version stated that there would be no centres in Warkworth North or North East
(Table 1). Subsequent officer correspondence allowed that this did not rule out the prospect
for neighbourhood centres in greenfield sites.
The major changes made after consideration of the Draft Refresh by the Planning
Committee were (1) settling on population projections towards the higher end of the range
in the earlier document; (2) the elimination of commercial centres and associated
employment from the North and North East; and (3) a delay in developing the North East
until later in the period.
Table 1. Changing Expectations – Future Urban Land Supply Strategy, 2015 & 2017
Document Area Timing Area (ha) Dwellings Centres Jobs
Warkworth North
Future Urban land Supply 2022-2026 3,200-3,800 Local 3,270
& Northeast
Strategy, Adopted 12
3,500-4,100 Neighbour-
November 2015* Warkworth South 2027-2031 770
hood
Share of 15,000 over 14
Warkworth North 2012-2017 69 (Business)
Auckland localities
None
Auckland Future Urban Land Warkworth North 2018-2022 Share of 29,000 over 5
2,300
Supply Strategy, July 2017 324 Auckland localities
Warkworth South 2028-2031 493 3,700 Local
Share of 32,000 over 10
Warkworth North
2033-2037 None Auckland localities
East 192 1,600
* Also Draft Refresh, Agenda Item 11, Auckland Council Planning Committee, 7 March 2017
Nevertheless, the 2015 FULSS states that:
“Employment is a key consideration for Warkworth given its distance from Auckland. It is
anticipated that Warkworth will need around 115 hectares of additional business land to
provide for local employment opportunities. Small local and neighbourhood centres will
also be required in the newly established greenfield areas but should be of a scale that
retains the integrity and character of the current Warkworth centre” (p.21).
Supporting Growth: Delivering Transport Networks (Auckland Council, Auckland Transport,
and NZTA, 2017) suggested Potential Business as the indicative use for all the land covered by
the Warkworth North PPC. A new Local Centre is flagged as a possibility for a site 4km south
of the town centre, towards the edge of the proposed southern expansion. This expansion
was originally scheduled to be ready by 2032 but this was revised in 2017 to 2028.
The view that much of the area of the PPC should be committed to Industrial zoning was
advanced by Council officers at a workshop meeting in May 2017 to discuss a draft structure
plan document for Warkworth North. The implications of that commitment and the removal
of centres in the July 2017 FULSS Refresh was that the existing industrial land (zoned and
occupied) in the area might be complemented by additional Light Industry zoning. However,
here are several arguments for limiting the amount required:
Warkworth North Proposed Plan Change: Economic Assessment 2• How will the proposed dwelling numbers be achieved if much of Warkworth North is
committed to long-term industrial use, reducing the capacity for housing?
• Where will most of the industrial labour force live if much more of the Warkworth North FUZ
is zoned for light industry?
• How much industrial land and employment might Warkworth realistically support in the
foreseeable future?
• How competitive might additional light industrial land in the PPC area be compared with
other parts of Warkworth or the Hibiscus Coast given its contour, physical character,
drainage needs, and the engineering and mitigation costs of developing and servicing
large building platforms?1
• What would be the effect on housing affordability and urban form of effectively freezing
the use of much of Warkworth North for an indefinite period by zoning more of it for
industrial use and reducing what is available for residential use?2
• How will an expanding commercial sector associated with proposed household and
business growth be accommodated if no provision is made for a local centre?
O VERS AND U NDERS
The Policy Team’s initial expectation of extensive additional industrial land has been
tempered through discussion with the Turnstone Capital planners. Given the limited physical
suitability of the PPC area for industrial uses, the need to provide for the ambitious new
dwelling targets in the FUZ, and the extensive area already available for light industry in the
wider Warkworth area, it was agreed that a further 13ha of Business-Light Industry should be
provided under the PPC, rather than an extended general business zone as first mooted.
The additional land lies between the existing industry on Hudson Rd and the Great North
Road (existing SH1). The latter frontage abuts the Business-General Business Zone held by
Foodstuffs Ltd in the south and the new motorway corridor in the north. The northern sector
lies across the great North Rd from the Business – Light Industry Zone established on the
recommendation of the Unitary Plan Hearings Panel.
At the same time, the Council Policy Team required that provision in an earlier version of the
PPC for a Local Centre was inappropriate, and that alternative areas have been identified
outside the PPC area to be notified for public input when the Draft Structure Plan is opened
for consultation in February 2019. As a result, the provision of 3.7ha for commercial
employment suggested for PPC area in a draft of this assessment has been replaced with a
0.3m site for a Neighbourhood Centre. This increases the PPC area available for dwellings.
1 Auckland Council has since issued background documents (December 2017) as a first step in rezoning 607ha
for industry in Silverdale-Dairy Flat (https://www.aucklandcouncil.govt.nz/have-your-say/topics-you-can-
have-your-say-on/structure-planning-silverdale-west-dairy-flat-business-area/Pages/structure-planning-
documents.aspx). The website states that “business land” refers to an “area that generally needs large flat
sites, is not able to locate in centres, includes light industry(sic)”. Much of the PPC area is moderate to steep
hill country.
2 Given that according to the 2013 Census around 10% of Warkworth’s resident workforce already commutes
to the Hibiscus Coast (and 11% to points beyond) and given the reduced commuting time associated with
the pending motorway extension, it is likely that this land will accommodate a significant share of the town’s
labour force growth, reducing local demand for industrial land in Warkworth.
Warkworth North Proposed Plan Change: Economic Assessment 3E MPH ASI S ON H O USING
As a result of these adjustments, the PPC provides capacity for between 1,000 and 1,100
dwellings, or around 45% of the total targeted for Warkworth North and 22% of the total
targeted for Warkworth North and Northeast.
While bound in the south and east by light industrial land the PPC area has been designed
as, a substantial, coherent residential neighbourhood. The bulk of the employment needs of
its households will be met off-site, ideally elsewhere in the north of Warkworth.
Given this character, it can be seen as satisfying the key requirements outlined in of the June
2017 Mayoral Housing Task Force Report (Auckland Council), advocating a commitment to
“building new housing at a faster pace and larger scale, providing a wider choice of
affordable homes, ranging from traditional standalone homes to terraced homes and
midrise apartments, and ensuring a quality built environment”.
The rest of this report outlines some of the demographic and economic considerations
brought to bear in the preparation of the PPC, and the consequences of the decisions
reached.
1.3 Draft Report Review
A draft economic assessment was reviewed by Market Economics Consulting ("M. E
Consulting") in June 2017. 3 The main issue raised was lack of consideration of the timing of
development and potential over-commitment of land to employment activity. This
contradicted Council officers’ concerns about whether a large part of the area should be
committed to additional industrial land. 4
M ORE INDUSTRI AL LAND ?
The M.E. Consulting position was reversed in a subsequent draft report to Auckland Council.
While acknowledging that currently zoned capacity will be enough to meet demand “for
many years” it argues that it would be prudent to introduce another 55ha "given the
difficulties with finding more industrial land once other activities are in place”. This would see
around 30% of the Warkworth North FULSS area committed to industrial activity.
The lack of alignment in these reports left the issue of likely or preferred outcomes for the
Warkworth North FUZ unresolved, reinforcing the conclusion of the June review report for the
Warkworth North PPC, that it is important to consider the development timeframe to avoid
over-committing land to uses which are subject to considerable uncertainty.
As it is, analysis of slope and drainage constraints shows that most of the land subject to the
Warkworth North PPC is unsuitable for business development, having slopes exceeding 12.5%.
The exceptions are the existing Light Industry and surrounding areas adjacent to Hudson Rd
and the area adjacent to the Great North Rd. Development of the rest of the area would
encounter significant site preparation constraints and costs, including the extensive cut and
fill operations necessary to accommodate industrial and medium or large-scale commercial
users, and the requisite infrastructure. The latter includes roads to enable significant
commercial vehicle movements. Issues of access also largely rule out the ridges and
3 M.E. Consulting (16 June 2017) “Stubbs Farm Estate Plan Change: Economic Review”, Auckland Council
4 M.E. Consulting (16 October 2017) “Warkworth Business Land Assessment”, prepared for Auckland Council
Warkworth North Proposed Plan Change: Economic Assessment 4terraces for employment activity within areas where there are more modest slopes. This is
quite apart from the negative impact on design and character that their development for
employment would have.
The costs of preparing and servicing these areas would act against their development.
Zoning them for Light Industry, then, would potentially suppress investment better located
elsewhere and effectively “quarantine” the land in question. Suppressed development
would incur significant opportunity costs by way of deferred use. If industry was to go ahead
on this land, the productivity of investment would be reduced by higher development costs.
T HE NEED FOR A LOCAL CENTRE
Questions were also raised in the M.E. Consultants review over whether Warkworth North is an
appropriate location for a new local centre, the potential impacts on other centres, and
inadequate assessment of the demand for and supply of land for light industry.
The response in the current report is to highlight the importance of achieving a balance
between residential and employment development as the most appropriate way to address
issues of timing and scale. This also calls for balance in the growth of employment types. A
proposal in the original assessment for a Local Centre in the PPC area and extension of the
General Business zone adjacent to State Highway 1 (SH1) has been rejected by the Council’s
Policy Team. It is assumed here that the need for a centre providing local services to the
additional households that will not be provided in a Light Industry Zone and that offers the
opportunity for diversification of local employment opportunities will be pursued elsewhere in
Warkworth North.
1.4 Objectives and Outline
Given this fluid and contradictory policy background, the matters used to inform the
allocation and development of land proposed in Warkworth North PPC include achieving an
appropriate scale, mix, and location of residential and business land; aligning the rate of
residential and employment land development; and establishing a probable mix of business
and community investment within the physical constraints associated with the area.
The objectives of this economic assessment are to:
• Assess the additional labour supply likely to be associated with residential development in
Warkworth North (see Section 2);
• Consider likely future commercial and business development trends in Warkworth and
the types of activity that can be expected to locate on business land in this locality
(Section3);
• Assist in identifying land uses for the PPC area in accord with the Unitary Plan (Section 4);
• Assess the possible impact of proposed land use in the PPC on existing and future
investment and employment in other centres in Warkworth (Section 5).
Warkworth North Proposed Plan Change: Economic Assessment 52. POPULATION AND LABOUR FORCE PROSPECTS Section 3.1 outlines the approaches used to establish employment land requirements, one based on first estimating the supply of labour and the other on estimating labour demand. Section 3.2 takes the FULSS dwelling capacity estimates and uses these to calculate indicative population and workforce figures when Warkworth is fully developed (i.e., when the FUZ is completely settled). No attempt is made to establish the likely timing, although the schedule of “development-ready” districts provides some indication of sequencing. Warkworth North is intended to be “first off the blocks”, with capacity for 2,300 dwellings scheduled to be development-ready by 2022. The Warkworth North PPC will account for a substantial share of this and offers the opportunity to initiate the development. Section 3.3 provides range estimates of the potential resident population and workforce for the area. 2.1 Methodology R ESIDENTI AL L AND The requirement for residential land arises from increased household numbers, with their character influencing housing preferences (dwelling type and size, preferred locality, proximity to employment and schools, etc), job and service needs. The extent to which these needs are met will be influenced by the location, character, and cost of available capacity, and associated services and amenities. Even with knowledge of these things forecasts of housing demand are inevitably approximate, especially given that household numbers are influenced by often-unpredictable migration movements and cyclical economic conditions. In recent times, excessive land and housing costs have suppressed demand. The Unitary Plan provisions for Warkworth and the Warkworth North Proposed Plan Changes are part of a wider commitment to increasing the availability of housing to help meet this suppressed demand. Acknowledging the uncertainty around the timing of demand, we adopt Auckland Council estimates of the capacity of the FUZ as a reference point for residential population growth in Warkworth and its districts (North, South, and North East). E MPLOYMENT L AND Two approaches may be taken to estimating reemployment land requirements. The first approach assumes that it is appropriate to plan sufficient land to employ the labour supply resulting from population growth (Figure 2). Auckland Council officers endorsed this approach in discussions, favouring a 1:1 ratio in the growth of local jobs to local workers to guide business land capacity. (The ratio for Warkworth is already 1;1.6, given its role as a sub- regional employment centre). The labour supply approach is adopted for assessment of future business land needs here. We apply the 1:1 ratio to the additional labour supply associated with population growth, assuming non-residents travelling into Warkworth for work balance residents travelling out. Warkworth North Proposed Plan Change: Economic Assessment 6
Figure 2 Labour Supply Based Employment Land Need Estimation

The second approach draws on a knowledge of markets, competition, and productivity
movements to project labour demand by sector (Figure 3). The resulting employment figures
are used to estimate the land required based on representative employment densities for
different sectors.

              Figure 3 Labour Demand Based Employment Land Estimation

The demand-led approach results in zoning based on a projected mix of production,
distribution, and consumption activities. This report examines the structure of the Warkworth
economy without seeking to quantify the potential demand for labour which would be
speculative at best. Instead, the broad activity mix that might be expected in Warkworth is
considered in Section 3 and used to inform the identification of the business zones
appropriate to accommodate employment growth in Warkworth North.

Warkworth North Proposed Plan Change: Economic Assessment                                       7
2.2 Development Potential and Prospects
P OPULATI ON AND W ORKFORCE POTENTI AL
Unitary Plan expectations for Warkworth are set out in Table 15 of the 2013 Capacity for
Growth Study (Proposed Auckland Unitary Plan), confirmed in the Future Land Supply
Strategy (2015 and 2017). Sequencing is set out in the Attachment F of the 2017 FULSS
Refresh, which proposes 7,500 additional dwellings, with preparation times as follows:
North 2018 - 2022, 2,300 dwellings;
South 2028 – 2032, 3,700 dwellings
North East 2033 - 2037 1,600 dwellings
Average dwelling occupancy of 2.4 to 2.8 persons (which will vary depending on household
composition) suggests 18,000 to 21,000 more residents if the projected construction and
uptake of dwellings is achieved. This would lift the 2018 population of 4,900 five-fold, to
25,000, depending on the average household size (Table 1). 5
Assuming a participation rate of around 40% among new residents, between 6,500 and 8,400
people will be added to Warkworth’s workforce at full development, with 2,100 to 2,700
potentially resident in Warkworth North. As the first area proposed for development and
located close to the new motorway intersection and between the western and eastern
collector roads, capacity in Warkworth North could be fully absorbed within 20 years of the
commencement of development.
Table 2. Development Potential of the Future Urban Zone
People Labour Force Land Required
Sector Timing Dwellings
Low High Low High Low High
North 2018-2022 2,300 5,500 6,400 2,300 2,900 70 90
South 2028-2032 3,700 8,900 10,400 3,700 4,600 110 140
North East 2033-2037 1,500 3,600 4,200 1,500 1,900 40 60
TOTAL 7,500 18,000 21,000 7,500 9,400 220 290
H OUSING
Total residential capacity as estimated in Table 2 will not be absorbed in the planning
timeframe without a major boost to construction capacity. While gains are likely to be lumpy
as the industry upscales, we have explored trends based on past annual dwelling consent
figures.
Two rates of expansion have been extrapolated, the first based on the 16-year trend from
2001 to 2017 (June years). This was a period of steady growth, subject to cyclical downturns,
and so projects modest gains (Figure 4). The second, based on the ten years 2008 to 2017
incorporates recovery from the Global Financial Crisis. Despite a 2013 downturn, it supports
the prospect of a boost in capacity (to around 160 units a year by 2027 and 210 by 2037).
If instead growth in output continues at the long-term rate (16 year) rate, the 2027 figure
would be 85 dwellings a year and around 110 by 2037. In fact, the higher projection appears
credible, given that consent numbers jumped from 24 in 2011 to 92 in 2017 (June years).
5 The grounds for the demographic assumptions adopted in this report are outlined in Attachment
Warkworth North Proposed Plan Change: Economic Assessment 8Figure 4: Projected Annual Dwelling Completions Based on Past Consents
If the rate of capacity growth returns to the long-term average, an additional 2,300 dwellings
(the number scheduled for Warkworth North) would not be completed until around 2045, 30
years from commencement (Figure 5). The planned addition to Warkworth housing would
not occur in full within forty years. However, if capacity increases in line with the last ten-
years growth trends, the 2,300 dwelling target for Warkworth North could be completed by
2035 and the capacity for the entire FUZ by 2058 (35 years). Of course, completion of
development in Warkworth North would be longer than suggested as some of the house
building will continue to take place elsewhere in Warkworth6.
Figure 5 : Alternative Projections of New Dwelling Completions
6 In addition, new houses will continue to be built between the base year for comparisons (2018) and the base
year for projections (2022), when the first tranche of development-ready land is anticipated.
Warkworth North Proposed Plan Change: Economic Assessment 9Given the lumpy nature of capacity changes in the building sector more rapid acceleration
may be possible. In Pokeno, for example, consents increased four-fold over five years to
June 2017 following the 2010 Plan Change. This sort of lift would see -planned capacity is to in
Warkworth developed within forty-years. The Warkworth North PPC would ensure the first
tranche of development-ready sections is in place for a 2022 commencement.
2.3 The Contribution of the Proposed Plan Change
Indicative household numbers in the PPC area based on estimated development capacity
within have been estimated as follows (all figures are approximate):
Single Housing: 35ha gross; 23.4ha net (developable); 8 dwellings/ha; 190 dwellings,
Mixed Suburban: 33ha gross; 21ha net (developable); 25 dwellings/ha; 525 dwellings,
Mixed Urban: 17ha gross; 11.4 net (developable); 30 dwellings/ha; 340 dwellings
These figures suggest 1,055 dwellings in total. While only indicative, a range between 1,000
and 1,100 is a reasonable working estimate of the potential the PPC offers, accounting for
around 45% of total dwellings targeted for Warkworth North (Table 2, above).
In order to estimate the number of residents associated with this capacity, it is assumed that
• Dwellings in the Single Housing Zone will provide three or four bedrooms, catering for
families, with average occupancy of 3.5 persons;
• Average occupancy in the Mixed Housing Zone will be 3 persons;
• Average occupancy in the more intensive Mixed Urban Zone will be 2.5 persons.
Participation rates are similarly aligned with dwelling types. Smaller households in smaller
dwellings are generally held to have higher participation rates than those in larger houses
where there are more likely to be children and more adults not in formal employment.
The result is an average household size of 2.9 persons across the development and a
participation rate of 42%. The participation rate is below the 45% recorded in the 2013 Census
(Attachment 1) but consistent with the likely demographic profile associated with the
planned housing types in the PPC.
Applying these assumptions to the 1,055 dwelling estimate suggests a resident population in
excess of 3,000 and growth in the labour supply of 1,300 or so workforce in the PPC area
Table 3). The former figure provides a basis for estimating demand for resident services and
amenities. The latter figure provides grounds for estimating local employment (and thus
investment) requirements if a substantial share of the workforce is to be employed locally.
Table 3. Population and Workforce Prospects, Warkworth North PPC Area
Single Mixed Mixed
Total
House Suburban Urban
Dwellings 190 525 340 1,055
Population 670 1,580 850 3,100
Workforce 270 660 380 1,310
Assumptions
Occupa ncy 3.5 3 2.5 2.9
Pa rti ci pa ti on 40% 42% 45% 42%
Warkworth North Proposed Plan Change: Economic Assessment 103. EMPLOYMENT PERFORMANCE AND PROSPECTS
This section explores the prospects for growth in labour demand (the second approach,
Figure 3 above). The aim is to identify the sorts of activities that will occupy business land in
Warkworth generally, and in Warkworth North, in and around the PPC area. It
Section 4.1 describes the approach adopted, based on the analysis of a range of sectors
defined mainly in terms of their land use requirements.7 Section 4.2 examines the recent
(post-2000) performance of these sectors and the structure of the economy using
employment data as an economic indicator.
Section 4.3 examines them more closely (by sub-sector) to consider their prospects in
Warkworth. This section highlights considerable uncertainty among some sectors, offset by
the likely positive impact of population growth and the continuing positive performance of
some of the established medium-sized manufacturing businesses.
Sections 4.4, 4.5, and 4.6 consider other non-structural factors likely to influence job
prospects: the changing nature of work, the tendency towards decentralisation around
major cities, and the occupational mix of Warkworth residents and the issue of shifting the
balance towards more managerial and especially professional workers to sustain growth. 8
3.1 Approach and Data
The focus is on employment as an indicator of activity and as a target outcome. Recent
development has been reviewed using Business Demography data. Job counts (which do
not distinguish between part-time and full-time employment) are approximate only. For
present purposes they are rounded to the nearest 10 (or 100). Also, analysing employment
by sector or subsector in a small urban centre within a single Census Area Unit means totals
do not always correspond due to confidentiality requirements and the rounding conventions.
Analysis is conducted in terms of functional sectors derived from aggregating 2006 ANZSIC
categories related broadly to their land use requirements. The sectors are defined as follows:
• Industry includes manufacturing, construction, utilities, and logistics, activities that favour
access to key transport and service infrastructure and separation from housing;
• Logistics: includes transport, storage, warehousing, and wholesaling, activities that access
key transport networks and nodes and have relatively extensive land requirements;
• Retailing; favours locations accessible to households;
• Hospitality; includes accommodation and food and beverage services, and favours
higher order commercial centres, proximity to visitor attractions, and transport nodes
although with a growing presence in suburban locations;
• Business services are primarily office-based functions: finance and insurance, rental, hiring
and real estate services, professional, scientific and technical services, and business
administration). They may serve final (household and government) or intermediate
(business) demand and favour commercial centres which offer access to both local
demand and the local labour market, industrial areas (when they are closely associated
with production and distribution functions), and suburban office parks and precincts;
7 The data has been updated from earlier versions of this assessment, from 2016 to 2018
8 These sections are general in nature, pointing to the need for a progressive approach to future employment
opportunities. While an earlier version of this assessment proposed a Local Centre in the PPC to contribute
to this need, it is accepted that such a centre may be located elsewhere.
Warkworth North Proposed Plan Change: Economic Assessment 11• Public services include public administration, public order and safety and regulation,
education, health and medical, social and care services. They favour a variety of
locations in centres as well as suburban sites (including schools);
• Personal services include arts, recreation, and the diverse “Other Services” category,
again favouring a range of centres and suburban locations.
3.2 Employment Performance
C AVE AT
Recent developments in Warkworth underscore the difficulty of forecasting the labour
market by methods that rely on extrapolating past change by sector. Cyclical fluctuations
and unanticipated changes, as well as the small scale of the local economy, make
meaningful extrapolation problematic. This is especially so in a setting that will be
transformed demographically and economically as the FUZ is developed.
Four- to five-fold population growth will have a far-reaching impact on demand for goods,
services, and labour supply. Strong hinterland growth will add to that as nearby settlements
intensify and populations expand (Matakana, Algies Bay, Leigh, Snells Beach, Omaha) and
as Intensification and lifestyle settlement will expand in rural areas. Given the potential for
transformation, extrapolating trends from existing activity is a potentially misleading way of
describing the possible structure, character and volume of future jobs.
T HE L ABOUR M ARKET , 2001-2018
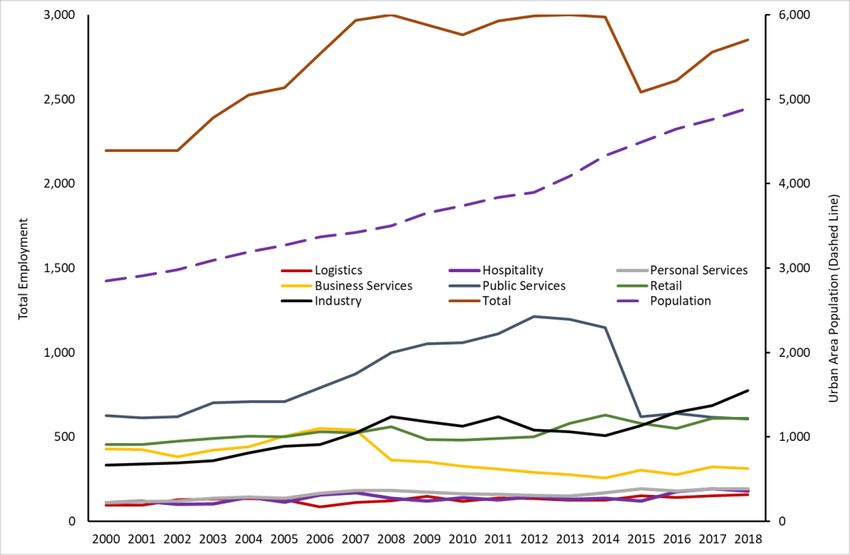
Job numbers between February 2000 and 2009 grew by 3.8% a year. However, from 2009 to
2015 they fell by 1.9% per year. Recovery since has restored jobs to 2010 levels, although still
short of the 2009 figure (Figure 6). The overall result is a 34% gain (650 jobs) over 18 years.
Figure 6: Employment Trends, Principal Sectors Warkworth 2001-2018
Source: Business Demography, Statistics NZ (sourced January 2018)
Warkworth North Proposed Plan Change: Economic Assessment 12This compares with 72% population growth in Warkworth Urban Area, from 2,850 (in June
2000) to an estimated 4,890 in 2018 (Statistics NZ). 9
Strong population growth and stalled employment suggest lower participation or increased
outbound commuting, or both. The former might reflect a bias towards older people among
arrivals. The latter suggests that investment has been constrained in Warkworth.
Figure 7 Changing Age Distribution of Residents, 2001-2016
From 2001 to 2016 the over-64
age group increased by 95%
compared with the working
age’s 47% (Figure 7). This
suggests that retirement
settlement has played a
significant part in population
growth. However, a 59% lift in
child numbers indicates strong
family-age growth. Within the
workforce, the under 40s grew
by 49%, the over 40s’ by 45%,
suggesting a more youthful
workforce.
It can be concluded that while
ageing may have lowered
average participation, recent
growth must have boosted
outbound commuting among working residents.
Incidentally, the Census indicates consistently low unemployment in Warkworth. This suggests
that local investment may have been constrained, in part, by a tight labour market.
Unemployment Rates at Census
2001 2006 2013
Warkworth 2.5% 2.0% 3.1%
Auckland 5.3% 3.8% 5.4%
Finally, the employment slowdown may reflect limited land availability. Evidence to the
Unitary Plan Independent Hearings Panel indicated only 14ha vacant industrial land and 7ha
vacant commercial land in 2016. 10 Limited areas mean limited options for new investment,
something that the Hearings Panel for the Unitary Plan responded to. The Council
subsequently zoned 64ha of land light industry in northeast Warkworth.
9 It is noteable that the Warkworth workforce is substantial relative to resident population,
indicating the reach of its labour catchment into the surrounding rural areas and small towns.
10 Statement by Philip McDermott to Auckland Unitary Plan Independent Hearings Panel, 10 February 2016,
Attachment “Assessment of Warkworth’s Industrial Land Requirements”, Attachment
Warkworth North Proposed Plan Change: Economic Assessment 13E MPLOYMENT S TRUCTURE Figure 8 compares shifts in sectors’ individual shares of employment resulting from their different rates of growth compared with equivalent shifts across Auckland. This shows that the Warkworth slowdown was largely a function of the fall in public sector jobs and a dip in retail employment. Growth was modest in other sectors, while industry has become more important since 2014, both as a result of a recovery in the sector (Figure 7) and because of the failure of other sectors to expand in keeping with population growth or with expansion of those sectors elsewhere in Auckland. The changes taking place in Warkworth generally differ from Auckland-wide changes, albeit from a much smaller employment base. Industrial growth, for example, contrasts with a fall across Auckland. On the other hand, business services shrank in Warkworth despite their growth across the city. And while the public sector was a significant driver of growth for Auckland, it grew very little in Warkworth (although it still accounts for a significant share of the town’s total employment). One implication of this structure is that with a much larger population base there is likely to be renewed growth in public services (which include education, health, and social services) and in personal services. If industrial growth is sustained at recent levels, there should also be a recovery and expansion of business services. Indeed, if the Council’s expectations for Warkworth growth are fulfilled the employment profile is likely shift towards that of Auckland as a whole, with significantly increased service activity. Warkworth North Proposed Plan Change: Economic Assessment 14
Figure 8 Employment Shares, Principal Sectors, Warkworth & Auckland
                                      2001 and 2018

      Source: Business Demography, Statistics NZ (January 2018)

Warkworth North Proposed Plan Change: Economic Assessment                     15
3.3 Employment Prospects
Employment shifts over the past 15 years offer few clues about what may happen in the next
10 years, let alone over a planning horizon of 30 or 40 years. This is especially true in a small,
local economy facing substantial growth. Recent reversals in service sectors make
forecasting difficult, while changes in the prevailing business models in others, like retailing
and logistics, lead to speculation more than projection. In addition, the scale of the lift in
residential and industrial land planned will alter the local investment dynamic.
Given these realities, the outlook is discussed below in terms of prospects and possibilities
rather than projections and probabilities.
P OPULATI ON D RIVEN G ROWTH
One near-certainty is that future employment will be heavily influenced by population
growth, highlighting the importance of integrated planning (Figure 9). Residential zoning is a
prerequisite to employment growth. As new housing is occupied, so the attractiveness of
Warkworth for investment will increase. With investment come more jobs, in turn lifting the
town’s appeal to households.
Figure 9 Population and Employment Growth Cycle
The process is cumulative: as an area
grows, a bigger workforce should see
more diverse economic activity. Businesses
expand to meet additional demand while
new investment can take place to utilise a
growing range and depth of resident skills.
Determining land requirements for
employment, then, is not a matter of
simply extrapolating jobs in existing sectors,
but requires an understanding of their
individual prospects, and their consequent
quantitative and qualitative workforce
and site needs. It should also provide for
the emergence of totally new activities.
These matters are addressed by sector
below.
I NDUSTRY
Industrial employment includes construction activity, manufacturing, logistics (transport,
storage, and warehousing), and utility services.
Construction employment was cyclical between 2000 and 2018. A strong post 2014 upturn
has seen it contribute 27% to net employment growth over the period (Figure 10). By 2018 it
matched the previous cyclical peak (2007). Construction and civil engineering can be
expected to continue to grow in response to planned residential expansion, a prospect
Warkworth North Proposed Plan Change: Economic Assessment 16reinforced by Warkworth’s role as is a service centre for a growing hinterland and the
potential for continued industrial growth.
Typically, construction and related civil engineering growth demands yard space, workshop,
and shed accommodation on minimum contour sites. Investors may, however, undertake
on-site earthworks to accommodate current and growing operational needs with an eye to
eventual sale to more intensive uses. Such activities already occupy parts of the existing
Hudson Rd Light Industry Zone.
A strong construction sector will boost light industry prospects, reflected in the manufacture
of building components (steel fabrication, timber and concrete products, joinery, framing
and the like) and trade services. These activities typically occupy small to medium industrial
units or sites, often with moderate storage requirements. They add to the intensity of
development although much of their activity takes place off-site.
Figure 10 Industrial Employment, 2001-2018
Other small scale, light industrial activities meet household as well as business demand. They
include automotive services (panel beating, repairs), boat building, appliance and
machinery repairs, small engineering shops and fabricators, plastic moulding, and aluminium
fabrication. Showrooms and trade suppliers provide for public as well as business demand.
The self-storage sector has grown to be a significant occupier of light industrial space over
the past 30 years, catering for trade and final demand. Substantial household growth will
boost the space requirements of services, while buoyant construction and industry together
with the completion of the Northern Motorway extension should see some further growth in
logistics generally.
Warkworth North Proposed Plan Change: Economic Assessment 17Small and medium-sized industrial enterprises generally expand locally, ideally in situ, close to
their markets and staff. Their growth generally is cost sensitive so that high costs resulting from
a limited choice of sites or premises can curtail growth.
Complementing light service-oriented activities in industrial zones are manufacturing
activities serving regional, national or international markets. While their investments are
generally much greater, they still depend on local population growth for labour supply and
often to provide base demand.
Figure 11 Significant Manufacturing Activities, 2000-2016
Several such activities have long
provided sustained industrial
employment in Warkworth (Figure
11). However, a small local
economy is always at risk from the
possible failure, retrenchment, or
relocation of its major employers.
A liberal land use policy which can
accommodate their growth cost-
effectively will improve prospects
for retention and expansion.
In Warkworth there are signs of an
incipient specialisation emerging
among medium-sized firms based
on marine demand and
fabrication skills. Engineering and
metal fabricating have also
established a strong capacity in
several privately-owned
companies, supporting
commercial and residential
construction as well as
manufacturing marine products.
Note: Due to confidentiality requirements, small numbers are
rounded to the nearest multiple of 3
Source: Business Demography, Statistics NZ (sourced January 2018)
Outside this group, Koru Knitwear provides a national presence in the clothing sector. It has
been in Warkworth for 30 years and, like most long-standing manufacturers there, remains
privately owned. Similarly, Glass Shapes was established in 1986 and is today “the largest
specialist curved glass manufacturer in Australasia”.11
The manufacturing picture, then, is one of a small number of well-established, privately-
owned companies with a market presence well beyond the local area, built upon skills and
organisation that have evolved in situ. A notable exception is Core Building Composites Ltd,
builder of high-tech yacht hulls among other things. It was established in 2010 and selected a
11 http://glasshape.com/about-us/
Warkworth North Proposed Plan Change: Economic Assessment 18You can also read