Boscombe and Pokesdown Neighbourhood Plan Viability Study - Bournemouth ...
←
→
Page content transcription
If your browser does not render page correctly, please read the page content below

Boscombe and Pokesdown
Neighbourhood Plan Viability
Study
Boscombe & Pokesdown Neighbourhood Forum

May 2018

                                           1/53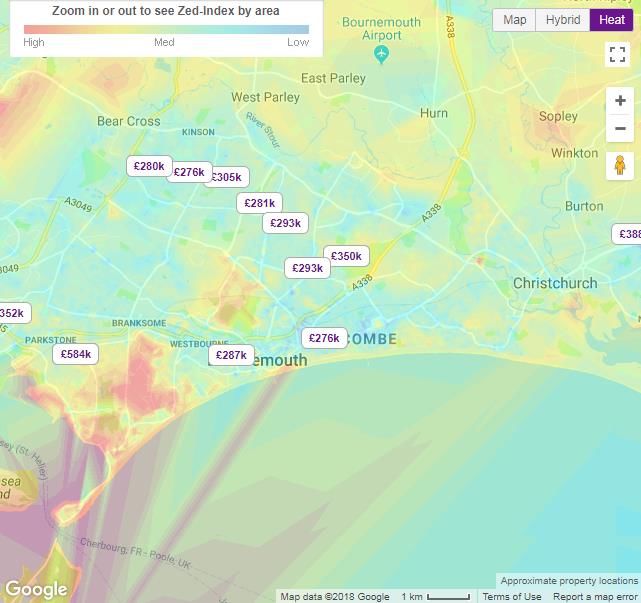
Project Role        Name           Position           Actions Summary   Signature      Date

                                                                                      January –
                 Tom Corbin       Graduate      Primary and secondary
                                                                                      May 2018
                                  Planner       research and report
                                                writing

Researcher(s)

                                                                                      January –
                 David Carlisle   Associate     Prepared report /
                                                                                      May 2018
  Project                                       modelling
  Manager

 Director/QA

 Qualifying
   Body

  Project
Coordinator

                                                                                                2/53
Prepared for:
Boscombe & Pokesdown Neighbourhood Forum

Prepared by:
Tom Corbin
David Carlisle

AECOM Infrastructure & Environment UK Limited
Aldgate Tower
2 Leman Street
London
E1 8FA
aecom.com

Printed on environmentally responsible paper. Made from 100% recycled post-consumer waste.

© 2016 AECOM Infrastructure & Environment UK Limited. All Rights Reserved.

This document has been prepared by AECOM Infrastructure & Environment UK Limited (“AECOM”) for sole use of our
client (the “Client”) in accordance with generally accepted consultancy principles, the budget for fees and the terms of
reference agreed between AECOM and the Client. Any information provided by third parties and referred to herein has
not been checked or verified by AECOM, unless otherwise expressly stated in the document. No third party may rely
upon this document without the prior and express written agreement of AECOM.

Where the conclusions and recommendations contained in this Report are based upon information provided
by others it is upon the assumption that all relevant information has been provided by those parties from whom
it has been requested and that such information is accurate. Information obtained by AECOM has not been
independently verified by AECOM, unless otherwise stated in the Report.
The methodology adopted and the sources of information used by AECOM in providing its services are outlined
in this Report. The work described in this Report was undertaken in the period July 2015 to September 2016
and is based on the conditions encountered and the information available during the said period of time. The
scope of this Report and the services are accordingly factually limited by these circumstances.
Where assessments of works or costs identified in this Report are made, such assessments are based upon
the information available at the time and where appropriate are subject to further investigations or information
which may become available.
AECOM disclaim any undertaking or obligation to advise any person of any change in any matter affecting the
Report, which may come or be brought to AECOM’s attention after the date of the Report.
Certain statements made in the Report that are not historical facts may constitute estimates, projections or
other forward-looking statements and even though they are based on reasonable assumptions as of the date
of the Report, such forward-looking statements by their nature involve risks and uncertainties that could cause
actual results to differ materially from the results predicted. AECOM specifically does not guarantee or warrant
any estimate or projections contained in this Report.
Where field investigations are carried out, these have been restricted to a level of detail required to meet the
stated objectives of the services. The results of any measurements taken may vary spatially or with time and
further confirmatory measurements should be made after any significant delay in issuing this Report.
Professional judgements are made for the purposes of supporting the client with their plan making only. The
content of this report does not represent valuation or real estate advice. The advice has been provided in
accordance with the Planning Practice Guidance and other non-statutory best practice guidance.

                                                                                                                      3/53
GLOSSARY ....................................................................................................................................................... 5
1      INTRODUCTION ........................................................................................................................................ 9
    1.1      CONTEXT .............................................................................................................................................. 9
    1.3      DRAFT NPPF ........................................................................................................................................ 9
    1.5      OBJECTIVE ........................................................................................................................................... 11
    1.6      METRIC OR IMPERIAL ........................................................................................................................... 12
    1.7      SITE CONCEPT PLANS .......................................................................................................................... 12
2      VIABILITY TESTING................................................................................................................................ 13
    2.2      THE MEANING OF COMPETITIVE RETURN .............................................................................................. 14
3      MARKET RESEARCH ............................................................................................................................. 17
    3.3      NEW BUILD PRICES PAID ..................................................................................................................... 18
    3.4      NEW BUILD PROPERTIES FOR SALE ....................................................................................................... 18
    3.5      SECOND HAND MARKET ........................................................................................................................ 19
    3.6      PRICE ASSUMPTIONS FOR FINANCIAL APPRAISALS ................................................................................ 20
4      MODELLING ASSUMPTIONS................................................................................................................. 23
    4.2      POLICY COSTS ..................................................................................................................................... 23
    4.3      CONSTRUCTION COSTS ........................................................................................................................ 23
    4.4      EXTERNAL COSTS ................................................................................................................................ 23
    4.5      SITE PREPARATION .............................................................................................................................. 24
    4.6      CONTINGENCY..................................................................................................................................... 24
    4.7      PROFESSIONAL FEES ........................................................................................................................... 24
    4.8      S106 CONTRIBUTIONS/CIL .................................................................................................................. 24
    4.9      VAT .................................................................................................................................................... 24
    4.10     INTEREST RATE .................................................................................................................................... 24
    4.11     VOIDS ................................................................................................................................................. 24
    4.12     PHASING AND TIMETABLE...................................................................................................................... 24
    4.13     SITE HOLDING COSTS AND RECEIPTS ..................................................................................................... 25
    4.14     SITE PURCHASE COSTS ........................................................................................................................ 25
    4.15     SALES AND MARKETING COSTS ............................................................................................................. 25
    4.16     DEVELOPER’S PROFIT .......................................................................................................................... 25
    4.17     LANDOWNER’S RETURN (EUV+) ........................................................................................................... 27
5      SITE ASSUMPTIONS .............................................................................................................................. 30
    5.1      HOUSING TYPES AND TENURES ............................................................................................................. 30
6      MODELLED SITES .................................................................................................................................. 31
    H4 LAND WEST OF W ESTMINSTER ROAD ......................................................... ERROR! BOOKMARK NOT DEFINED.
    H5 W ESTMINSTER ROAD INDUSTRIAL ESTATE .................................................. ERROR! BOOKMARK NOT DEFINED.
    H6 JOHNS ROAD ............................................................................................ ERROR! BOOKMARK NOT DEFINED.
    H8 FORMER HOSPITAL AND HEALTH CENTRE SITE ............................................ ERROR! BOOKMARK NOT DEFINED.
    ASSUMPTIONS SUMMARY ................................................................................................................................ 32
7      CONCLUSION ......................................................................................................................................... 34
    APPRAISAL RESULTS ....................................................................................................................................... 34
    SUMMARY AND RECOMMENDATIONS ................................................................................................................. 35
APPENDIX A LAND REGISTRY PRICES PAID 2016 – 2018 ........................................................................ 37
APPENDIX B NEW BUILD MARKET SURVEY (MARCH 2018) ................................................................... 45
APPENDIX C BCIS CONSTRUCTION COSTS ............................................................................................. 48
APPENDIX D MODELLING SUMMARY SHEETS ......................................................................................... 50

                                                                                                                                                                 4/53
Glossary
Alternative use value (AUV) Where an                  these conditions are not met, a scheme will not
alternative use can be readily identified as          be delivered. One that would lead to a market
generating a higher value for a site, the value for   transaction, discounting abnormal purchases or
that alternative use would take the existing use      cases where landowners are selling under
value (determined by the market) and apply an         distressed circumstances. Consideration
assumption that has regard to current                 should be made of costs that a relocating
development plan policies and all other material      landowner may often incur (such as capital
planning considerations and disregards that           gains tax, stamp duty, relocation costs and
which is contrary to the development plan.            professional fees), since there will be no
                                                      incentive to sell unless those costs are met.
Benchmark A comparator for the outputs or
inputs into the appraisal, i.e. site value or         Contingency – Contingencies are allowances
developer’s return, etc.                              that may sometimes be put within a
                                                      development appraisal to cater for unexpected
Building Cost Information Service (BCIS) A            costs where it is considered likely that the site
subscriber service set up in 1962 under the           poses risks which cannot easily be quantified.
aegis of RICS to facilitate the exchange of           For example, poor ground conditions may affect
detailed building construction costs. The service     the foundations, the discovery of archaeological
is available from an independent body to those        remains and/or contamination may only be
of any discipline who are willing and able to         confirmed once digging commences. Normally
contribute and receive data on a reciprocal           a contingency will be expressed as an
basis.                                                estimated percentage of costs. They should
Building costs indices A series of indices            only be used to reflect those aspects of a
published by BCIS relating to the cost of building    scheme where costs cannot be accurately
work. They are based on cost models of                estimated in advance of work starting on site.
‘average building’, which measure the changes         They are dependent upon the nature of the
in costs of labour, materials and plant which         development, the procurement method and the
collectively cover the basic cost to a contractor.    perceived accuracy of the information obtained.
                                                      A contingency should not to be used to cover
Cash flow The movement of money by way of             the possibility of contract price increases which
income, expenditure and capital receipts and          can be quantified at the time that the appraisal
payments during the course of the development.        is carried out. Similarly, they should not be used
The impact of cash flow assumptions on viability      to cover errors made in the construction phase
assessments is an important consideration.            – the latter is accounted for in the developer’s
While most viability appraisals include an interest   margin that reflects risk.
rate on capital employed, such costs are
frequently applied solely to building costs           Current use value Market value for the
pending sale. Cash flow considerations should         continuing existing use of the site or property
also take into account the costs of capital           assuming all hope value is excluded, including
employed in relation to infrastructure costs,         value arising from any planning permission or
Section 106 and CIL requirements and land             alternative use. This also differs from the
purchase costs, and should incorporate realistic      existing use value. It is hypothetical in a market
assumptions on build and sales rates based            context as property generally does not transact
upon local market conditions.                         on a CUV basis.

Comparable evidence A property used in the            Development appraisal A financial appraisal of
valuation process as evidence to support the          a development to calculate either:
valuation of another property. It may be                ▪ the residual site value (deducting all
necessary to analyse and adjust in order to put it         development costs, including an
in a suitable form to be used as evidence for              allowance for the developer’s profit/return
comparison purposes.                                       from the scheme’s total capital value); or
                                                        ▪ the residual development
Competitive returns A term used in paragraph               profit/return (deducting all
173 of the NPPF and applied to ‘a willing land             development costs, including the
owner and willing developer to enable                      site value/cost from the scheme’s
development to be deliverable’ to ensure that              total capital value).
development takes place and generates a land
value sufficient to persuade the land owner to        Developer’s return The developer’s
sell the land for the development proposed. If        reasonable expectation of profit reflecting
                                                      development risk, having regard to the margin

                                                                                                           5
requirements of any investors (where relevant).       Gross development cost (GDC) The cost of
It will be determined by each developer in            undertaking a development, which normally
accordance with their own business model              includes the following:
typically in relation to either profit on value          ▪ land acquisition costs
(Gross Development Value) or profit on cost              ▪ site-specific related costs
(total development costs). Whilst in practice it         ▪ build costs
is assessed in a variety of ways, for                    ▪ fees and expenses
development viability assessment calculations,           ▪ interest or financing costs; and
it is normally taken in relation to a percentage         ▪ holding costs during the development
of GDV.                                                      period.

Development risk The risk associated with the         Gross external area (GEA) The aggregate
implementation and completion of a                    superficial area of a building, taking each floor
development including post-construction letting       into account. As per the RICS Code of
and sales.                                            Measuring Practice this includes: external walls
                                                      and projections, columns, piers, chimney
Existing use value The estimated amount for           breasts, stairwells and lift wells, tank and plant
which an asset or liability should exchange on        rooms, fuel stores whether or not above main
the valuation date between a willing buyer and a      roof level (except for Scotland, where for rating
willing seller in an arm’s-length transaction after   purposes these are excluded), and open-side
properly marketing and where the parties had          covered areas and enclosed car parking areas,
each acted knowledgeably, prudently and               but excludes: open balconies; open fire escapes,
without compulsion, assuming that the buyer is        open covered ways or minor canopies; open
granted vacant possession of all parts of the         vehicle parking areas, terraces, etc.; domestic
property required by the business and                 outside WCs and coalhouses. In calculating
disregarding potential alternative uses and any       GEA, party walls are measured to their centre
other characteristics of the property that would      line, while areas with a headroom of less than
cause market value to differ from that needed to      1.5m are excluded and quoted separately.
replace the remaining service potential at least
cost. It is an accounting definition of value for     Gross internal area (GIA) Measurement of a
business use and as such, hypothetical in a           building on the same basis as gross external
market context, as property generally does not        area, but excluding external wall thicknesses.
transact on an EUV basis.
                                                      Hope value - according to the RICS (The
Existing use value (plus a premium) EUV+              Valuation of Development Land 1st Edition p17
The benchmark or threshold land value for the         (2008)) ‘Hope Value is the popular term for the
purposes of assessing the viability of                element of the difference between the value of
development for planning purposes. The value          the land with the benefit of the current planning
above the EUV at which a typical willing              consent and the value with an enhanced,
landowner is likely to release land for               assumed, consent that is reflected in the Market
development. EUV+ should be informed by               Value of the land’. It is entirely speculative and,
comparable evidence of transactions where             whilst recognised in the market, is not part of
possible. Where transacted prices are                 the EUV+ approach or Benchmark Land Value
significantly above the market norm for               and should not be used to define land value or
transactions that fully reflect planning policy       the return to the landowner.
conditions and constraints, they should be
regarded as outliers and not used as part of this     Interest rate The rate of finance applied in a
EUV+. This is likely to be highest in high value      development appraisal. As most appraisals
urban settings but low in rural low value areas.      assume 100 per cent financing, it is usual for
EUV+ is not price paid and should disregard           the interest rate to reflect the total cost of
Hope Value.                                           finance and funding of a project, i.e. the
                                                      combination of both equity and debt in applying
Gross development value (GDV) The                     a single rate.
aggregate market value of the proposed
development, assessed on the special                  Land Value Central to the consideration of
assumption that the development is complete as        viability is the assessment of land or site value.
at the date of valuation in the market conditions     Land or site value will be an important input into
prevailing at that date. The total of likely sales    the assessment. The most appropriate way to
proceeds from a completed development                 assess land or site value will vary from case to
scheme, gross of any costs of sale but taken at       case but it is recommended that the starting
today’s values and not inflated by the prospect of    point is an understanding of the Current Use
changes in market prices.                             Value (CUV) and Existing Use Value (EUV) of
                                                      the land or site. The Landowner’s return should

                                                                                                            5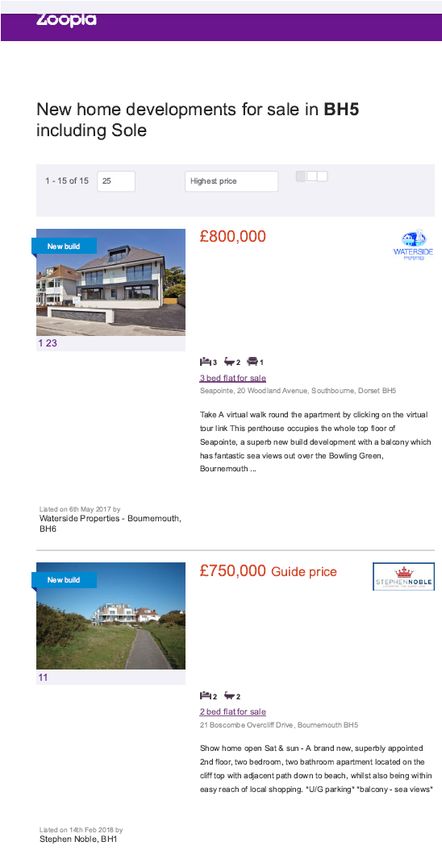
normally utilise Existing Use Value ‘Plus’            Net internal area (NIA) The usable space within
(EUV+) in a planning context.                         a building measured to the internal finish of
                                                      structural, external or party walls, but excluding
Landowner’s Return - in all cases the                 toilets, lift and plant rooms, stairs and lift wells,
landowner’s return should reflect extant and          common entrance halls, lobbies and corridors,
emerging policy requirements and planning             internal structural walls and columns and car
obligations and, where applicable, any                parking areas.
Community Infrastructure Levy charge and any
other planning conditions for extant planning         Planning obligation Provided for under section
consents. Practitioners should normally utilise       106 of the Town and Country Planning Act 1990,
Existing Use Value Plus (EUV+) as an approach         usually in connection with the grant of planning
for determining the landowners’ return in the         permission for a private development project. A
planning context.                                     benefit to the community, either generally or in a
                                                      particular locality, to offset the impact of
Market risk adjusted return The discount rate         development, e.g. the provision of open space, a
as varied so as to reflect the perceived risk of      transport improvement or affordable housing. The
the development in the market.                        term is usually applied when a developer agrees
                                                      to incur some expenditure, surrender some right
Market value (MV) The estimated amount for            or grant some concession which could not be
which an asset should exchange on the date of         embodied in a valid planning condition.
valuation between a willing buyer and a willing
seller in an arm’s length transaction after           Policy Compliant Development that meets the
proper marketing wherein the parties had each         full requirements of all national and local
acted knowledgeably, prudently and without            planning policies. Those policy requirements
compulsion.                                           should be tested at the plan-making stage to
                                                      ensure that the total cumulative cost of meeting
Net developable area versus gross site area           them does not render development in the area
Many viability studies that model housing             unviable.
schemes assume a housing and plotting
density per unit area. Such an analysis is a          Price Paid The amount paid for land by a
legitimate starting point and, provided the           developer. It should not be used as an element
assumptions in relation to sales revenue and          to assess viability in the planning process. Price
build cost are correct, produces a fully serviced     paid should reflect the cost of being policy
land value per net developable area. However,         compliant, but this is often not the case. Price
the assumption is then made that the net              paid may include overpayment due to
developable area (i.e. income generating land)        considerations of Hope Value or expectation of
equates to the area of land that is to be             market increases to Gross Development Value or
acquired following the grant of planning              the assumed possibility of negotiating down
permission. In all but the smallest                   developer contributions. For the purposes of
redevelopment schemes, the net developable            viability assessment, the amount paid for any
area is significantly smaller than the gross area     parcel of land by the developer is therefore
that is required to support the development,          irrelevant.
given the need to provide open space, play
areas, community facility sites, public realm,        Red Book The RICS Valuation – Professional
land for sustainable urban drainage schemes           Standards 2012 (Formerly RICS Valuation
etc. The net area can account for less than           Standards). The 'Red Book' contains mandatory
50%, and sometimes as little as 30% on larger         rules, best practice guidance and related
sites, of the site to be acquired (i.e. the size of   commentary for all RICS members undertaking
the site with planning permission). Failure to        asset valuations.
take account of this difference can result in
flawed assumptions and inaccurate viability           Residual Site Value or residual land value The
studies. The HCA Development Appraisal Tool           amount remaining once the GDC of a scheme is
used for this study produces a residual value         deducted from its GDV and an appropriate return
for the gross site area.                              has been deducted.

Net/gross ratio Refers to the percentage of           Residual valuation A valuation/appraisal of land
usable space or land. A typical net/gross ratio       using a development appraisal.
on an office is 85%, whereas on a large
greenfield site it is around 60% as not all land      Return (on capital) The ratio of annual net
can be developed (i.e. some is used as open           income to capital derived from analysis of
space, for distributor roads, community uses,         a transaction and expressed as a
infrastructure etc.)                                  percentage.

                                                                                                          5
Sales rates The rate at which residential units     associated with providing serviced housing
are sold (either by month, quarter or year).        parcels, i.e. Strategic infrastructure costs.

Serviced land Land where the necessary              Threshold land value A term developed by the
infrastructure is in place. No off-site works are   Homes and Communities Agency (HCA) being
required and the developer simply has to            essentially a land value at or above that which it
connect the development with existing               is assumed a landowner would be prepared to
infrastructure                                      sell. Used by some practitioners for establishing
                                                    site value. The basis is as with EUV but then
                                                    adds a premium (usually 10% to 40%) as an
Site Value (for financial viability assessments     incentive for the landowner to sell.
for scheme specific planning applications)
Market value subject to the following assumption:   Viability assessments/financial viability A
that the value has regard to development plan       report including a financial appraisal to
policies and all other material planning            establish the profit or loss arising from a
considerations and disregards that which is         proposed development. It will usually provide
contrary to the development plan.                   an analysis of both the figures inputted and
                                                    output results, together with other matters of
Site Value (for area wide financial viability       relevance. An assessment will normally provide
assessments) Site Value (as defined above)          a judgment as to the profitability (or loss) of a
may need to be further adjusted to reflect the      development.
emerging policy/ CIL charging level. The level
of the adjustment assumes that site delivery        Yield As applied to different commercial
would not be prejudiced. Where an adjustment        elements of a scheme, i.e. office, retail, etc.
is made, the practitioner should set out their      Yield is usually calculated as a year’s rental
professional opinion underlying the                 income as a percentage of the value of the
assumptions adopted.                                property. The “yield” is the rent as a proportion
These include, as a minimum, comments on            of the purchase price. In determining
the state of the market and delivery targets as     development value, there is an inverse
at the date of assessment.                          relationship i.e. as the yield goes up, the value
                                                    goes down. To calculate development value
Strategic infrastructure and utility costs          multiply the rent by 1 divided by the yield e.g.
Many models use construction cost information       £100,000 x 1/10% (i.e. 0.1) = £1 million gross
provided by BCIS or other sources. While this       value.
is regarded as a legitimate starting point, care
is needed in understanding what is both             Sources: AECOM, RICS (Financial viability in
included and excluded from such cost indices.       planning 2012), LHDG (Viability testing Local
Cost indices rarely provide data on the costs       Plans 2012), PAS (Viability handbook and
                                                    exercises 2011)

                                                                                                         5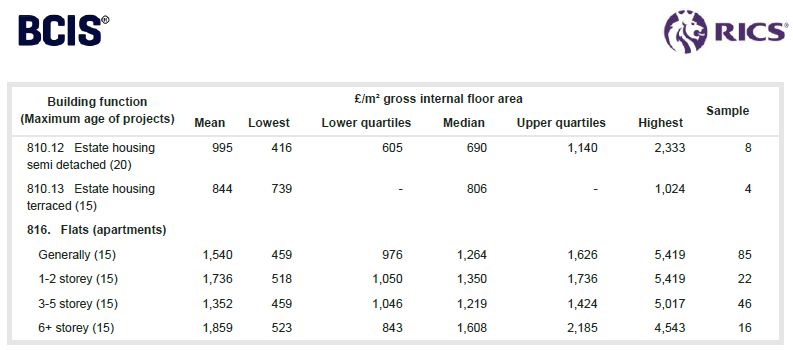
1 Introduction
1.1 Context
1.1.1   Through the Ministry of Housing, Communities & Local Government’s (‘MHCLG’) Neighbourhood
        Planning Programme, AECOM has been commissioned to provide viability technical support to the
        Boscombe and Pokesdown (‘BAP’) Neighourhood Forum (‘the Forum’). The support is intended to
        inform the group’s work in producing a Neighbourhood Development Plan (‘NDP’) and to provide
        evidence in support for the NDP’s emerging site allocations. The viability support builds upon AECOM’s
        previous Housing Need Assessment and masterplanning support provided to BAP NF.
1.1.2   The neighbourhoods of Boscombe and Pokesdown are located within the county of Dorset, within the
        coastal town of Bournemouth. Bournemouth Borough Council (‘BBC’) is the Local Planning Authority.
1.1.3   The Neighbourhood area is outlined on the map below.
Figure 1: Neighbourhood Plan Area (Source: BBC)

                                                                                                            5
1.2 Draft NPPF
1.2.1 This report has been published at the same time as an active national consultation on proposed
changes to the NPPF and Planning Practice Guidance (‘PPG’). The draft NPPF transposes a number
of Written Ministerial Statements, including the Neighbourhood Planning: Written statement -
HCWS3461. The aim of which is to protect NDPs in circumstances where the adverse impacts of
allowing development conflicts with a neighbourhood plan and are likely to significantly and
demonstrably outweigh the benefits. The wording in the draft NPPF is considered (by MHCLG) to be
more effective than setting out the ‘weight’ that should be given to plans in particular circumstances.
Paragraph 14 states the following:
‘Where a neighbourhood plan that has recently been brought into force contains policies and allocations
to meet its identified housing requirement, the adverse impact of allowing development that conflicts
with it is likely to significantly and demonstrably outweigh the benefits where:
▪ paragraph 75 of this Framework applies; and
▪ the local planning authority has at least a three year supply of deliverable housing sites (against
its five year housing supply requirement), and its housing delivery was at least 45% of that
required [Assessed against the Housing Delivery Test, from November 2018 onwards.
Transitional arrangements are set out in Annex 1] over the previous three years.’
1.2.2 Proposed new NPPF paragraph 65 is also of relevance as it sets out that developments of 10 or more
should provide 10% of units as ‘affordable home ownership’ products:
‘Where major housing development is proposed, planning policies and decisions should expect at least
10% of the homes to be available for affordable home ownership [As part of the overall affordable
housing contribution from the site], unless this would exceed the level of affordable housing required in
the area, or significantly prejudice the ability to meet the identified affordable housing needs of specific
groups. Exemptions should also be made where the site or proposed development:
▪ provides solely for Build to Rent homes;
▪ provides specialist accommodation for a group of people with specific needs (such as purpose-
built accommodation for the elderly or students);
▪ is proposed to be developed by people who wish to build or commission their own homes; or
▪ is exclusively for affordable housing, an entry level exception site or a rural exception site.’
1.2.3 The draft NPPF also includes a revised definition for affordable housing within the Glossary and
transposes a number of other Written Ministerial Statements such as the affordable housing threshold
of major development (10 or more units). The draft NPPF also emphasises the importance of viability
testing at the plan making stage and provides additional draft guidance within the PPG which this report
reflects.
1
Accessed at: https://www.parliament.uk/business/publications/written-questions-answers-statements/written-statement/Commons/2016-
12-12/HCWS346/
51.4 Objective
1.4.1 Only a NDP that meets each of the basic conditions2 can progress to a referendum. Plans should have
regard to national policies and advice; and be in general conformity with the strategic policies contained
in the development plan of local planning authorities. The NPPF and PPG require plan makers to
consider viability and deliverability. Neighbourhood plans also need to be in general conformity with the
strategic policies in the corresponding Local Plan, such as affordable housing targets. Neighbourhood
groups introducing: new policy requirements (that may carry costs to development over and above
national and local requirements); allocating sites in an NDP; and/or bringing forward Neighbourhood
Development Orders (‘NDO’) should consider viability. The Qualifying Body should: consider whether
sites are deliverable or developable 3 during the plan period (or the timeframe stipulated for the NDO);
be satisfied that their approach does not put implementation of the Development Plan at serious risk;
and facilitate development throughout the economic cycle.
1.4.2 The PPG is clear that viability must be considered when preparing Neighbourhood Plans:
‘If the policies and proposals are to be implemented as the community intended a neighbourhood plan
needs to be deliverable. The National Planning Policy Framework requires that the sites and the scale
of development identified in a plan should not be subject to such a scale of obligations and policy
burdens that their ability to be developed viably is threatened’.4
1.4.3 The requirement to test for viability in the NPPF5 is ‘broad brush’, stating ‘plans should be deliverable’.
It is not a requirement of the NPPF that every site should be able to bear all of the Local Plan and
neighbourhood plan requirements. However it is necessary for a site to bear the NDP policy
considerations if it has been appraised, and policy drafted, to reflect site specific requirements. The
study is purely concerned with whether or not the proposals for a site (and any relevant policy
requirements within an emerging NDP) would render development unviable. Viability assessment
outputs can be used (if necessary) to amend proposals or policies to help facilitate development and to
ensure the cumulative impact of proposals and policies do not threaten the delivery of the NDP and
Local Plan’s vision, objectives and strategic policies.
1.4.4 There are some types of development where viability will not be at the forefront of the developer’s mind
and they will proceed even if a development is ‘unviable’ in a conventional real estate sense. For
example, an end user of an industrial or logistics building may build a new factory or depot that will help
it to grow its business or improve its operational efficiency. Similarly some development sites will simply
not be viable even without any additional requirements imposed upon them due to the prevailing market
conditions and/or site constraints. The typical site should be able to bear whatever target or requirement
is set and plan makers should be able to show, with a reasonable degree of confidence, that the plan
is deliverable and facilitates development.
1.4.5 This report is concerned with development viability for emerging allocations and policies within an
emerging NDP and is only one element of the NDP’s wider evidence base. This document sets out the
methodology used; the key assumptions made; and a high-level assessment of the proposed sites. The
NPPF (paragraph 158) emphasises that a proportionate evidence base should inform plans, based on
‘adequate, up-to-date and relevant evidence’, which takes account of ‘relevant market and economic
signals’. In addition, the PPG emphasises that viability evidence should be ‘proportionate to ensure
plans are underpinned by a broad understanding of viability’.
2
The basic conditions are set out in paragraph 8(2) of Schedule 4B to the Town and Country Planning Act 1990 as applied to
neighbourhood plans by section 38A of the Planning and Compulsory Purchase Act 2004
3
NPPF footnotes 11 and 12 state: To be considered deliverable, sites should be available now, offer a suitable location for development
now, and be achievable with a realistic prospect that housing will be delivered on the site within five years and in particular that
development of the site is viable. Sites with planning permission should be considered deliverable until permission expires, unless there is
clear evidence that schemes will not be implemented within five years, for example they will not be viable, there is no longer a demand for
the type of units or sites have long term phasing plans.
To be considered developable, sites should be in a suitable location for housing development and there should be a reasonable prospect
that the site is available and could be viably developed at the point envisaged.
4
Must a community ensure its neighbourhood plan is deliverable? Paragraph: 005 Reference ID: 41-005-20140306. Accessed at:
http://planningguidance.communities.gov.uk/blog/guidance/neighbourhood-planning/what-is-neighbourhood-planning/what-is-a-
neighbourhood-plan-and-what-is-its-relationship-to-a-local-plan/
5
NPPF paragraphs 47 and 173-177 include national policy direction on viability (Accessed at:
http://planningguidance.communities.gov.uk/blog/policy/achieving-sustainable-development/plan-making)
51.4.7 As such the assumptions in this study have drawn upon existing available viability evidence produced
by BBC:
▪ Eastern Dorset 2015 Strategic Housing Market Assessment Bournemouth Borough Summary
(August 2015)
▪ PINS Report on the Examination of the Draft Bournemouth Borough Council Community
Infrastructure Levy Charging Schedule (October 215)
▪ Bournemouth CIL – Economic Viability Study (October 2014)
▪ Affordable Housing DPD (December 2009) and SPD (November 2011)
1.5 Metric or imperial
1.5.1 The property industry uses both imperial and metric data - often working out costings in metric (£/m2)
and values in imperial (£/acre and £/sqft). This is confusing so, on the whole, we have used metric
measurements throughout this report. The following conversion rates may assist readers.
1m = 3.28ft (3' and 3.37") 1ft = 0.30m
1m2 = 10.76sqft 1sqft = 0.093m²
A useful broad rule of thumb to convert m2 to sqft is simply to add a final zero.
1.6 Site concept plans
1.6.1 PLEASE NOTE: All site plans accompanying this report are for illustrative purposes only and are
informed by a previous AECOM site assessment. They do not represent schemes that would either be
endorsed by the Town Council or promoted by local landowners or developers. Their primary purpose
for this study is to help inform realistic assumptions for the viability modelling exercise. Future planning
applications will have to accord to with the draft NDP policies and extant BBC strategic policies, as such
future schemes shall be informed by more detailed site investigations and a detailed design stage
(including community engagement).
52 Viability Testing
2.1.1 For plan making the assessment of viability is a largely high-level quantitative process based
on financial appraisals at a snapshot in time. It is not the same level of detail used for viability
appraisals accompanying a planning application. In addition, there are types of development
where viability, measured at a snapshot in time, is not at the forefront of the developer’s mind
and they will proceed even if a ‘loss’ is shown in a conventional appraisal (i.e. development
appears unviable). For example, an end user of an industrial or logistics building may build a
new factory or depot that will improve its operational efficiency even if, as a property
development, the resulting building may not be viable (based upon the typical level of a
developer’s and landowner’s competitive return locally).
2.1.2 Whilst viability testing has limitations, it can help to de-risk development by providing an
indication on whether a plan (including its policies and/or site allocations) is deliverable. Viability
Testing in Local Plans – Advice for planning practitioners prepared by the LHDG (sometimes
referred to as the ‘Harman Guidance’) defines viability as follows:
2.1.3 An individual development can be said to be viable if, after taking account of all costs, including
central and local government policy and regulatory costs and the cost and availability of
development finance, the scheme provides a competitive return to the developer to ensure that
development takes place and generates a land value sufficient to persuade the land owner to
sell the land for the development proposed. If these conditions are not met, a scheme will not
be delivered.
2.1.4 Put simply viability testing is about adding up all the potential income from a scheme (total sales
and/or capitalised rental income from housing and/or commercial developments) and then
subtracting all the costs associated with the creation of the product (i.e. building the houses
and/or commercial property plus any associated infrastructure). This calculation involves taking
the Gross Development Value (GDV) and subtracting Gross Development Costs to arrive at a
Residual Value. The residual valuation method is the typical valuation method widely used by
developers and is the recommended for use when testing viability at the plan making stage.
Residual Valuation Method
Gross Development Value
(The combined value of the complete development)
LESS
Cost of creating the asset, including a profit margin for the developer
(Construction + fees + finance charges etc.)
=
RESIDUAL VALUE
The Residual Value is compared to the Existing Use Value (‘EUV’) of the land to determine if
the premium (uplift) above the EUV would induce the landowner to sell. This is known as the
Threshold Land Value (‘TLV’) or Benchmark Land Value
Figure 2 The residual valuation method
2.1.5 The Residual Value in the example above is the theoretical top limit of what a developer could
offer to pay a landowner for their site and still make a satisfactory profit margin. The availability
and cost of land are matters at the core of viability for any property development.
52.1.7 The bar, in Figure 3 The viability balance (below), illustrates all the income from a scheme (the
GDV). This is set by the market (rather than by the developer or local authority) and so is,
largely, fixed. The developer has relatively little control over the costs of development
(construction, fees etc.) and whilst there is scope to build to different standards and with
different levels of efficiency, the costs are largely out of the developer’s direct control – they are
what they are depending on the development proposed (costs of labour and materials). The
developers profit is included as a cost as developers need to be rewarded for taking on the risk
of development. The developers profit is included as a cost as developers need to be rewarded
for taking on the risk of development, the level of profit is typically between 15-25% on value or
costs but this should reference local evidence from the Council. The more policy requirements
and planning obligations loaded onto a scheme, the higher the likelihood that the land value of
the site will be suppressed (as shown by the red arrows below).
Figure 3 The viability balance
Source: HDH Planning and Development
2.1.8 Therefore the essential balance in viability testing is whether the land value is sufficient to
induce a landowner to release their land for development. The more policy requirements and
planning obligations the plan asks for the less the developer can afford to pay for the land. The
landowner will only agree to sell their land to the developer if they can afford to pay for the land.
The landowner will only agree to sell their land to the developer if they receive a ‘competitive
return’.
2.2 The Meaning of Competitive Return
2.2.1 The competitive return for the landowner and developer, are controversial matters and it is clear
that different landowners and developers will have different views depending on their personal
and corporate priorities. The Residual Value generated by the development appraisals must be
compared to the Existing Use Value (‘EUV’) or an Alternative Use Value (‘AUV’) of the site. The
size of the uplift or premium above the EUV/AUV must be enough to incentivise a landowner
to sell. The amount of the uplift/premium over and above the EUV is central to the assessment
of viability. It must be at a level to provide ‘competitive returns’6 to the landowner in order to
produce robust viability assessments. This concept is known as the Existing Use Value ‘Plus’
a premium (‘EUV+’), also referred to as the Threshold Land Value (‘TLV’). Other terms to
6
As required by 173 of the NPPF
5describe the landowner’s competitive return include: Benchmark Land Value (‘BLV’) or Viability
Threshold. The EUV+ approach is accepted by PINS7.
2.2.2 The EUV+, or TLV, is the point at which a ‘reasonable’ landowner will be induced to sell their
land. This concept is difficult since a landowner is unlikely to be entirely frank about the price
that would be acceptable to them. This is one of the areas where an informed assumption has
to be made. If a landowner owns a field in agricultural use they will expect a large premium
above the EUV to release it for residential development as agricultural land is typically worth
tens of thousands of pounds per hectare whereas as residential land is worth hundreds of
thousands of pounds per hectare.
2.2.3 The PPG makes it clear that when considering land value it should be in the context of current
and emerging policies and based on today’s costs and values disregarding any hope value8.
In other words, land value should be reduced to reflect policy requirements. Historical
transactions recorded under a different policy framework or less favourable market conditions
(such as a recessionary period) will be less useful as comparable market data for informing
assumptions for the EUV+/landowners ‘competitive return’.
2.2.4 The value of land relates closely to the use to which it can be put to and will range considerably
from site to site; however, high level studies will typically look at three main uses, being:
agricultural/greenfield, residential and industrial/commercial uses. Consideration of what
constitutes the EUV+ locally incorporates, wherever available, a review of pre-existing Local
Authority research. If the Residual Value does not exceed the EUV, then the development is
not viable. If it exceeds the EUV but does not exceed the EUV+ then it is still not viable as it
would not induce the landowner to sell. However, it may be closer to being a viable scheme
with amendments to policy or the development scheme itself if it is producing a large positive
Residual Value. Only a Residual Value equal to or in excess of the EUV+ would represent a
viable scheme (see illustration below).
Existing Use Value Plus
The benchmark or threshold land value for the purposes of
assessing the viability of development for planning
above EUV to incentivise
(EUV+) purposes. The value above the EUV at which a
reasonable and willing landowner is likely to release
the landowner to sell
The premium (‘Plus’)
land for development (the ‘landowner’s return’).
Existing Use Value The value of the land in its existing use together with the
right to carry out any development for which there
(EUV) are extant planning consents, including realistic
deemed consents, but without regard to other
possible uses that require planning consent,
technical consent or unrealistic permitted
development.
Current Use Value The value of land in the use to which it is currently being
put. It excludes any consented use including
(CUV) deemed consents and any element of Hope Value.
7
Paragraphs 7 To 9 of Report On The Examination of the Draft Mayoral Community Infrastructure Levy Charging Schedule By
Keith Holland Ba (Hons) DIPTP MRTPI ARICS The Examiner Appointed By The Mayor Date: 27th January 2012
8
Any element of open market value of a property in excess of the current use value, reflecting the prospect of some more
valuable future use or development e.g. a Green Belt site adjoining a settlement in an area that requires high housing growth
could be said to carry more hope value than a site in open countryside within a District with strong historic housing delivery. It
takes account of the uncertain nature or extent of such prospects, including the time which would elapse before one could
expect planning permission to be obtained or any relevant constraints overcome, so as to enable the more valuable use to be
implemented.
52.2.5 In practice, a wide range of considerations could influence the precise EUV and EUV+ that
should apply in each case, and at the end of extensive analysis the outcome might still be
contentious. One type of approach is outlined below:
▪ For sites previously in agricultural use, then agricultural land represents the existing
use value.
▪ For paddock and garden land on the edge of or in a smaller settlement you should
adopt a ‘paddock’ value.
▪ Where the development is on brownfield land you assume an industrial value.
▪ Where the site is currently in residential use you assume a residential value.
2.2.6 For greenfield sites it is incredibly difficult to get agreement from the development industry on
what the premium or uplift (EUV+) above greenfield values should be. Whatever the EUV+, it
will always be a simplification of the market; however in a high level study of this type general
assumptions need to be made. Landowners selling a greenfield site, in the event of the grant
of planning consent, usually receive over 10-20 times the value compared with before consent
was granted.
2.2.7 The high level and broad brush viability testing that is appropriate to be used to assess Local
Plans and Neighbourhood Plans does have limitations. It should be noted that this study is
about the economics of development. Viability brings in a wider range than just financial factors.
The PPG states that:
‘Understanding Local Plan viability is critical to the overall assessment of deliverability. Local
Plans should present visions for an area in the context of an understanding of local economic
conditions and market realities. This should not undermine ambition for high quality design and
wider social and environmental benefit but such ambition should be tested against the realistic
likelihood of delivery.’
2.2.8 The PPG and Harman Guidance both emphasise the importance of the non-financial factors,
viability is an important factor in the plan making process, but it is one of many planning
considerations set down in national policy that needs to be considered as part of plan making.
It is not viability at any cost.
53 Market Research
3.1.1 This study is concerned with the viability of new build residential property. Key inputs for the
appraisals are the price assumptions for new development. We have reviewed new build
market housing prices paid from the Land Registry from 2015 to 2017 and have conducted a
survey of property being marketed in May 2018 (to highlight properties where prices paid have
not yet been recorded with the Land Registry). It has also been necessary to investigate the
second hand market to triangulate the data to form judgements for the modelling. Previusly the
BBC viability study assumed open market sales values of: £2,800 (Houses); and £3,300 (Flats)
3.1.2 Although development schemes have similarities, every scheme is unique, even schemes on
neighbouring sites. Market conditions broadly reflect a combination of national economic
circumstances and local supply and demand factors, however even within a town like BAP there
will be particular localities, and ultimately site specific factors, that generate different values and
costs. For the purposes of this study we have used up to date market evidence to inform the
price assumptions.
£310,000
£290,000
£270,000
£250,000
£230,000
£210,000
£190,000
£170,000
£150,000
Mar-07
May-08
Jul-09
Feb-10
Mar-14
May-15
Jul-16
Apr-11
Feb-17
Oct-07
Dec-08
Nov-11
Oct-14
Dec-15
Jan-06
Aug-06
Sep-10
Jun-12
Jan-13
Aug-13
Sep-17
England South West Dorset Bournemouth
Table 1 Comparison of average prices
3.1.3 The RICS May 2018: UK Residential Market Survey9, reported that activity indicators continued
to weaken. New buyer enquiries fell for the eleventh month in succession, average inventory
on estate agents books have hit a record low and results continue to signal significant regional
variation across the country. The survey further reports that:
“…respondents were asked about the key factors driving demand for new build properties. At
the national level, the main driver appears to be the lack of stock in the secondhand market.
This is followed by the appeal of the Help to Buy scheme with developer incentives and the
‘quality’ of new homes scoring more lowly…The longer term indicators for sales prices and
rents (over the next five years) continue to suggest that the former will increase at a slightly
slower pace than the latter although in both cases, they point to growth of around 15% which
would suggest an acceleration towards the end of this period given other readings from the
survey.”
9
Accessed at: https://www.rics.org/Global/2._WEB_%20February_2018_RICS_UK_Residential_Market_Survey_tp.pdf
53.3 New Build Prices Paid
3.3.1 The Land Registry publishes data of all homes sold. There were 183 homes sold between
October 2015 and May 2017 in the vicinity of BAP (using postcode areas to narrow the search
area). These transactions are summarised as follows (and included in full in Appendix A).
Table 2 New build prices paid
^ The mean is the total of the numbers divided by how many numbers there are
New build Sales 2015-17 £
Detached Semi- Terraced Flats All
detached
Count - 1 10 172 183
Max - 265,000 257,500 695,000 695,000
Min - 265,000 247,500 85,000 85,000
Mean ^ - 265,000 255,500 181,115 185,638
Median * - 265,000 256,250 150,750 157,500
* The median is the middle value of a set of numbers (e.g. 1 2 3 4 5)
3.3.2 We have calculated the values on a pounds per square metre basis (£/m2) for each property
by comparing prices paid with the total unit size (Gross Internal Area) of each unit sold, acquired
from the Government’s Domestic Energy Performance Certificate Register . The mean and
median £/m2 prices for each broad house type are summarised below and overleaf (Table 3
Prices paid (median and mean) by typeand Error! Reference source not found.).
Table 3 Prices paid (median and mean) by type
New build Sales 2015-17 £/m2
Mean £/m2 Median £/m2
Detached - -
Semi-detached 2,789 2,789
Terraced 2,689 2,697
Flats 3,531 3,395
All £3,481 £3,368
Source: Land Registry (2015-2017)
3.4 New build properties for sale
3.4.1 In addition to collecting price paid data we have reviewed information on new build properties
that were being marketed in May 2018. Schemes within the BH5 post code (+5 mile radius)
were included to gather a larger sample.
3.4.2 Where available floor plans were analysed to provide accurate total floor areas, where this
information was not readily available average size assumptions were made. New build asking
prices varied very considerably across the wider housing market area ranging from a £800,000
3 bed penthouse flat for sale in Southbourne to a 1 bed ground floor flat for £105,000
Christchurch Road, Boscombe (see snapshot at Appendix B).
53.6 Second hand market
3.6.1 In addition to Land Registry price paid data and a survey of for sale prices, we have reviewed
the second hand market using websites such as Zoopla and Rightmove (May 2018). This
provides a useful benchmark and enables the collection of local marketing/sold data for BAP,
to help inform the price assumptions. Over the past 5 years the average price paid for property
in BH5 has been £233,072 (source: Zoopla house prices tool) with an average value change of
£52,090 (+23.50%) based upon a sample of 1,284 sales. The current average value for property
in BAP is estimated to be £273,769. However, since May 2017 Zoopla reports a -1.66% price
decrease across all property types.
3.6.2 Figure 5 shows value trends for the past 5 years for BAP, Dorset and post code BH5 (a search
area larger than the Neighbourhood Area).
Figure 4 Values trends Boscombe, Dorset and BH5 (May 2018)
3.6.3 Properties for sale on the open market within BAP in May 2018 are summarised below (Table
4 BAP second hand market current asking prices May 2018 5). 156 homes were advertised for
sale. Second-hand property prices using this snapshot ranged from £875,000 6 bed detached
house for sale in Stoborough, to a 2 bed park home in Coldharbour for £120,000.
Table 4 BAP second hand market current asking prices May 2018
Property type 1 bed 2 beds 3 beds 4 beds 5 beds
Houses £120,000 £297,650 £342,491 £441,111 £571,667
(1) (3) (16) (9) (6)
Flats £131,184 £204,815 £363,333 £733,333 £275,000
(39) (71) (6) (3) (2)
All £130,905 £208,578 £348,175 £514,167 £497,500
(40) (74) (22) (12) (8)
Table 5 Average Values by house type
Property Avg. Avg. £ per Avg. per Avg. # beds Avg. £ paid
type current sq ft. sqm (last 12m)
value
Detached £397,933 £265 £2,852 3.9 £383,557
Semi- £252,977 £229 £2,465 3.2 £266,563
detached
Terraced £222,185 £259 £2,788 2.7 £213,429
Flats £195,561 £308 £3,315 1.9 £186,315
Source: Zoopla (2018)
5You can also read