The DRAFT Bermuda PLAN - Review & Strategy Report 2018 - Government of Bermuda
←
→
Page content transcription
If your browser does not render page correctly, please read the page content below

The DRAFT
                          Bermuda
                              PLAN
                         Review & Strategy
                                    Report

GOVERNMENT OF BERMUDA
Department of Planning         2018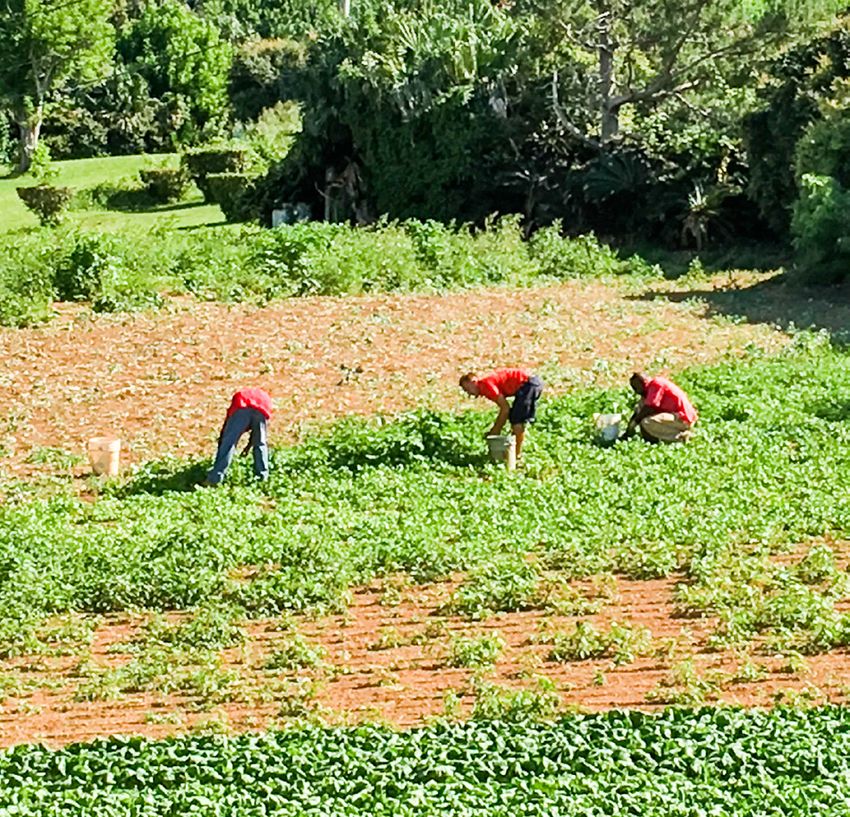
TABLE OF CONTENTS

1.0 INTRODUCTION ..................................................................................................................................... 5
   1.1 Background and Purpose of this Report ........................................................................................... 5
2.0 PREPARING A NEW BERMUDA PLAN .................................................................................................... 7
   2.1 Work Programme .............................................................................................................................. 7
   2.2 Public Consultation............................................................................................................................ 8
       2.2.1 Rezoning requests and other submissions .................................................................................. 8
       2.2.2 Review of rezoning requests and submissions ........................................................................... 9
       2.2.3 Further public input .................................................................................................................... 9
3.0 KEY ISSUES FACING BERMUDA ........................................................................................................... 11
   3.1 Bermuda in the global context ....................................................................................................... 11
   3.2 Current land uses............................................................................................................................. 11
   3.3 Population and Housing .................................................................................................................. 13
       3.3.1 Population trends....................................................................................................................... 13
       3.3.2 Household Trends ..................................................................................................................... 17
       3.3.3 Residential development trends ............................................................................................... 18
       3.3.4 Residential on Tourism zoned land ........................................................................................... 23
       3.3.5 Residential in commercial and mixed use zones ...................................................................... 24
       3.3.6 Population and Housing forecasts ............................................................................................ 24
       3.3.7 Residential land supply and demand ........................................................................................ 25
       3.3.8 Cycle Only Apartments.............................................................................................................. 26
   3.4 Tourism Development ..................................................................................................................... 27
   3.5 Economic Development .................................................................................................................. 29
   3.6 Industrial development ................................................................................................................... 34
   3.7 Transportation and Walkability ...................................................................................................... 37
   3.8 The Airport....................................................................................................................................... 41
   3.9 The Historic Environment................................................................................................................ 42
   3.10 Climate Change .............................................................................................................................. 44
   3.11 Environmental Analysis.................................................................................................................. 46
   3.12 Parks and Open Spaces ................................................................................................................. 46
3.13 Agricultural land ............................................................................................................................ 48
   3.14 Healthy Communities .................................................................................................................... 50
4.0 THE NEW BERMUDA PLAN .................................................................................................................. 55
   4.1 Vision and Planning Strategies for the new Bermuda Plan ........................................................... 55
   4.2 Development Strategy .................................................................................................................... 55
   4.3 Conservation Strategy ..................................................................................................................... 56
   4.4 Community Strategy........................................................................................................................ 56
   4.5 Draft Bermuda Plan 2018 zonings, objectives and policies ........................................................... 57
5.0 SUMMARY AND NEXT STEPS............................................................................................................... 61
   5.1 Summary .......................................................................................................................................... 61
   5.2 The Draft Bermuda Plan 2018 ......................................................................................................... 61
   5.3 Review and monitoring of the new Plan ........................................................................................ 61
APPENDIX 1: SUMMARY OF MAIN PLAN CHANGES .................................................................................. 63

                                                           TABLE OF FIGURES
Figure 1: Work Programme for the new Bermuda Plan ............................................................................... 7
Figure 2: Bermuda Land Uses..................................................................................................................... 12
Figure 3: Population Trends 1950 to 2026 ................................................................................................. 13
Figure 4: Population by Age Group 2016 ................................................................................................... 14
Figure 5: Population by Parish ................................................................................................................... 15
Figure 6: Population Density by Parish....................................................................................................... 16
Figure 7: Population and Household trends ............................................................................................... 17
Figure 8: Number of Persons per household .............................................................................................. 18
Figure 9: Number of Residential Valuation Units ....................................................................................... 19
Figure 10: Residential Land Valuation Units by Parish............................................................................... 20
Figure 11: Number of Residential Valuation Units created 2006 to 2016 ................................................. 20
Figure 12: Percentage of Residential Valuation Units by Zone .................................................................. 21
Figure 13: Percentage of Residential Units by Zone 2006 to 2016 ............................................................ 22
Figure 14: Residential Completions 2006 to 2016...................................................................................... 23
Figure 15: Visitor Arrivals 2006 to 2016 ..................................................................................................... 27
Figure 16: Tourism Accommodations 2006 vs 2017 .................................................................................. 28
Figure 17: Number of Jobs filled by Employment Sector ............................................................................ 30
Figure 18: Planning Applications 2006 to 2016 ......................................................................................... 31
Figure 19: Mixed Use and Commercial Zones ............................................................................................ 32
Figure 20: Occupied and Vacant Units in Commercial and Mixed Use Zones ............................................ 33
Figure 21: Occupied and Vacant square feet by Commercial and Mixed Use Zone................................... 33

                                                                            2
Figure 22: Industrial zoned sites ................................................................................................................. 35
Figure 23: Industrial Zones by Parish ......................................................................................................... 36
Figure 24: Road Fatalities 2008 to 2017 .................................................................................................... 38
Figure 25: Bermuda's network of sidewalks .............................................................................................. 39
Figure 26: Sidewalk coverage by Parish/Town........................................................................................... 40
Figure 27: 'The Finger', Southside .............................................................................................................. 41
Figure 28: Bermuda Department of Airport Operations Obstacle Limitation Surfaces ............................. 42
Figure 29: Listed buildings by Parish .......................................................................................................... 43
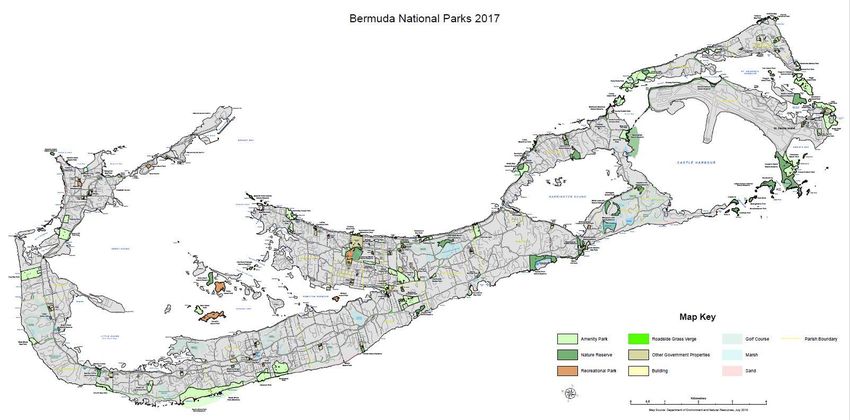
Figure 30: Bermuda's National Parks ......................................................................................................... 47
Figure 31: Distribution of fresh fruit and vegetable stores and vendors ................................................... 51
Figure 32: Healthy food stores and vendors by Parish ............................................................................... 52
Figure 33: Draft Bermuda Plan 2018 Development and Conservation Base Zones ................................... 58
Figure 34: Draft Bermuda Plan 2018 vs Bermuda Plan 2008 Base Zones .................................................. 59
Figure 35: Draft Bermuda Plan 2018 and Bermuda Plan 2008 Conservation and Protection Areas ......... 60
3
4
1.0 INTRODUCTION

1.1 Background and Purpose of this Report

The Bermuda Plan 2008 became operational as a Draft Plan on 6th June 2008 and, after public
consultation and a Tribunal Inquiry, was formally adopted in June 2010. Given that the
Bermuda Plan 2008 is 10 years old, it is important to review and update it to reflect the current
circumstances and land use issues affecting the Island.

This Review and Strategy report constitutes the formal review of the Bermuda Plan 2008 and
the Report of Survey as required by section 9(1) and section 6(5) of the Development and
Planning Act 1974 respectively. This review includes consideration of suggested amendments
to objectives, policies and zonings from the public, agents, stakeholders and other consultees as
well as amendments required to reflect changing circumstances, Government priorities and
projects, and new legislation. It assesses whether the Bermuda Plan 2008 has been successful
in achieving its stated objectives and identifies where refinements are required to the
objectives, policies and zonings.

This report also provides an overview of development trends in the last 10 years and a strategy
for planning for Bermuda’s sustainable growth to provide for the needs of Bermuda’s residents
for the next 10 to 15 years.

The new Bermuda Plan has been prepared in accordance with the provisions of Part III of the
Development and Planning Act 1974. The Bermuda Plan 2018 is the sixth development plan of
the Island and will supersede the Bermuda Plan 2008. It covers the entire Island except for the
City of Hamilton which is subject to the provisions of the City of Hamilton Plan 2015 and the
City of Hamilton Plan 2001.

                                                5
6
2.0 PREPARING A NEW BERMUDA PLAN

2.1 Work Programme

Figure 1 below illustrates the key milestones in the work programme for the review of the
Bermuda Plan 2008 in 2016/7 and the preparation of the new Bermuda Plan 2018 in 2018/19.

Figure 1: Work Programme for the new Bermuda Plan

                                              7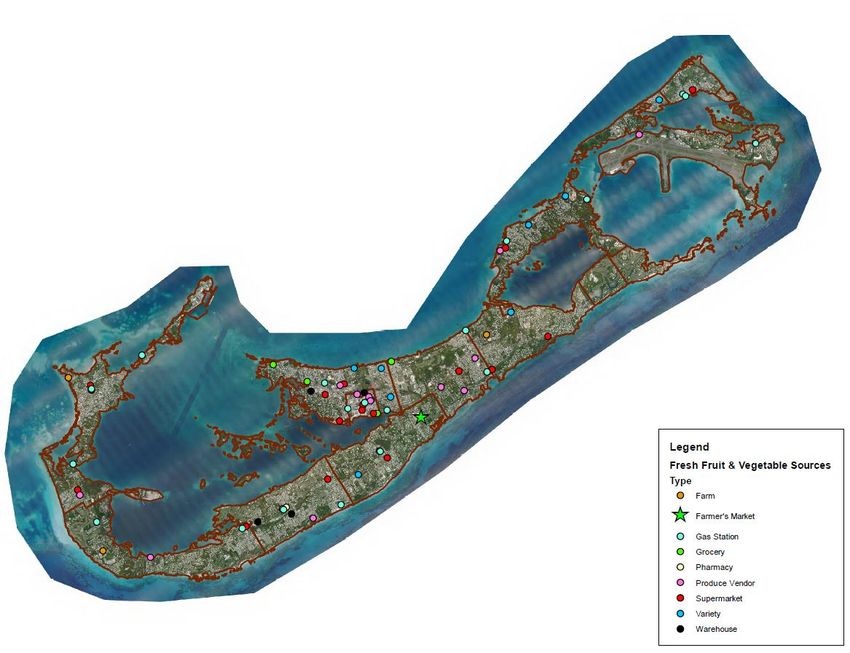
2.2 Public Consultation
The Forward Planning Section started the process of reviewing the Bermuda Plan 2008 in June
2016. This process included internal meetings with technical officers within the Department of
Planning as well as other Government Departments, meetings with key stakeholders and NGOs,
feedback from workshops, and the review of submissions from the public and agents for
suggested amendments to the zoning of properties and to planning policies.
2.2.1 Rezoning requests and other submissions
Agents and members of the public were invited to submit rezoning and policy amendment
requests as part of this initial public consultation process to review the Bermuda Plan 2008 and
to help inform the preparation of a new Draft Plan. The Department of Planning received 208
rezoning requests by the 31 March 2017 deadline.
Of the 208 requests, 177 or 85% them involved the rezoning of conservation land. A few of
these requests involved the swapping of areas to be zoned for conservation with no net loss of
conservation land but the majority requested the complete or partial removal of conservation
land.
Of these 177, 68 requests involved the removal of Agricultural Reserve. All of these requests
required consultations with the Government Conservation Officer and Government Agricultural
Officer. The main arguments presented in the submissions for the removal of the Agricultural
Reserve were as follows:
the land has not been used as arable land ever/for a long time;
the property owner wants to build on the land;
it is not practical or functional to retain small pockets of Agricultural Reserve;
it is unrealistic to cultivate the land given the site configuration, topography and
roadway/access limitations;
questions regarding how much land is required to be retained for growing foods to
sustain the population;
questions regarding the legalities and practicalities of putting small parcels of land into
production and how we can force people to do this.
Of the remaining 31 non-conservation land related rezoning requests, 12 submissions
requested to keep the zoning the same and 19 requests involved the rezoning of development
lands from Rural to Residential 1 or Residential 2, or from Residential to Industrial, Commercial
or Mixed Use.
A quarter of the rezoning requests submitted by the agents were resubmissions of previously
unsuccessful objections to the Draft Bermuda Plan 2008. There was also a request to create a
new coastal residential zone to allow for further development of residences located in Coastal
areas and on small islands.
8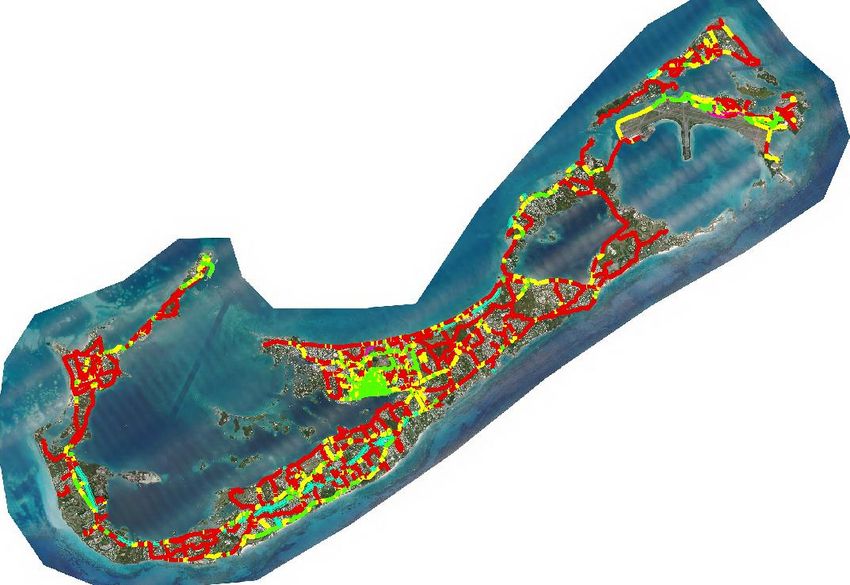
The Bermuda National Trust and Bermuda’s Environmental Sustainability Task force reviewed
the rezoning requests, and submitted comments to the Department of Planning. These
included the need for the new Bermuda Plan to retain existing conservation lands, retain
coastal reserve zoned areas and require the replacement of any conservation areas that are
developed. It was also suggested that the Department should require greater setbacks for
industrial sites located next to conservation areas.
2.2.2 Review of rezoning requests and submissions
The Department’s approach to assessing the 177 rezoning requests involving conservation land
was to not support the removal of any conservation zone or conservation areas unless there
was planning merit or the site specific circumstances suggested that the rezoning would be
logical, for instance if:
a building has been built with planning approval in the conservation zone/area; or
it seems reasonable to remove the conservation zoning to allow for a 15 feet buffer
from an existing building line; or
the conservation zone/area is replaced with new and similar/larger sized conservation
zone/area in a more suitable or feasible location on the property.
In reviewing the rezoning requests involving the removal of Agriculture Reserve, the
Department considered it important to retain these areas as conservation land. Even if not
currently used for arable purposes, they nevertheless provide valuable amenity areas, and
future reserves for potential use as agriculture, horticulture, potted plants and home gardens. It
is hoped that incentives can be offered to farm agricultural land to improve the Island’s food
security.
The Department supports the need to minimize potential conflicts between incompatible land
uses particularly where there could be environmentally damaging impacts. As such, a policy
has been also added to the new Plan requiring a 20 ft setback for buildings and uses in
industrial zoned areas where the lot line is shared with a Nature Reserve, Park or Recreation
zone.
2.2.3 Further public input
Once the Draft Plan is published, there is a minimum two month formal public consultation
phase, as required by the Development and Planning Act 1974. During this period, there will be
exhibition booths staffed with technical officers on hand to answer questions about the new
Plan. There will be an online Citizen Self Service site for members of the public to submit
formal objections and representations regarding the Draft Plan to the Department of Planning.
910
3.0 KEY ISSUES FACING BERMUDA

3.1 Bermuda in the global context

Over the last 10 years, Bermuda has experienced a major economic recession and recovery.
Bermuda’s economy was severely affected by the 2008/2009 financial crisis and subsequent
five year global recession. Since 2012, however, Bermuda has seen consecutive growth each
year. International business and tourism remain the two main pillars of Bermuda’s economy.

Climate change has become increasingly more significant and is now seen as many countries’
greatest challenge. Bermuda’s vulnerability to climate change is particularly acute given its small
size, low lying topography, location in the Atlantic ‘Hurricane Alley’, high population density and
high reliance on food and oil imports.

In the USA and Europe, with rising concerns about health costs, there has been greater emphasis
on the need to integrate health and planning agendas, and to build healthier communities.

Sustainable development principles are still very germane globally as well as locally and
continue to underlie the importance of carefully balancing Bermuda’s environmental, economic
and social needs.

3.2 Current land uses

Bermuda’s total land resources amount to 13,247 acres. This figure has been revised since the
2008 Plan to reflect the more accurate 2012 coastal boundary of the Island. Due to a very
limited land mass, competition for different land uses including residential, industrial, schools,
parks and recreational spaces, as well as the potential incompatibility of some adjacent land
uses, are contentious issues. The challenge of any development plan is to balance the varying
economic, environmental and social interests to sustain and support the Island’s current and
future population.

According to the Land Use Survey conducted by the Department of Planning in 2016 (see Figure
2), 47% of Bermuda’s land is used for residential purposes which is a 3% increase since 2001.
Open Space land including National Parks, Nature Reserves, rural areas, golf courses and other
recreational areas comprise 33% of the land which is the same percentage as in 2001. The
percentage of land used for Tourism has decreased by 2% since 2001 to total just 2% in 2016.

                                                11
Bermuda Land Use Survey 2016
2%
4%
2%
6%
Commercial
4%
Industrial
33%
Institutional
Utilities
Vacant
Residential
2% 47%
Tourism
Open Space
Figure 2: Bermuda Land Uses
123.3 Population and Housing
3.3.1 Population trends
Figure 3 below shows Bermuda’s population growth since the 1950s. Since 2010, for the first
time, Bermuda has been experiencing a decline in its population. In 2016, Bermuda had a
resident population of 63,791, a population decrease of 1% since 2010.
Bermuda’s population is expected to decline further as net emigration exceeds natural
increases. Bermuda’s demographic profile is expected to be one of fewer children, an older
workforce and more elderly people. Population projections produced by the Department of
Statistics in October 2018 show a population of 63,791 in 2016 and a decline in population to
reach 63,680 by 2026 (see Figure 3).
Population of Bermuda
67,000
CENSUS PROJECTED
62,000
57,000
52,000
Population
47,000
42,000
37,000
32,000
0
1950 1960 1970 1980 1990 2000 2010 2020 2030
Year
Sources: Population and Housing Censuses and Population Projections
Figure 3: Population Trends 1950 to 2026
In 2016, Bermuda’s population 65 years and older represented 17% of the population, a 3%
increase in this age group since 2010 and the third largest age cohort (see Figure 4). The
Department of Statistics projects that the proportion of seniors will climb to 25% of the
population by 2026. This growth in the elderly population will result in more and more demand
for seniors’ housing, senior citizen daycare programmes and health care.
13Bermuda's Population by Age Group in 2016
17
32
Age groups
22
15
15
0 5 10 15 20 25 30 35
%
65+ 45-64 30-44 15-29 0-14
Source : Department of Statistics, Census of Population and Housing 2016
Figure 4: Population by Age Group 2016
14Of the nine parishes, Pembroke Parish retained the largest share (17%) of the population in
2016. The parishes of Pembroke, Smiths and Warwick had the most significant population
gains since 2010, and the two most remote parishes, St. George’s and Sandys, experienced the
greatest losses in population since 2010 (see Figure 5).
Population by Parish
14,000
12,000
10,000
8,000
6,000
4,000
2,000
0
1991 2000 2010 2016
Source: Department of Statistics - Censuses of Population and Housing 1991, 2000, 2010 and 2016
Figure 5: Population by Parish
15Bermuda’s population density decreased to 3,086 persons per square mile in 2016 from 3,097
in 2010. Pembroke Parish is the most densely populated parish with 5,289 persons per square
mile and St. George’s Parish is the least densely populated parish with 1,447 persons per square
miles (see Figure 6).
Population Density by Parish
6,000
5,000
4,000
3,000
2,000
1,000
0
1991 2000 2010 2016
Source : Department of Statistics - Censuses of Population and Housing 1991, 2000, 2010 and 2016
Figure 6: Population Density by Parish
163.3.2 Household Trends
Whilst Bermuda’s population since 2010 has been shrinking, the number of households have
progressively increased (see Figure 7). During the period from 2010 to 2016, there was a 4.7%
increase in the total number of households from 26,923 to 28,192.
Bermuda's Population and Households
70,000
60,000
50,000
40,000
30,000
20,000
10,000
0
1950 1960 1970 1980 1990 2000 2010 2020
Population Households
Source: Department of Statistics - Censuses of Population and Housing
Figure 7: Population and Household trends
The average size of household has fallen from 2.47 in 2000, to 2.39 in 2010 to 2.26 in 2016. In
the 2016 Census, for the first time, the number of one person households (34%) outnumbered
the number of two person households (31%) to become the most common household size (see
Figure 8).
With an increasing trend towards small-sized households, this will inevitably place greater
pressure on the need for more affordable, single person housing. The residential policies of the
new Bermuda Plan address this issue by providing for higher density residential development in
and around commercial centres, higher residential densities for the provision of affordable
housing, and a relaxation on the provision of private outdoor living space and/or communal
space for the repurposing existing buildings for residential uses.
17Number of Persons per household
10000
9000
8000
7000
6000
5000
4000
3000
2000
1000
0
1 2 3 4 5 or more
Census 2000 Census 2010 Census 2016
Source: Department of Statistics - Censuses of Population and Housing
Figure 8: Number of Persons per household
The 2016 Census results indicate that two bedroom dwellings continue to comprise over one
third (36%) of all dwelling types. One bedroom dwellings comprise just under a quarter (24%)
and three bedroom dwellings comprise just over a quarter (29%) of all dwellings.
3.3.3 Residential development trends
The Department of Land Valuation data indicates that in 2016 there were 32,136 Residential
Valuation Units (RVUs) in Bermuda. This compares to the 28,192 households reported in the
Census 2016. The difference between the number of RVUs and the number of households can
be variously interpreted as a vacancy rate or a housing surplus. For instance, property-owners
may create an additional apartment only to register another vehicle or may have an existing
apartment but decide to leave it vacant. Alternatively, a property with an apartment may be
owned by a non-Bermudian who is not permitted to rent it. In 2016, this surplus housing stock
amounted to approximately 12% of all RVUs.
Of the 32,136 existing RVUs, 2,446 were created between 2006 and 2016, an average of 245
new RVUs created each year (see Figure 9).
18Number of Residential Valuation Units
32,500
32,000
31,500
31,000
30,500
30,000
29,500
29,000
28,500
28,000
2006 2008 2010 2012* 2014 2016
*Year at 31 Dec. for each year except 2012 which is May
Source: Department of Land Valuation
Figure 9: Number of Residential Valuation Units
Figure 10 shows the distribution of Residential Valuation Units throughout the Parishes.
Pembroke Parish has the highest number of RVUs at 5,972. Warwick Parish has the second
highest number of RVUs (4,707) and has had the highest growth rate of 12% new RVUs since
2006 (see Figure 11).
19Residential Land Valuation Units by Parish
7000
6000
5000
4000
3000
2000
1000
0
2006 2016
Figure 10: Residential Land Valuation Units by Parish
Number of Residential Valuation Units created
between 2006 and 2016 by Parish
600
524
500
400
318 311
300 245 257 260
197 187
200 147
100
0
Figure 11: Number of Residential Valuation Units created 2006 to 2016
20The Bermuda Plan 2008 designates 5,772 acres of land (almost half the Island) as Residential 1
(high density residential) and Residential 2 (low/medium density residential). In addition, the
Rural zoning, of which there is 642 acres, allows for some limited residential development.
Currently, 93% of RVUs are located within a Residential zone of which 72% are located within a
Residential 1 zone and 21% are located within a Residential 2 zone (see Figure 12).
% Residential Valuation Units by Zone
Residential 1
0% 0%
Residential 2
0%
0% Tourism
0% 0%
Rural
1% 0% 0%
Open Space Reserve
1% 2%
1%
2% Coastal Reserve
Mixed Use
Commercial
Institutional
21%
Industrial
72%
Park
Recreation
Special Study Area
Nature Reserve
City of Hamilton
Source: The Departments of Planning and Land Valuation data
Figure 12: Percentage of Residential Valuation Units by Zone
Of the 2,339 new RVUs built between 2006 and 2016, 61% were built on land zoned as
Residential 1, 20% within a Residential 2 zone, 7% within a Tourism zone and 1% within a Rural
zone (see Figure 13).
Surprisingly 6.3% or 147 of new RVUs were built within Open Space Reserve and Coastal
Reserve Conservation Zones which allow only limited development. However, further analysis
of this indicates that the majority of these new RVUs were built at two specific developments -
Grand Atlantic in Warwick (Coastal Reserve) and Victoria Place/Row near Dockyard (Open
Space Reserve) which was the subject of a Special Development Order.
21% Residential Valuation Units by Zone
2006 to 2016
1% 0% 0% 0%
1%
0% 0% Residential 1
3%
Residential 2
3% Tourism
4%
City Plan 2001
7% Open Space Reserve
Coastal Reserve
61% Rural
20%
Commercial
Recreation
Mixed Use
Industrial
Park
Nature Reserve
Source: The Departments of Planning and Land Valuation
Figure 13: Percentage of Residential Units by Zone 2006 to 2016
During the construction boom of the 1980s, an average of 500 new residential units were built
annually whilst the recession in the early 1990s saw a drop to an annual average of 265 new
residential units being built over this decade. In the early 2000s, the rate of construction begun
to increase as demand for housing increased, fuelled by a strong economy and low interest
rates. As shown in Figure 14, there was a peak of nearly 400 new residential units in 2011.
However, residential completions have fallen dramatically in recent years to less than 100 each
year since 2014.
In addition, whilst new residential units historically comprised a high proportion of new builds,
since 2013 a greater proportion have been conversions of or additions to existing buildings.
22Residential Completions 2006 to 2016
450
400
350
300
250
200
150
100
50
0
2006 2007 2008 2009 2010 2011 2012 2013 2014 2015 2016
Total new residential units New Build Conversions/Additions
Source: Department of Plannng
Figure 14: Residential Completions 2006 to 2016
3.3.4 Residential on Tourism zoned land
Bermuda’s tourism industry has faced challenges over the last two decades which has resulted
in many hotel properties either converting to residential use or existing hotels supplementing
their operations with condominium developments. Condominium developments are sold into
the local or overseas market for permanent occupation or as fractional units which are directed
almost exclusively at the overseas second home market. The fractional units do not receive
assessment numbers from the Department of Land Valuation. The residential units, however,
are added to the stock of local housing and qualify for assessment numbers.
Although a number of tourism establishments had already been converted to residential uses
when the Bermuda Plan 2008 was being drafted, the Ministry of Tourism at that time only
supported the rezoning of one tourism zoned property to a Residential zoning.
In 2016, there were 483 residential land valuation units located on Tourism zoned land, 7% of
which have been built since 2006. In the new Bermuda Plan, the 13 Tourism properties which
are zoned as Tourism in the Bermuda Plan 2008 will be rezoned either fully or partially to a
Residential zoning to reflect their current use. The sites which will be completely rezoned from
Tourism to Residential include Sandsong Villas, the Breakers, Sea Cliffs, the Wharf, Harbour
Gardens, Loughlands, White Sands/Grape Bay Hotel, Salt Kettle Guest House, Palmetto Gardens
23and Somerset Bridge Guesthouse. The sites which will be partially rezoned from Tourism
include the Harmony Club, Pink Beach and Tucker’s Point. The Southlands site will be rezoned
from Tourism, Residential and Open Space Reserve to Park and Waterloo House will be rezoned
from Tourism to Commercial. There will also be an extension to the existing Tourism zoning at
the St. Regis hotel site in St. George’s. In total, there will be a net loss of approximately 38
acres of Tourism zoned land in the new Bermuda Plan.
3.3.5 Residential in commercial and mixed use zones
The Bermuda Plan 2008 initiated alternative approaches to providing land for residential uses
to help alleviate pressure on Bermuda’s diminishing land resources. In particular, it sought to
promote the establishment of sustainable live/work/play communities, mixed use
development areas and higher density residential areas near commercial centres and public
transport nodes. According to the Land Use Survey 2016, there are 250 residential units
located within Mixed Use and Commercial zones. This has helped to alleviate pressure on
Bermuda’s diminishing land resources as well as reduce car use and traffic congestion. The
new Bermuda Plan will continue to support the development of residential uses in the
commercial hubs outside of the City.
3.3.6 Population and Housing forecasts
Population and housing forecast data is essential in the preparation of any new development
plan to ensure that there is sufficient land available for residential development to meet
projected populations.
The Department of Statistics Census 2016 data indicates that Bermuda’s population has
declined by 1% since 2010, and population projections to 2026 indicate that the population will
continue to decrease.
The population is also gradually ageing which places a greater demand on health care services,
and, coupled with a decreasing population, means that the workforce is diminishing which
provides Bermuda with some long-term challenges.
According to the Census 2016, there has been a further decrease in household sizes and a 4.7%
increase in the number of households with a 3% increase in the number of one person
households. It is expected that this trend towards smaller household sizes and a greater
proportion of one person households will increase.
A further 4.7% increase in the number of households six years from 2016 would bring the total
number of households to 29,517 by 2022 or an additional 1,325. If this 4.7% increase was
sustained for another six years from 2022, there would be a further 1,387 households by 2028.
These are rudimentary estimates based on recent trends; however, they assist in determining
the level of demand for new housing during the lifetime of the new Plan and it is anticipated
that the Department of Statistics will be providing more accurate long term population and
24household forecasts.
3.3.7 Residential land supply and demand
In order to determine the amount of land that is currently available for residential
development, the Department of Planning examined the current number and size of vacant lots
that have a residential zoning (Residential 1, Residential 2 or Rural in the Bermuda Plan 2008),
and how much of this land is unencumbered by Conservation Areas and therefore has the
potential for residential development.
The Department of Planning’s records indicate that there are a total of 1,171 vacant parcels of
land. This figure excludes vacant brownfield sites and legal subdivisions (some prior to 1974)
that the Department of Planning has no records for. Overall there are 874 acres of vacant land,
of which 493 acres (or 931 vacant parcels) are zoned Residential 1, Residential 2 or Rural. The
majority of these 931 vacant parcels are Residential 1 zoned lots (42%) which are 6000 sq.ft. or
over in size and 25% are Residential 2 zoned lots over 18,000 sq.ft. in size and therefore meet
the minimum Residential 1 and Residential 2 lot size requirements of the Bermuda Plan 2008.
Thirty seven percent of these 931 vacant parcels are impacted by a Woodland Reserve and/or
Agricultural Reserve Conservation Area which limits their development potential. However, in
many cases, the amount of land within these lots that is covered by a Conservation Area is
marginal. There are 582 parcels or 181 acres of vacant Residential 1, Residential 2 or Rural land
that have no Conservation Area development restriction, the majority of which are located in
Sandys Parish.
Based on the current maximum densities permitted for the vacant Residential 1 lots which are
6,000 sq.ft. or over, it is estimated that there is capacity for an additional 1,164 dwelling units.
For those vacant Residential 2 lots between 12,000 sq.ft. and 18,000 sq.ft., there is capacity for
an additional 116 dwelling units and a further 472 dwelling units on those Residential 2 lots
over 18,000 sq.ft. There is capacity for an additional 12 dwelling units on Rural zoned vacant
sites of 4 acres or over in size. Therefore, it appears that there is the capacity for an additional
1,764 dwelling units on currently vacant registered Residential 1, Residential 2 and Rural lots.
Another means of calculating whether housing land supply will meet housing demand during
the lifespan of the plan is to consider recent residential build rates. The data collected in this
regard shows that there has been a dramatic drop in new build properties over the last 10
years, with the most significant drop having occurred since 2011. Whilst a range of factors will
have contributed to this, the most common cause is likely to be the increasing difficulties
associated with accessing finance for both builders and purchasers as a result of the global
financial recession.
From the information available, build rates show a significant drop off in new build residential
units leading up to 2016 where there was a total of 57 new residential units established,
25including 43 from conversions or additions to existing properties and only 14 new units. A 10
year average from 2007 to 2016 indicates that 2,333 units were built, resulting in a 10 year
average of 233.3 units per annum. As previously indicated, there is capacity for 1,764
residential units within the plan period which therefore equates to a land supply of 7.6 years if
the 10 year average is maintained. There are two major issues with using the 10 year average;
build rates fluctuated wildly during this period and there has been a significant drop off in
recent years, meaning that this average build rate is unrepresentative of current realities.
Nevertheless, there would still be sufficient supply. A more realistic timescale to consider is the
5 year average from 2012 to 2016 as this represents more recent development activity. During
this time period, a total of 594 units were built, giving an average of 118.8 units per annum. If
this average ‘build’ rate continued, there would be capacity for 14.8 years (1764 / 118.8) of
residential development, comfortably exceeding the 5 year review period for the plan.
It is important to also factor in the City of Hamilton for further potential residential
development. The City of Hamilton Plan 2015 recognises that residential development is an
essential component of revitalising the City. The City Plan encourages the adaptive reuse of
vacant and underused commercial floorspace for residential use and/or for shared live/work
use as well as new purpose built residential development as a means of alleviating the pressure
to develop on open space elsewhere on the Island.
The data analysis for housing demand and supply therefore indicates that there is ample land
available to meet housing demands for the next 10 years within existing residential zoned areas
(including yet-to-be activated planning approvals and potential additional infill development) as
well as the Mixed Use Zones and the City of Hamilton, and that it is not essential to zone any
new lands as Residential.
Despite the considerable capacity in the current supply of residential land, the new plan will
include new additional residential zonings at Morgan’s Point and Tudor Hill as there is planning
merit in both of these instances, and will also allow for the development of other compatible
uses. The inclusion of these sites further emphasizes that there is no need to identify new
residential zonings, particularly where such zonings would result in the loss of precious
remaining conservation land.
3.3.8 Cycle Only Apartments
The Throne Speech in November 2017 stated that the Government would create a new
category of dwelling unit that has an assessment number but will be restricted from having a
private car registered to the address. The purpose of this initiative is to ‘stimulate construction
demand and provide homeowners with additional income’.
The Bermuda Plan 2008 and the City of Hamilton Plan 2015 already contain parking policies that
allow the Board the discretion to permit residential units to have less parking than the one car
parking space per residential unit that is normally required. However, the new Bermuda Plan
26will be updated to add a specific category of restricted residential unit that requires no car
parking space and a minimum of one cycle parking space per dwelling unit. A Certificate of
Completion and Occupancy issued for this type of residential development will be given an
‘Apartment (Cycles Only)’ Certificate.
This new category of residential unit could potentially allow for the construction of more
residential additions than might have previously been allowed under the currently planning
policies and address the need for more affordable residential units.
3.4 Tourism Development
Tourism remains Bermuda’s second largest source of revenue after international business with
visitor expenditure totaling $398.3 million in 2016. The number of visitors has fluctuated
somewhat over the last 10 years but 2016 saw an increase in air visitors and cruise visitors (see
Figure 15).
Visitor Arrivals
700,000
600,000
500,000
400,000
300,000
200,000
100,000
0
2006 2007 2008 2009 2010 2011 2012 2013 2014 2015 2016
Air Cruise
Source: The Department of Statistics
Figure 15: Visitor Arrivals 2006 to 2016
The Ministry of Tourism records shows that the number of tourism establishments dropped by
15 from 57 in November 2006 to 42 in October 2017. There has also been a decline of 416
tourism units and a decline of 1,157 licensed bed counts.
27Whilst the number of large hotels has remained the same at 4, there has been a drop of 136
units and 687 licensed bed counts. However, whilst the number of small hotels has also
remained at 10, the number of tourism units in small hotels has increased by 79 and the
number of licensed bed counts in small hotels has increased by 329 (see Figure 16).
Tourism Accommodations - 2006 vs 2017
12 1,600
1,400
10
No. of establishments
1,200
8
No. of units
1,000
6 800
600
4
400
2
200
0 0
No. establishments in Nov. 2006 No. establishments in Oct. 2017
No. units in Nov. 2006 No. units in Oct. 2017
Source: Ministry of Tourism
Figure 16: Tourism Accommodations 2006 vs 2017
As detailed in section 3.3.4 of this report, there has been a trend towards more and more
tourism properties converting to residential uses, many of which are now established
residential communities. As such, these properties will be rezoned from Tourism to Residential
in the new Bermuda Plan.
There is anecdotal information to suggest that the significant rise in vacation rentals (through
websites such as Airbnb) may be one of the reasons why tourist numbers have stabilised whilst
other forms of tourist accommodation are decreasing. The rise in Airbnb was instigated
through the America’s Cup in 2017 and has led to some properties being moved into long-term
rental market in pursuit of the potential higher profits as short-term holiday lets.
28Vacation rentals typically are located within existing residences which are predominately
located within residential areas. Current planning policy permits tourism accommodation
within residential areas providing there are no detrimental impacts and the new Bermuda Plan
will continue to support this.
Vacation rentals are a growing and important part of Bermuda’s tourism economy, and it is
necessary for Bermuda to legislatively define vacation rental property to remove bureaucratic
restrictions and develop a light-touch regulatory approach. Vacation rentals legislation will be
enacted to enable the Government to better support the vacation rental sector to the benefit
of Bermudian homeowners, service providers and entrepreneurs.
3.5 Economic Development
Bermuda is one of the leading global reinsurance providers with one third of the top global
reinsurance companies managed, owned and operated in Bermuda. The Ministry of Finance
estimates that Bermuda’s GDP in 2017 increased by 0.75% to 1.25% due to an increase in many
of the major economic indicators such as employment, employment income, air and cruise ship
visitors, new construction projects and retail sales. In addition, according to the Department of
Statistics Employment Brief (May 2017), Bermuda’s job market saw its first increase in 8 years
in 2016 with the number of filled jobs rising 0.5% from 33,319 in 2015 to 33,481 in 2016.
As shown in Figure 17, the employment sectors which saw the greatest increases were
restaurants/cafes/bars (+10%), other community, social and personal services (+5%), retail
(+4%) and wholesale trade (+4%). Employment in these sectors most likely grew as a direct
result of employment related to the 2017 America’s Cup. The public administration
employment sector saw the greatest loss of 169 jobs (-4%) which reflects the decline in
teachers and police officers.
29Number of Jobs filled by Employment Sector
2000 to 2016
5,000
Agric., Fish., Min. & Qry
Manufacturing
4,500
Electricity, Gas & Water
4,000 Construction
Wholesale Trade
3,500
Retail Trade & Repair Svcs.
3,000 Hotels
Restaurants, Cafes, Bars
2,500
Transport & Communication
Financial Intermediation
2,000
Real Estate & Renting
Activities
1,500 Business Services
Public Administration
1,000
Education, Health, Social
Work
500 Other Community, Social,
Personal Services
International Business
Activity
-
2003
2000
2001
2002
2004
2005
2006
2007
2008
2009
2010
2011
2012
2013
2014
2015
2016
Source: The Department of Statistics
Figure 17: Number of Jobs filled by Employment Sector
The state of Bermuda’s economy is often reflected in the level of construction activity on the
Island as well as the volume of planning applications received by the Department of Planning.
From the mid-1990s to the mid-2000s, the number of planning applications received averaged
just over 1,000 a year, 54% of which were for some form of residential development ranging
from small extensions to large condominium complexes. As shown in Figure 18, the
Department of Planning received the highest numbers of planning applications in 2006 and
2007 with 1,513 planning applications and 1,531 planning applications respectively. In the last
10 years, however, there has been a gradual decline in the number of planning applications
reaching a low of 839 applications in 2012.
30Planning Applications 2006 to 2016
1,800
1,600
1,400
1,200
1,000
800
600
400
200
0
2006 2007 2008 2009 2010 2011 2012 2013 2014 2015 2016
Total Approved in Full Approved in Principle Refused GDO
Applications
Source: The Department of Planning
Figure 18: Planning Applications 2006 to 2016
Most of the Island’s commercial space is located in the City of Hamilton. According to Coldwell
Banker Bermuda Realty (January 2018), the commercial real estate sector continues to face
challenges. The supply of vacant or under-rented office accommodation is estimated to be in
excess of 500,000 square feet, most of which is categorized as second tier space. The City of
Hamilton Plan 2015 includes policies to encourage the adaptive reuse of vacant and under-used
commercial floorspace for residential uses and/or for shared live/work uses.
There are a number of commercial centres outside the City of Hamilton including Dockyard,
Somerset Village, Somerset Road, Riddlell’s Bay, Warwick Central, Flatts Village, Paget Plaza,
Paget Central, Collector’s Hill, Brighton Hill, Shelly Bay Plaza, Southside and the Town of St.
George’s. The Bermuda Plan 2008 sought to encourage mixed use and commercial
development in these commercial centres as a means of decentralizing some of the commercial
development and associated traffic from the City of Hamilton.
The Bermuda Plan 2008 created three Mixed Use Zones at the Town of St. George, Dockyard
and Southside totaling 142 acres. The Town of St. George is a UNESCO World Heritage Site and
a popular tourist destination. In 2016/17, Dockyard was the centre of attention leading up to
and during the America’s Cup, and Dockyard gained 9 acres of reclaimed land at Cross Island.
Southside has not seen much development over the last 10 years and with the closing of
Whites supermarket in 2012, this area is in need of revitalization. The Government’s vision is to
31transform Southside into a technology-based community with associated office and residential
uses.
The Mixed Use zoning has provided flexibility to accommodate a variety of uses including
commercial, residential, tourism and light industrial uses in these three main commercial areas
outside the City. The other commercial hubs across the Island generally feature clusters of
shops and are designated as Commercial Zones.
A survey of these commercial centres in May 2018 showed that within the 142 acres of land
designated as Mixed Use, there are 438 units occupying 1,162,023 sq.ft. of which 30% are retail
units, 7% are office units and 27% are residential units. There is an 86% occupancy rate in the
Mixed Use zones with 61 units vacant, 40 of which are in the Town of St. George and 20 of
which are in Southside (see Figure 19).
Figure 19: Mixed Use and Commercial Zones
Within the 66 acres of land designated as Commercial zone, there are 425 units occupying
2,069,302 sq.ft. of which 30% are retail units, 28% are office uses and 31% are residential units.
There is an 88% occupancy rate in the Commercial zones with 52 vacant units, 23 of which are
32in Somerset Middle Road commercial centre and 14 of which are on East Broadway. The
commercial centres at Brighton Hill, Collectors Hill and Shelly Bay Plaza have 100% occupancy of
their units (see Figure 20).
Figure 20: Occupied and Vacant Units in Commercial and Mixed Use Zones
As shown in Figure 21, there is just over 140,000 sq.ft. of vacant floorspace in the Mixed Use
zones and just under 70,000 sq. ft. of vacant floorspace in the Commercial zones.
Occupied vs Vacant Square Feet by
Commercial and Mixed Use Zones
3,500,000
Occupied (Square Feet) Vacant (Square Feet) 3,021,196
3,000,000
2,500,000
1,999,312
Square Feet
2,000,000
1,500,000
1,021,883
1,000,000
500,000 210,129
140,140 69,989
0
Mixed-Use Commercial Total
Figure 21: Occupied and Vacant square feet by Commercial and Mixed Use Zone
33It is interesting to note that despite the total acreage of Mixed Use zoning being twice as much
as the acreage of land designated as Commercial zone, the amount of built floorspace with the
Mixed Use zones is half that of the Commercial zones. This indicates that there is significant
potential within existing Mixed Use zones to increase building heights and provide greater
development potential within them. Despite this, there will be some additional areas of Mixed
Use zoned land in the new Bermuda Plan. The new 9 acre site at Cross Island which
accommodated the America’s Cup Village in 2017 will be zoned Mixed Use. In addition, some
Industrial zoned areas at Dockyard and Southside are likely to be rezoned to Mixed Use to
provide greater flexibility in uses permitted in these areas.
With existing potential space available within 9 out of the 12 Commercial zoned centres which
equates to nearly 70,000 sq.ft space as indicated in Figure 21, it is not envisaged that there is a
need to rezone any other areas as Commercial in the new Bermuda Plan.
In both the Mixed Use and Commercial zones, over a quarter of all units are used for residential
purposes. This indicates that these units have the potential to be converted to commercial
uses if needed.
The new Bermuda Plan will emphasise the need to provide greater accessibility and walkability
to these commercial areas especially from dense residential areas. In addition, as with the City
of Hamilton Plan 2015, new developments within Mixed Use and Commercial Zones will be
expected to contribute to aesthetic and functional improvements within the public realm of
these community hubs and a policy will be added in the new Plan to reflect this.
3.6 Industrial development
In 2016, there were 7,641 industrial related jobs (manufacturing, construction, wholesale trade
and motor vehicles, retail trade and repair) comprising 22% of all jobs filled. This is a significant
drop in the 9,189 industrial related jobs in 2005 which comprised 23% of all jobs filled.
The Department of Planning Land Use Survey 2016 showed that some 2% or 321 acres of land is
used for industrial purposes in Bermuda. However, the Bermuda Plan 2008 only zones 280
acres of this land as industrial. Whilst some sites have been used for industrial uses for many
years, they are not the most appropriate uses for these sites. Some industrial sites are zoned
Residential because they are located in the heart of dense residential areas whilst others are
zoned as Open Space and neighbour important conservation areas. These sites are considered
to be non-conforming and strict controls are in place to ensure that there is no further
intensification of industrial uses on these sites.
The types of industrial uses taking place on these sites include manufacturing, utilities (water
supply, gas and electricity), quarrying, wholesale/retail trade and repair services. The nature
34and potential impacts posed by industrial activity necessitate that they be carefully located in
order to preserve the residential amenity of neighboring areas.
There are currently 18 industrial zoned sites in the Bermuda Plan 2008 covering 280 acres (see
Figure 22). Six of these sites (17.88 acres) are restricted to light industrial development only as
they are located within residential areas. All other industrial zoned sites are located in
proximity to a main public road and on the periphery of residential areas. These locational
characteristics help to ensure that the amenity and environment of the surrounding areas are
not compromised and that there are no detrimental impacts from these industrial sites in terms
of traffic, safety, visual appearance, noise, vibration and emissions.
Figure 22: Industrial zoned sites
Each parish contains some Industrial zoned land, St. George’s having the most with 3 sites
totaling 89.59 acres, and Paget having the least with 3.29 acres at one location (see Figure 23
and Figure 24).
35Industrial Zones by Parish
78.28
80
70
60
50
Acres
40 35.15
31.89
30 22.0420.3 22.55
20
9.51 10.1 9.56 11.63
10 7.08 4.98
3.29 1.7 3.2 4.11 2.72 1.99
0
Dockyard
Bermuda Waterworks
Dunkley's Dairy
Lolly's Well
Government Quarry
SAL
Well Bottom
Mills Creek
Ferry Reach
Tyne's Bay
Orange Valley
Barritt's
Wilkinson Quarry
Southside
Harvey Road
Ruth's Bay
Devonshire Marsh
Hermitage Road
Figure 23: Industrial
Sandys Zones
South.W by Parish
ar.PagetPem. Devonshire Smiths Hamilton P. St. George's
The Department of Planning conducted a survey of all industrial zoned sites in May 2018 to
assess current occupancy and vacancy rates. Within the 280 acres of industrial zoned land
there is approximately 4.3 million sq.ft. of floorspace and 476 industrial related units. Of the
476 industrial units, 81 units are vacant amounting to 358,497 sq.ft. of available floorspace, the
majority of which is located at SAL and Southside.
Most of the other industrial sites are operating at an occupancy rate of over 80% with little
room for additional expansion other than in building height or to reconfigure existing lots to
better maximize their potential.
In 2017, the Department of Planning received 5 requests to rezone sites from either Residential
or Open Space Reserve to Industrial. These requests and associated comments submitted by
environmental groups, were assessed by technical officers to determine the feasibility of the
rezoning. None of the 5 requests were supported. The traffic impact of heavy commercial
vehicles on neighbouring residential areas, potential detrimental impact on the Devonshire
Marsh, and the residential nature of some of the sites were the main reasons for not
supporting these requests.
The Department of Planning also received requests to rezone areas at Southside and Dockyard
from Industrial to Mixed Use to allow greater flexibility in the type of uses that would be
permitted in these areas. These requests were supported in part.
36You can also read