The economic contribution of the screen industry
←
→
Page content transcription
If your browser does not render page correctly, please read the page content below

The economic contribution of the
screen industry
NZIER report to:
New Zealand Film Commission, Ministry of Business, Innovation and Employment,
the Ministry for Culture and Heritage, New Zealand On Air, Auckland Tourism,
Events and Economic Development, Wellington Regional Economic Development
Agency
November 2017


About NZIER
NZIER is a specialist consulting firm that uses applied economic research and analysis
to provide a wide range of strategic advice to clients in the public and private sectors,
throughout New Zealand and Australia, and further afield.
NZIER is also known for its long-established Quarterly Survey of Business Opinion and
Quarterly Predictions.
Our aim is to be the premier centre of applied economic research in New Zealand. We
pride ourselves on our reputation for independence and delivering quality analysis in
the right form, and at the right time, for our clients. We ensure quality through
teamwork on individual projects, critical review at internal seminars, and by peer
review at various stages through a project by a senior staff member otherwise not
involved in the project.
Each year NZIER devotes resources to undertake and make freely available economic
research and thinking aimed at promoting a better understanding of New Zealand’s
important economic challenges.
NZIER was established in 1958.

Authorship
This paper was prepared at NZIER by Michael Bealing and Todd Krieble. It was quality
approved by Laurie Kubiak.
The assistance of the following people is gratefully acknowledged:
 David Wright, Weta Digital                                       Catherine Bates, NZFC
 Kelly Martin, South Pacific Pictures                             Barrie Osborne, Producer
 Philly de Lacey, Screentime NZ                                   Lisa Chatfield, Pukeko Pictures
 Matthew Metcalfe, GFC                                            Kevin Jennings, Film Otago/Southland
 Dave Gibson, NZFC                                                Brad Hurndell, Shotover Camera Systems

L13 Willeston House, 22-28 Willeston St | PO Box 3479, Wellington 6140
Tel +64 4 472 1880 | econ@nzier.org.nz
© NZ Institute of Economic Research (Inc) 2012. Cover image © Dreamstime.com
NZIER’s standard terms of engagement for contract research can be found at www.nzier.org.nz.
While NZIER will use all reasonable endeavours in undertaking contract research and producing reports to ensure the
information is as accurate as practicable, the Institute, its contributors, employees, and Board shall not be liable (whether in
contract, tort (including negligence), equity or on any other basis) for any loss or damage sustained by any person relying on
such work whatever the cause of such loss or damage.

Executive summary
The economic contribution of the screen industry aims to showcase the economic
contribution of the New Zealand screen industry ecosystem by exploring three
themes. These themes are:
     •     What does the industry do for the economy?
     •     What does the industry do for skills and employment?
     •     What does the industry do for ‘NZ Inc.’?

The screen industry makes a strong economic contribution
The screen industry added $1.015 billion to real GDP in 2016.
The motion picture sub-industry, a component of the screen industry, is geared
towards exporting and its estimated contribution to export volumes is around $706
million annually. The motion picture sub-industry includes the production and
distribution of film, television, commercials and videos.
Without the New Zealand Screen Production Grant (NZSPG) scheme, exports would
shrink by $257 million, household consumption by $144 million and real GDP by $176
million. The NZSPG generates export revenue by attracting international firms to spend
in the New Zealand economy during production. This screen industry revenue was
considered to be exports in the same way as international visitor spending can be
described as tourism exports.

The screen industry has increased job stability, increased wages and
well paid visual effects jobs
There were 14,000 people working in the industry in 2015.
The number of jobs or contracts per person was two in 2006, and 1.76 in 2015.
Median earnings in the industry are growing faster than the average for the New
Zealand economy, and are catching up. The largest improvement in annual earnings
was experienced by those who earn the least.
The industry is home to some high tech and high productivity jobs. The typical post-
production/visual effects worker had a median hourly rate of $65. The national
median for all industries was $23 per hour.
Post-production is a high-tech industry where innovation is a key driver of success.
The international market for post-production digital effects is globally competitive
and the highly skilled creative labour force is globally mobile.

The screen industry supports New Zealand’s attraction strategy
Film tourism has shown strong growth. Total spending by international visitors in the
Matamata-Piako District, where Hobbiton is located, increased from $9 million in
2010 to $45 million in 2015.
International visitors increased by more than 200,000 in 2013 and 2014. The
economic impact of this increase in tourism was estimated to increase real
household welfare by $268 million and tourism industry exports by $861 million.
Productions that showcase New Zealand’s natural environment, culture and society
contribute to marketing New Zealand as an attractive tourist destination. The screen
industry also provides an opportunity for New Zealand companies to work with
international industry participants. International production partnerships are a signal
that New Zealand is open for business beyond the screen industry.

NZIER report – The economic contribution of the screen industry                           i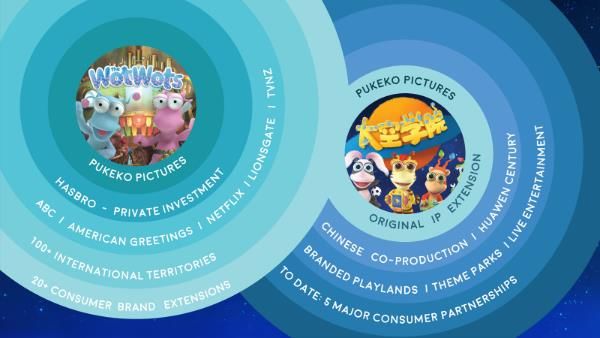
Contents
1.    Foreword ................................................................................................................ 1
2.    Introduction ........................................................................................................... 2
      2.1.     Methodological approach .................................................................. 2
      2.2.     Scope of the report ............................................................................ 3
3.    Economic contribution ........................................................................................... 4
      3.1.     The industry adds over $1B to GDP ................................................... 4
      3.2.     Modelling reveals the significance of the industry ............................ 5
      3.3.     The screen industry supports other industries .................................. 9
      3.4.     Exporting is a growth opportunity ................................................... 11
      3.5.     Industry sources see barriers to innovation .................................... 16
      3.6.     The action is spread across the regions ........................................... 18
      3.7.     Regional case studies highlights ...................................................... 24
4.    The firm-level trends ............................................................................................ 30
      4.1.     Gross revenue continues to grow .................................................... 30
      4.2.     International revenue is increasing ................................................. 32
      4.3.     The number of businesses has increased ........................................ 33
5.    Employment and skills ......................................................................................... 35
      5.1.     Employment trends mean more job stability .................................. 35
      5.2.     Wages are growing .......................................................................... 36
      5.3.     Labour productivity has varied ........................................................ 38
      5.4.     The workforce is young and competitive ........................................ 39
6.    ‘NZ Inc.’, film tourism and soft diplomacy ........................................................... 40
      6.1.     Film-related tourism has grown....................................................... 40
      6.2.     Overseas production partnerships are part of soft diplomacy ........ 45

Appendix
Appendix A NZIER’s national CGE model ..................................................................... 49

NZIER report – The economic contribution of the screen industry                                                                ii
Figures
Figure 1 The screen industry’s contribution to GDP .................................................................... 4
Figure 2 Relative impact of halving screen industry revenue ...................................................... 6
Figure 3 Impact of halving screen industry revenue ................................................................... 7
Figure 4 Impact of the loss of the NZSPG .................................................................................... 8
Figure 5 Impact of the loss of the NZSPG in NZD......................................................................... 9
Figure 6 Relative screen industry spending in selected sub-industries and other parts of the
economy .................................................................................................................................... 11
Figure 7 The proportion of businesses that are exporting ........................................................ 13
Figure 8 The ripple effect of creative intellectual property extension ...................................... 15
Figure 9 Proportion of businesses that innovate....................................................................... 16
Figure 10 Barriers to innovation ................................................................................................ 17
Figure 11 Permits for filming in Wellington and Auckland 2015/16 ......................................... 18
Figure 12 Geographic distribution of Screentime NZ productions ............................................ 19
Figure 13 Auckland-based screen industry spending in other areas $ millions ......................... 21
Figure 14 Impact on the Auckland screen industry ................................................................... 21
Figure 15 Impact on Auckland screen production in NZD ......................................................... 22
Figure 16 Impact of NZSPG in Auckland .................................................................................... 22
Figure 17 Impact of NZSPG in NZD ............................................................................................ 23
Figure 18 Kumeu Film Studios ................................................................................................... 24
Figure 19 Weta Digital revenue growth outpaces the economy ............................................... 26
Figure 20 The Legend of Zu ....................................................................................................... 28
Figure 21 Gross revenue from 2008 to 2016 ............................................................................. 30
Figure 22 Gross revenue compared to 2008 ............................................................................. 31
Figure 23 Gross revenue compounding average growth rates ................................................. 32
Figure 24 Gross revenue for screen production and post-production ...................................... 32
Figure 25 International screen production and post-production gross revenue by country .... 33
Figure 26 The number of screen production and post-production businesses by revenue
category ..................................................................................................................................... 34
Figure 27 Film and video distribution, film exhibition, and TV broadcasting businesses .......... 34
Figure 28 People and employment ........................................................................................... 35
Figure 29 Screen industry jobs by main activity ........................................................................ 36
Figure 30 The distribution of earnings in 2005 and 2015 .......................................................... 36
Figure 31 Growth in earnings compared to 2005 by percentile ................................................ 37
Figure 32 Median earnings compared to other industries ........................................................ 37
Figure 33 Growth in median earnings compared to other industries ....................................... 38
Figure 34 Growth in labour productivity comparision .............................................................. 38
Figure 35 International visitor growth in Matamata-Piako ....................................................... 40
Figure 36 International visitor spending in Matamata-Piako .................................................... 41
Figure 37 Hobbit trilogy tourism-related industry exports........................................................ 42
Figure 38 Coast New Zealand .................................................................................................... 43
Figure 39 Median visitor spend by country of origin in 2016 .................................................... 46
Figure 40 800 Words ................................................................................................................. 47
Figure 41 CGE models cover the whole economy ..................................................................... 49

NZIER report – The economic contribution of the screen industry                                                                               iii

Tables
Table 1 What are the key questions? .......................................................................................... 2
Table 2 Screen industry draws on inputs from a wide range of industries ............................... 10
Table 3 Advantages for businesses from exporting are well-established ................................. 12
Table 4 Regional distribution of screen industry gross revenue 2015/16 ................................. 18
Table 5 How the screen industry earnings are spent in other sub-industries ........................... 20
Table 6 SciTech awards to Weta Digital since 2010................................................................... 25
Table 7 Hourly wage comparisons for selected industries ........................................................ 26
Table 8 Local expenditure on Coast New Zealand ..................................................................... 44
Table 9 Expenditure on 800 Words ........................................................................................... 48

NZIER report – The economic contribution of the screen industry                                                              iv
1. Foreword
The New Zealand screen industry has matured and continues to maintain a
competitive position as a global export industry. We see this in the way the screen
industry attracts a steady stream of repeat international business, the number of
SciTech Awards for industry innovation and the way part-time work is becoming full-
time. The post-production end of the screen industry pays high wages that well exceed
the New Zealand average.
Few industry assistance programmes remain in New Zealand. Results from the NZIER
computable general equilibrium (CGE) modelling show that the New Zealand Screen
Production Grant (NZSPG) scheme increases exports and GDP more than if the funding
was directed elsewhere.
New Zealand’s international success provides more than direct economic benefits
through spin-off benefits for other industries such as tourism, the technology sector
and the domestic screen industry. The domestic screen industry is a big beneficiary
because domestic New Zealand screen productions have access to world class facilities
and expertise. Telling New Zealand stories with the same world class production values
as our international work is important for national identity and pride. New Zealanders
see world class production values in overseas productions and expect nothing less
from local productions.
The New Zealand screen industry is in good shape but has proven very difficult to
measure and track due to rapidly evolving technology and business practices in the
financing, production, distribution and consumption of screen industry outputs
worldwide. National statistics are becoming obsolete and need to adapt so that
businesses and occupations such as interactive games and games developers are
captured in future statistics. Because the screen industry is important to the economy
and benefits from some public support, it will be important for official statistics to keep
pace. To do this correctly, statistics must capture the wider creative sector which is
experiencing the same changes as various creative and artistic media converge.
This NZIER reports adds to the body of similar reports from Australia, Canada and the
United Kingdom. This report is the first time CGE modelling has been applied to the
screen industry. The CGE modelling results show the very positive contribution of the
NZSPG to the New Zealand economy and as such demonstrates it is an effective
industry policy.

NZIER report – The economic contribution of the screen industry                          1
2. Introduction
This report provides an analysis of the economic contribution of New Zealand’s screen
industry. Currently in New Zealand it is common for screen industry statistics to be
produced by individual agencies, and in some instances without adequate reference
to the industry. One of the objectives of this work is to establish a common set of
frequently used statistics that will illuminate the role of the screen industry in the New
Zealand economy and society.
The screen industry is broadly defined as the combination of the production,
distribution and exhibition of film, television, online and digital content. Digital gaming
is excluded from the statistical definition of the screen industry in the Statistics New
Zealand Screen Industry Survey. Digital gaming is also not readily identifiable in other
published Statistics New Zealand information. This is due to statistical definitions and
collections not keeping pace with a rapidly evolving industry. However, we recognise
that there is a high degree of complementarity between post-production in the screen
industry and digital gaming, and that skilled professionals often move between the
two.

2.1. Methodological approach
NZIER’s approach and framework is based around four key questions that broadly
capture the dimensions of New Zealand’s screen industry ecosystem. The four key
questions, shown in Table 1, are mapped to their areas of focus. These questions and
areas of focus are primarily intended to provide a structure to the discussion in this
report. In practice, many of the elements spill over into other areas. For example, skills
and workforce issues spill over in macroeconomic outputs and shape the reputation of
‘NZ Inc.’ The last key question does not naturally fall into a single section of this report,
rather the insights on opportunities and barriers emerge as themes throughout the
report.

Table 1 What are the key questions?
 Key question                                        Area of focus
 What does the screen industry do for the            Macroeconomic
 economy?
 What does the screen industry do for skills and     Microeconomic
 employment?
 What does the screen industry do for ‘NZ Inc.’?     Tourism and international reputation
 What are the opportunities and barriers to growth   Identification of the opportunities or
 at the firm level?                                  constraints and how releasing them would
                                                     support growth

Source: NZIER

The evidence base for this report was drawn from a variety of sources, to develop the
most complete picture of the industry’s contribution to date. Statistics New Zealand’s
Screen Industry Surveys were a key source of information. Other sources include:

NZIER report – The economic contribution of the screen industry                                 2
• the Business Operations Survey (Statistics New Zealand)
• interviews, which underpin the case studies
• National Accounts (Statistics New Zealand)
• journal articles
• industry research
• unpublished firm-level data.
Case studies were used to inform the evidence base and provide tangible examples
that showcase the industry’s contribution to jobs, innovation, tourism, culture and soft
diplomacy. The case studies have been written with support from the industry and in
large part are a reflection of how the industry views its contribution to New Zealand.
2.2. Scope of the report
The industry scope of this report goes wider than Statistics New Zealand’s Screen
Industry Surveys, to capture the converging technology in the screen industry that has
led to the integration of production, distribution and consumption across multiple
formats.
The value scope of this report is that it examines the total impact of the screen
industry. Total value is economic, social and cultural; that is, total value includes
spillovers and non-market values. To deal with aspects that are difficult to measure,
our analysis is supplemented by case studies. Cultural/non-market value counts as part
of total value. But it is not included in this report, due to the lack of New Zealand-based
primary research on the non-market value of the screen industry. Further research is
needed to quantify the non-market benefits.
Readers should note that the publication of employment statistics and GDP estimates
typically lag one year behind the other statistics.
NZIER report – The economic contribution of the screen industry 33. Economic contribution
In this section of the report we look at the overall effects of the screen industry on the
economy. We explore the contribution to GDP and overall gross revenue from the
industry. This section takes a top-down, macroeconomic perspective. The bottom-up,
microeconomic perspective is discussed in the next section, where employment,
wages and sub-industry performance will be explored.
The economic contribution from the screen industry is wide ranging. It includes
movies, television, online productions and software-based entertainment. There are
also spillovers to tourism and cultural activities.
Employment in the industry is characterised by part-time work and/or contract work
linked to the duration of the production. On average, an individual in the screen
industry will have more than one contract within a given year. The labour force is highly
mobile, which reflects the global nature of the industry. The demand for skills in the
screen industry is extremely broad. Employment in the industry ranges from low skill,
labour-intensive roles to high tech, high skill jobs.
Due to the wide range of skills, roles and productions, it is difficult to generalise about
the direct and indirect economic contribution of the industry without understanding
the underlying dynamic in the industry. For example, the high tech post-production
sub-industry is international, fast moving and is characterised by high productivity,
while other parts of the industry such as television production are more connected to
domestic economic activity.
3.1. The industry adds over $1B to GDP
The contribution to GDP from the screen industry was $1.015 billion in 2015, which
was 2.8% higher than the previous year. The industry is estimated to have directly
contributed $6.04 billion to GDP from 2010 to 2015 (see Figure 1.)
Figure 1 The screen industry’s contribution to GDP
$ millions
$1,200 $1,127 $1,132 0.60%
$987 $1,015
$1,000 $893 0.50%
$883 0.53% 0.52%
$800 0.46% 0.40%
0.43% 0.42% 0.41%
$600 0.30%
$400 0.20%
$200 0.10%
$0 0.00%
2010 2011 2012 2013 2014 2015
GDP Share of GDP
Source: Statistics New Zealand and NZIER analysis
NZIER report – The economic contribution of the screen industry 43.2. Modelling reveals the significance of the
industry
To estimate the wider impact of the screen industry on the economy, NZIER modelled
the impact of halving the size of the industry on GDP, wages, exports and household
consumption. Next, the impact of removing the NZSPG was modelled, to demonstrate
the economic impact of the grants.
NZIER’s TERM-NZ CGE model was used to estimate the economy-wide impact of the
screen industry and NZSPG. Using actual economic data, CGE models estimate how an
economy reacts to major projects or changes in policy, technology or other external
factors. CGE models are useful whenever we wish to estimate the effect of changes in
one part of the economy upon the whole of New Zealand. Appendix A contains a
description of the model.
A smaller screen industry would have negative effects on exports
To estimate the impact of the screen industry (including the NZSPG) we modelled a
scenario that shocks the economy as if the screen industry revenue is reduced by half
and the NZSPG did not exist. Screen industry business in New Zealand totalled $3.22
billion in 2015.1 Our ‘what if’ scenario removes half of that revenue from all screen
industry business in New Zealand. The rationale for ‘halving the industry’ is to show
what would happen if the industry was to shrink. It is hypothetical scenario to
demonstrate the economic knock-on effects. Figure 2 (percentage change) and Figure
3 (absolute change) show that the economic impact of a reduction of $1.6 billion in
New Zealand screen industry revenue2 would be:
• a decrease in GDP of $525 million (0.22%)
• a contraction in export volumes of $353 million (0.53%)
• a reduction in real wages by 0.23%
• a decrease in real household consumption by $303 million (0.22%) due to
lower incomes.
Screen industry exports are considered to be exports in the same way as international
visitor spending can be described as tourism exports. They are good and services sold
to overseas buyers. The relative impact on exports is larger than for the other
measures in the model. This indicates that the screen industry is export-orientated,
and spending in this industry contributes to expanding exports and supports export
growth. The screen industry directly generates exports through three channels:
• live action productions for international customers (e.g. Power Rangers and
Pete’s Dragon)
• post-production and visual effects services (e.g. Jungle Book and The B.F.G.)
• selling domestic productions overseas (e.g. Hunt for the Wilderpeople).
1
Screen Industry: 2014/15 Statistics New Zealand, 13 April 2016.
http://www.stats.govt.nz/browse_for_stats/industry_sectors/film_and_television/ScreenIndustrySurvey_HOTP14-15.aspx
2
Compared with the 2015 baseline.
NZIER report – The economic contribution of the screen industry 5The screen industry also supports growth in high skill, high tech jobs in the ICT category
and increases the diversity of our exports and strengthens our international brand. The
effects on skills, employment and tourism will be discussed later in the report.
The impacts of this scenario indicate that the screen industry overall contributes
around $1.05 billion to real GDP3 and around $706 million to exports annually.4 This
level of economic contribution is similar to the wine industry ($1.09 billion); forestry
($1.31 billion) and more than the printing industry ($0.71 billion).
Figure 2 Relative impact of halving screen industry revenue
Real household
Real wage Export volume consumption Real GDP
0.00
Percentage change compared to the 2015
-0.10
-0.20
-0.23 -0.22 -0.22
baseline
-0.30
-0.40
-0.50
-0.53
-0.60
Source: NZIER computable general equilibrium model database
3
The real GDP results from the CGE modelling covers a wider range of economic spillovers than the Statistics New Zealand
estimate of the contribution to GDP discussed previously.
4
The overall impact of the industry is based on scaling up the results from halving the industry.
NZIER report – The economic contribution of the screen industry 6Figure 3 Impact of halving screen industry revenue
Real household
Export volume consumption Real GDP
0
Change from the 2015 baseline ($ millions)
-100
-200
-300
-304
-353
-400
-500
-525
-600
Source: NZIER computable general equilibrium model database
The New Zealand Screen Production Grant supports exports
This ‘what if’ scenario models the impact of the NZSPG scheme based on $583 million
of Qualifying New Zealand Production Expenditure (QNZPE) which consists of $127
million in NZSPGs5 provided to attract Screen Production exports of $456 million due
to international firms spending money in New Zealand.
To estimate the impact of the NZSPG, we modelled a scenario that shocks the economy
as if the revenue (an amount of $456 million) from the Screen Production exports did
not exist and the $127 million of the NZSPG was spent somewhere else in the
economy.
Figure 4 shows the economic impacts of the NZSPG compared with the baseline. The
relative impacts compared to the 2015 baseline were:
• real GDP would be 0.07% lower
• export volumes would fall by 0.38%
• real wages would fall by 0.09%
• a decrease in real household consumption of 0.10%, due to lower incomes.
5
Over the 12 months ending in June 2016.
NZIER report – The economic contribution of the screen industry 7Figure 4 Impact of the loss of the NZSPG
Real household
Real wage Export volume consumption Real GDP
0.00
Percenage change compared to the 2015 baseline
-0.05
-0.10 -0.07
-0.09
-0.10
-0.15
-0.20
-0.25
-0.30
-0.35
-0.40 -0.38
-0.45
Source: NZIER modelling based on Statistics New Zealand data
Figure 5 shows the economy compared with the baseline in dollar terms. The economic
cost of removing the NZSPG would be negative. Individuals and households would be
worse off if the NZSPG did not exist. The results of removing the NZSPG are as follows:
• real GDP would be $176 million lower
• exports would fall by $257 million
• real household consumption would reduce by $144 million.
The most significant impact of removing the NZSPG is the contraction in exports. The
main aim of the international NZSPG is to attract international productions to New
Zealand. This international spending in New Zealand represents an increase in exports.
The results of this ‘what if’ scenario show that the NZSPG is effective in expanding
exports and that these exports create positive spillovers in New Zealand, including
higher wages, increased household income and higher GDP than would otherwise not
occur if the NZSPG was invested elsewhere in the economy.
NZIER report – The economic contribution of the screen industry 8Figure 5 Impact of the loss of the NZSPG in NZD
Real household
Export volume consumption Real GDP
$0
Change from the 2015 baseline ($ millions)
-$50
-$100
-$150
-$144
-$176
-$200
-$250
-$257
-$300
Source: NZIER computable general equilibrium model database
3.3. The screen industry supports other
industries
The screen industry plays an important role in supporting activity in other parts of the
New Zealand economy. The screen industry businesses produce returns to labour and
capital amounting to $1.0 billion. Total services and commodities and returns to labour
and capital are used to produce $3.2 billion of screen industry outputs.
The screen industry has many linkages to other industries due to the complex nature
of the products produced and the diverse range of inputs required. This means that
the economic benefits from better performance and growth in the screen industry are
distributed widely. Table 2 shows the purchases made by screen industry businesses
to support their production of $3.2 billion in 2015. The table shows how the industry
earnings were spent on a wide range of intermediate inputs from screen industry sub-
industries and other industries.
NZIER report – The economic contribution of the screen industry 9Table 2 Screen industry draws on inputs from a wide range of industries Industries and sub-industries $ millions Motion picture, radio, and TV services $894 Equipment hire, computer, intellectual property, legal, accounting, tax, $766 management and support services Equipment purchases $106 Leased property $98 Software, tapes, audio, and video records $81 Financial and insurance services $74 Telecommunication and internet services $35 Electricity $23 Broadcasting and distribution services $20 Couriers, freight, and storage $17 Accommodation, food, and beverages services $11 Air passenger transport $9 Maintenance of office and transport equipment $9 Petrol $9 Photographic and scientific equipment $8 Government and security services $7 Road and rail transport $5 Publishing and printing services $4 Total intermediate inputs $2,177 Return to labour $400 Return to capital $643 Source: NZIER computable general equilibrium model database based on Statistics New Zealand data NZIER report – The economic contribution of the screen industry 10
Figure 6 illustrates the relative proportions of screen industry spending on the
intermediate inputs, other than return to capital and labour, for screen sub-industries
and other parts of the economy.

Figure 6 Relative screen industry spending in selected sub-industries and
other parts of the economy
$ million

                        Publishing and printing services

                                  Road and rail transport

                      Government and security services

                 Photographic and scientific equipment

                                                    Petrol

        Maintenance of office and transport equipment

                                 Air passenger transport

         Accommodation, food, and beverages services

                           Couriers, freight, and storage

                 Broadcasting and distribution services

                                                Electricity

              Telecommunication and internet services

                        Financial and insurance services

              Software, tapes, audio, and video records

                                         Leased property

                                   Equipment purchases

                                                              $0     $20        $40       $60       $80       $100      $120

Source: NZIER computable general equilibrium model database modelling based on Statistics
New Zealand data

3.4. Exporting is a growth opportunity
Export-orientated countries tend to have faster economic growth than inward-looking
countries.6
Exporting can be a source of growth and innovation for businesses. The potential
advantages from exporting stem from access to larger markets, economies of scale
and exposure to innovation. Table 3 describes the potential advantages of exporting
for businesses. The screen industry has a comparative advantage in exporting because
of the scalability and weightlessness of digital content.

    6
           Grossman, G.M. and Helpman, E., 1990. Trade, Innovation, and Growth. The American Economic Review, 80(2), pp.86-91.

NZIER report – The economic contribution of the screen industry                                                                  11
Table 3 Advantages for businesses from exporting are well-established
Advantage Description
Increased sales potential Exporting can increase sales by extending your market base to overseas
in larger markets countries where you can find new customers and niche markets.
Increased profit margins Despite the added costs of exporting, you can save costs by producing
on a scale that makes better use of resources (economies of scale),
leading to higher profit margins.
Potential for faster Selling in an overseas market can help your business grow at a faster
growth rate than if you were confined to New Zealand markets.
Reduced local market Selling in different countries diversifies risks, such as exposure to New
dependence Zealand's economic conditions or seasonal factors. During a local
economic downturn, your overseas customers may be unaffected.
Improved innovation Exposure to new ideas, technology and processes can help your
company develop innovative products and services.
Greater competitiveness Trading in the global marketplace increases your exposure to
international best practice, ideas and alternative ways of doing business
– improving your chances of competing at home and overseas.
Source: New Zealand Trade and Enterprise, Why export? Accessed 11 September 2017.
NZTE also recognises that businesses face challenges in exporting. The general
challenges are:
• increased costs
• regulation
• legal challenges in unfamiliar jurisdictions
• political stability.
These advantages, opportunities and challenges for all exporters are useful
background knowledge for any screen industry business looking to begin exporting.
The Statistics New Zealand’s Business Operations Survey (BOS) was used to inform the
exploration of export potential in the screen industry. The screen industry was not an
identifiable industry in the BOS. The motion picture industry was the best available
representation of the broader screen industry in the BOS.
Analysis of the BOS shows the percentage of motion picture businesses that export
increased from 14% in 2007, to 28% in 2014 (Figure 7). This increase in the percentage
of motion picture businesses that export is similar to the increase in all industries that
export.
NZIER report – The economic contribution of the screen industry 12Figure 7 The proportion of businesses that are exporting
30%
20%
10%
0%
2007 2008 2009 2010 2011 2012 2013 2014
Motion picture industry All industries
Source: Statistics New Zealand
The screen industry has the potential to export more. The scalability and weightless of
motion picture products specifically, and those of the screen industry generally, are
comparative advantages for exporting the product compared to other industries.
Distance to market is recognised as a challenge for New Zealand’s exporters. Distance
to market and the associated transport costs are a challenge for agricultural exporters.7
The screen industry does not face distance to market challenges with its product, but
it still needs to overcome the distance challenge in terms of developing and
maintaining relationships and industry networks. Pukeko Pictures international
partnerships in China, Canada, Australia and the United Kingdom are an important
factor in its screen industry export success story. See the case study overleaf for more
information on Pukeko Pictures.
The digital gaming industry is an example of an industry that has been successful at
increasing export revenue. Gaming industry revenue increased from $19.7 million in
2012, to $99.9 million in 2017. Most of this revenue (97%) came from digital exports.8
The scalability of the digital content is a key factor in this growth. The creation and self-
publication of intellectual property is a major source of revenue growth.9 These are
aspects that the screen industry and digital gaming industry have in common and are
a characteristic of the digital convergence.
The top two barriers to exporting reported by all industries were lack of experience in
international business and lack of market knowledge.10 The motion picture industry
reported the following barriers to exporting in the BOS:
• lack of experience
• limited knowledge about specific markets
• exchange rate volatility
• distance from markets
• language and cultural differences.
7
Onodera, O., 2008. Trade and Innovation Project: A Synthesis Paper. OECD trade policy paper no. 72.
8
Digital New Zealand, 2016. http://www.igea.net/wp-content/uploads/2015/09/Digital-New-Zealand-2016-DNZ16.pdf
9
https://nzgda.com/survey2017/
10
Sanderson, L., 2016. Barriers to Generating International Income: Evidence from the Business Operations Survey (No.
16/04). New Zealand Treasury.
NZIER report – The economic contribution of the screen industry 13Case study 1: Pukeko Pictures an export success
Pukeko Pictures (Pukeko) is a Wellington-based multi-platform production company with a
business model oriented to children’s screen projects. Pukeko is recognised by broadcasters
worldwide as a creator of original storytelling of the highest quality.
Pukeko conceptualises and produces original creative content for the screen. The model is
multi-platform from the outset: screen productions are planned at the same time as digital
extensions, live entertainment experiences, brand licensing alliances and merchandise such as
publishing and toys.
Pukeko has creative control of their intellectual property
Pukeko is a good example of an export-oriented business that leverages the creative
intellectual property (IP) it creates. The Pukeko Pictures approach to management of IP is that:
• distinctive intellectual property attracts partnerships
• international partnership grows investment
• investment builds sustainability.
This has allowed Pukeko to grow from a company established in 2008 to develop intellectual
property, to a company with four international shows in production during 2017. The budgets
range from $6 to $20 million per production and generate spend in New Zealand of more than
$14 million.
The quality of the productions is shown by the many accolades won
Jane and the Dragon and The WotWots have both won Parents’ Choice Awards in the United
States and been nominated for awards in animation, writing, sound and musical score
internationally. Thunderbirds Are Go has won or been nominated for multiple awards in the
United Kingdom.
Connecting with a constantly regenerating audience
Children’s animated screen content tends to age more slowly than live action screen
production, so the intellectual property can be leveraged over a longer period. The WotWots
has been broadcast consistently in Australia for more than 6 years.
Animated screen productions are more likely to have spin-off intellectual property layers
because of the originality and timelessness of the assets – an animated character won’t change
as it ages, unlike an actor from a live action series. The market for children’s animation is
international because it is a stylised creative form that tends not to be as specific in culture,
ethnicity or language as live action productions. That animation can be re-voiced in any
language without the audience realising is core to its ability to travel.
Attracting new markets and international partnerships
Pukeko has spent years establishing partner relationships in China, grown from company
director Richard Taylor’s 15 plus years of engagement with China. Building on the international
success of The WotWots, and with full control of the original IP in New Zealand, Pukeko has
developed with their Chinese partner a sister show called The Kiddets. Creating the
opportunity for the evolution of the original IP to reach an extended audience.
Pukeko’s partners in China are a multi-layered entertainment company, able to take a
vertically integrated approach to IP expansion. The Kiddets will roll out across China in a variety
NZIER report – The economic contribution of the screen industry 14of forms – live entertainment opportunities (e.g. branded playlands, indoor theme parks),
brand alliances (e.g. food and beverage partnership), merchandise licensees (e.g. building
blocks, toys) all supporting the launch of the TV series so the various activations cross-promote
each other for the benefit of the IP.
Figure 8 The ripple effect of creative intellectual property extension
Source: Pukeko Pictures
Those partnerships also add value to the broader ‘NZ Inc.’ trade chain within China. A specific
example is the brand alliance with Wahaha – China’s biggest producer of milk-based food and
beverage products. Wahaha have committed to a licensee agreement with Huawen Century
for The Kiddets to produce one billion branded children’s focused products which will be
released in 2017. These products will be made using Fonterra milk powder. Those exports will
now be branded with a New Zealand IP extension for Chinese consumers to enjoy, which will
drive further financial returns to New Zealand.
Generating export income and high wage jobs
Pukeko as a firm provides high wage jobs. The mean and median annual salary at Pukeko are
approximately twice the New Zealand mean and median annual salary. In 2008 the company
had 3 full-time equivalent positions; in 2017 there are 60.
A clear contribution to lifting New Zealand’s economy
Pukeko is a strong contributor to New Zealand because they are:
• creating intellectual property and attracting investment
• paying higher than average wages
• generating export income
• driving the ‘NZ Inc.’ story, particularly within China
• creating New Zealand content with world class production values.
NZIER report – The economic contribution of the screen industry 153.5. Industry sources see barriers to
innovation
Innovation is fundamental to the screen industry and innovation can happen in many
areas including technology, content and medium. Figure 9 shows the proportion of
businesses that report innovation in the motion picture industry compared to all
industries.
Figure 9 Proportion of businesses that innovate
Percentage of respondents
30%
27%
20%
17%
10%
0%
Motion picture industry All industries
Source: Statistics New Zealand Business Operations Survey
Innovation is an important driver of business performance. Innovation is critical to
competing in the digital visual effects industry, where developing business culture and
infrastructure that supports the rapid adoption of new technology and demonstrating
its potential is part of being successful. Examples of innovation in the screen industry
include digital technology, visual effects, costumes and prosthetics.
The most commonly reported barrier to innovation in the motion picture industry was
the cost of innovating. The second most commonly reported barrier was the “lack of
management resources”. This suggests that lowering the cost of innovation and
increasing management productivity and capability would encourage greater
innovation in the motion picture industry and the wider screen industry.
Figure 10 shows industries’ perceptions of barriers to innovation in the motion picture
industry as an example of barriers in the screen industry.
NZIER report – The economic contribution of the screen industry 16Figure 10 Barriers to innovation
Respondents reporting barriers to innovation in the motion picture industry
Cost of innovation
Lack of management resources
Lack of appropriate personnel
Lack of marketing expertise
Lack of information
Lack of cooperation with other businesses
Government regulation
Access to intellectual property rights
0% 10% 20% 30% 40% 50% 60% 70% 80% 90% 100%
Low Medium High Not a barrier
Source: Statistics New Zealand Business Operations Survey
Social media, emerging digital technologies and digital content are changing the value
chain in media production. The traditional ‘Hollywood model’ is supplier-driven. New
technology and social media are challenging the traditional model by allowing
independent distribution of bespoke productions and user input throughout the
creative process and the value chain. This is creating a demand-driven value chain with
greater flexibility than in the past.11
Although small overall, crowd-funding has also become a channel for facilitating the
international distribution of domestic productions such as Boy in 2010. According to
Ferrer-Roca (2015, p. 222):12
New business models thanks to new technologies, such as crowd-
funding platforms, provide a means for bottom-tier filmmakers to
connect, interact and receive economic support directly from their
potential audience. By bringing together two traditionally
separated players in the value chain, the feature filmmakers and
the audience, the export potential is decided directly by the amount
of support received by the potential theatrical audience, thereby
democratising the selection process of films for theatrical release.
11
Kehoe, K. and Mateer, J., 2015. The Impact of Digital Technology on the Distribution Value Chain Model of Independent
Feature Films in the UK. International Journal on Media Management, 17(2), pp.93-108.
12
Ferrer-Roca, N., 2015. Multi-platform Funding Strategies for Bottom-Tier Films in Small Domestic Media Markets: Boy (2010)
as a New Zealand Case Study. Journal of Media Business Studies, 12(4), pp.224-237.
NZIER report – The economic contribution of the screen industry 173.6. The action is spread across the regions
A quick glance at Statistics New Zealand’s breakdown of gross revenue around New
Zealand would suggest that the screen industry is a tale of two cities – Auckland and
Wellington. Auckland dominates production, TV broadcasting and distribution, while
Wellington specialises in post-production. Note however that these gross revenue
statistics are based on the address of the main office of each of the respondents to the
screen industry survey (Table 4).
Table 4 Regional distribution of screen industry gross revenue 2015/16
C reflects confidential statistics usually due to the small numbers of respondents.
Production Post- Television Film & video Film
production broadcasting distribution exhibition
Auckland 71% 24% 100% 98% 31%
Wellington 22% 73% 0% 1% 10%
Rest of the Nth. Is. 1% 1% 0% C C
South Island 6% 2% 0% C C
Source: Statistics New Zealand
A comparison of filming permits in Auckland and Wellington in 2015/16 shows that
Wellington had a wide variety of production types, while Auckland had a greater focus
on television commercials and programs. Overall there were 392 and 296 permits
issued in Wellington and Auckland, respectively.
Figure 11 Permits for filming in Wellington and Auckland 2015/16
Wellington Auckland
Web video
TV show
TV commercial
Student film
Type of production
Still shots
Short film
Other
Music video
Feature film
Documentary
Corporate video
0 25 50 75 100 125
Number of permits
Source: Screen Wellington and ATEED
NZIER report – The economic contribution of the screen industry 18Filming on location is a way that the screen industry activities contribute to economic
activities in the regions. For example, Screentime NZ is Auckland-based but shoots live
action widely across New Zealand, as shown in Figure 12.
Figure 12 Geographic distribution of Screentime NZ productions
Kaitaia Kerikeri
Paihia
Mitimiti & Utakura Valley
Whangarei
Auckland
Hahei
Bethells Beach
Wahi Beachi
Hamilton
Tauranga Te Kaha
Rotorua
Raglan Hicks Bay
Rangitukia
Opotiki
Te Urewera
Raetihi & Central Plateau
New Plymouth
Taupo
Napier
Whanganui Waiouru
Palmerston North
Nelson Dannevirke
Masterton
Martinborough
Westport Hutt Valley
h
Wellington
Greymouth
Blenheim
Hokitika
Kaikoura
Franz Josef
Christchurch
Akaroa
Drama
Craigieburn
Milford Sound Multiple productions
Queenstown
Marae DIY
Te Anau
Dunedin
Police Ten 7
Hump Ridge Track
Invercargill Sensing Murder
Catlins
Source: NZIER based on data from Screentime NZ, 2015
NZIER report – The economic contribution of the screen industry 193.6.1. The Auckland screen industry is strong
To estimate the impact of the screen industry (including the NZSPG) on Auckland we
modelled two scenarios. The first scenario shocked the economy as if the following
happened:
• the industry revenue is reduced by half
• if the NZSPG did not exist for Auckland-based projects and the funding was
not reallocated to other regions.
The gross revenue from all screen industry business in New Zealand was $3.3 billion in
201613 and Auckland’s share of this was $2.4 billion.
In the second scenario the NZSPG for Auckland was removed. The results show that
the screen industry plays an important role in supporting activity in other parts of the
Auckland economy (Table 5).14
Table 5 How the screen industry earnings are spent in other sub-industries
Auckland-based spending (spending may not add up due to rounding)
Spending in sub-industries $ million
Motion picture, radio and TV services $664
Equipment hire, IP, legal, accounting and management services $569
Electronic equipment purchases $85
Leased property $73
Software and audio-visual services $60
Insurance services $55
Transport and postal services $38
ICT services $26
Electricity $17
Broadcasting and distribution services $15
Accommodation, food and beverage $8
Government and security services $5
Publishing and printing services $3
Other goods and services $5
Total immediate inputs $1,623
Returns to labour $298
Returns to capital $479
Gross revenue of screen industry based in Auckland $2,401
Source: NZIER computable general equilibrium model database
13
Statistic New Zealand, 2017. Screen Industry: 2015/16, 12 April 2017.
http://www.stats.govt.nz/browse_for_stats/industry_sectors/film_and_television/ScreenIndustrySurvey_MR15-16.aspx
14
Returns to labour represents wages and salaries. Returns to capital is an estimate of the profits in the industry in Auckland.
NZIER report – The economic contribution of the screen industry 20Figure 13 Auckland-based screen industry spending in other areas $
millions
Other goods and services $5
Publishing and printing services $3
Government and security services $5
Accommodation, food and beverage $8
Broadcasting and distribution services $15
Electricity $17
ICT services $26
Transport and delivery services $38
Insurance services $55
Software and audio-visual services $60
Leased property $73
Electronic equipment purchases $85
Source: NZIER computable general equilibrium model database
Figure 14 shows the economic impact of the reduction of $1.2 billion in the Auckland
screen industry compared with the baseline. The results of the CGE modelling indicate
that a 50% reduction in screen industry revenue would reduce Auckland’s GDP by $429
million or 0.46%. This result implies that the combined direct and indirect impact of
the screen industry on Auckland’s GDP in 2016 was around $858 million. Real
household consumption would be 0.37% lower than the 2016 baseline. Export volumes
and real wages would fall by 0.93% and 0.25%, respectively.
Figure 14 Impact on the Auckland screen industry
Real household
Real wage Export volume consumption Real GDP
0
Percentage change compared to the
-0.1
-0.2
-0.3 -0.25
2016 baseline
-0.4
-0.37
-0.5 -0.46
-0.6
-0.7
-0.8
-0.9
-1 -0.93
Source: NZIER
Figure 15 shows the economy compared with the baseline in dollar amounts. Real GDP
would be $429 million lower than the 2016 baseline. Real household consumption falls
by $183 million and export volumes fall by $186 million.
NZIER report – The economic contribution of the screen industry 21Figure 15 Impact on Auckland screen production in NZD
Real household
Export volume consumption Real GDP
$0
Change compared to 2016 baseline
-$100
($ millions)
-$200 -$183
-$186
-$300
-$400
-$429
-$500
Source: NZIER computable general equilibrium model database
3.6.2. Auckland without the NZSPG
This ‘what if’ scenario models the impact of the NZSPG scheme based on $137 million
of QNZPE which consists of the $29 million in NZSPGs15 provided to attract screen
production exports of $108 million.
To estimate the impact of the NZSPG, we modelled a scenario that shocks the economy
as if the screen production exports revenue of $108 million does not exist and the $29
million of the NZSPG was spent by government elsewhere.
Figure 16 shows the economic impact of the NZSPG compared with the baseline. Real
GDP would be 0.07% less than the 2016 baseline. Real household consumption would
fall by 0.09%. Export volumes and real wages would fall by 0.39% and 0.04%,
respectively.
Figure 16 Impact of NZSPG in Auckland
Real household
Real wage Export volume consumption Real GDP
0.00
Percentage change compared to
-0.04
-0.10 -0.07
the 2016 baseline
-0.09
-0.20
-0.30
-0.40
-0.39
Source: NZIER computable general equilibrium model database
15
For Auckland based projects for the year ending February 2017
NZIER report – The economic contribution of the screen industry 22Figure 17 shows the economy compared with the baseline in dollar amounts. Real GDP
would be $61 million lower in the absence of the NZSPG. Real household consumption
reduces by $44 million and exports fall by $77 million.
Figure 17 Impact of NZSPG in NZD
Export volume Real household consumption Real GDP
$0
-$10
Change compared to the 2016
-$20
baseline ($ millions)
-$30
-$40
-$50 -$44
-$60
-$61
-$70
-$80
-$77
-$90
Source: NZIER computable general equilibrium model database
NZIER report – The economic contribution of the screen industry 233.7. Regional case studies highlights
Case study 2: The Meg supported enduring industry expansion
The Meg (short for Megalodon - the largest marine predator that ever existed) is an action, sci-
fi thriller filmed in Auckland and China and due for release in 2018. Filming in New Zealand was
completed in 2017. The Meg is a good example of how attracting international film projects can
fund:
• new infrastructure
• new skills development
• and leave legacy opportunities for domestic productions.
A former Fletcher factory has been transformed into the Kumeu Film Studios. The studios
doubled Auckland’s screen studio infrastructure. The 27-hectare site includes sound stages,
workshops and two permanent water tanks, along with the development of two fit for purpose
sound stages on the Kumeu site due for completion in January 2018.
Figure 18 Kumeu Film Studios
Source: Kumeu Film Studios
The production of The Meg has also tapped expertise from the marine industry to design and
build aquatic props that allowed Tauranga-based marine businesses to develop and purchase
new specialist equipment that can be deployed for marine projects and future film projects. In
economics, this is known as dynamic efficiency, whereby innovation and investment improve
production processes. In this case, new technology would not be available for new marine
applications were it not for The Meg.
Development of New Zealand creative talent was one of the New Zealand Film Commission
(NZFC) requirements for The Meg to receive a NZSPG. Three mentorships were provided as part
of the production so that, early in their careers, directors had the opportunity to learn from the
experience of well-established veterans such as The Meg’s executive producer Barrie Osborne.
NZIER report – The economic contribution of the screen industry 24You can also read