Determining The Effect Of Building Geometry On Energy Use Patterns Of Office Developments
←
→
Page content transcription
If your browser does not render page correctly, please read the page content below
Ryerson University
Digital Commons @ Ryerson
Theses and dissertations

1-1-2012

Determining The Effect Of Building Geometry On
Energy Use Patterns Of Office Developments
Tonima Ferdous
Ryerson University

Follow this and additional works at: http://digitalcommons.ryerson.ca/dissertations
     Part of the Construction Engineering and Management Commons

Recommended Citation
Ferdous, Tonima, "Determining The Effect Of Building Geometry On Energy Use Patterns Of Office Developments" (2012). Theses
and dissertations. Paper 1339.

This Major Research Paper is brought to you for free and open access by Digital Commons @ Ryerson. It has been accepted for inclusion in Theses and
dissertations by an authorized administrator of Digital Commons @ Ryerson. For more information, please contact bcameron@ryerson.ca.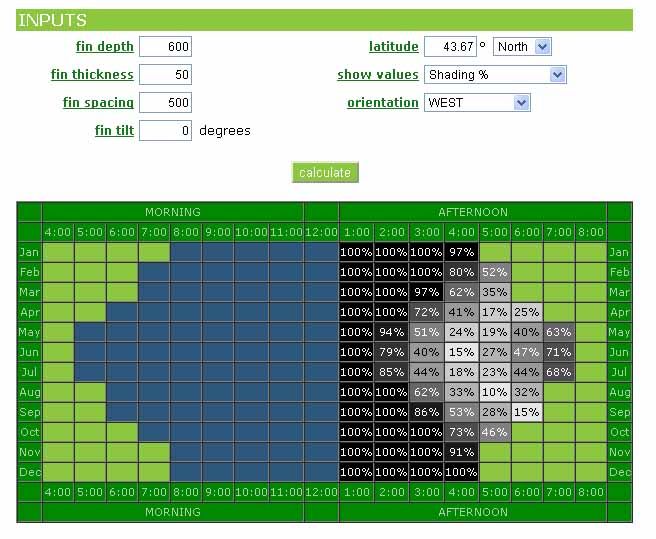
DETERMINING THE EFFECT OF BUILDING GEOMETRY ON ENERGY USE
             PATTERNS OF OFFICE DEVELOPMENTS

                                     by
                            Tonima Ferdous
                        Bachelor of Architecture
        Bangladesh University of Engineering and Technology, 2008

                       A Major Research Project
                     presented to Ryerson University

                        in partial fulfillment of the
                      requirements for the degree of
                       Master of Building Science
                            in the Program of
                             Building Science

                     Toronto, Ontario, Canada, 2012

                         ©Tonima Ferdous, 2012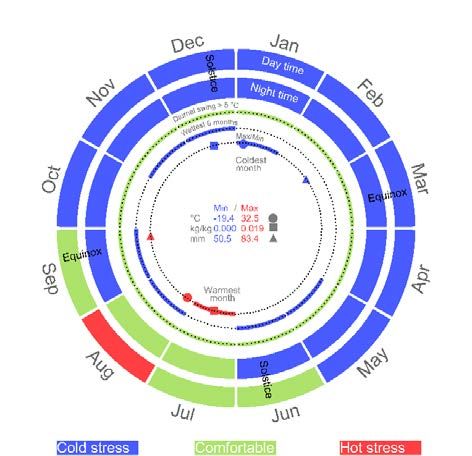
Determining the effect of building geometry on energy use patterns of office developments

Author’s declaration
I hereby declare that I am the sole author of this thesis. This is a true copy of the thesis, including any
required final revisions, as accepted by my examiners. I authorize Ryerson University to lend this thesis
to other institutions or individuals for the purpose of scholarly research. I further authorize Ryerson
University to reproduce this thesis by photocopying or by other means, in total or in part, at the request of
other institutions or individuals for the purpose of scholarly research. I understand that my thesis may be
made electronically available to the public.

                                                     ii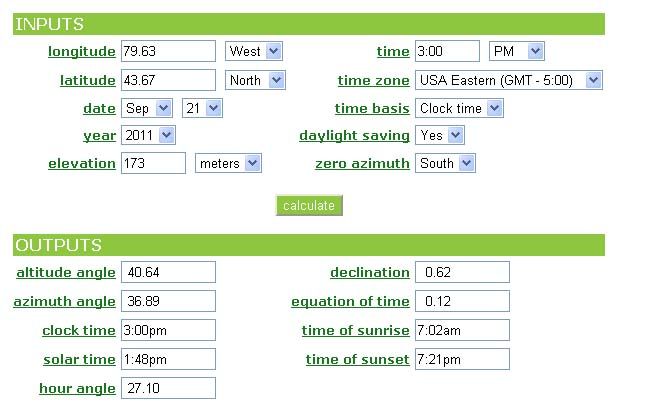
Determining the effect of building geometry on energy use patterns of office developments

Abstract
The project investigates potentials of building geometry to minimize energy consumption in office
developments. Five distinct building geometries are developed to represent mid-size office occupancies in
the context of Toronto (located at southern Ontario, Canada). A square, a rectangle elongated on east-
west, a rectangle elongated on north- south, an H-shape, and a cruciform are examined with varied design
parameters; such as: window to wall ratio and external static solar control devices (horizontal overhangs
and vertical fins). The IES VE software is applied to predict the yearly energy consumption results for 40
analysis permutations. The outcome of this research shows that, the deviation of energy use values from
one shape to another is relatively small. In addition to that, window to wall ratio appears slightly
overpowering on the energy use pattern of a building than its shape. Shading design is found particularly
helpful in reducing cooling energy demand in offices spaces. Overall, the energy performance of five
archetypes is observed to comply with individual building aspect ratios (i.e. compactness). Thus, the
findings of this project are expected to provide useful guidelines to the architects to utilize building
geometry as an energy saving measure when designing office buildings.

                                                    iii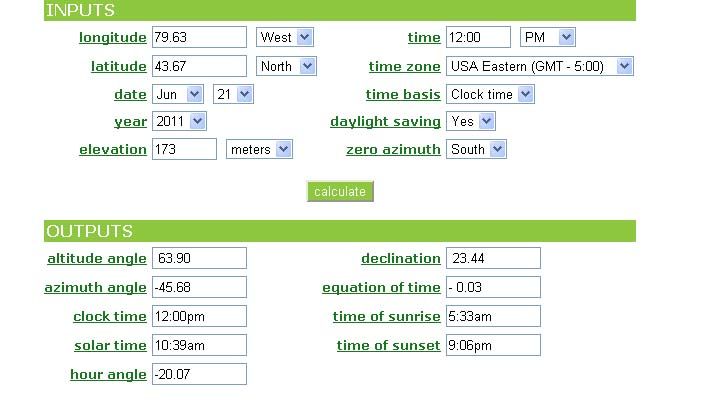
Determining the effect of building geometry on energy use patterns of office developments

Acknowledgements
I would like to express my gratitude to Allah Almighty for giving me such an opportunity to study in
Ryerson University in the midst of wonderful teachers and colleagues. My acknowledgment goes to Dr.
Mark Gorgolewski, my supervisor (both the academic supervisor and the supervisor for MRP), for his
kind guidance; not only for this MRP but also throughout the MBSc program. I would like to thank Dr.
Miljana Horvat, my second reader, for her encouragement and suggestions to finalize the report. My
gratefulness to the IES Technical Support team, who has answered all my enquires that helped me a lot to
learn the software. Mr. Ringo Ng, alumni of Building Science in Ryerson University; thanks for his
suggestions towards my specific queries.

I would like to give thanks to my professors: Dr. Mark Gorgolewski, Dr. Russell Richman, Dr. Zaiyi
Liao, Dr. Hua Ge, Dr. Vera Straka, Dr. Jane Hao, and instructor Mr. Matthew Bowick for their guidance
to the successful completion of my course works. My special mention to Dr. June Komisar; under her
supervision I have performed my graduate assistantship. I would like to thank once again to Dr. Mark
Gorgolewski along with Dr. June Komisar and Dr. Joe Nasr, members of the Carrot City team, who have
given me a chance to work with them in my collaborative workshop. My acknowledgement to my friends
from Ryerson University: Tasnuva Ahmed, Sanaz Hashemian, Rana Qasass, Deniz Ergun, Peta-Gaye
Ebanks, and Melissa Morlidge for their help and assistance especially in group projects throughout the
program. Finally, I would like to take to opportunity to thank my husband, Md Tawhid Bin Waez, for his
continuous support and concern to the accomplishment of my MBSc degree.

                                                   iv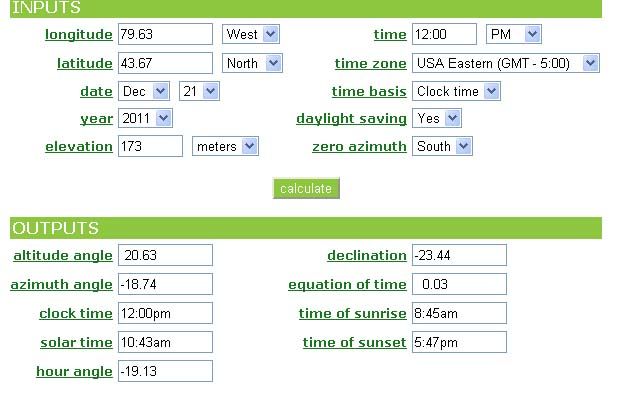
Determining the effect of building geometry on energy use patterns of office developments

Table of Contents
Title page ....................................................................................................................................................... i

Author’s Declaration ..................................................................................................................................... ii

Abstract ........................................................................................................................................................ iii

Acknowledgement ...................................................................................................................................... iv

Table of Contents ......................................................................................................................................... v

List of Tables ............................................................................................................................................. vii

List of Figures ............................................................................................................................................ vii

List of Appendices ...................................................................................................................................... ix

1. Introduction .............................................................................................................................................. 1

            1.1. Problem statement .................................................................................................................... 1

             1.2. Objective and approach of the research .................................................................................. 2

2. Literature review ...................................................................................................................................... 3

            2.1. Importance of ‘building aspect ratio’ on energy performance ................................................. 3

            2.2. Impact of building geometry on lighting energy ..................................................................... 7

            2.3. Impact of fenestration design on energy demand .................................................................... 8

            2.4. Impact of shading design on energy demand ......................................................................... 10

            2.5. Importance of computer simulation on the selection of building geometry .......................... 11

3. Case study projects ................................................................................................................................ 15

            3.1. Case study 1: Agenda 21 Demonstration Energy-Efficient Office Building ......................... 15

            3.2. Case study 2: DOE- NREL Research Support Facility .......................................................... 16

            3.3. Case study 3: Office building of Energinet.dk ....................................................................... 16

            3.4. Case study 4: Lewis and Clark State Office Building ........................................................... 17

4. Methodology .......................................................................................................................................... 17

            4.1. Parametric analysis ................................................................................................................ 17

                         4.1.1. Building geometry ................................................................................................. 17

                                                                                 v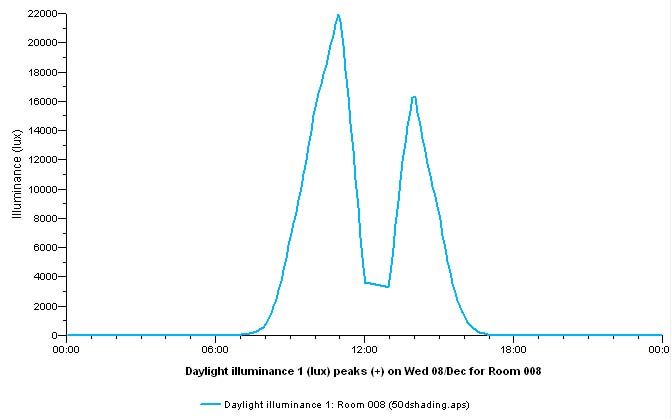
Determining the effect of building geometry on energy use patterns of office developments

                        4.1.2. Window to wall ratio ............................................................................................. 23

                        4.1.3. External shading design ......................................................................................... 23

                        4.1.4. Design of building enclosure ................................................................................. 24

            4.2. Climate analysis ..................................................................................................................... 25

            4.3. Energy simulation tool ........................................................................................................... 26

                        4.3.1. Developing models for energy simulations (massing and volumes) ...................... 26

                       4.3.2. Performance analysis ............................................................................................. 27

            4.4. Simulation inputs and assumptions ....................................................................................... 28

                       4.4.1. Site and weather data .............................................................................................. 28

                       4.4.2. Zoning .................................................................................................................... 28

                                                      i) Zoning based on functional spaces .............................................. 29

                                                      ii) Zoning based on functional spaces ............................................. 29

                       4.4.3. Scheduling and profiles .......................................................................................... 30

                       4.4.4. Thermal conditions ................................................................................................ 31

                       4.4.5. Description of systems ........................................................................................... 31

5. Analysis of results .................................................................................................................................. 32

            5.1. Explanation of energy factors ............................................................................................... 32

            5.2. Performance analysis of individual archetypes ...................................................................... 34

            5.3. Comparison of five archetypes .............................................................................................. 35

                       5.3.1. Impact of ‘shape’ versus ‘window to wall ratio’ .................................................... 37

                       5.3.2. Discussion on individual energy factors ................................................................ 38

                                                      i) Space heating energy ................................................................... 38

                                                      ii) Space cooling energy ................................................................. 40

                                                      iii) Lighting energy ......................................................................... 41

           5.4. Features of archetypes that modulate energy performance .................................................... 42

                       5.4.1. Forms with different orientations............................................................................ 44

                                                                            vi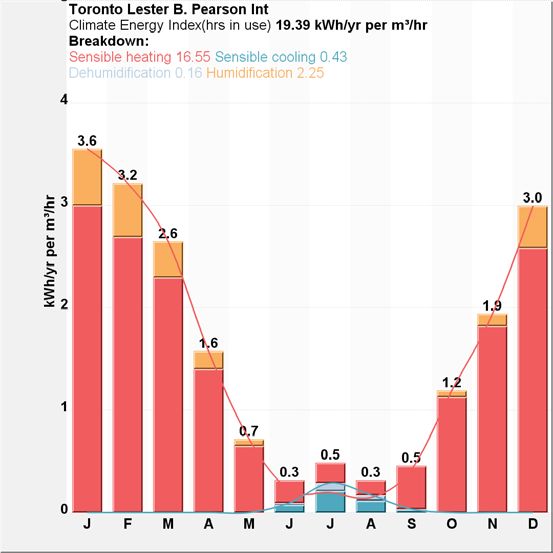
Determining the effect of building geometry on energy use patterns of office developments

                        5.4.2. Forms with narrow wings ...................................................................................... 45

            5.5. Performance comparison with industry standards ................................................................. 46

            5.6. Summary of results ................................................................................................................ 47

6. Conclusion and recommendations to future work ................................................................................. 48

7. References .............................................................................................................................................. 49

8. Bibliography .......................................................................................................................................... 52

List of tables
Table 1: Summery of the reviewed researches .......................................................................................... 12

Table 2: Geometric description of archetype buildings ............................................................................. 22

Table 3: Construction U values .................................................................................................................. 25

Table 4: Summary of scheduling and profiles ........................................................................................... 30

Table 5: Summary of template inputs ........................................................................................................ 31

Table 6: Summary of analysis permutations .............................................................................................. 33

Table 7: Total energy comparison of five archetypes ................................................................................ 36

Table 8: Total energy comparison of five archetypes with building aspect ratios ..................................... 43

List of figures
Figure1: Impact of the building shape on heating loads; Gratia & De Herde (2003) ................................... 4

Figure 2: Different plan forms representing mid- size office buildings; Ross (2009) ................................. 5

Figure 3: L-type, T-shape, H-shape, cross shape, U-shape, cut shape, and rectangular shape office
buildings; AlAnzi, Seo, & Krarti (2009)....................................................................................................... 5

Figure 4: F/E ratios for different building forms; Straube (2012) ................................................................ 7

Figure 5: Example of building footprints with high daylight access; PWGSC (2002) ................................. 8

Figure 6: Three distinct geometries explored in the work of Settlemyre (2009) ........................................ 11

                                                                             vii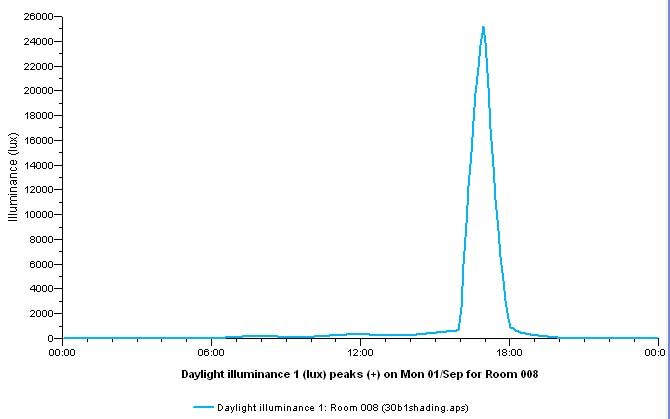
Determining the effect of building geometry on energy use patterns of office developments
Figure 7: Typical floor plan (Agenda 21 Demonstration Energy-Efficient Office Building);
DOE (2000) ................................................................................................................................. 16
Figure 8: Aerial view of DOE- NREL Research Support Facility;
http://www.wausauwindow.com................................................................................................. 16
Figure 9: Typical floor plan; Henning Larsen Architects (n.d)................................................................... 17
Figure 10: Typical floor plan of Lewis and Clark State Office Building; MDNR (n.d.) ............................ 17
Figure 11: Methodological framework ...................................................................................................... 19
Figure 12(a): Schematic plans of archetype buildings ............................................................................... 20
Figure 12(b): 3D images of archetype buildings ........................................................................................ 21
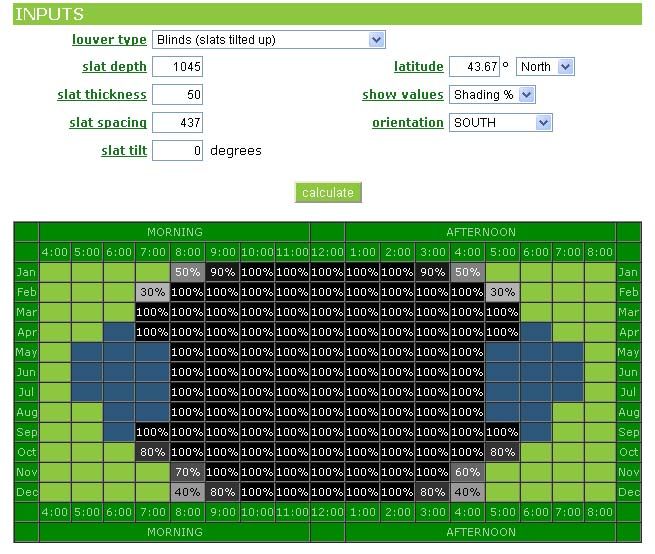
Figure 13(a): Typical section showing overhang design for south façade (WWR 30%) ........................... 24
Figure 13(b): Vertical fin design for a typical west façade (WWR 30%)................................................... 24
Figure 14: Zoning of archetypes based on functional spaces (plan view) .................................................. 29
Figure 15: Energy use pattern (MWh/yr) of SQ for variable WWR and shading scenario ....................... 34
Figure 16(a): Total energy (MWh/yr) results of five archetypes (no shading) ........................................... 37
Figure 16(b): Total energy (MWh/yr) results of five archetypes (with shading)........................................ 37
Figure 17(a): Space heating energy (MWh/yr) results of five archetypes, for WWR of 30% - 80% (no
shading) ....................................................................................................................................................... 39
Figure 17(b): Space heating energy (MWh/yr) results of five archetypes, for WWR of 30% - 80% (with
shading) ....................................................................................................................................................... 39
Figure 18(a): Space cooling energy (MWh/yr) results of five archetypes, for WWR of 30% - 80% (no
shading) ....................................................................................................................................................... 40
Figure 18(b): Space cooling energy (MWh/yr) results of five archetypes, for WWR of 30% - 80% (no
shading) ....................................................................................................................................................... 40
viii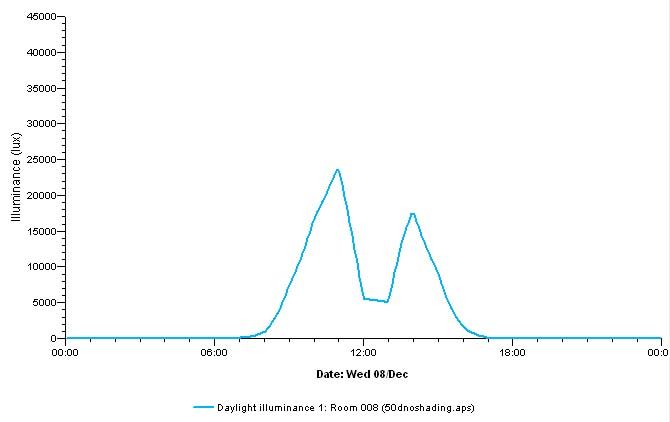
Determining the effect of building geometry on energy use patterns of office developments

Figure 19(a): Lighting energy (MWh/yr) results of five archetypes, for WWR of 30% - 80%

(no shading) ................................................................................................................................................ 41

Figure 19(b): Lighting energy (MWh/yr) results of five archetypes, for WWR of 30% - 80% (with
shading) ....................................................................................................................................................... 42

Figure 20: Comparison of energy patterns (MWh/yr) of RecEW and RecNS for variable WWR and
shading scenario ......................................................................................................................................... 44

Figure 21: Comparison of energy patterns (MWh/yr) of Cross and H for variable WWR and shading
scenario ....................................................................................................................................................... 46

Figure 22: Comparison of energy intensity results of 40 simulations to the industry standards ............... 47

List of appendices
Appendix I: Elevations of SQ for varying WWR ...................................................................................... 53

Appendix II: Developing shading strategies .............................................................................................. 54

Appendix III: Overhang design for varied WWR ..................................................................................... 56

Appendix IV: Construction details of building envelope .......................................................................... 57

Appendix V: Analysis on Toronto climate ................................................................................................ 60

Appendix VI: Zoning based on photocells ................................................................................................ 62

Appendix VII: Performance rating method, ASHRAE (2007) ................................................................... 64

Appendix VIII: Scheduling and profiles .................................................................................................... 64

Appendix IX: Description of the thermal templates .................................................................................. 67

Appendix X: Selection of systems ............................................................................................................. 68

Appendix XI: Energy patterns of the archetypes (graphical representations and numerical results) ........ 69

Appendix XII: Correlation between cooling and lighting energy in SQ .................................................... 72

Appendix XIII: Comparison of daylight illuminance in RecEW and RecNS ............................................ 73

                                                                                ix
Determining the effect of building geometry on energy use patterns of office developments
Appendix XIV: Comparison of daylight illuminance in H and Cross ……………………………………74
Self- shading analysis in H and Cross ........................................................................ 75
xDetermining the effect of building geometry on energy use patterns of office developments
1. Introduction
1.1. Problem statement
Energy is an important environmental parameter and energy use is directly related to climate change as
well as a variety of air emissions (BOMA Canada, 2011). Optimization of energy performance is a crucial
factor in any office building design. Energy consumption in the commercial and institutional building
sector accounts for almost 13.8% of secondary energy use in Canada and almost 8.9% of the country’s
greenhouse gas (GHG) emissions (National Resources Canada, 2008). Office buildings (and civic
administrative buildings) contribute significantly in Canada’s commercial building sector as well as the
energy consumption statistics (NRTEE & SDTC, 2008). Climate change and its consequences has
become a center of a public concern worldwide and the energy consumption in the building sector is seen
as the core of the problem. It necessitates undertaking strategies that stimulate a more sustainable design
in line with less consumption of energy, at the conceptualization phase. Utilization of passive solar
design, accurately proportioned fenestration system to maximize daylight, and controlling direct solar
gain to lower the cooling demand during cooling seasons; are strategies gaining importance among
architects and building scientists. The role of building geometry can become a potential means to reduce
building’s overall energy performance. It is unfortunate that, ‘form’ often receives less concern as a
design element while prioritizing the accommodation of complex functions in an office space by any
means. As a matter of fact, the shape of a building respective to the climate and context is the only
element which will not change radically during the life cycle of a building. Selection of the formal
configuration along with depth and height of rooms and the size of windows can together double the
eventual energy consumption of the finished building (Gratia & De Herde, 2003). Thus decisions at the
early stages of a building design would have substantial impact on the energy efficiency of the resultant
building. With the application of building simulations designers can predict the energy loads, test and
compare permutations of design strategy in order to optimize design (Pollock, Roderick, McEwan, &
Wheatley, n.d.).
Several researches are found which have examined the effect of shapes, fenestration design, and shading
strategies on the energy use of buildings. However, studies combining different design parameters are rare
especially in the context of Canada. There are disputes among researchers about how to conclude about
the role of geometry that modulates energy performance of office buildings. Some studies identify that the
shape of a building can have significant impact on the energy costs of heating and cooling (AlAnzi,Seo,
& Krarti, 2009). Others opine that building form and orientation do not largely influence the energy
consumption, especially in case of mid-size or large buildings (Straube, 2012). Hence, it is required to
1Determining the effect of building geometry on energy use patterns of office developments
attempt a thorough research to examine the potentials of building geometry, along with other envelope
design parameters, to minimize energy consumption in office developments in Canada.
1.2. Objective and approach of the research
The research aims at exploring:
The influence of building geometry 1 on the energy use patterns of office buildings.
It is intended to identify the importance of ‘shape’ compared to other building envelope factors
such as fenestration 2 (window to wall ratio) and sun control strategies (external shading devices).
To achieve these objectives, following steps are taken in methodology of this research:
Archetype buildings of equal floor area are developed with basic geometries to be modeled as
office buildings.
As the site climate determines the general magnitude of each energy end use; the selection of
location and climate zone is an important factor. Hence, the research is conducted for Toronto
representing the context and climate of southern Ontario, Canada.
Daylight harvesting with properly designed fenestration can have great impact on the electric
consumption by artificial lighting in a space. To investigate this issue, analysis of daylighting
with respect to fenestration system is also carried out in this project.
While glazing can assist with natural lights it can also lead to excessive solar gains. Therefore, the
effect of external shading devices, as a sun control strategy, is incorporated to the parametric
analysis.
Simulations are conducted on archetype models using energy simulation software to find the
whole building energy demand; specifically heating, cooling, and interior lighting energy.
After analyzing the results, it is identified:
i) The impact of design parameters on energy demand,
ii) The dominance of design parameters on energy demand and,
1
Building geometry, in general, refers to the measurements related to building configuration and
arrangement. In a broader sense, it includes the components of building envelope, such as; walls, roofs,
floors, doors, and fenestration, which interact with the exteriors and mediate the difference between
outdoor conditions and desired indoor conditions (Deru & Torcellini, 2005).
2
Fenestration is coined as building components that transmit light including windows, translucent panels,
clerestory windows, skylights, glazed portions of doors, and glass block walls (Deru &Torcellini, 2005).
This study refers to windows only, as fenestration element.
2Determining the effect of building geometry on energy use patterns of office developments
iii) Correlation among different energy factors.
This research attempts to integrate design factors; such as: form, window to wall ratio, and sun control
strategies to find out their relative importance over the whole building energy demand. From this
standpoint, the findings of this work can become worthwhile as it is combining analysis of several
parameters that have good prospects on basic building configuration and envelope decisions that are made
early in the design process by the architects. Moreover, the simulation results of the examined archetypes
provide a prediction of annual energy use at their operational phase. If building design, at its preliminary
phase, is guided by its future energy performance, it will essentially help designers to contribute toward
the environmental sustainability. The five archetypes explored in this project are of very basic geometries;
yet, the study does not intend to pose limit on the choice of building geometry for office design. Rather,
the results of this research can be reviewed to be manipulated on a variety of building configurations.
2. Literature review
A thorough literature review is carried out based on four parameters: building aspect ratios, geometry,
fenestration design, and solar shading analysis. The literature review is helpful to identify key concepts
which have supported the methodology of this research and provided useful comparison to the findings of
this work.
2.1. Importance of ‘building aspect ratio’ on energy performance
Several literatures have employed the concept of building aspect ratios as an indicator to define the way
by which a form responds to its climate. One concept is found to be widely used: forms with different
geometry of the same contained volume have different surface areas. This is expressed as volume to
surface ratio (V/S). The second concept is: a building with a high V/S takes more time to be affected by
the exterior temperature variations than that of a lower V/S of the same structure (Behsh, 2002). Based on
these concepts, the shape of a building can play a significant role since it determines the surface of the
external envelope.
Gratia and De Herde (2003) have defined the volume to surface area ratio (V/S) as ‘compactness’ (C) of a
form. Here the surface area of a building includes wall surfaces, roof surface, and ground surface. As
heat losses are proportional to the surface area of envelope, the more compact a form, the less will be the
heat loss. Buildings with non- rectangular plan (or with complicated configurations) are prone to thermal
bridges and losses; as the junctions of structural components do not lie on the same plane. The authors
perform simulations on five different forms (Figure 1) to identify the role of ‘compactness’ on the heating
loads of buildings in the context of Belgium. Envelope design and fenestration areas remain fixed for all
five forms. Their study turns out with the result that a high C (compactness) form corresponding to the
least heating load requirement per year (Figure 1). The building with a V/S of 1.24 (highly compact)
3Determining the effect of building geometry on energy use patterns of office developments
requires 20.73% less space heating energy while compared to a building with a V/S of 0.84 (the least
compact form studied).
Figure 1: Impact of the building shape on heating loads; Gratia & De Herde, 2003
Ross (2009) has conducted a research to determine the influence of decisions taken at the preliminary
design stage on the energy intensity of the built project. The author analyzes mid-size office buildings
with a total floor area of 4662m2 (with 4 stories, 1165.5m2 per floor) for Toronto climate for five distinct
geometries (Figure 2). The built forms are specified primarily with the ratio of ‘façade area: gross floor
area (GFA)’ and secondly, with the ratio of ‘surface area (including roof): GFA’. Three variation of
façade layout (with window to wall ratio of 20%, 40%, and 60% respectively) are tested for each form.
The thermal resistances of the enclosure are maintained similar in all simulations. When the annual
energy intensity is compared, the square form (regardless of window to wall ratio) is resulted with the
least energy requirement among others. The most energy intensive is found the H-shape regardless of its
orientation. It supports that, the building with the highest ‘façade to GFA’ ratio consumes less energy on
an annual basis and the lower the ratio, the greater the energy consumptions. It is also found factual for
the ‘surface area to GFA ratio’. The study concludes that, regardless the effect of fenestration amount, a
building’s energy performance is always determined by the proportions of its surface.
4Determining the effect of building geometry on energy use patterns of office developments
EW
SQ
HE HN
NS
Figure 2: Different plan forms representing mid- size office buildings; Ross (2009)
AlAnzi, Seo, and Krarti (2009) have proposed a different metric to measure the ‘compactness’ of a form;
relative compactness (RC) is used in their study as an indicator while assessing the impact of shape on the
building energy performance. It is mathematically described as: RC= (V/As) building / (V/As) ref ; where
(V/As) building is the compactness of a specific shape, and (V/As) ref is the compactness of a reference
building. Here V and A s are referred, respectively, to the conditioned volume and envelope surface area
exposed to the outdoor air (i.e., exposed exterior wall area but except the roof surface). The ratio is further
simplified as RC= (As) ref / (As) building ; since the floor area and total height of any building configuration
are identical in their work, the building volume is constant in all cases. The authors have developed seven
different shapes as representative of prototypical office building in Kuwait (Figure 3). All buildings are
modeled as 20 stories with the same floor area of 12500m2 (i.e. 625 m2 per floor). Analysis is carried out
with window to wall ratios to vary from 0% to 75%. The overall U-values in each analysis remain
constant. After the simulations, it is observed that as the RC increases, the exterior wall area exposed to
ambient conditions decreases and consequently the building energy decreases regardless of WWR.
However, the trend is found to depend slightly on the building shape due most likely to variation in solar
exposure for different building shapes.
Figure 3: L-type, T-shape, H-shape, cross shape, U-shape, cut shape, and rectangular
shape office buildings; AlAnzi, Seo, & Krarti (2009)
5Determining the effect of building geometry on energy use patterns of office developments
Behsh (2002) has researched on the thermal response of building envelop as a function of its geometric
shape in the context of Mediterranean region. His study depicts that the volume to surface area ratio
(V/S) is not precise enough for providing a clear understanding of the thermal response of forms with
complex shapes; such as: building with a courtyard, L shape, U shape, and a large number of other forms.
He investigates three levels of relations between the forms and the surroundings:
i) The relation between surfaces and volume (V/S)
ii) The relation between the south oriented surfaces to the west oriented surfaces (S wsouth /S wwest)
iii) The relation between the roof area and walls (S roof / S wall)
A number of different geometries are developed in his work to have similar contained volume, glazing
area, and structural properties. The results of the simulation study are discussed in terms of duration of
cooling period. It is observed that form with a rectangular shape (elongated on east-west axis) shows
better response during the overheated days. In opposite to that, a square form demonstrates better
response during the cold days. Therefore, if the compact form is chosen as a design option, the form with
a low V/S placed along east-west is the most perfect for the Mediterranean climate. An important result
comes out from his research: despite of having equal V/S buildings can show different thermal
performance. Therefore, the author suggests the most relevant factor to analyze their thermal performance
would be the ‘S wsouth /S wwest ‘. Behsh (2002) also finds that the form with the least roof area of the same
total space is mostly recommended as the roof is a major component of a building where it constitutes the
primal source for thermal stress both under the cold and the overheated period. The author concludes that,
a form with a large size of southerly oriented areas is the most optimal form, as it will receive the lowest
amount of heat during summer and the highest amount during winter in the climate of Mediterranean
region.
‘Building form and orientation do not have as large an impact on energy consumption as sometimes
thought, especially for mid-size or large buildings’ (Straube, 2012). Here, the author prefers the ratio of
usable floor area (F) to above grade enclosure area (E) for commercial buildings (Figure 4). With a high
F/E, forms become more compact. Buildings like offices do not require volume for their function; it is the
floor area which is needed to be concerned. This metric (i.e., F/E) includes the roof area but does not
account for ground contact area like V/S ratio. The ground remains at a more moderate temperature
difference compared to that of walls or roofs, and is not affected by solar radiation; therefore the slab and
basement influence on decisions should be of less concern. The author also depicts that, for the same heat
loss through the enclosure (i.e., the same overall U value or R value) on a winter night, the heating energy
intensity will be higher for a low F/E and lower for high F/E ratios. However, the benefit of compactness
6Determining the effect of building geometry on energy use patterns of office developments
of forms can be achieved technologically by improving the enclosure R value. In practice, a small
increase in overall average R value is easier than modifying the building geometry.
Two 3.6 m stories
13.7mx 67.7m Two 3.6 m stories
Area= 1858m2 30.5mx 30.5m
F/E= 0.88 Area= 1858m2
F/E= 1.02
Six 3.6 m stories Six 3.6 m stories
15.2mx 61m 30.5x 30.5m
Area= 5574m2 Area= 5574m2
F/E= 1.3 F/E= 1.55
Figure 4: F/E ratios for different building forms; Straube (2012).
The size of a building in floor area is a better indicator of energy gain/loss through the enclosure than plan
shape (Straube, 2012). Ross (2009) has found that the impact of a building form on total energy
consumption for a given floor size is less for larger buildings than small buildings. Pope (2012) performs
a fixed area proportion analysis on office occupancy beginning from a single story up to 18 stories
stacking. With increasing number of floors, the V/S increases; consequently, the energy intensity goes
down significantly. Behsh (2002) observes that a form that has the less roof surface among others of the
same total space area would be least energy intensive.
2.2. Impact of building geometry on lighting energy
Some geometry is found to be preferred particularly for daylight harvesting (Figure 5). Access of natural
light to interior can control cooling and heating loads of a building to some extent. Therefore, choosing
geometry to maximize daylighting would have significant impact over the total energy use of a building.
Long and narrow footprints better serves this purpose compared to square ones (Public Works and
7Determining the effect of building geometry on energy use patterns of office developments
Figure 5: Example of building footprints with high daylight access; PWGSC (2002)
Government Services Canada [PWGSC], 2002). In addition to that, buildings can be arranged as a series
of wings to get better access to daylight.
A long narrow floor plan gets benefit over a square form in relation to daylighting and natural ventilation;
although the square form is regarded as the most compact of all forms. Therefore, certain trade-off occurs
between a compact form that minimizes conductive heat transfer through the envelope and a form that
facilitates daylighting, solar gain, and natural ventilation. Although square buildings have lower heating
loads, daylighting the interior is critical and the imbalance between perimeter heating loads and interior
cooling loads often necessitates a complex HVAC system. While a narrow shape may appear to
compromise the thermal performance of the building, the electrical load and cooling load savings
achieved by a well- designed daylighting system will more than compensate for the increased skin losses
(Los Alamos National Laboratory [LANL], 2002). Many low energy commercial buildings are designed
as a compact form with the short dimension of around 14 to 18 m (Straube, 2012). Such configuration
helps to reduce lighting loads to a minimum, using daylight controls and daylight harvesting. Offices
around a double loaded corridor can be daylit, if the building is about 2x2-2.5 (daylight zone depth)
x2.74-3 (ceiling height) = 10.97-15.24m plus the corridor or core width (Straube, 2012). All these studies
suggest minimizing the depth of a building on north-south to have greater exposure from south orientation
for daylighting design.
2.3. Impact of fenestration design on energy demand
Low-energy and passive buildings in northern climates typically are not designed with highly glazed
facades as windows are traditionally the least insulating and highest-air leakage component of the
building envelope. ASHRAE (2004) recommends a 20% -40% WWR suitable for Toronto climate (or for
climate zone 6). Moreover, it is recommended that, glazed area on east and west orientation should be less
in proportion to that of north and south orientation (ASHRAE, 2004). Although windows provide many
benefits that enhance building performance and occupant comfort through passive heating, daylight and
views; most of these benefits are overshadowed by excessive window area and lack of solar protection.
8Determining the effect of building geometry on energy use patterns of office developments
Consequently, window assemblies are often considered responsible for increased heating loads due to
daily net-heat loss, glare, and increased cooling loads due to overheating.
Pope (2008) has studied the effect of window to wall ratio (from 40% up to 95%) on a MNECB’97
(Model National Energy Code for Buildings) reference building for small office archetype. The author
observes that if WWR is increased, along with high performance glazing, it provides performance benefit.
For instance, windows with triple pane, U (thermal transmittance) of 0.94 and SC (shading coefficient) of
0.31 found to reduce 16% energy consumption, if applied with WWR of 40%. With the same
specification, if WWR is increased to 55%, still performance benefit is achievable, with a 10% reduction
from MNECB (Figure 2.7). These comparisons declare that, if high quality windows are used, despite of
higher fenestration area, a building can perform well.
Building geometry for energy conservation is often related to fenestration area and orientation of
windows. Proper positioning of windows can influence the daylighting design as well as the artificial
lighting consumptions in office spaces. Cooling loads become a matter of concern in case glazed surfaces
are directed to east- west. These orientations require external solar protection resulting with reduced
daylight harvesting to interior (thus induces internal gain from intensive use of artificial lights); which
eventually increases the cooling demand (Gratia & De Herde, 2003). Gratia and De Herde (2003) have
experimented aiming to determine which orientation is most preferable for glazing to be positioned in
conjunction with external shading devices. According to their study, large glazing areas with sun control
facing south are preferable compared to north oriented glazing without solar protection. The referenced
work provides useful findings on impact building orientation over heating and cooling demands; however
it does not account for fenestrations on all four elevations (i.e., only north and south glazing are simulated
separately for some cases and only east- west windows are simulated separately in other cases).
According to Ross (2009), WWR has slightly stronger impact on the energy results compared to building
shape and orientation. The author analyzes different geometries (refer to Figure 2) with window to wall
ratio of 20%, 40%, and 60% respectively. The annual energy intensity (kWh/m2/yr) of other shapes when
compared to the square form (for similar WWR) is found to increase in the range of 1% to 6%. For
instance, a square form uses 172kWh/m2/yr; in comparison a rectangular form uses 174kWh/m2/yr, an
increase of 1%, and an H shape uses 182 kWh/m2/yr, an increase of 6%.On the contrary, changing WWR
from 40% to 60% (in case of a square form) causes the energy intensity to increase by 4.9% (from
164kWh/m2/yr to 172kWh/m2/yr) which indicates the power of WWR.
9Determining the effect of building geometry on energy use patterns of office developments
2.4. Impact of shading design on energy demand
The question of sun control comes next to design for daylighting. The goal of shading design is to shade
direct sun but not daylight. Researches based on fenestration and shading design often regard daylight
controlled dimming systems with respect to daylight harvesting. Photo-sensors, as one of the daylight
harvesting strategies, can reduce electric consumption of lights if properly positioned in accordance with
fenestration design. Relevant work is done by Hammad and Abu-Hijleh (2010). They have explored the
impact external louvers (both dynamic and static) on the energy consumption of an office building in of
Abu Dhabi- UAE. Horizontal louvers are used for the south façade while vertical louvers are used for
both the east and west facades. The potential of energy savings due to the dynamic louvers are found with
lighting and cooling control. The reduction in these loads is roughly proportional to the degree of the
louver’s openness and its relation to solar position. The energy savings, placing dynamic louvers in east
and west orientation, are lower than savings for the south façade. This is mainly due to the sun’s daily
path as each of the east and west facades is not exposed to direct sunlight throughout the day, unlike the
south facing facades (which has a high and long duration exposure to sunlight) in the climate of UAE.
Even if only dimming control is employed (no shading devices) it is found advantageous in energy
reduction.
Ross (2009) has explored the effect of daylight control dimming coupled with fenestration design. She
identifies that a mid- sized office in Toronto (for instance a square building with 60% WWR) may
become 8.2% more energy intensive if does not use daylight dimming sensors (without dimming the
energy intensity is 172 kWh/m2/yr whereas with daylight dimming sensors, it requires 159 kWh/m2/yr).
The energy use profiles show that daylight sensors reduce the energy required for lights per month, fairly
throughout the year. The energy for heating goes up slightly to compensate for the heat not generated
internally by lights. In opposite to that, energy needed for cooling and fans drops when area lights are on
daylight controls. The study provides useful data regarding the application of daylight dimming controls
to be utilized in our project. However, the author concludes that there is no special synergy between plan
form and daylight sensors, with respect to energy use.
It can be assumed that, exterior shading devices could lower or perhaps eliminate the need for cooling in
northerly latitudes. To investigate this issue, Ross (2009) has performed another study to know the effect
of sunshades in Toronto climate. She applies a standard shading design (horizontal overhang) for all
windows except those facing north. The shading strategy is applied on five distinct geometries (4645
m2 each and 4 stories) with a WWR of 40% (referred to Figure 2 for the geometries tested). Only the
square building has been observed with an increase in energy intensity when awnings are added to the
design. Cooling and fan energy are reduced, but heating energy goes up slightly greater amount. The
10Determining the effect of building geometry on energy use patterns of office developments
author explains a reason for this: additional heating is needed in January and February, perhaps because
the awnings shade the south windows partially, during mid-day, at the time. The other four forms remain
unaffected with inclusion of external shading. However, the referenced work does not consider daylight
dimming sensors therefore, the effect of shading design on lighting consumption remains unexplored. It
would be interesting to observe how the results appear in this project in case when external shading
design is incorporated to various building geometries.
2.5. Importance of computer simulation on the selection of building geometry
Computer simulations are the only practical way to predict the dynamic energy performance for a large
number of design solutions (LANL, 2002). A detailed load analysis through computer simulation can
identify energy saving opportunities early in the design process. Based on the findings, modifications can
be made on the form, orientation, or fenestration of the building (LANL, 2002). To really influence a
building’s design at early stages simplified versions of energy modeling are needed to be developed
(Settlemyre, 2009). An analysis has been done by Settlemyre (2009) on three very different forms (Figure
6) each with 18600m2 of total floor area. Energy simulation tool IES VE is used to calculate peak
building loads and shape the full year energy picture. The three models are first analyzed with a ‘split
system with mechanical ventilation and cooling’. The rectangular form is found as the best performer in
total energy consumption for the year (187 kWh/m2). The worst of the three forms is the wing shape,
which is 11% higher, while the U shape is 6% higher compared to the rectangle. In the next phase,
simulations are run for a VAV dual duct system. In each case the VAV dual duct was the better performer
with 5.5% reduction for the rectangular form, 4.25% reduction in U shaped form, and the lowest, a 3.7%
reduction in the wing form. The study of Settlemyre (2009) becomes a useful reference for this research,
because it provides background to the early stage energy modeling. Moreover, the choice of mechanical
systems (VAV dual duct) for this project is determined based on the findings of the referenced work.
Wing U-shape Rectangular
Figure 6: Three distinct geometries explored in the work of Settlemyre (2009)
11Determining the effect of building geometry on energy use patterns of office developments
A summary table depicting the major findings of all the reviewed researches is presented below (in Table
1):
Table 1: Summery of the reviewed researches
Topic Author Study Major findings
context
Building Gratia & De Belgium Forms with a high V/S correspond to the least annual
aspect ratio Herde (2003) heating load.
Ross (2009) Canada Regardless the effect of fenestration amount, a
building’s energy performance is always determined
by the proportions of its surface.
AlAnzi, Seo, & Kuwait For buildings with low WWR the total energy use is
Krarti (2009) proportional to building’s exterior wall area
independent of its form.
Behsh (2002) Mediterranean Buildings with similar compactness can behave
region differently due to the difference in wall area and
orientation for solar exposure.
Straube (2012) Canada For the same heat loss through the enclosure, the
heating energy intensity will be higher for a low F/E
and lower for high F/E ratios.
Size of a Straube (2012) Canada Size of the building in floor area is a better indicator
building of energy gain/loss through the enclosure than plan
shape.
Ross (2009) Canada A square form large building uses 9.33% less energy
compared to a medium square building and 29.33%
less energy than a small square building.
Pope (2012) Canada With increasing number of floors, the V/S increases;
consequently, the energy intensity goes down
significantly.
Behsh (2002) Mediterranean A form that has the less roof surface among others of
region the same total space area would be least energy
intensive.
Building PWGSC Canada A long narrow floor plan gets benefit over a square
geometry and (2002) form in relation to daylighting and natural ventilation
12Determining the effect of building geometry on energy use patterns of office developments
lighting LANL (2002) U.S.A. While a narrow shape may appear to compromise the
energy thermal performance of the building, the electrical
load and cooling load savings achieved by a well-
designed daylighting system will more than
compensate for the increased skin losses.
Straube (2012) Canada Commercial buildings with the short dimension of
14 to 18 m have reduced lighting loads.
WWR and ASHRAE A 20% -40% WWR suitable for Toronto climate.
energy (2004)
demand Pope (2008) Canada If high quality windows are used, despite of higher
fenestration area, a building can perform well.
Gratia & De Belgium Large glazing areas with sun control facing south are
Herde (2003) preferable compared to north oriented glazing
without solar protection.
Ross (2009) Canada WWR has slightly stronger impact on the energy
results compared to building shape and orientation.
Shading Hammad & U.A.E. The potential of energy savings due to the dynamic
design and Abu Hijleh louvers are found with lighting and cooling.
energy (2010)
demand Ross (2009) Canada In Toronto, exterior awnings are not useful for
reducing the overall energy use in an office building.
Daylight Hammad & U.A.E. Even if only dimming control is employed (no
dimming Abu Hijleh shading devices) it is found advantageous in energy
control (2010) reduction.
Ross (2009) Canada There is no special synergy between plan form and
daylight sensors, with respect to energy use.
Early stage Settlemyre U.K. To influence a building’s design at early stages
energy (2009) simplified versions of energy modeling are needed to
modeling be developed.
McEwan, U.K. Changing the design at the early stages is most
Roderick, flexible and it helps to improve overall energy
Pollock, & performance.
Wheatly (n.d.)
13Determining the effect of building geometry on energy use patterns of office developments
The studies [Gratia & De Herde (2003), Ross (2009), AlAnzi, Seo, & Krarti (2009), Behsh (2002), and
Straube (2012)] discussed in this section represent different climate and regions. Nevertheless, all of them
depict ‘building aspect ratios’ as an important indicator of a building’s energy performance from
individual perspective. Among them, the concept of ‘compactness’ defined by the floor to enclosure area
ratio (F/E) (Straube, 2012) would be analyzed in this research for its relevancy to this project.
‘Compactness’ measured by the ratio of volume to surface area (V/S) will also be compared for different
geometries to see if the plan forms do actually conform to this aspect ratio (V/S) for their energy pattern
or not. The parametric analysis and methodology of the reviewed studies are found to be dissimilar if
compared to one another in many cases. For instance, the finding of Behsh (2002) and AlAnzi, Seo, and
Krarti (2009) state that building with similar compactness can behave differently due to the difference in
wall area and orientation for solar exposure. Here the former research is conducted on low rise buildings
and the latter is performed on high rise buildings. Therefore, it would be interesting to see how
geometries of similar compactness but with different configurations behave in regard to energy
consumption in the context of this project. Several reports are available focusing on the fenestration
design to determine buildings’ energy consumption pattern. Gratia and De Herde (2003) in their study
suggest increasing the south glazing with solar shading in office buildings. However, their study has not
accounted for fenestrations on all four elevations simultaneously. Therefore, their conclusion is not
complete enough to understand the impact of fenestration over the building’s heating and cooling
demands. The most relevant work is found in the report of Ross (2009) which is conducted for Toronto
climate. She has identified that, WWR is more dominant than plan forms in modulating energy usage of a
building. However, the author has not considered the impact of daylight for varying WWR. Afterwards,
she performs some supplemental simulations with addition of daylight control dimming sensors. In that
case, she concludes that there is no special synergy between plan form and daylight sensors with regard to
energy use. The finding of Ross (2009) thus requires further investigation to provide a comprehensive
final remark. The study of Hammad and Abu- Hijleh (2010) has shown that daylight dimming sensors and
external shading can reduce total energy demand in office spaces in the climate of Abu-Dhabi. However,
they only made observations based on a single plan form. Ross (2009) has analyzed the impact of shading
devices on several plan forms and concluded that exterior awnings are not useful to reduce overall energy
use in offices in Toronto. To be noted, Ross (2009) has put horizontal overhangs on south, east, and west
orientations and has not accounted for natural light; which resulted with decrease in cooling loads only
with lighting demand remain unchanged.
Several queries remain unanswered if the previous works are reviewed. Such as: what would be the
impact of variable fenestration ratio on different building geometries if daylight harvesting becomes a
14You can also read