Eco-friendly supermarkets - an overview - Report 2 - hydrocarbons21
←
→
Page content transcription
If your browser does not render page correctly, please read the page content below

Eco-friendly
supermarkets -
an overview

Report 2
Public report

for the project:

SuperSmart - Expertise hub for a market
uptake of energy-efficient supermarkets
by awareness raising, knowledge transfer
and pre-preparation of an EU Ecolabel

Lead authors:

Mazyar Karampour, KTH
Samer Sawalha, KTH
Jaime Arias, KTH

Publishing & Communication:

Nina Masson, shecco

More information:

www.supersmart-supermarket.org
info@supersmart-supermarket.org

October 2016

SuperSmart is funded by the European Union, under the Horizon 2020
Innovation Framework Programme, project number 696076.
Page 3 of 53

                                                               Table of Contents
                                                                                                                                                                        Page

EXECUTIVE SUMMARY........................................................................................................................................ 5
1      INTRODUCTION.......................................................................................................................................... 6
       1.1        Introduction to “Eco-friendly supermarkets – an overview” ....................................................... 6
                  1.1.1  Objectives ............................................................................................................................... 7
                  1.1.2  Scope ....................................................................................................................................... 7
2      SUPERMARKET SECTOR: AN OVERVIEW............................................................................................... 8
3      ENVIRONMENTAL IMPACTS AND F-GAS REGULATION ....................................................................... 11
       3.1        F-gas Regulation ................................................................................................................................ 14
4      SUPERMARKETS ENERGY SYSTEMS ...................................................................................................... 16
       4.1        Refrigeration ....................................................................................................................................... 16
                  4.1.1   Centralized refrigeration systems .................................................................................... 17
       4.2        Heating ................................................................................................................................................23
                  4.2.1   Heating demand in supermarkets ....................................................................................23
                  4.2.2   Heating systems in supermarkets ....................................................................................23
                  4.2.3   Heat recovery .......................................................................................................................24
                  4.2.4   Heat recovery in CO2 transcritical booster system ........................................................25
       4.3        Ventilation .......................................................................................................................................... 26
       4.4        Air conditioning ..................................................................................................................................27
       4.5        Dehumidification ...............................................................................................................................27
       4.6        Lighting ............................................................................................................................................... 29
5      STATE-OF-THE-ART SUPERMARKET REFRIGERATION SYSTEMS ..................................................... 30
       5.1        Other trends in using solutions based on natural refrigerants ..................................................33
6      BEST PRACTICES AND CASE EXAMPLES............................................................................................... 34
       6.1        Sweden ................................................................................................................................................34
       6.2        Germany ............................................................................................................................................. 36
       6.3        Norway ............................................................................................................................................... 38
       6.4        UK ........................................................................................................................................................ 40
       6.5        Switzerland ......................................................................................................................................... 41
       6.6        Spain ....................................................................................................................................................42
       6.7        Italy .......................................................................................................................................................43
       6.8        Romania ..............................................................................................................................................44
       6.9        USA .......................................................................................................................................................45
       6.10       Japan ....................................................................................................................................................47
       6.11       Other countries ..................................................................................................................................47
7      CONCLUSION ........................................................................................................................................... 49
8      REFERENCES ........................................................................................................................................... 50

                                     The research leading to these results has received funding from the
                               European Union/EASME H2020 Programme under Grant Agreement No 696076.
Page 4 of 53

                                                                   Table of Figures
                                                                                                                                                                      Page

Figure 1: Increase in number of retail outlets (left) and
           total surface of retail [thousands m2] in Europe, comparing 2000 and 2011 (EY et al., 2014) ...... 8
Figure 2: Supermarkets share of retail food market in European countries, 2000 and 2011 (EY et al.,
           2014)............................................................................................................................................................. 8
Figure 3: Number of supermarkets per million habitants of European and non-EU countries for
           small supermarkets [SSM], large supermarkets [LSM] and hypermarkets [>2500 m2]
           (Nielsen, 2014) .......................................................................................................................................... 10
Figure 4: Energy use breakdown in supermarkets in (a) Sweden, (b) Germany and (c) the USA ...............12
Figure 5: (a) GHG refrigerant consumption in EU countries (SKM Enviros, 2012) and
           (b) drivers of HFC demand: the 8 main market sectors (EPEE, 2015) .............................................13
Figure 6: Distribution of carbon emissions of the two largest Swedish supermarket chains,
           (a) ICA (ICA, 2015) and (b) COOP (COOP, 2015) ...................................................................................13
Figure 7: An overview of THE EU F-gas Regulation (Emerson, 2015) ............................................................... 14
Figure 8: HFC direct and indirect systems (Arias, 2005) ................................................................................... 18
Figure 9: R404A indirect system in MT level and DX in LT level sub-cooled by MT secondary fluid
           (Karampour et al., 2013) ......................................................................................................................... 19
Figure 10: Examples of CO2 indirect and cascade systems ............................................................................. 20
Figure 11: CO2 transcritical booster system schematic and CO2 transcritical booster P-h diagram ...........21
Figure 12: Worldwide map of the stores using CO2 transcritical booster (Shecco, 2016) ............................ 22
Figure 13: Configurations of heat rejection and heat recovery from a refrigeration system
           (Sawalha, 2013) ........................................................................................................................................ 24
Figure 14: Commercial dehumidification systems (shown for ice rink application) ..................................... 28
Figure 15: Schematic of an integrated CO2 refrigeration system with heat recovery, AC and parallel
           compression ............................................................................................................................................30
Figure 16: Schematic of a CO2 transcritical booster system with some state-of-the-art features ........... 32

                                                                    Table of Tables
                                                                                                                                                                      Page

Table 1: Different formats of food retail stores (EY et al., 2014) (Schöenberger et al., 2013)
         [Wikipedia: Retail] ........................................................................................................................................ 9
Table 2: Supermarket refrigeration systems (Kauffeld, 2007) (Kauffeld, 2012).............................................. 17
Table 3: Typical delivery temperatures for various heating distribution systems (BRESEC, 2007) ........... 23

                                        The research leading to these results has received funding from the
                                  European Union/EASME H2020 Programme under Grant Agreement No 696076.
Page 5 of 53

EXECUTIVE SUMMARY
This report reviews the technical characteristics of eco-friendly supermarkets. This has been fulfilled by
presenting the conventional and eco-friendly cooling and heating systems available in the European
supermarket sector.

The report is a deliverable for the H2020 project SuperSmart, which deals with the removal of non-
technical barriers in commissioning of energy-efficient heating and cooling solutions in supermarkets.
An introduction to the SuperSmart project and this set of training material is given in Chapter 1. The
objectives and scope of this report are described in the same chapter.

Chapter 2 gives an overview over the supermarket sector in Europe. It is shown that the number of
supermarkets and their total surface area has increased in the past decade. The increase includes all
formats of the supermarkets, i.e., convenience stores, discounters, supermarkets and hypermarkets.
The rate of increase is higher in Eastern-Southern Europe than in Northern and Western Europe grocery
markets. It is also shown that the average share of “modern food retail markets” in the total food market
of European countries has increased from 44 % in 2000 to 62 % in 2011.

Chapter 3 reviews the environmental impacts, which are associated with supermarket sector services.
The focus is on the impact of cooling and heating systems. The two major factors, high energy use and
significant consumption of refrigerants with high global warming potential (GWP) are elaborated in this
chapter. It is shown that supermarkets have one of the highest annual specific energy consumptions
among commercial buildings in Europe, typically in the range of 400-600 kWh/m2.a. The largest energy
consumer is the refrigeration system with a share of 35-50 % of the total energy use. Furthermore, it is
indicated that supermarkets are the largest consumers and emitters of high-GWP HFC gases in Europe.
The conventional refrigerant in European supermarkets is R404A with a GWP value of 3922. About one
third of the total EU HFC consumption is used in supermarkets.

Chapter 4 reviews the technical aspects of energy systems in supermarkets. Cooling and heating
systems are in the focus of this chapter. Both conventional and eco-friendly systems for refrigeration,
heating, ventilation, air conditioning, dehumidification and lighting are introduced. As the refrigeration
system has the largest carbon footprint, this system is discussed in more detail, both in chapters 4 and
5.

State-of-the-art supermarket refrigeration systems are discussed in chapter 5. The emphasis is on CO2
transcritical booster refrigeration as the latest eco-friendly technology in the supermarket sector. It is
shown that the CO2 refrigeration system has been changed in the past few years from a single-
functioning system to a multi-function integrated system providing refrigeration, heating and air
conditioning in several European supermarkets. Furthermore, CO2 transcritical booster systems with
state-of-the-art features including usage of parallel compression, ejectors, thermal storage, mechanical
sub-cooling and others are discussed in this chapter.

Best practices and case examples of eco-friendly systems installed in Europe and worldwide are
introduced in chapter 6. The goal is to spread the knowledge and raise the awareness for faster uptake
of these systems into the European market.

                          The research leading to these results has received funding from the
                    European Union/EASME H2020 Programme under Grant Agreement No 696076.
Page 6 of 53

1          INTRODUCTION
Efficient solutions for supermarket heating, cooling and refrigeration - such as integrated systems or
the use of natural refrigerant-based equipment - are already available in the European market.
However, their use is not yet widespread due to remaining non-technological barriers, including lack of
knowledge and awareness, social, organizational and political barriers.

The European project SuperSmart aims at removing these barriers and additionally supports the
introduction of the EU Ecolabel for food retail stores. The EU Ecolabel can encourage supermarket
stakeholders to implement environmentally friendly and energy-efficient technologies and thus reduce
the environmental impact of food retail stores.

Within the project several activities are carried out to remove the barriers: campaigns to raise the
general awareness and spread the information about energy-efficient and eco-friendly supermarkets,
as well as training activities within the following specific topics:

      •   Eco-friendly supermarkets – an overview
      •   How to build a new eco-friendly supermarket
      •   How to refurbish a supermarket
      •   Computational tools for supermarket planning
      •   Eco-friendly operation and maintenance of supermarkets
      •   EU Ecolabel for food retail stores

For each of the topics a set of training material is developed, which will be used in the training activities.
The different kinds of training activities are:

      •   Conference related activities
      •   Dedicated training sessions
      •   Self-learning online activities

Dedicated training sessions are free-of-charge for the different stakeholders in the supermarket sector.
This means that highly-qualified experts from the project consortium will carry out a training session on
a specific topic at the premises of the stakeholder. If you are interested in receiving such a training
regarding any of the above-mentioned topics, please contact the project partner via the project
website: www.supersmart-supermarket.info.

The present report forms a part of the training material for the topic “Eco-friendly Supermarkets - an
Overview”. It can be used for self-studying and is freely available. There will be conferences, where this
topic is included as a training activity. Information on conferences where members of the SuperSmart
team will be present as well as the planned training activities can be found on the project website.

1.1        Introduction to “Eco-friendly supermarkets – an overview”
This report is the first of a series of training material aimed at raising awareness and transferring
knowledge about eco-friendly solutions in supermarkets among different stakeholders of the
supermarket sector. The report reviews both the conventional and eco-friendly supermarket energy
systems, with emphasis on cooling and heating systems.

The content is balanced between general aspects of the supermarket sector and comprehensive
technological information on the energy systems in supermarkets, making it instructive for many
different stakeholders of supermarkets. These include:
             o Supermarket chain managers
             o Single supermarket /Shop owners or runners
             o HVAC&R system contractors
             o HVAC&R component providers
             o HVAC&R service providers
             o Engineering societies/studios
             o Consultants/Energy consultants

                             The research leading to these results has received funding from the
                       European Union/EASME H2020 Programme under Grant Agreement No 696076.
Page 7 of 53

               o    Research Institutes/Universities
               o    Public bodies (legislative, e.g. the organization responsible for the EU-Ecolabel) and
                    NGOs (e.g. associations of supermarket installers/maintenance companies)

The report explains the status of the European supermarket sector, its energy systems, state-of-the-art
supermarket refrigeration systems and its best practices, including case studies of prominent
supermarkets.

1.1.1       Objectives

The main objectives of this report are:
    • Review the development of the supermarket sector in Europe.
    • Review the major supermarket energy systems and their environmental impacts in Europe,
       including the conventional ones and the state-of-the-art eco-friendly ones. The major focus will
       be on refrigeration systems, which are the ones with the highest carbon footprint in
       supermarkets.
    • Present the best eco-friendly practices of supermarkets installed and running across Europe
       and the world.
    • Provide the baseline technological information for pre-preparation of a new European Ecolabel
       for food retail stores.
    • Provide the basis for other reports in the series of training material.

1.1.2       Scope

The definition of supermarket 1 in the project is adapted from two existing European ecolabels for
grocery stores. The term “supermarket” used in this report is corresponding to the term “grocery store”
used in the following two national ecolabels:
    •   Nordic Ecolabel: Grocery stores in which groceries account for more than 50 % of turnover on
        an annual basis. The grocery store may be a single store, part of a larger chain or an internet
        store. Wholesalers are also in the scope. In this context, groceries are defined as goods that are
        expected to be consumed or used within a limited period, e.g. foodstuffs, sanitary products,
        household articles and cleaning agents (Nordic Ecolabel, 2016).
    •   Blue Angel: Grocery stores in the food retail sector include all store formats in the retail trade
        (self-service food stores and markets, food discounters, supermarkets, convenience stores, self-
        service warehouses, hypermarkets) whose product range consists primarily of food. The grocery
        stores must generate at least 50 % of their turnover through the sale of food (Blue Angel, 2013).

The scope of this report is predominantly the cooling and heating systems in supermarkets. It studies
these energy systems in supermarkets/grocery stores where more than 50 % of the annual turnover is
generated by sale of groceries, mainly food.

The fields, which are not in the scope of this report, are:
   •    Building envelope characteristics: it is reviewed in two other reports, section 2.1 of “D2.3: How to
        build a new eco-friendly supermarket” (Kauko et al., 2016) and section 2.2 of “D2.4: How to
        refurbish a supermarket” (CIRCE, 2016).
   •    Other eco-friendly aspects of the supermarkets including sales of eco-labelled food/non-food
        products, transportation & distribution carbon footprint, water and waste management, etc.
   •    Other type of food retail stores including cash-and-carry beverage stores, service station shops,
        cafeterias, caterers, restaurants and hotels, butcher shops and franchise outlets for meat
        products, bakeries and franchise bakery outlets, specialty food retailers and kiosks.

1
    “Supermarket” in this report is an umbrella term covering different formats of food retail stores.

                               The research leading to these results has received funding from the
                         European Union/EASME H2020 Programme under Grant Agreement No 696076.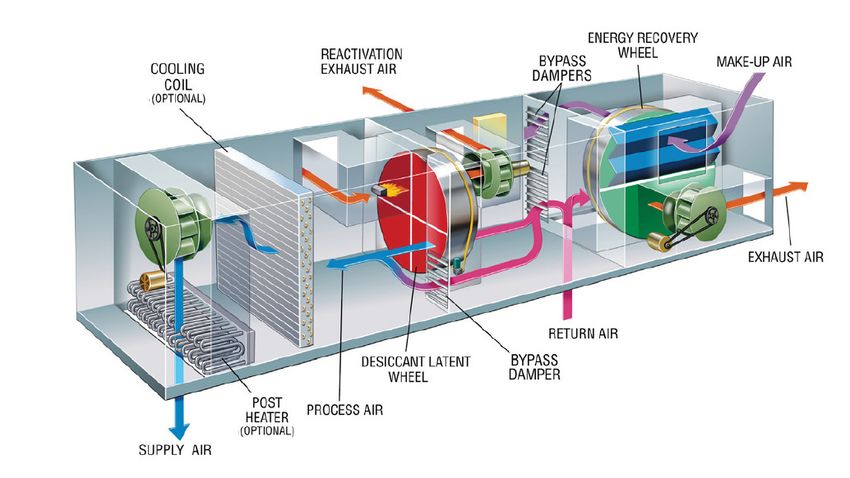
Page 8 of 53

2         SUPERMARKET 2 SECTOR: AN OVERVIEW
Supermarkets have become a fundamental service facility of the modern European society and they
have a vital role in the food cold chain. Supermarkets have shown a strong development in the recent
decades and they are spreading across Europe. This can be verified in the following two figures. Figure 1
shows the evolution of the European food retail by number of outlets (left) and total surface area (right),
comparing 2000 and 2011 (EY et al., 2014). The outlets are categorized as the three large sizes of grocery
stores; “hypermarkets”, “discount stores” and “supermarkets”. A smaller format known as “convenience
store” is not included in the figure but the growth rate for this format is even higher than the shown
three formats. These different formats are defined later in this chapter. As shown in the figure, the
numbers and total surface area of all formats have been increased over the past decade, despite the
occurrence of 2007-2008 financial crisis.

                          Figure 1: Increase in number of retail outlets (left) and
               total surface of retail [thousands m2] in Europe, comparing 2000 and 2011 (EY et al., 2014)
Figure 2 shows the share of modern food retail markets in the total food market of European countries,
in 2000 and 2011. Modern food retail markets in the reference study are defined as hypermarkets,
supermarkets and discounters 3. What can be seen in the figure is that nearly all the European countries
witness the increasing share of supermarkets and decreasing share of traditional local food markets in
the food supply chain. As shown in the last column, while the EU average share was 44 % in 2000, it is
increased to 62 % in 2011.

    Figure 2: Supermarkets share of retail food market in European countries, 2000 and 2011 (EY et al.,
                                                          2014)

2
  Unless mentioned as a specific format, “supermarket” is an umbrella term in this report covering
different formats of food retail stores.
3
  Please refer to section 3.1.1 of EY et al. (2014) for the detailed discussion on this definition.

                          The research leading to these results has received funding from the
                     European Union/EASME H2020 Programme under Grant Agreement No 696076.
Page 9 of 53

The main reasons for growth in the number of supermarkets in the EU and around the world are (Traill,
2006):
   •   Urbanization: population shift from small cities and rural areas to big cities, spread and growth
       of cities.
   •   Emerging middle class: rising incomes, higher welfare levels, higher purchasing power.
   •   Globalization and taste convergence: globalization of media and advertising, well-developed
       international/intercontinental network of cold chain transportation, multi-national supermarket
       chains.
   •   More female labour in the market: less time spent on cooking at home, more purchase of
       prepared fresh and frozen food products.
   •   Openness to inward foreign investment (East Europe): liberalisation of trade and investment.
   •   Desire to emulate the western life style in Eastern Europe.

As shown in Figure 1, food retail stores are usually segmented into different format groups based on the
size and the marketing strategy. The differences between these different formats have been
highlighted in Table 1. It is worth mentioning that sometimes there is not a very clear distinction
between some definitions. For example, a large supermarket in one European country can be
accounted as a hypermarket in another country.

 Table 1: Different formats of food retail stores (EY et al., 2014) (Schöenberger et al., 2013) [Wikipedia:
                                                          Retail]
                    Type of                                Products
     Format                         Products type                                 size              Notes
                    building                                 price
                                 - Food products                                                Low
                  stand-         - Non-food                                                     refrigeration
                  alone          products                 Low-            - larger than         load share in
  Hypermarket     buildings,     - Large variety and      medium          4500 m2               total energy
                  usually        huge volumes of          price           (EY et al., 2014)     use,
                  owned          products at low                                                compared to
                                 margins                                                        supermarkets
                  stand-
                  alone                                                   - 400-2500 m2
                  buildings                               Medium          but can be as         High
                                 - Mainly food
                  (usually                                price,          large as 4500 m2      refrigeration
                                 products
  Supermarket     owned) or                               comparing       (EY et al., 2014)     load share in
                                 - limited non-food
                  building                                to other        - 1000-3000 m2        total energy
                                 products
                  units                                   formats         (Schöenberger et      use
                  (usually                                                al., 2013)
                  rented)
                  stand-
                  alone                                                   - similar to a
                  buildings                                               small-medium
                  (usually       - Food products                          size supermarket
   Discounter     owned) or      - less-fashionable       Low price
                  building       non-food products                        - less than 1000
                  units                                                   m2 (Schöenberger
                  (usually                                                et al., 2013)
                  rented)
                  building       Limited number of                                              It can be a
                                                          More than
  Convenience     units          products,                                - less than 400 m2    part of
                                                          other
     store        (usually       predominantly                            (EY et al., 2014)     gas/petrol
                                                          formats
                  rented)        food                                                           stations.

                          The research leading to these results has received funding from the
                    European Union/EASME H2020 Programme under Grant Agreement No 696076.
Page 10 of 53

The number of stores per million habitants for different European countries is shown in Figure 3. The
breakdown of the total number indicates the numbers of small supermarkets (SSM) with sale surface
400-1000 m2, large supermarkets (LSM) of 1000-2500 m2 and hypermarkets over 2500 m2. The
difference between these numbers and the numbers in the previous paragraph originates from the fact
that there is not a clear consensus about the differences between “large supermarkets” and
“hypermarkets”.

 Figure 3: Number of supermarkets per million habitants of European and non-EU countries for small
              supermarkets [SSM], large supermarkets [LSM] and hypermarkets [>2500 m2] (Nielsen,
                                                      2014)

                        The research leading to these results has received funding from the
                   European Union/EASME H2020 Programme under Grant Agreement No 696076.
Page 11 of 53
3 ENVIRONMENTAL IMPACTS AND F-GAS REGULATION
The service which supermarkets provide is typically associated with significant environmental impacts.
Focusing on the impacts of its energy systems, this chapter provides some facts highlighting the
importance of implementing eco-friendly and energy-efficient solutions.
Firstly, supermarkets consume 3-4 % of the annual electricity production in industrialized countries.
These have been reported in different countries including 3 % in Sweden (Sjöberg, 1997), 4 % in USA
(Orphelin and Marchio, 1997), 3 % in UK (Tassou et al., 2011), 4 % in France (Orphelin and Marchio, 1997),
and 4 % in Denmark (Reinholdt and Madsen, 2010).
Secondly, supermarkets are energy intensive buildings; they typically have one of the highest specific
energy consumptions (energy consumption per sales or total area) among commercial buildings in
European and developed countries around the world, where the majority of the food retail market is
governed by supermarkets.
• Sweden: A survey carried out in 2010 compared the specific energy consumption of 130
buildings in Sweden with “retail” function. This includes 50 supermarkets, 30 shopping centres
and 50 other types of shops. It has been found that the supermarkets’ average annual specific
energy consumption is about 400 kWh/m2·a while for other retail buildings, including shopping
centres, the average is less than 265 kWh/ m2·a (Energimydegheten, 2010).
• Norway: A report on energy use in Norwegian buildings shows that supermarkets’ average
energy consumption is more than 500 kWh/ m2·a, while it is about 280 kWh/m2 for other type
of commercial buildings (Enova, 2007). In a recent research work, the average specific energy
consumption is reported to be 300 kWh/m2 for shopping centres, 200-220 kWh/m2 for other
shop categories while it is 460 kWh/m2 for Norwegian supermarkets (NVE, 2014).
• USA: The U.S. Environmental Protection Agency’s (EPA) ENERGY STAR Portfolio Manager is a
tool to track and manage energy use in 260.000 commercial buildings across all the 50 states.
The indicator used in the portfolio manager is called Energy Use Intensity (EUI). It has been
shown that supermarkets have the highest EUI among all types of commercial buildings in the
USA with about 600 kWh/m2 annual specific energy consumption (Energy Star, 2014).
• UK: Tassou et al., (2011) studied the energy performance of several hundreds of stores in the UK
(big hypermarkets, superstores, supermarkets and convenience stores) and found that the
average total energy consumption of a store is about 1000 kWh/m2·a. “This is significantly
higher than the final energy demand of other commercial buildings, such as offices (100–
200kWh/m2.a) or hotels (100–300kWh/m2.a), and much higher than that of residential buildings
(50–150kWh/m2.a)” (Galvez-Martos et al., 2013).
• Spain: The average specific energy consumption for large supermarkets and hypermarkets is
reported to be 327 kWh/m2·a while it is in the range of 118-333 kWh/m2·a for shopping malls
(CIRCE, 2015).
It should be noted that the values for supermarkets’ specific energy consumption in UK and Spain
seems overestimated and slightly underestimated, respectively. The reasons for this are not clear to the
authors.
Thirdly, refrigeration systems take a 35-50 % share of total energy use in supermarkets and they are
typically the largest electricity consuming system in the supermarkets (Lundqvist, 2000). Figure 4 shows
some examples of energy use breakdown in supermarkets in different countries. Some charts shown in
the figure represent the breakdown of total energy use and some others indicate the electricity
breakdown. In addition to refrigeration, lighting 4 and heating, ventilation and air conditioning (HVAC)
systems are the other major energy consuming systems in supermarkets. As can be seen in Sweden and
USA sample cases in Figure 4, supermarket’s largest share of primary energy use is in the form of
electricity. This is the case for many European countries including Norway (NVE, 2014), Spain (CIRCE,
2015) and UK (Spyrou et al., 2014). The share of electricity use in total energy consumption is mainly
dependent on the heating system in the supermarket.
4
The power consumption related to lighting is nowadays much lower, when ordinary lighting is
replaced by modern LED lights.
The research leading to these results has received funding from the
European Union/EASME H2020 Programme under Grant Agreement No 696076.Page 12 of 53
(a) Sweden (Lundqvist, 2000) (b) Germany (Kauffeld, 2007)
Total energy Electricity
(c) USA (NationalGrid, 2009)
Total energy
Figure 4: Energy use breakdown in supermarkets in (a) Sweden, (b) Germany and (c) the USA
To sum up, it has been shown that (I) supermarkets have a significant energy consumption, mainly in
the form of electricity and (II) the refrigeration system is the largest consumer of this electricity. The
supply of the needed electricity and heat is usually associated with CO2 emissions to the atmosphere.
This effect is typically known as “indirect” emission.
The supermarkets high energy use and high electricity consumption of their refrigeration systems is not
the only environmental impact In addition, supermarkets use typically high GWP refrigerants. The
conventional refrigeration system in European supermarkets consists of separate direct expansion HFC-
based systems for medium and low temperature levels. The dominant refrigerant in European
supermarkets is R404A with a GWP value of about 3922 (SKM Enviros, 2012). The amount of refrigerant
charge in medium- and large-size supermarkets is in the range of hundreds to few thousands of
kilograms. Due to the long pipe runs and numerous piping connections, the leakage rate is reported to
be 3-22 % by different researchers (IPCC, 2005). The emission of high GWP refrigerants to the
atmosphere is known as direct emission. In some countries, including Sweden and Switzerland, indirect
systems have been installed to confine the HFC use in the machinery room and reduce the amount of
refrigerant and thereby the total leakage.
One of the objectives of this report is to indicate how it is possible to reduce the direct and indirect
emissions of supermarket refrigeration systems.
Figure 5 shows two charts which highlight the high HFC demand and consumption in the commercial
refrigeration sector.
• Figure 5-a: “The commercial refrigeration sector represented 40 % of refrigerant [greenhouse
gas] GHG consumption in 2010. The largest part of this consumption (85 %) is due to large
refrigeration systems in supermarkets, most of which utilize the high GWP refrigerant R404A.
The remaining consumption is split between small hermetic systems and single condensing
unit systems (SKM Enviros, 2012). This implies that supermarkets are the largest consumers
of HFCs in Europe, with a share of about one third.
The research leading to these results has received funding from the
European Union/EASME H2020 Programme under Grant Agreement No 696076.Page 13 of 53
• Figure 5-b: The commercial refrigeration sector has the largest share of the market for HFC
refrigerants among 8 different refrigeration, heat pump and air conditioning market sectors
(EPEE, 2015). As mentioned before, supermarkets are the largest player in the commercial
refrigeration sector.
(a) (b)
Figure 5: (a) GHG refrigerant consumption in EU countries (SKM Enviros, 2012) and
(b) drivers of HFC demand: the 8 main market sectors (EPEE, 2015)
This high amount of HFC refrigerants consumption and emission in refrigeration systems reflects in the
total carbon footprint of supermarkets. According to Carr-Shand et al. (2009), 18-30 % of annual
equivalent carbon emissions in European supermarkets is due to their choice of refrigerants. The
numbers can be slightly higher or lower than this range for different EU supermarkets depending on
various factors including energy use, as well as refrigerant/refrigeration and transportation choices.
As an example, the carbon emissions distribution of the two largest Swedish supermarket chains is
shown in Figure 6. As illustrated in the figure, the refrigerants are responsible for 31 % and 16,5 %
(köldmedia: refrigerant) of their annual carbon emissions (ICA, 2015) (COOP, 2015).
(a) (b)
Figure 6: Distribution of carbon emissions of the two largest Swedish supermarket chains,
(a) ICA (ICA, 2015) and (b) COOP (COOP, 2015)
According to a report from the European Environment Agency (European Environment Agency, 2012)
comparing the greenhouse gas emissions in European countries between 1990 and 2012 “HFCs used in
refrigeration and air conditioning were the only group of (greenhouse) gases for which emissions
increased since 1990 and accounted for 2.1 % of total EU GHG emissions in 2012. The banning of CFCs by
the Montreal-Protocol, both ozone-depleting substances and potent GHGs, led to new substitutes and
their replacement with HFCs that are included in the Kyoto-Protocol.” As mentioned earlier,
supermarkets are one of the major contributors to this GHG emission increase.
The research leading to these results has received funding from the
European Union/EASME H2020 Programme under Grant Agreement No 696076.Page 14 of 53
3.1 F-gas Regulation
The discussed significant environmental impacts of supermarkets resulted in some international and EU
legislation to limit the amount of fluorinated greenhouse gases emitted to the atmosphere. The latest
one is the EU F-gas Regulation on the use of F-gases (EU 517/2014, 2014). This regulation contains a ban
to use any refrigerant with GWP higher than 150 for supermarkets centralized refrigeration systems
larger than 40 kW from January 2022, with exception for primary cycle in cascade configurations, which
are allowed to use refrigerants with GWP up to 1500.
A step-wise reduction plan in the F-gas Regulation is to decrease the GWP related emission, caused by
the use of HFCs, by 79 % by 2030 with 2010 as the reference year. A summary of the F-gas Regulation
showing this reduction plan is shown in Figure 7. What can be interpreted from the figure is that the
present conventional supermarket refrigeration systems are not future long-term solutions.
Figure 7: An overview of THE EU F-gas Regulation (Emerson, 2015)
Supermarket stakeholders have three options to adapt their business to the recent F-gas Regulation:
• Business as usual, to continue using high GWP HFC refrigerants in their existing refrigeration
systems until 2020 and use the reclaimed or recycled gas, if available, until 2030. The
challenges/risks associated with this decision are:
• Stricter leak detection requirements
• Stricter, and in the near future banned service and maintenance of refrigeration units
using HFCs with a GWP above 2500
• Higher price and lower availability of HFC refrigerants with high GWP
• Higher price and lower availability of equipment and components working with these
fluids
• Stricter refrigerant recovery and reclamation process
• To convert/retrofit their systems to other new synthetic refrigerants with lower GWP. The
major serious risk accompanied by this decision is that these refrigerants can be subject to
future environmental regulation, exactly as happened earlier to CFCs, HCFCs and now to
HFCs. Examples for these R404A drop-in refrigerants are blends with non-saturated HFCs
(also known as HFOs) R448A and R449A with GWP values 1387 and 1397, respectively, which
have been introduced to the market in the past few years.
The research leading to these results has received funding from the
European Union/EASME H2020 Programme under Grant Agreement No 696076.Page 15 of 53
• To replace their systems or orientation of their business to natural-refrigerant based (CO2,
HCs, NH3 -cascade unit) refrigeration systems. The investment costs for using these systems
are no longer higher than for conventional HFC systems in many Northern-Central European
countries and the previously higher operational costs of CO2 systems used in warm climates
decreased or turned into energy savings thanks to the state-of-the-art innovations
introduced in chapters 5 and 6. Considering the total cost of ownership and the challenges
the other choices face, this option is considered as the only viable long-term solution.
The research leading to these results has received funding from the
European Union/EASME H2020 Programme under Grant Agreement No 696076.Page 16 of 53
4 SUPERMARKETS ENERGY SYSTEMS
This chapter introduces the major energy systems in supermarkets. The focus is on cooling and heating
systems; the other energy systems, including HVAC and lighting, have been discussed in brief.
4.1 Refrigeration
The purpose of refrigeration systems in supermarkets is to provide storage of and display of perishable
food prior to sale. Food is stored in walk-in storages/cold rooms before the transfer to display cases in
the sales area. There are two principal temperature levels in supermarkets: medium temperature (MT)
for preservation of chilled food and low temperature (LT) for frozen products. Chilled food is maintained
between 1°C and 14°C, while frozen food is kept at -12°C to -18°C, depending on the national and
international food safety regulations. To provide the desired food temperatures, the refrigerant
evaporation temperature range is typically between –15°C and 5°C for the MT level and between -30°C
to -40°C for the LT level. Variations in temperature are dependent upon products, display cases and the
chosen refrigeration system (IPCC, 2005). The modern refrigeration solutions are designed to keep the
refrigeration temperatures as close as possible to the desired food temperatures.
There are typically three types of refrigeration systems in supermarkets, depending on the size of the
supermarket and the quantity and type of fresh and/or frozen food products:
• Stand-alone: The other names for this unit are “self-contained” or “plug-in” system. Stand-
alone equipment is often a display case where the refrigeration system is integrated into the
cabinet and the condenser heat is rejected to the sales area of the supermarket. The
function of plug-in equipment is usually to display products like ice cream or cold beverages
such as beer or soft drinks. However, in some European discounter stores, all low
temperature products are offered in these stand-alone units.
• Condensing units: These systems are small-size refrigeration equipment with one or two
compressors and a condenser installed on the roof or in a small machine room. Condensing
units provide refrigeration to a small group of cabinets installed in convenience stores and
small supermarkets.
• Centralized: the other name for centralized systems is “multiplex”. Centralized systems
consist of a central refrigeration unit located in a machine room. There are two types of
centralized systems: direct and indirect systems. In a direct system (DX), racks of
compressors in the machine room are connected to the evaporators in the display cases and
to the condensers on the roof by long pipes containing the refrigerant. In an indirect system,
the central refrigeration unit cools a fluid that circulates between the evaporator in the
machine room and the display cases in the sales area. This fluid is known by different names,
such as secondary refrigerant, secondary fluid, secondary coolant, heat transfer fluid, or
brine. Secondary fluid is typically a solution of water with salts or alcohols, which decreases
the freezing point of water well below zero.
As mentioned in chapter 3, centralized systems are the largest consumers/emitters of HFC
refrigerants in the EU. This is the reason why different configurations of centralized systems
including the conventional and eco-friendly solutions are discussed in detail in section 4.1.1
and chapter 5.
The three types of supermarket refrigeration systems can be categorized as shown in Table 2. Needless
to say, the numbers in the table are not exact and are dependent on many factors including country,
system design evolution, regulations, etc.
The research leading to these results has received funding from the
European Union/EASME H2020 Programme under Grant Agreement No 696076.Page 17 of 53
Table 2: Supermarket refrigeration systems (Kauffeld, 2007) (Kauffeld, 2012)
Global
Capacity Refrigerant
Type Application Refrigerants Emission numbers
(kW) charge (kg)
(millions)
Shops, stores,
R22-R134a-
petrol
R404A-
Stand-alone stations, 0,1-2 0,05-1 Low ~ 50
R507A- R290-
offices,
R600A-R744
hotels, …
Shops, stores,
petrol R22-R134a-
Condensing
stations, 5- >25 R404A- 1->5 Medium ~ 30
unit
offices, R507A-R744
hotels, …
Grocery
retailers R22-R134a-
(discounters, R404A-
Centralized 20- >1000 10->3000 High-medium ~ 0,5
supermarkets, R507A- R744 –
hypermarkets R290-(R717)
, …)
4.1.1 Centralized refrigeration systems
The centralized supermarket refrigeration systems can be categorized into two groups based on the
dominant refrigerants used in European system solutions. HFC systems can be considered as
conventional solutions and CO2 systems as the more eco-friendly and state-of-the-art ones.
4.1.1.1 HFC systems (Arias, 2005)
• Direct systems: The most traditional refrigeration system design in EU supermarkets is the
direct system (Figure 8-a). This system comprises two completely separate MT and LT loops.
In direct systems of medium-large size supermarkets, the refrigerant circulates in long pipe
runs between the compressors in the machinery room, the display cases in the sales area
and the condensers on the roof top. This implies very large refrigerant charges. The most
common direct system in supermarkets is a centralized system and consists of two racks of
compressors, each operating at the same saturated MT and LT suction temperatures. In each
rack of compressors, the suction and discharge lines are common. The amount of refrigerant
in a centralized direct system is typically 4-5 kg/kW of refrigeration capacity (Baxter, 2003).
Distributed system is another variation of the direct system (Figure 8-b). It is called
distributed since there is no centralized compressor rack in the supermarket but several
small compressor racks are distributed and located in boxes near the display cases. In such
systems, the suction lines of the compressors are much shorter than in the conventional
direct system. The discharge line of the compressors is typically connected to a separate
rooftop air-cooled condenser. The refrigerant circuits in a distributed system are shorter and
the total refrigerant charge will be about 75 % of multiplex systems (Bivens and Cage, 2004).
• Indirect systems: Indirect systems were the next generation of supermarket refrigeration
systems aiming at decreasing the refrigerant charge and minimizing potential refrigerant
leakage. One indirect solution with completely separate MT and LT loops is a “completely
indirect system”, as presented in Figure 8-c. In this system design, there are two primary and
secondary refrigeration cycles with different temperature levels. The supply and return
temperature in MT secondary loop is about -8 °C and -4 °C, respectively. Typical values of
secondary refrigerant temperature supply and return in the freezers are about -32°C and
-29°C. Secondary refrigerants based on potassium formate, potassium acetate, glycols,
alcohols and chlorides are commonly used. CO2 two-phase flow might be used as a
secondary refrigerant in the low temperature system, as explained in section 4.1.1.2.
The research leading to these results has received funding from the
European Union/EASME H2020 Programme under Grant Agreement No 696076.Page 18 of 53
To decrease the usage and leakage of high GWP primary refrigerants, the condensers can be connected
to rooftop dry coolers by secondary fluids as well. One or two other secondary loops (coolant fluids or
dry cooler fluids) are used in the system to transport the heat rejected from the condensers, located in
the machine room, to dry coolers.
Another configuration of indirect systems is the partially indirect system. The schematic of the system
is shown in Figure 8-d. The heat from the condensers is rejected by a dry cooler on the roof of the
supermarket to the ambient. The low temperature system has a direct system between the
compressors and the freezers, and the medium temperature system has an indirect system between
the cabinets and the chiller.
(a) Direct system (b) Distributed system
(c) Completely indirect system (d) Partially indirect system
Figure 8: HFC direct and indirect systems (Arias, 2005)
A variation to the partially indirect system is shown in Figure 9. In this system, the MT secondary fluid
sub-cools the low temperature loop to improve its poor efficiency. The poor efficiency is due to the
high pressure lift of low temperature compressors.
The research leading to these results has received funding from the
European Union/EASME H2020 Programme under Grant Agreement No 696076.Page 19 of 53
Figure 9: R404A indirect system in MT level and DX in LT level sub-cooled by MT secondary fluid
(Karampour et al., 2013)
4.1.1.2 CO2 systems
• CO2 Indirect systems: as explained in the previous section, the first usage of CO2 in
supermarkets was as a secondary fluid. CO2 has good heat transfer properties and lower
viscosity than conventional secondary fluids. This makes the required pumping power
considerably lower than in the conventional indirect systems. Corrosion has been another
problem with some of the secondary fluids, which is not a problem in CO2 indirect systems. CO2
has been used mainly in LT circuits where pressure is low and suitable components were rather
available in early 1990s, after the revival of CO2 as refrigerant (Lorentzen, 1994). An example of a
CO2 indirect system is shown in Figure 10-a.
There are several research works investigating the CO2 indirect system performance and
comparing it with traditional HFC solutions. Such studies include (Hinde et al., 2009), (Mikhailov
and Matthiesen, 2010) and (Poland et al., 2010).
• CO2 Cascade systems: the second generation of CO2 systems were cascade systems. In this
configuration CO2 can be used in both MT and/or LT levels but the absorbed heat is rejected
into an upper cycle. In the upper cycle, different types of refrigerants, which may have
safety/environmental problems when used in the sales area, can be used. These include HFCs
(leakage of high GWP refrigerant), ammonia (toxicity) and hydrocarbons (flammability). This
system solution was the first one which gave the opportunity to install system solutions
completely based on natural refrigerants. One drawback of cascade systems is the intermediate
cascade heat exchanger and the temperature difference created by this heat exchanger. This
“extra” heat exchange stage decreases the energy efficiency and the heat exchanger can be
expensive. However, CO2 cascade system can be a good solution for warm climates, if the
safety regulations permit the use of HCs or NH3 in the high-temperature stage. This way, CO2 in
the low stage for MT and LT refrigeration never operates in supercritical pressures.
System description and performance analysis of various supermarket cascade configurations
have been elaborated more by (da Silva et al., 2012) and (Sawalha, 2008).
An example of a CO2 cascade system is shown in Figure 10-b.
The research leading to these results has received funding from the
European Union/EASME H2020 Programme under Grant Agreement No 696076.Page 20 of 53
(a) CO2 indirect (b) NH3-CO2 cascade
Figure 10: Examples of CO2 indirect and cascade systems
• CO2 transcritical booster system
The latest refrigeration system using CO2 as the refrigerant is the CO2 transcritical booster system. A
simple schematic of a CO2 transcritical booster system and its pressure-enthalpy diagram is shown
in Figure 11. This system is an only-CO2 solution which provides cooling in the MT cabinets and LT
freezers. The system is considered as one of latest developments towards using climate friendly
refrigerants in European supermarkets. System’s independency of using other refrigerants such as
HFCs, ammonia or hydrocarbons in indirect or cascade configurations results in reduced negative
environmental impact (compared to HFC-based solutions) and increased safety (compared to NH3-
HCs). The system which is described in this section is considered as the “standard” CO2 transcritical
booster system, however, there are several newer modifications and improvements on this system
which are discussed in chapter 5 of this report. Newer generations of CO2 system are presented in
chapter 3 of the SuperSmart report D2.3 (Kauko et al., 2016).
There are numerous research works based on computer modelling or real-world field measurement
analysis which have shown that CO2 transcritical booster systems have either higher or comparable
COPs to conventional HFC systems in mild-cold climates:
• Studies with computer modelling: the following research works show the privilege of using CO2
systems over HFC ones in mild-cold ambient temperatures, typically lower than about 25 °C
ambient temperature (Cecchinato et al., 2012) (Mikhailov and Matthiesen, 2013) (Sharma et al.,
2014a).
• Studies with analysis of field measurements:
• Sweden: Performance comparison of five CO2 and three advanced R404A systems
revealed that modern CO2 systems have higher or comparable total refrigeration COPs
compared to HFC systems in Swedish climate conditions (Karampour et al., 2013). The
details of CO2 system evolution from older less efficient ones to newer more efficient
ones have been discussed by Sawalha et al. (2015).
• USA: the performance of the first CO2 transcritical booster system in the USA was
compared with a standard DX R407A solution. The two systems had identical boundary
conditions including refrigeration loads and northeastern US climate conditions. The
authors concluded that the two systems have nearly equal electricity use for
refrigeration; the CO2 system consumes up to 14 % more electricity in summer months,
however, up to 18 % less in winter months (Weber and Horning, 2015).
• Europe: Some researchers have compared the CO2 and HFC system solutions based on
specific (linear) energy use of the refrigeration system per meter of display case and
year. In one of these studies, it was found that the average specific energy use value is
The research leading to these results has received funding from the
European Union/EASME H2020 Programme under Grant Agreement No 696076.Page 21 of 53
about 5000 kWh/m·a for 103 European stores using HFC refrigerants, while it was about
3500-4000 kWh/m·a for 11 stores which use CO2 as the refrigerant in the medium and
low temperature levels. According to the EU “best environmental management
practices in the retail sector”, a benchmark of excellence is achievable for specific linear
energy use of less than 3000 kWh/m·a (Galvez-Martos et al., 2013).
• Germany: a field measurement study showed that the CO2 system has higher energy
efficiency than standard and optimized R404A systems in ambient temperatures lower
than 25 °C and 21 °C, respectively (Finckh et al., 2011).
Figure 11: CO2 transcritical booster system schematic and CO2 transcritical booster P-h diagram
System refrigeration process
As shown in Figure 11, CO2 enters a receiver after the gas cooler/condenser. The liquid and vapour
streams are separated in the receiver. The liquid is fed to the MT and LT evaporators. CO2 evaporation
temperatures in medium temperature level and low temperature level are shown, as an example, to be
-10 °C and -35 °C, but the state-of-the-art CO2 booster systems have a few degrees higher evaporation
temperatures.
The vapour from the LT evaporators is compressed by the LT “booster” compressors and mixed with
vapour outlet from MT evaporators and vapour from the by-pass line of the receiver. The mixture of
these three streams is compressed in the high stage compressors to the high pressure level.
The high pressure level is controlled by the high pressure expansion valve “A”. The system can be run in
subcritical or transcritical zones depending on ambient temperature and whether floating condensing
pressure or heat recovery mode is used.
Heat can be recovered in the de-superheater which is a heat exchanger after the high stage
compressors and before the condenser/gas cooler. There is, in this case, a loop transferring the heat
from the de-superheater to the HVAC system. The return temperature of the heat transfer fluid, from
HVAC to the de-superheater, is recommended to be as low as possible. The return temperature from
The research leading to these results has received funding from the
European Union/EASME H2020 Programme under Grant Agreement No 696076.Page 22 of 53
the heating system is shown as 30 °C, a typical value for supermarkets working with low temperature
heating radiators, and with 5 K approach temperature, CO2 temperature after the de-superheater is
about 35 °C. The function of the gas cooler by-pass line and the three-way valve before it is explained in
section 4.2.4.
When the heating demand is low, for example in summer, the system runs in floating condensing mode.
This means, the gas cooler pressure follows the ambient temperature in subcritical region. In the
transcritical region, the system should be run based on an “optimum pressure algorithm” to maximize
the COP of the refrigeration system. Such optimum pressure algorithms have been studied for instance
by Liao et al. (2000), Sawalha (2008) and Chen and Gu (2005).
The CO2 transcritical booster system is considered as the standard system solution for new
supermarkets in some European countries, including Scandinavia. Figure 12 shows the status of the
number of supermarkets in Europe and in the world using CO2 transcritical booster systems. This is over
5500 stores in Europe and more than 7200 stores worldwide (Shecco, 2016). According to authors
communication with natural refrigerants market analysers at Shecco company the numbers of stores in
Europe is increased to 8700 stores, as of September 2016. The modifications and improvements in the
standard system design including CO2 integrated systems and warm climate solutions are discussed in
chapter 5.
Figure 12: Worldwide map of the stores using CO2 transcritical booster (Shecco, 2016)
The research leading to these results has received funding from the
European Union/EASME H2020 Programme under Grant Agreement No 696076.You can also read


