HONG KONG ENERGY POLICY SIMULATOR: METHODS, DATA, AND SCENARIO RESULTS FOR 2050
←
→
Page content transcription
If your browser does not render page correctly, please read the page content below
TECHNICAL NOTE

HONG KONG ENERGY POLICY SIMULATOR:
METHODS, DATA, AND SCENARIO RESULTS FOR 2050
XIAOQIAN JIANG, MENGPIN GE, ROBBIE ORVIS, JEFFREY RISSMAN, LAWRENCE IU, AND ROMAN HENNING

EXECUTIVE SUMMARY
The government of Hong Kong published the Hong                          CONTENTS
Kong’s Climate Action Plan 2030+ report in 2017 as
                                                                        Executive Summary ...........................................................1
a response to the Paris Agreement. The report states
                                                                        Introduction ......................................................................2
Hong Kong’s carbon emission reduction target for
2030 and outlines action plans to meet it. Hong Kong                    Background on the Energy Policy Simulator ........................3
has pledged to reduce 65 to 70 percent of its carbon                    Input Data Sources ............................................................7
intensity per gross domestic product (GDP) by 2030,                     Scenarios and Results .......................................................8
using 2005 as the base. This is equivalent to a 26 to 36                Online Hong Kong Energy Policy Simulator .........................16
percent reduction from 2005 emissions levels and an                     Limitations .......................................................................17
expected reduction to 3.3–3.8 tonnes on a per capita                    Future Development ..........................................................18
basis, compared with 6 tonnes per capita in 2005.                       Appendix. Data Sources for Variables in the Hong Kong EPS .....18
                                                                        Endnotes ......................................................................... 28
While not a party to the Paris Agreement itself, Hong                   References ...................................................................... 29
Kong as a Special Administrative Region of China
contributes to the fulfillment of China’s Nationally
Determined Contribution of the Paris Agreement. Hong                    Technical notes document the research or analytical
                                                                        methodology underpinning a publication, interactive
Kong similarly plays a part in contributing to meeting
                                                                        application, or tool.
the long-term target of the Paris Agreement to limit
global temperature increase to less than 1.5 to 2 degrees
Celsius. Hong Kong currently does not have a long-                      Suggested Citation: Xiaoqian Jiang, Mengpin Ge,
term decarbonization strategy or target beyond 2030 in                  Robbie Orvis, Jeffrey Rissman, Lawrence Iu, and Roman
place. Thus, it is critical for Hong Kong to formulate a                Henning. 2019. “Hong Kong Energy Policy Simulator:
long-term decarbonization plan to which the short- and                  Methods, Data, and Scenario Results for 2050.” Technical
medium-term actions could conform.                                      Note. World Resources Institute, Beijing. Available online
                                                                        at http://wri.org.cn/en/HONG_KONG_ENERGY_
                                                                        POLICY_SIMULATOR_METHODS_DATA_AND_
In order to inspire ambition and mobilize action to
                                                                        SCENARIO_RESULTS_FOR_2050
advance Hong Kong through a cross-sectoral transition

                                                                                                                             TECHNICAL NOTE | December 2019 | 1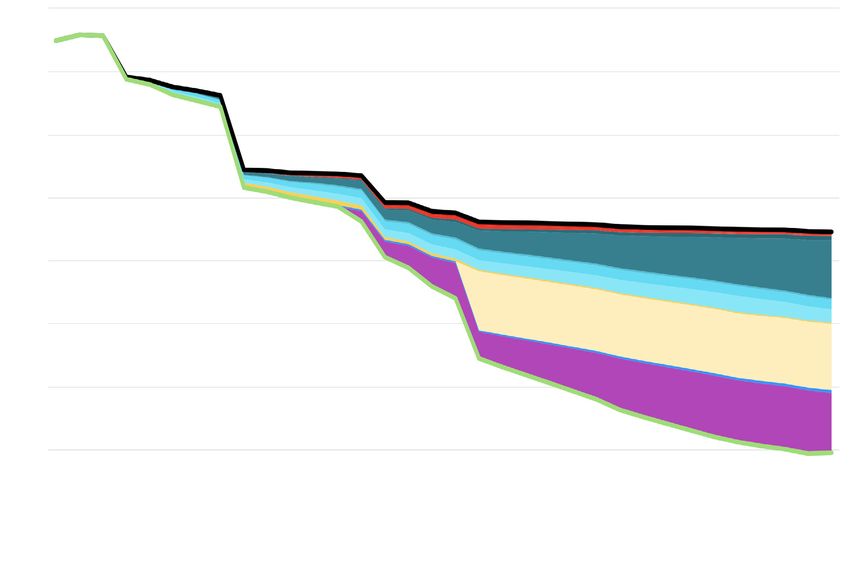
toward long-term deep decarbonization, World Resources      waste management. These targets contribute to the
Institute (WRI) and Civic Exchange (CE) jointly initiated   achievement of climate change objectives. For example,
the project “Hong Kong 2050 Is Now.” Under this project,    Hong Kong is attempting to reduce energy intensity by
WRI and CE collaborated with Energy Innovation LLC to       40 percent of its 2005 level before 2025 (Environment
develop the Hong Kong Energy Policy Simulator (EPS),        Bureau 2015a),3 reduce the share of coal in the power
which aims to provide technical support for developing      generation sector to 25 percent, and increase the share
Hong Kong’s 2050 deep decarbonization strategy. The         of natural gas to 50 percent by 2020. Through 2030,
“Hong Kong 2050 Is Now” project provides policy             coal will continue to be phased out while the use of
recommendations based on the results of the Hong Kong       natural gas and non-fossil fuels will be increasing
EPS. Meanwhile, the Hong Kong EPS also allows users         (Environment Bureau 2017).4 Government buildings are
to create their own scenarios to see impacts of different   targeted to decrease energy consumption by 5 percent
policy combinations.                                        between 2015 and 2020 (Government of Hong Kong
                                                            2015).5 There are also targets to cut down the amount of
This technical note describes the structure, input data     food waste that goes to landfills by at least 40 percent
sources, outputs, limitations, and future development,      before 2022 and to reduce the municipal solid waste
as well as the online interface, of the Hong Kong EPS.      disposal rate to landfills by 40 percent on a per capita
A subsequent policy report will present the model’s         basis by 2022, relative to 2011 numbers. (Environment
results and policy recommendations in more detail.          Bureau 2014; Environment Bureau 2013).6 While
                                                            plentiful, these policy initiatives are designed for the
                                                            short and midterm.
INTRODUCTION                                                A key aspect of the Paris Agreement is to strengthen
The Paris Agreement, entered into force in November         global efforts to meet the long-term target of limiting
2016 in advance of the 22nd Conference of the Parties       the global temperature increase to below 1.5 - 2 degrees
(COP 22), brings together nations of the world to put       Celsius. However, Hong Kong currently does not have
forward determined efforts to reduce greenhouse             a long-term decarbonization strategy or target beyond
gas (GHG) emissions, and to adapt to the effects of         2030. Formulation of long-term low GHG development
climate change. The Hong Kong Special Administrative        plan is crucial for Hong Kong in planning a path toward
Region (SAR) of China (hereinafter referred to as Hong      decarbonization, as well as to guide its short- and
Kong) is covered under China’s Nationally Determined        mid-term actions to be in line with the global deep
Contribution (NDC) of the Paris Agreement and               decarbonization target.
contributes to its fulfillment.
                                                            In order to inspire ambition and mobilize action to
In 2010, Hong Kong announced its initial target to          advance Hong Kong through a cross-sectoral transition
reduce its carbon intensity by 50 to 60 percent from        toward long-term deep decarbonization, World
2005 levels before 2020 (Environment Bureau 2015b).1        Resources Institute (WRI) and Civic Exchange (CE)
In 2017, the Hong Kong government published Hong            jointly initiated a project called “Hong Kong 2050 Is
Kong’s Climate Action Plan 2030+ report in response to      Now.” Under this project, WRI and CE collaborated
the Paris Agreement. The report states the government’s     with Energy Innovation LLC to develop the Hong Kong
carbon emissions reduction target for 2030 and outlines     Energy Policy Simulator (EPS), which aims to provide
action plans to meet it. Hong Kong has pledged to           technical support for developing Hong Kong’s 2050 deep
reduce 65 to 70 percent of its carbon intensity by 2030,    decarbonization strategy. The “Hong Kong 2050 Is Now”
using 2005 as the base. This is equivalent to a 26 to 36    project provides policy recommendations based on the
percent absolute reduction and a reduction to 3.3–3.8       results of the Hong Kong EPS. Meanwhile, the Hong
tonnes on a per capita basis, compared with 6 tonnes        Kong EPS also allows users to create their own scenarios
per capita in 2005 (Environment Bureau 2017).2              to see impacts of different policy combinations.

In addition to these climate targets, the Hong Kong         This technical note discusses the structure, function,
government made corresponding targets in the                input data, and output specific to the Hong Kong EPS.
areas of energy saving, energy efficiency, electricity      A complementing policy report will introduce more
generation fuel mix, buildings, transportation, and         detailed analysis and policy recommendations.

2|
Hong Kong Energy Policy Simulator: Methods, Data, and Scenario Results for 2050
BACKGROUND ON THE ENERGY POLICY by different types of power plants, market share of
different vehicle technologies, and premature deaths
SIMULATOR avoided by reductions in particulate emissions. These
About the Hong Kong Energy Policy Simulator output metrics can help policymakers anticipate long-
term economic impacts and costs of implementing new
The Hong Kong Energy EPS is a version of the Energy policies. Some of the policies included in the EPS have
Policy Simulator, https://www.energypolicy.solutions/, not yet been explored in Hong Kong, thus offering
an open source, system-dynamics computer model. novel options to policymakers.
The EPS is able to estimate the effects of various
policies on many indicators, such as emissions, More detail on the technical aspects of the Hong Kong EPS
financial metrics, electricity system structure, is available in the EPS online documentation at https://
deployment of different types of vehicles, as well as hongkong.energypolicy.solutions/docs/. The model is free
many other data. 7 The EPS simulates energy policies and open source. It can be used via an interactive web
as well as non-energy policies, such as those affecting interface at https://hongkong.energypolicy.solutions/
industrial processes. EPS policies are actions taken, or can be downloaded from the same site. Previous
not targets. The EPS is generally a forward-simulating, adaptation of EPS in other regions is introduced in Box 1.
not goal-seeking, model. Therefore, policies generally
constitute specific actions or measures that influence
actions, such as changing the price of something,
Why Use a Computer Model?
rather than specifying targets to be met via unknown Before considering the structure and uses of the Hong
actions. The tool allows users to explore various policy Kong EPS, it is worthwhile to ask, “Why should we
combinations to create policy scenarios, including use a computer model at all?” A policymaker seeking
custom policy implementation schedules. The EPS to reduce emissions faces a dizzying array of policy
simulates the years 2017 to 2050 by using annual time options that might advance policy goals. Policies may
steps and offers hundreds of environmental, economic, be specific to one sector or type of technology (for
and social outputs. Significant output indicators instance, light-duty vehicle fuel economy standards)
include emissions of 12 pollutants, 8 cash flows (first- or might be economy-wide (such as a carbon tax).
order costs and savings to government, consumer or Sometimes a market-driven approach or a direct
labor, non-energy industries, and each of the energy regulatory approach or a combination of the two can be
industries), 9 capacity and generation of electricity used to advance the same goal. For instance, to improve
Box 1 | Previous Adaptation of EPS in Other Regions
EPS has been successfully applied in many other regions, including Canada, the Alberta Province of Canada, China, India, Indonesia, Mexico, Poland, Saudi Arabia, and the
United States. All the models can be found at https://www.energypolicy.solutions/.
WRI contributed to the development of the India (Mangan et al. 2019), Indonesia (Rissman and Chrysolite 2017), and Mexico models (Altamirano et al. 2016). The relevant
technical note and working paper can be found on WRI’s website:
● A chieving Mexico’s Climate Goals: An Eight-Point Action Plan
https://www.wri.org/publication/achieving-mexicos-goals
● A Tool for Designing a Policy Package to Achieve Indonesia’s Climate Targets: Summary of Methods and Data Used in the Indonesia Energy Policy Simulator
https://www.wri.org/publication/indonesia-eps-tech-note
● A Tool for Designing Policies to Achieve India’s Climate Targets: Summary of Methods and Data Used in the India Energy Policy Simulator
https://www.wri.org/publication/achieve-india-climate-targets
TECHNICAL NOTE | December 2019 | 3the efficiency of home appliances, a government may About System Dynamics Modeling
offer rebates to buyers of efficient models or mandate
Many approaches exist for representing the economy and
that the appliance manufacturers meet specific energy-
the energy system in a computer simulation. The Energy
efficiency standards or both. To navigate this field of
Policy Simulator is based on a theoretical framework called
options, policymakers require an objective, quantitative
“system dynamics.” As the name suggests, this approach
mechanism to determine which policies will meet their
views the processes of energy use and the economy as an
goals and at what cost.
open and fluctuating non-equilibrium system.
Many studies have examined certain energy policies in
System dynamics models often include stocks or variables
isolation. However, it is of greater value to policymakers
the values of which are affected by flows in and out of these
to understand the effects of a package of different
variables. For example, a stock might be the total installed
policies because the policies may interact nonlinearly.
capacity of wind power plants, which can only grow or
This interaction among policies can produce results
shrink gradually from the construction of new turbines
different from the sum of the effects of the individual (an inflow) and retirement of old turbines (an outflow). In
policies. For example, a policy that promotes energy contrast, the amount of energy generated by wind turbines
efficiency in addition to a policy that reduces the cost in a given year is calculated afresh every year (based on the
of wind energy, enacted together, are likely to reduce installed capacity in that year) and therefore is a normal
emissions by a smaller amount than the predicted sum variable, not a stock variable. The Energy Policy Simulator
of each of those two policies enacted separately. This uses stock variables for two purposes:
is because some of the electricity demand that was
▪▪
eliminated by the efficiency policy would otherwise
have been supplied by additional zero-emissions wind Tracking quantities that grow or shrink over time
generation caused by the wind policy. In this case, the (such as the total wind electricity generation capacity)
total effect is less than the sum of the individual effects.
The opposite is also possible. For example, policies ▪▪ Tracking differences from the current policy scenario
input data that are prone to change over the course
that promote the electrification of light-duty vehicles of the model run (for instance, the cumulative differ-
in addition to making wind energy cheaper are likely to ences caused by enabled policies in the potential fuel
have a greater impact on emissions together than the consumption of the light-duty vehicle fleet)
sum of these policies’ individual effects.
Due to the strength of integrated computer models at System dynamics models often use the output of
simulating complex systems, a customized integrated the previous timestep’s calculations as input for the
following timestep.10 The Energy Policy Simulator
dynamic computer model is a crucial tool to help Hong
follows this convention, with stocks like the electricity
Kong policymakers evaluate a wide array of policies. A
generation fleet, the types and efficiencies of building
satisfactory model must be able to represent the entire
components, and other stocks recorded from one year to
economy and energy system with an appropriate level of
the next. Therefore, an efficiency improvement in a prior
disaggregation, be easy to adapt to represent Hong Kong,
year will result in fuel savings in all subsequent years
be capable of computing a wide array of relevant policy
until the improved vehicle, building component, or other
options, and offer results that include a variety of policy-
investment is retired from service. The industrial sector
relevant outputs. Additionally, the model must capture
is handled differently. The available input data come in
the interactions of policies and other forces in a system
the form of potential reductions in fuel use and process-
the parameters of which change dramatically over the
related emissions due to policy. We gradually implement
course of the model run as Hong Kong continues to grow
these reductions (with corresponding implementation
and develop.
costs), rather than recursively tracking a fleet-wide
efficiency. Due to the diverse forms of input data in the
many sectors we model, one approach rarely works for
all sectors. Accordingly, the Hong Kong EPS attempts to
use a suitable approach that makes the most sense in the
context of a specific sector.
4|Hong Kong Energy Policy Simulator: Methods, Data, and Scenario Results for 2050
Structure of the Hong Kong EPS the energy needs of these three sectors. The sixth
sector, land use, does not consume fuel or electricity.
The structure of the Hong Kong EPS can be envisioned
along two dimensions: All six sectors produce emissions of each pollutant
that are summed at the bottom of Figure 1. The same
▪▪ The visible structure that represents the equations
that define relationships between variables (viewable
is true for cash-flow impacts, which are calculated
separately for individual actors such as government,
as a flowchart) industry, consumers, and the five energy industries.
▪▪
At this stage, calculation of changes in spending
A behind-the-scenes structure that consists of arrays are carried out on items like capital equipment,
(matrices), in addition to their elements that contain operations and maintenance (O&M), and monetized
data that are acted on by the equations social benefits from avoided public health impacts
and climate damages. Cash flows are calculated on
For example, the transportation sector’s visible a first-order basis, as noted above and described in
structure consists of policies (such as a fuel economy endnote 9. Box 2 provides an example of how EPS
standard), input data (such as the kilometers traveled determines Hong Kong’s electricity generation.
by a passenger or a ton of freight), and calculated
Two components of the model—research and
values (such as the quantity of fuel used by the vehicle
development (R&D) and carbon capture and storage
fleet). The arrays in the transportation sector consist of
(CCS)—affect the operation of various sectors. A set of
vehicle categories (light-duty vehicles [LDVs], heavy-
R&D levers allows the user to specify improvements
duty vehicles [HDVs], motorbikes, etc.), cargo types
in fuel economy and reductions in capital cost for
(passengers or freight), and engine types (petroleum
technologies in each of the five sectors, as well as in
gasoline, petroleum diesel, electricity, liquified
the CCS module. The CCS module affects the industry
petroleum gas (LPG), etc.). The model generally
and electricity sectors by reducing their CO2 emissions,
performs a separate set of calculations, based on
increasing their fuel usage due to the energy-intensive
each set of input data, for every combination of array
CCS process, and changing their cash flows.
element. For example, the model will calculate different
fuel economies for passenger HDVs and freight HDVs.
The model has six main sectors: industry (including
manufacturing and related industries, construction,
agriculture, and waste management); buildings;
transportation; electricity generation; land use,
land-use change, and forestry; and district heat and
hydrogen. In addition, there are several supporting
modules handling other functions, as depicted in
Figure 1. The model’s calculation logic begins with the
fuels section where basic properties of all fuels are set,
and policies that affect the price of fuels are applied.
Information about the fuels is used in all sectors except
land use.
The transportation, buildings, and industry sectors
calculate their respective emissions from direct fuel
use (e.g., fossil fuel combustion in vehicles, buildings,
and industrial facilities). These sectors also specify
the amount of electricity or hydrogen (energy carriers
supplied by other parts of the model) required each
year. The electricity sector, in addition to the district
heat and hydrogen module, consumes fuel to supply
TECHNICAL NOTE | December 2019 | 5Figure 1 | Hong Kong's Energy Policy Simulator Model Structure
Fuel Use Heat or Hydrogen Use Cash Flow R&D Influence
Carbon Sequestration Pollutant Emissions Electricity Use
(and associated fuel use)
R&D Fuels
CCS Industry & Ag Buildings Transportation
District Heat
Land Use Electricity and Hydrogen
Cash Flow Pollutants
Source: Energy Innovation Policy and Technology LLC.
Box 2 | How EPS Determines Hong Kong’s Electricity Generation
The two power companies in Hong Kong, Hong Kong Electric (HKE) and China Light and Power (CLP), currently have significant coal capacity (2,000 and 4,108
megawatts, respectively). As coal is also the cheapest energy source, by default, the EPS model assumes around 70 to 80 percent of base year energy generation to
be coal. However, in reality the generation from these coal power plants is constrained by government policy. The seventh Technical Memorandum for Allocation of
Emission Allowances in Respect of Specified Licenses for Hong Kong sets emission limits for air pollutants, which apply to the power companies. Because of these
limits, the power companies can only generate a certain amount of electricity generation from coal power plants, the remaining generation has to be supplied by
gas, nuclear, and renewables. Moreover, Hong Kong’s Climate Action Plan 2030+ specifies the government’s vision for a reduction in coal use. By 2020, there is an
electricity generation target of 50 percent natural gas, 25 percent coal, and 25 percent non-fossil fuels. In order to account for these deviations from what the model
predicts based purely on capacity availability and resource prices, we tuned the EPS parameters “BAU Expected Capacity Factor” (BECF) and assumed that coal
power plants have a lifetime of 40 years before they retire. This leads to major coal retirements in 2020 and 2025, which makes the projection in the current policy
scenario consistent with existing policies.
Source: HKE, CLP, Hong Kong’s Climate Action Plan 2030+.
6|Hong Kong Energy Policy Simulator: Methods, Data, and Scenario Results for 2050
INPUT DATA SOURCES between United States and Hong Kong, using the
U.S. value will still produce reasonable results in
The Hong Kong EPS is adapted from the international, the model.
open-source release of Energy Innovation’s Energy
Policy Simulator (version 2.0.0). To adapt the model to
Hong Kong, significant data requirements are needed to
▪▪ If the data are unlikely to vary by region (with low
importance rating)–for example, the global warm-
be met using a variety of data sources for the variables. ing potentials of various gases—and/or when data
The variables are rated with ranked importance from from Hong Kong were unavailable and scaling
very high to high to medium to low, primarily based on another region’s data would be irrelevant or inap-
the impact the variable might have on modeling results propriate, the input data from other regions were
and how varied the value could be between regions. The used unchanged. For example, the expected lifetime
input data were sourced via the following approaches, of a building component like an air conditioner in
in order of priority: another region may be the best available estimate
▪▪ For variables that have a significant effect on mod-
eling results and that need to be region-specific
of the lifetime of that same type of building compo-
nent in Hong Kong.
(with a very high and high importance rating), we
use publicly available data published by the Hong Appendix Table A-1 indicates the data source used for
Kong government. Examples of such variables in- each variable.
clude population, start year electricity capacity, and
building energy use by building type or purpose.
For macro data and general energy data, the source SCENARIOS AND RESULTS
is primarily the Census and Statistics Depart-
ment. For sector-related, climate change - specific- This section explains how we designed the scenarios
related, or detailed energy consumption data, the and presents preliminary modeling results from Hong
sources include Environmental Protection Depart- Kong EPS.
ment, Labor Department, Civil Aviation Depart-
ment, Housing Department, Marine Department, Scenarios Setting
Transport Department, Electrical and Mechanical In the Hong Kong EPS, we considered two scenarios:
Services Department, and others. Another source
▪▪
is through stakeholder consultation. The project
team organized seven roundtables on electricity Current Policy Scenario: presents the existing poli-
generation, distributed gas, transportation, build- cies up to 2030 and projection up to 2050, based on
ing, carbon price and CCS, waste management, and the trends from current policies
lifestyle. The team also had more than 20 in-depth
conversations with local stakeholders on the above- ▪▪ Decarbonization Scenario: presents our principal
recommendations for Hong Kong to achieve deep
mentioned topics.
decarbonization by 2050
▪▪ For the variables that are likely to be different
from region to region but will not generate unrea-
The Current Policy Scenario is established through
setting input data based on the current policies, while
sonable results (with medium importance rating), the Decarbonization Scenario layers policies on top of
we used Hong Kong data where available and data the Current Policy Scenario with the objective of deep
from the existing China or U.S. models when Hong decarbonizing by 2050.
Kong data are not available. Input data from China
or the U.S. EPS were selected, depending on the Table 1 summarizes the data of the major parameters
variable and which would most closely represent in the Current Policy Scenario. Some of the data are
the circumstances in Hong Kong. For example, assumptions used in the Hong Kong EPS, while some
U.S. data are used for the elasticity of building ser- are calculations from the model, which are presented
vice demand with regard to energy cost, for which in order to help readers better understand the model
we could not find a source for a Hong Kong - spe- setting. Table 1 also summarizes policy settings in
cific value. While the elasticity might be different the Decarbonization Scenario. Explanations and
TECHNICAL NOTE | December 2019 | 7assumptions for the main parameters are summarized
as follows:
▪▪ Fuel mix: In 2017, Hong Kong consumed 157,604
terajoules of electricity (Census and Statistics
▪▪ Population: This study uses Hong Kong popula-
tion projection statistics published by the Census
Department 2018)11 while fossil fuel - powered
electricity generation emitted 26.6 million tonnes
CO2 equivalent (EPD 2019).12 Coal-fired power
and Statistics Department (C&SD) in September
(48 percent of total electricity) is the major fuel
2017. Using the local population in mid-2016 as a
source for electricity generation. HKE and CLP
baseline, the statistics forecast population trends
are operating six and eight coal-fired units in their
between 2017 and 2066 (2017–2050 data are used
plants, respectively. Electricity from natural gas (27
in the model) and includes projections of domestic
percent) and imported nuclear power (25 percent)
households and the labor force. Hong Kong’s popu-
lation projection is affected by several factors, such are the second and third largest sources for Hong
as total fertility rate, mortality, and the number of Kong. As stated by Hong Kong’s Climate Action
new immigrants as measured by the number of one- Plan 2030+, Hong Kong will be gradually phasing
way permit holders. The C&SD produced baseline, out coal-fired electricity generation and switching to
high, and low population projections. In this study, natural gas - fired electricity generation.
only the baseline projections are adopted whereas
the high population projection will be tested in In the short term (up to the mid-2020s), natural gas
further development of the model. According to the will contribute about half of Hong Kong’s electricity
C&SD statistics, Hong Kong’s population in mid- generation whereas coal will drop to about 25
2016 was 7.34 million. In the baseline condition, the percent. This is expected to be achieved through
local population is projected to reach a peak of 8.22 retiring coal generation units in the Lamma Power
million in mid-2043 and then gradually drop to Station and Castle Peak Power Station by retrofitting
7.72 million in mid-2066. The average growth rate them to burn gas. The government did not publish
between 2016 and 2043 is 0.4 percent per annum, any further road maps for the fuel mix beyond 2030.
and the rate of decrease between 2043 and 2066 In the Long-Term Decarbonization Strategy Public
is 0.3 percent per annum (Census and Statistics Engagement document, the government suggests
Department 2017). Following the baseline popula- that 80 percent of Hong Kong’s electricity would
tion projections, this study adopts 8.15 million as need to come from zero-carbon energy sources to
the Current Policy and Decarbonization Scenario meet the Paris Agreement’s 2°C target (Council
population in 2050. for Sustainable Development 2019). An even more
ambitious fuel mix blueprint is necessary for Hong
▪▪
Kong to be on a trajectory consistent with limiting
GDP: Hong Kong has a small, open, and advanced the global temperature rise to no more than 1.5°C
economy, yet its growth is expected to deceler- and achieve zero emissions in the long term.
ate steadily. To assess economic growth rates,
this study uses figures issued in Treasury Branch, For Hong Kong to meet the net-zero emissions
Financial Services and the Treasury Bureau (2014). target by 2050, this study crafts a scenario to
The base case of the report assumes that real GDP increase renewable energy (RE) use to 38 percent
growth would be maintained at 3.5 percent per an- by 2050. For instance, 3 percent of renewable
num between 2014 and 2021 (actual annual growth energy can be generated locally (the existing official
was 2.9 percent on average during 2014–18), gradu- projection for Hong Kong‘s local RE potential is
ally decelerate to 3 percent between 2022 and 2025, 3–5 percent13), and 35 percent can be imported from
then further decrease to 2.5 percent between 2026 Mainland China. There will be about 0.7 percent of
and 2041. Because there have not been any relevant electricity generated from the municipal solid waste
studies projecting local economic growth beyond treatment plant, which has the capacity to treat
2041, this study assumes that between 2042 and 3,000 tonnes of waste per day and can generate 480
2050, growth would be maintained at 2.5 percent.
million kilowatt-hours (kWh) per year.14
The base case assumptions from 2014 to 2050 sug-
gest an average projected real GDP growth rate of
Hong Kong’s current contract with Daya Bay
2.7 percent per annum.
terminates in 2034. Daya Bay nuclear plant started
8|Hong Kong Energy Policy Simulator: Methods, Data, and Scenario Results for 2050
operation in 1993, and its life will be 40 to 60 years.
There will be tests of the plant at the 30-year mark
▪▪ Energy efficiency: The government still hasn’t
rolled out a clear long-term efficiency road map for
in 2023 to see whether it can run for 40, 50, or 60 buildings or vehicles. Therefore, this study references
years. Also, consideration of market conditions the International Energy Agency (IEA) research
will decide whether to extend the contract past “Market Report Series: Energy Efficiency 2018” (IEA
2034. Because of the uncertainty—in particular, 2018) in determining the energy efficiency improve-
plant life span, site availability, safety, and public ment parameter for the building and transporta-
acceptance—this study maintains the nuclear share tion sectors and adopted a revised efficiency rate
of generation as 25 percent. after consultation with relevant stakeholders. For
example, to calculate the building energy efficiency
The remaining generation portion, about 34 improvement rate for different energy use purposes,
we used data recommended by the Hong Kong Green
percent, should be powered by natural gas with
Building Council.
CCS, an emerging technology. CCS has been
deployed in multiple countries, such as China,
Japan, the United States, and Canada, over the
last 20 years. The cost of CCS in power plant
is about US$40/tonne of CO 2. This might be
important to keep essential services running—in
particular, hospitals, the airport, and the water
supply.
▪▪ Town planning: The Long-Term Housing Strat-
egy Annual Progress Report 2018 (LTHS) was
released in December 2018 (Transport and Hous-
ing Bureau 2019). The LTHS study produced Hong
Kong’s long-term housing demand projection. The
government estimates that, between 2016 and 2046,
total housing demand will be about 1 million. This
study assumes that in 2050, 60 percent of residents
will live in public housing while 40 percent will live
in private houses.
▪▪ Transportation: The continuous growth of private
vehicle ownership is a major factor contributing to
air pollution, GHG emissions, and traffic congestion.
The government tackled the importance of private
vehicle fleet size control and appointed the Transport
Advisory Committee to compile the report “Study
of Road Traffic Congestion in Hong Kong.” (Trans-
port Advisory Committee 2014). Short-, medium-,
and long-term measures for controlling the private
vehicle fleet size have been recommended. This study
adopts “EMFAC-HK Vehicle Emission v4.1 Calcula-
tion” by the Environmental Protection Department
for providing the activity projection for vehicles
between 2016 and 2041 (EPD 2019b). The number
of private cars and motorcycles was projected to
increase to 896,500 in 2041.
TECHNICAL NOTE | December 2019 | 9Table 1 | Scenarios Setting in the Hong Kong EPS
2050 Current 2050
Key Variables Unit 2017
Policy Scenario* Decarbonization Scenario
Population a Thousands 7,391 8,152 8,152
Social and
GDP b HK$ trillions 2,578 6,233 6,233
Economic
GDP per capita HK$/capita 359,374 687,434 687,434
Electricity demand c TWh 44 61 49
- Share from coal d % 45 0 0
- Share from gas d % 30 69.3 35 (with CCS), considering energy security and reliability
Additional renewable portfolio standard to
- Share of local RE d % 0.04 3.1
Electricity increase the percentage to 4.
- Share of waste-based energy j % 0 0.7 1
- Share from imported electricity 60, including 25 from nuclear remain, additional
% 26 26.9
from renewables and nuclear d 35 RE import from Mainland China
Electricity consumption per capita KWh/capita 5953 7450 5950
Population living in private homes e % 55 40 40
Population lived in public housing e % 45 60 60
Commercial building floor area f Million m2 47 54 54
1. Additional energy efficiency improvement of
new equipment in 2050:
• Cooling and ventilation: 40%,
• Lighting: 35% • Envelope: 30%
• Appliance: 25% • Other components: 11%
Buildings Energy demand per capita MJ/capita 7609 7984
2. Additional 100% of new equipment is electric
in 2050
3. Retrofit existing buildings rate in 2050:
• Commercial: 48% • Residential public: 48%
• Residential private: 48%
Energy demand per unit of floor area MJ/m2 2648 2867 2867
Share of electricity in total energy
% 80 86 100
consumption in buildingsh
LDVs, passenger Vehicle fleet 575,004 830,586
Gasoline vehicle % 94% 30%
LPG % 2.7% 0.05%
Diesel vehicle % 1.8% 2.2% 1. Electric Vehicle Sales Mandate:
Battery electric vehicle % 1.6% 60% • E V contributes to 50% of new vehicle sales by
Plug-in hybrid vehicle % 0.02% 7% 2025, 100% from 2030 for buses and taxis
Natural gas vehicle % 0.004% 0.1% • E V contributes to 50% of new vehicle sales
Transportation i Hydrogen % 0% 0% by 2030, 100% from 2040 for passenger and
Buses Vehicle fleet 21,131 21,090 freight LDVs
Diesel vehicle % 80% 2.7% 2. Fuel economy standard
LPG % 19.8% 0.01% • A dditional 30% improvement in 2050 for all
Battery electric vehicle % 0.2% 84% types of vehicles
Natural gas vehicle % 0% 9%
Plug-in hybrid vehicle % 0% 3.1%
Gasoline vehicle % 0% 0%
10 |Hong Kong Energy Policy Simulator: Methods, Data, and Scenario Results for 2050
Table 1 | Scenarios Setting in the Hong Kong EPS (Continued)
2050 Current 2050
Key Variables Unit 2017
Policy Scenario* Decarbonization Scenario
Hydrogen % 0% 0%
Taxis Vehicle fleet 53764 53872
LPG % 99.95% 4.5%
Gasoline vehicle % 0.05% 0%
Battery electric vehicle % 0% 94%
Plug-in hybrid vehicle % 0% 0.8%
Natural gas vehicle % 0% 0%
Diesel vehicle % 0% 0%
Hydrogen % 0% 0%
LDVs, freight Vehicle fleet 71469 83882
Diesel vehicle % 97% 3.4%
Gasoline vehicle % 2.9% 0.2%
Battery electric vehicle % 0.1% 88.2% 1. Electric Vehicle Sales Mandate:
Natural gas vehicle % 0.004% 0.05% • E V contributes to 50% of new vehicle sales by
Plug-in hybrid vehicle % 0.01% 8.1% 2025, 100% from 2030 for buses and taxis
LPG % 0% 0% • E V contributes to 50% of new vehicle sales
Transportation i Hydrogen % 0% 0% by 2030, 100% from 2040 for passenger and
HDVs, freight Vehicle fleet 44111 51109 freight LDVs
Diesel vehicle % 99.1% 83.9% 2. Fuel economy standard
LPG % 0.4% 0.6% • A dditional 30% improvement in 2050 for all
Gasoline vehicle % 0.2% 0.1% types of vehicles
Battery electric vehicle % 0.2% 0%
Natural gas vehicle % 0.2% 11.7%
Plug-in hybrid vehicle % 0.002% 3.8%
Hydrogen % 0% 0%
Motorcycle Vehicle fleet 77200 77334
Gasoline vehicle % 99.9% 54.1%
Battery electric vehicle % 0.1% 45.9%
Natural gas vehicle % 0% 0%
Diesel vehicle % 0% 0%
Plug-in hybrid vehicle % 0% 0%
LPG % 0% 0%
Hydrogen % 0% 0%
99% of emissions from industry and power
Cross- CCS % 0 0 sector will be captured and stored through CCS
Sector technology, starting from 2030.
Note 2: * Numbers are for 2050, linear growth from 2017 unless explanation provided
Some percentage numbers may not add up to 100 due to rounding. Industry-related data are not shown in the table because they only account for a very small portion of total emissions in Hong
Kong. a Hong Kong Census and Statistics Department. b Treasury Branch, Financial Services, and the Treasury Bureau. c EPS Hong Kong output, based on electricity demand from end-use sectors
including buildings, transportation, and industry. d 2017 data are from EMSD; 2020 data are from Hong Kong 2030+ report; 2030 and 2050 data are assumptions. e 2017 data are from Housing in
Figures 2017 (Transport and Housing Bureau 2017). Other years’ data are assumptions based on trends and consultation with local stakeholders. f 2017 data are estimates based on the internal floor
area figures in RVD’s Hong Kong Property Review series, assuming an internal floor area or gross floor area conversion factor of 0.75. Other years’ data are assumptions based on population. g 2017
data are calculated based on population and energy consumption data from EMSD (2017). Other years’ data are forecast based on trends, local stakeholder consultation, and reference to other cities.
h
Not input data but calculated from input data. i Data for 2017 vehicle fleet by vehicle type are from statistics (Transport Department 2019), and other years’ data are assumptions. j There is a waste-
to-energy power plant under construction, which will be in operation in 2024. The designed capacity is 3,000 tonnes of municipal solid waste per day, according to the EPD.
Sources: Hong Kong Census and Statistics Department; Treasury Branch, Financial Services, and the Treasury Bureau; Hong Kong 2030+ report; Transport and Housing Bureau 2017; EMSD 2017; and Transport Department 2019.
TECHNICAL NOTE | December 2019 | 11Results of the Current Policy Scenario largest contributor. Figure 3 shows emissions from a
consumption perspective, in which the building sector is
▪▪ Overview
Under the Current Policy Scenario, the Hong Kong EPS
the largest contributor. This is due to the large amount of
cooling demanded in buildings, the energy for which is
provided by electricity. In Hong Kong’s case, the net import
results show that, in 2017, total energy-related CO2 of electricity is set to only include nuclear and renewable
emissions were 36 million tonnes. By 2050, emissions energy; therefore, there are no emissions related to
are projected to decrease to 22.5 million. Figure 2 shows imported electricity, and production-based emissions and
direct emissions for which electricity generation is the consumption-based emissions are the same.
Figure 2 | Energy-Related CO2 Emissions by Sector in the Current Policy Scenario
Electricity Transport Building Industry
40
35
30
Million tonnes of CO2
25
20
15
10
5
0
2017 2018 2019 2020 2021 2022 2023 2024 2025 2026 2027 2028 2029 2030 2031 2032 2033 2034 2035 2036 2037 2038 2039 2040 2041 2042 2043 2044 2045 2046 2047 2048 2049 2050
Note: These are production-based emissions, or scope 1 emissions.
Source: Hong Kong EPS.
Figure 3 | Energy-Related CO2 Emissions by Sector with Reallocated Electricity Emissions in the Current Policy Scenario
Building Transport Industry
40
35
30
Million tonnes of CO2
25
20
15
10
5
0
2017 2018 2019 2020 2021 2022 2023 2024 2025 2026 2027 2028 2029 2030 2031 2032 2033 2034 2035 2036 2037 2038 2039 2040 2041 2042 2043 2044 2045 2046 2047 2048 2049 2050
Note: These are consumption-based emissions, or scope 1 and scope 2 emissions in the building, transportation, and industry sectors.
Source: Hong Kong EPS.
12 |Hong Kong Energy Policy Simulator: Methods, Data, and Scenario Results for 2050
Figure 4 | Electricity Demand by Sources in the Current Policy Scenario
Imported nuclear Coal Gas Renewable energy Municipal solid waste
70
60
50
40
TWh/year
30
20
10
0
2017 2018 2019 2020 2021 2022 2023 2024 2025 2026 2027 2028 2029 2030 2031 2032 2033 2034 2035 2036 2037 2038 2039 2040 2041 2042 2043 2044 2045 2046 2047 2048 2049 2050
Source: Hong Kong EPS.
▪▪ Electricity
Under the Current Policy Scenario, Hong Kong will
Feasibility Study” (EPD 2010), conducted by Environ-
mental Resources Management in 2010 for EPD. This
maintain 25 percent of total electricity use from nuclear study uses 2005 as the base year and forecast emis-
sions for 2030. http://www.deltacityofthefuture.com/
electricity imported from Mainland China. Coal power
documents/study_of_climate_change_HK.pdf
will be gradually phased out by 2038, and natural
gas will contribute to about 69 percent of electricity
generation in 2050. Only limited electricity will come ▪▪ World Wildlife Fund (WWF) study: “Energy Vision for
HK 2050,” conducted by WWF in 2015 (WWF 2015).
from renewable energy (3 percent) and municipal solid This study analyzes Hong Kong’s energy projection to
waste (0.7 percent), as shown in Figure 4. 2050. https://www.wwf.org.hk/en/?13120
Comparisons of the Hong Kong EPS Current Policy
Scenario to Other Similar Scenarios
▪▪ “Hong Kong Greenhouse Gas Emission Inventories,
1990–2017,” released by EPD in 2019 (EPD 2019a).
This contains the official data on Hong Kong’s histori-
In this section, we compare the outputs from the Hong cal GHG emissions. https://www.climateready.gov.
Kong EPS’s Current Policy Scenario to equivalent hk/page.php?id=23&lang=1
outputs from the projections of other studies.
Depending on the quality of the documentation of
Figure 5 shows the comparison of total GHG gas
assumptions and calculations used in other projections,
emissions from the EPS, Hong Kong GHG emissions
it is sometimes possible for us to identify why our
inventory, and EPD 2010 study. The Hong Kong
own projection is lower or higher than that of other
EPS 2017 emissions are nearly identical to the 2017
projections. In these instances, we include notes of
emissions from Hong Kong’s official GHG emissions
possible reasons for differences.
inventories. The former was 37.54 million tonnes of
CO2 while the latter was 37.85 million tonnes of CO2
This note includes the following other projections or
(only includes energy- and industrial processes - related
current status studies:
emissions). The Hong Kong EPS projection is much
▪▪
lower than the EPD study conducted in 2010. The
Environment Protection Department (EPD) 2010 reason is that the EPD 2010 study was conducted nearly
study: “A Study of Climate Change in Hong Kong— 10 years ago and used some assumptions that are out of
TECHNICAL NOTE | December 2019 | 13Figure 5 | Comparison of Total Greenhouse Gas Emissions
EPS Current Policy Scenario Hong Kong GHG emissions inventory EPD 2010 Study Base Case
(without waste and AFOLU)
50
45
40
35
million tonnes CO2
30
25
20
15
10
5
0
2005 2010 2015 2020 2025 2030 2035 2040 2045 2050
Sources: Hong Kong EPS, EPD 2010, and EPD 2019.
Figure 6 | Comparison of Total Electricity Demand
EPS Current Policy Scenario WWF Current Policy Scenario
70
60
50
40
TWh
30
20
10
0
2015 2020 2025 2030 2035 2040 2045 2050
Sources: Hong Kong EPS; WWF 2015.
date. The EPD 2010 study didn’t reflect the most up-to- million people for 2030, the more up-to-date data from
date policies, such as switching from coal to gas in the the Census and Statistics Bureau.
power generation sector, which was announced in 2017.
There was a downward trend in Hong Kong’s emissions Figure 6 shows total electricity demand projections from
since 2014 in actuality, but the EPD 2010 study didn’t the Hong Kong EPS and WWF. The two studies’ results
reflect this change. In addition, the EPD 2010 study are quite similar, despite differing methodologies. WWF
used 2005 as the base year and did forecasting for used a top-down approach in which the base year (2015)
2030. The population used in this study for 2030 was demand was 43 terawatt-hours (TWh). Demand increases
8.3 million people , while the Hong Kong EPS used 8.0 1.5 percent annually between 2016 and 2025, 0.9 percent
14 |Hong Kong Energy Policy Simulator: Methods, Data, and Scenario Results for 2050
annually between 2026 and 2040, and 0.3 percent Comparisons of the Hong Kong EPS Current Policy
annually between 2041 and 2050. The Hong Kong EPS Scenario with the Decarbonization Scenario
uses a bottom-up approach where electricity demand is
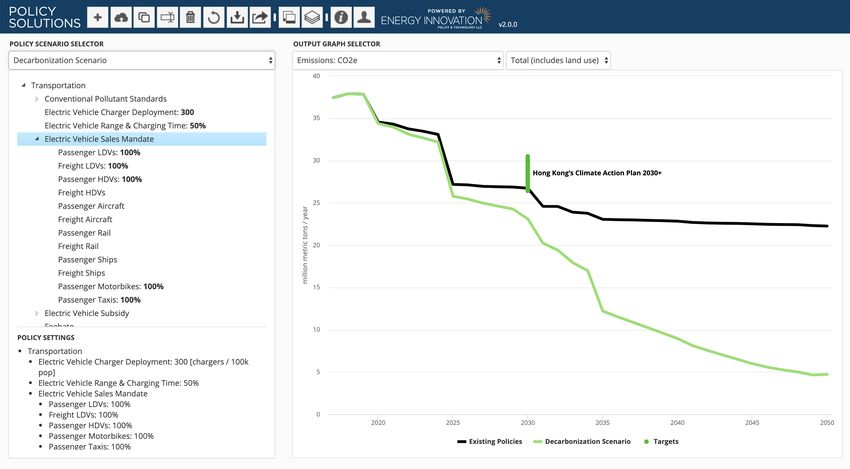
Under the Decarbonization Scenario, Hong Kong’s CO2
determined by input data choices and model calculations
emissions in 2050 decrease to around 5 million tonnes,
in the building, transportation, and industry sectors.
much lower than the 23 million tonnes in the Current
Electricity demand from these sectors is determined by
Policy Scenario. The policies that have the most impact are
factors such as population and economic growth, newly increased retrofitting, building energy-efficiency standards,
built commercial and residential buildings, electrification carbon capture and storage, increased imported nuclear
in building appliances, and electric vehicle (EV) sales and renewable energy electricity, renewable portfolio
share. The Hong Kong EPS result also reflects factors standards, and an EV sales mandate (as shown in Figure
contributing to reduced electricity demand, chiefly from 7). Detailed analysis and policy recommendations will be
energy-efficiency improvements. included in a forthcoming policy report.
Figure 7 | Effects by Policy
EV Sales Mandate Vehicle Fuel Economy Standards Transportation Demand Management
Building Component Electrification Building Energy Efficiency Standards Contractor Training
Improved Labeling Increased Retrofitting Carbon-Free Electricity Standard
Electricity Imports and Exports Industry Energy Efficiency Standards Carbon Capture and Sequestration
40
35
30
25
million metric tons / year
Current Policy Scenario
20
15
10
5 Decarbonization Scenario
0
2018 2020 2022 2024 2026 2028 2030 2032 2034 2036 2038 2040 2042 2044 2046 2048 2050
Source: Hong Kong EPS.
TECHNICAL NOTE | December 2019 | 15ONLINE HONG KONG ENERGY POLICY In addition to visualizing the results of included
scenarios, users also can create their own scenarios
SIMULATOR through functions in area 4 shown in Figure 8. The
The Hong Kong EPS can be accessed through the functions include starting a new scenario, saving
webpage hongkong.energypolicy.solutions. Users can the scenario, saving the scenario with a new name,
choose an included scenario to view the results (area renaming the scenario, deleting the scenario, reverting
1 in Figure 8). Users can check 128 charts showing to the saved scenario, downloading graph data policy
various results (area 2 in Figure 8), such as electricity settings, sharing the scenario by e-mail, toggling one or
generation, building energy consumption, vehicle fleet, two charts, selecting scenario and target comparisons,
emissions, and policy effects under different scenarios. viewing the online guide, and creating one’s own
For some parameters such as total emissions, human account. Users can save the new scenario in that
health and social benefits, policy effects, and emission personal account and share with others by e-mail. When
reductions, users can compare results among scenarios. creating scenarios, users are running the model in real
Users can view policy settings under all policy scenarios time on the server.
(area 3 in Figure 8), such as share of imported
electricity or EV sales mandate. For more details, a series of four videos providing a
helpful walk-through of how to use the simulator can be
found at https://us.energypolicy.solutions/docs/video-
series.html.
Figure 8 | The Hong Kong EPS Website Interface
4
1
2
3
Source: Hong Kong EPS.
16 |Hong Kong Energy Policy Simulator: Methods, Data, and Scenario Results for 2050
LIMITATIONS to pricing effects or provide a floor or ceiling gov-
erning the underlying effects.
To create a computer model that is less complex than
the real world, it is necessary to make assumptions and
simplifications. Similarly, model capabilities and results
▪▪ We assume that all the current policies will
continue. There are possibilities that the trajectory of
may be affected by limitations in the available data. the current policy will change if there is any economic
shock or major change to the government policy.
Two types of assumptions underlie the Hong Kong
EPS: structural assumptions common to all versions
Hong Kong - specific limitations are as follows:
of the EPS and Hong Kong - specific assumptions
▪▪
that relate to input data. Structural assumptions are
described in detail in the EPS’s online documentation In Hong Kong, not all data needed are avail-
at https://us.energypolicy.solutions/docs/assumptions. able. For example, certain elasticities of demand for
html and https://us.energypolicy.solutions/docs/how- services with respect to price have not been studied in
the-eps-avoids-double-counting.html. Hong Kong. When data from Hong Kong for a variable
are completely unavailable, foreign data have been
Limitations common to all EPS models are included here: scaled or adapted to fit Hong Kong, thus producing in-
accuracy. All data are meticulously cited and included
▪▪ Uncertainty is greater with larger numbers
of policies or tougher policies. Input values in
with the downloadable version of the model, allowing
model users to update the data and test new assump-
the EPS must be studied, measured, or simulated tions if desired.
under a particular set of conditions or assumptions.
These conditions cannot reflect all possible combina-
tions of policy settings that a user might select in the
▪▪ We decided to exclude some sectors due to
their very limited impact. Agriculture, forestry
and other land-use sectors account for only 0.1 per-
EPS. Generally, the model’s Current Policy Scenario
cent of Hong Kong’s emissions. Very little data exist
is likely to be closest to the conditions reflected by
on these sectors, and the potential for any policy is
the input data. Therefore, the uncertainty of policy
extremely limited due to the small land area of Hong
effects is likely smallest when a small number of
policies are used and enabled policies are set at low Kong. Therefore, we decided not to include these sec-
values. Uncertainty increases as the policy package tors in the model.
includes a greater number of policies and the settings
of those policies become more extreme. ▪▪ Inconsistency of underlying assumptions. This
study sources assumptions and projections from vari-
▪▪ Characterizing uncertainty is not numerically
possible. Uncertainty bounds were not available
ous sources, including other studies or plans, expert
judgment, and stakeholder feedback. These sources
for input data; therefore, uncertainty bounds are are likely to have inconsistent underlying assump-
not available on output data. As an alternative, the tions, either explicitly or implicitly.
EPS model supports Monte Carlo analysis, which
can highlight the sensitivity of the model results to
changes in any particular input or set of inputs.
▪▪ Some sectoral aggregation is required for
industry. One such example is that while industry is
the major emissions contributor in many places of the
▪▪ Several techniques are used to avoid double-
counting policy effects, and these techniques
world, Hong Kong’s industry emissions only account
for 7 percent. In the EPS, the embedded subsectors
involve trade-offs. Pricing policies (and other include the traditionally energy-intensive industries
price effects) alter the demand for goods or services like cement, natural gas and petroleum, iron and
and alter the decisions of consumers looking to buy steel, chemicals, and mining while there are no such
new equipment; however, they cannot holistically industries in Hong Kong except textile and apparel,
account for all possible responses that individu- non-manufacturing15 food and beverage, metal and
als and businesses may have without duplicating machinery, and some other industries. We, instead,
certain responses already governed by other policy included all the sectors added together in the EPS
levers. Other policy levers’ effects must be additive category “other industries.”
TECHNICAL NOTE | December 2019 | 17FUTURE DEVELOPMENT APPENDIX. DATA SOURCES FOR VARIABLES IN
At present, the Hong Kong EPS contains a Current THE HONG KONG EPS
Policies Scenario and one example policy scenario, the Table A-1 presents the data source, including all the
Decarbonization Scenario, in which strong policies are variables. Information includes the meaning, the
implemented starting in 2018 aiming to achieve deep importance to update for a new region, whether it is a
decarbonization by 2050. Hong Kong - specific value, and the specific data source
for each variable.
In a future stage of this project, we could conduct
further analysis, such as creating a net zero scenario The importance ratings column indicates the
in which hydrogen and carbon taxes will be needed so importance of updating the variable when adapting
that Hong Kong’s emissions can reach zero in 2050. the model to a new region–in our case to Hong Kong.
Parallel calculations can be conducted to analyze the Variables are rated “very high,” "high," "medium,"
different impact of policies, for example, by testing "low," or "n/a" in importance, explained as follows:
different proportions of electricity generation sources
▪▪
and different energy-efficiency improvement rates in
buildings and transportation, using a downloadable The very high and high importance variables are
model that benefits from the fact that the model is the ones that have a significant effect on the results
open-sourced and publicly accessible. Also, scenarios of the output of the model or ones that will likely
with different GDP and population assumptions or vary significantly from region to region. Not using
combined model outputs with sector-specific models regional-specific data will likely result in inaccurate
can be created. This could allow the analysis of more modeling results.
complex possibilities and comparison of the costs
versus the benefits among different pathway options.
The tool may also be updated and revised to use
▪▪ The medium importance variables are those likely
to vary among regions, but are still likely to gener-
ate reasonable results. Examples for those include
different or additional data sources. It could potentially
elasticities.
be used to help determine the stringency of a 2050
target and subsequently analyze the implications of
different policy pathways for achieving that target to ▪▪ Low importance variables are those that are unlikely
to vary greatly among regions; for example, global
contribute to the Paris Agreement goals.
warming potential values or lifetime estimates for a
given type of power plant.
Some functions in the EPS are not currently used but
may be added in the future. For example, the district
heating module could be adapted into a district cooling ▪▪ Certain variables are determined via calibration and
are dependent on other data variables in the model.
module, thus estimating relevant policy effects. Being Variables designated “n/a” are constants that do not
a very hot place, Hong Kong does not need district need to be updated.
heating. However, the Hong Kong government has
recently started to promote district cooling as an
alternative to conventional air conditioning. The
prospects of this nascent technology are still relatively
uncertain; however, it could be interesting to include it
in the EPS. For now, we leave it as an option for future
improvement.
18 |You can also read