Sustainable Energy Action Plan 2010-2020 - Municipalities of Borgholm and Mörbylånga Island of Öland, Sweden - My Covenant
←
→
Page content transcription
If your browser does not render page correctly, please read the page content below
Sustainable
 Energy Action Plan
     2010-2020
     Municipalities of
Borgholm and Mörbylånga
 Island of Öland, Sweden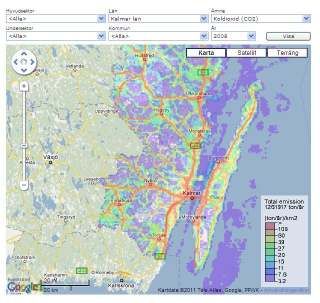
Approved 2012-01-10 §10

Innehåll:

1. SUMMARY ........................................................................................................................... 3
2. CONTEXT ............................................................................................................................. 3
   2.1 Background ...................................................................................................................... 4
   2.2 Organization of work, climate change ............................................................................. 4
   2.3 Climate change................................................................................................................. 5
   2.4 The municipalities’ ability to influence ........................................................................... 8
3. INVENTORY ........................................................................................................................ 9
   3.1 Geography & population.................................................................................................. 9
   3.2 Baseline emissions, carbon dioxide ............................................................................... 11
   3.3 Business as usual scenarios ............................................................................................ 15
   3.4 Fulfilling the targets - a 2020 countdown ...................................................................... 19
   3.5 Industry .......................................................................................................................... 29
   3.6 Municipal buildings ....................................................................................................... 25
   3.7 Waste.............................................................................................................................. 25
   3.8 Business & service ......................................................................................................... 26
   3.9 Household ...................................................................................................................... 27
   3.10 Transport ...................................................................................................................... 28
   3.11 Energy production........................................................................................................ 29
4. BANKABLE PROJECT ...................................................................................................... 31
5. VISIONS & STRATEGIES ................................................................................................. 33
   5.1 Climate targets ............................................................................................................... 33
   5.1.5.1 Mörbylånga municipality energy- & climate targets ............................................... 37
   5.1.5.2 Borgholm municipality energy- & climate targets .................................................. 37
   5.2 Climate strategy linked to objectives in other policy documents .................................. 38
6. ACTIONS ............................................................................................................................ 39
7. ORGANIZATIONAL AND FINANCIAL MECHANISMS .............................................. 45
   7.1 Coordination and organisational structures ................................................................... 25
   7.2 Staff capacity ................................................................................................................. 25
   7.3 Involvement of stakeholders .......................................................................................... 45
   7.4 Budget ............................................................................................................................ 45
   7.5 Financing sources and instruments ................................................................................ 45
   7.6 Monitoring and follow-up .............................................................................................. 46

2
Approved 2012-01-10 §10

1. SUMMARY
Political decisions concerning energy and climate issues in the municipalities of Öland,
Borgholm and Mörbylånga, has long been characterized by project approach. While this has
worked well there has been no long-term strategy in the field. There was first in connection
with the greenhouse effect's massive impact that showed the need of a common climate
strategy.
Both municipalities of Öland joined the Covenant of mayors in late 2010 and the beginning of
2011 and as an Island decided to do a common SEAP through Öland’s Municipal
Association.

EU sustainability means that by 2020 the EU should:

• Reduce carbon dioxide emissions by 20 % compared to 1990 levels
• Energy mix will consist of 20 % renewable energy
• Total energy consumption will decrease by 20% by 2020

The membership in the Covenant of mayors shows that to Öland and its municipalities
climate issues are of utmost importance and priority. One of the commitments of membership
is to produce a Sustainable Energy Action Plan, which now has been done. This document is
the draft version and will be supplemented and revised until December of 2011 or January of
2012 when the SEAP will be politically approved.

The SEAP gives a clearer overall picture of how, where and to what extent the Öland
population and activities affects the climate in the form of carbon dioxide emissions to the
atmosphere. A survey of our energy use, energy generation and carbon emissions has resulted
in indications and understanding of how we are doing in relation to its objectives. Without an
existing situation analysis with defined indicators and measurable goals is something so
complex as to effectively reduce the carbon footprint of an entire island next to impossible to
implement.

For a sustainable future and continuous improvements,
Kenth Ingvarsson
Kenth Ingvarsson
Chairman, Öland municipality federation

Lisbeth Lennartsson
Lisbeth Lennartsson
Vice Chairman, Öland municipality federation

2. CONTEXT
                                                                                             3
Approved 2012-01-10 §10

2.1 Background
Today's global warming affects both humans and nature as it is we who are the cause of it.
Human activity is behind the releases of both naturally occurring and a large number of man-
made greenhouse gases. Burning of fossil fuels, agriculture and deforestation has led to
increased levels of carbon dioxide in the atmosphere. The time is not taken up by vegetation,
but falls outside the natural cycle and we get an enhanced greenhouse effect as a result.
Climate change effects are everywhere to cause droughts, rising average temperatures,
increased precipitation, extinction of animal and plant species, rising sea levels, more storms
and natural disasters and increased spread of diseases. In the future, judged the effects, are to
increase significantly.
In order to slow the progression of increased greenhouse gas emissions, measures must be
broad, globally, nationally and locally. Within the EU and in Sweden are now major efforts to
increase energy efficiency and use of renewable energy sources. Although Öland is a small
island in a global context, we must make the changes we can. The option to wait does not
exist.

It is we who live in the richer parts of the world with the largest emissions of greenhouse
gases that first and foremost have the responsibility to reduce our emissions. If we are not
able to reduce them, neither will the developing countries.

The fact that energy prices will rise in the future is a matter of course and it's important to
have a solid mix of sustainable fuels in order to dynamically meet the future.
In keeping with the times and the increasing knowledge about the transformation of our
planet is undergoing, and we with it, constantly changing society's perceptions, assumptions
and hence the law. All we will be affected by the changes that a changing climate means, not
least, we who live on islands. But we should be aware that we are with and contribute to these
changes, although it may seem that these small areas the effect on climate is negligible. In
order to adapt to and prevent this undesirable global climate change, we must do something
active. Pact of Islands is not only an important commitment; there is an understatement to
show others that it is possible that the island can make a difference in Sweden, Scandinavia,
Europe and the world.

By joining the Covenant of Mayors, Öland is taking its climate responsibility in a more
systematic and structured approach with good knowledge sharing opportunities between other
islands and countries. Öland want to prove to the world that the island and its inhabitants are
serious about the senior climate goals that are formulated in the respective municipalities
Energy & Climate policies from 2010. The islands both communities are also involved in a
large-scale energy efficiency work which the State Energy Agency supports.

The future is not ours; we have only borrowed it from coming generations.

2.2 Organization of work, climate change

4
Approved 2012-01-10 §10

The local board of each municipality is responsible for the project and as a first step, was set
up internal structures consisting of a steering committee and a working group. The working
groups led and coordinated by the respective Mörbylånga and Borgholm energy and climate
change strategists, consisting of various experts, people in areas including buildings, roads,
energy, transport and industry. The steering group has political support and indicated resource
framework for the project.

The key to the success of the project is spelled Commitment. In order to achieve the best
results require that there is an interest and a desire for change from all stakeholders; from
politicians, municipal management, officials of business representatives.
In order to maintain engagement throughout the journey requires regular monitoring and
feedback is done and the results are visible and easy to understand, even for those who are not
involved in the project.

2.3 Climate change
2.3.1 The greenhouse effect
The greenhouse effect is simply that the gases in the atmosphere keep some of the heat
radiated by the Earth's surface. The atmosphere's natural greenhouse effect is a prerequisite
for life on Earth and without it there would be almost 35 ° C colder at the surface than it is
today. What distinguishes the climate change we are experiencing today from this natural
effect is that human emissions alter atmospheric chemistry and thus exacerbating the
greenhouse effect.
Greenhouse gases like water vapour and carbon dioxide occurs naturally in the earth's
atmosphere. The gases do not prevent sunlight from reaching down to the earth's surface and
where heat it up, but they catch up effective outgoing heat radiation and reflect heat back
toward Earth. It is in this way the greenhouse gases retain the heat around the Earth.

The main greenhouse gases are water vapour and carbon dioxide. Other greenhouse gases are
methane, nitrous oxide (laughing gas) and fluorinated gases (including so-called CFCs). In
order to compare emissions are expected if the contribution from each gas to the amount of
carbon (so-called "carbon dioxide") that have the same impact on climate. Burning fossil
fuels (coal, oil and natural gas) gives rise to carbon dioxide, which accounts for 80% of
greenhouse gases. Other greenhouse gases are more potent as greenhouse gases, but
emissions are much smaller than for carbon dioxide. The sources of other greenhouse gases
are coming mainly from agriculture (methane and nitrous oxide), landfill (methane),
combustion (laughing gas), while the fluorinated gases mainly come from the refrigeration
equipment, circuit breakers and aluminium production.

The concentrations of several greenhouse gases are now increasing in the atmosphere, mainly
due to our burning of fossil fuels. Increased levels in turn lead to enhanced greenhouse effect
and the more greenhouse gases in the atmosphere - the hotter it gets.

In order to evaluate the massive climate-related research taking place worldwide, the UN has
established a Panel on Climate Change (IPCC 2007), which consists of nearly 2500 scientists.
The panel has agreed on an assessment on the human impact on climate and the effects this
will have. In its fourth assessment report drawn up in spring 2007 shows that the average
global temperature has increased by an average of 0.74 ° C over the past 100 years. Their
recommendation was to limit the impact so that the temperature rise stops at 2 ° C.
During the last twelve years, eleven of the warmest years since 1850 have occurred. The
Panel concludes that the global increase in carbon dioxide levels primarily due to the use of
                                                                                              5
Approved 2012-01-10 §10 fossil fuels and changing land use, while the increase of methane and nitrous oxide mainly depends on agriculture. 2.3.2 Climate change in Sweden In Sweden the greenhouse gas emissions has gradually been reduced in the residential and service since 1990. The reason is the switch from oil heating to district heating, heat pumps and biofuels. Although emissions from agriculture and waste dumps are on the downward. In agriculture depends decline to reduced numbers of livestock holdings, the waste sector on the collection of gas from landfills and that landfill bans and landfill tax has spurred a decrease in the amount of material dumped. Declines are offset, however, to one part of a continuing increase in road traffic emissions. In particular, is the heavy goods transport increasing. Even emissions from certain industrial sectors are increasing. Climate change may mean a number of consequences for Sweden. One consequence is warmer winters and a general increase in precipitation across the country. The number of times of intense rainfall is also expected to increase. Sweden's average temperature is strongly dependent on the Gulf Stream, which threatens to stop altogether as the polar ice melts and cools the ocean. According to statistics from tatistics Sweden (SMHI), Sweden's average temperature has increased by +1° Celsius degrees since 1860. Fig.1. Graph showing the average temperature (Celsius degrees) in Sweden between the years1860 and 2010. There are most evident differences in temperature in the middle part of the country. Indicators such as shrinking glaciers, shorter periods with snow the south, animal residents at lower latitudes moves northward and tree borders climbs higher in the Swedish mountains shows that the climate is changing. 6
Approved 2012-01-10 §10

The precipitation has also changed over the same period. Sweden has experienced a marked
increase, in some places it amounts to just over 10 %, which should be regarded as a
significant amount. Most increases in precipitation in northern and western Sweden.
Precipitation increase has been relatively evenly distributed throughout the year except in
autumn when it has fallen instead.

2.3.3 Climate change on Öland
In 2003 and 2004 struck with very heavy summer rain with widespread flooding southern
 Fig.2.
 Graph showing the average precipitation(millimetres) in Sweden between the years1860 and
 2010.
Sweden and especially Småland, Öland's most surrounding landscape. Changes in
precipitation and increased evaporation may lead to increased summer drought in southern
Sweden.

The increased rainfall and more intense rainfall will increase the risk of flooding, which leads
them to become more common along coasts, lakes and streams. The statistical agency in
Sweden expects that the sea level around the year 2050 has been increased by 30 centimetres
and in 2100 assumed the total to be between 55-120 centimetres higher than it is today - the
water levels would be disastrous for Öland as its highest point is 50 meters above sea level.
According to model calculations are not the sea level rise expected by the same rate
throughout the earth. The calculations suggest that the seas around Sweden could rise more
than the global average.

                                                                                              7
Approved 2012-01-10 §10 2.4 The municipalities’ ability to influence Öland municipalities have an important role to play in the energy and climate change initiatives through its responsibility for physical planning, energy planning, supervision and operation of technical facilities. Municipalities have also good opportunities to influence developments through their responsibilities for information, education and counseling. Planning plays an important role if we are to achieve energy and climate goals and reduce climate change. General and detailed plans are an important function in terms of energy such as current location of new development and how it is placed in the terrain, the possibilities for public transport which is created and the heating system that can be used. Transport represents a large proportion of greenhouse emissions. Cost and availability play a critical role in the choice of fuels and transportation. Local authorities have little ability to influence legislation, fuel prices and taxes, some of the factors that govern our use of fuel and therefore our carbon emissions. Municipalities can, however, in their various roles and close contact with citizens and businesses work towards more environmentally friendly transport, energy efficiency measures in the municipalities and to develop effective policy instruments such as procurement and political support for booting of biogas production. By being an intermediary of knowledge and information, municipalities may communicate their contribution as citizens and businesses can apply for other public authorities. One such example in the energy field is premium for conversion from direct electric heating to district heating, mountain, sea or ground source heat pump or biomass. In addition, municipalities may use the environmental administration of the activities for reducing the carbon footprint. This can be done by checking the environmental code enforcement, under review and to require low greenhouse gas emissions and through active enforcement measures aimed at reducing emissions. The municipality as an organization contributes to a relatively large part of the municipality's total greenhouse gas emissions. By seeing their energy consumption, business travel, transportation, and in the context of procurement set climate requirements, the municipality can reduce its own carbon footprint significantly. Finally, the municipality plays an important role in information dissemination and public education. Here is the Energy Adviser, an important resource, both to the island's businesses and private individuals. 8
Approved 2012-01-10 §10

3. INVENTORY
3.1 Geography & population

                                                                     Öland
                                                                     Kalmar County
                                                                     Borgholm Municipal &
                                Sweden                               Mörbylånga Municipal

                                Scandinavia
                                European Union

Öland is located in the Baltic Sea in south-eastern Sweden and the surface is the smallest
landscape(1 350,1 square kilometres1) but also the second largest island in the country. The
island belongs to Kalmar County and consists of two municipalities; Mörbylånga in the south
and in the north Borgholm. Since 1972, Öland is anchored to the mainland by the 6072 meter
long Öland bridge, which is the only commercial means of transportation to and from the
country.

The bedrock consists mostly of limestone, which has given rise to the rich flora found. The
landscape has great cultural and natural values of national and international interest and
value, of which one of them is the many windmills that are scattered around the island. In the
southeast part of Öland is bird life studied all year round by ornithologists from various parts
of Europe. The island can also be proud of the fact that southern Öland is on UNESCO's
World Heritage List2.

Öland reached 24 697 inhabitants3 the 31st of December 2010, of whom 55 % are 45 years or
                                                                                        9
Approved 2012-01-10 §10 older. The population density makes a cut of 18,3 inhabitants per square kilometre which makes 10.6% percent of the county's total population. In total there are 12 083 homes4 on the island, of which 2008 of them are apartment buildings. Öland’s geology 1) Böda sandarea Composed mainly of gravel and sand dunes. 2) Ölands Northern Alvar area Limestone pavement which patches are covered with a thin layer of boulder clay or sandy soil. 3) Ölands Northern drumlinarea Moraine and other deposits that formed strings in the northwest-southeast direction, which gave rise to a lobed coastline and a slightly hilly terrain. 4) Western coast plateau A narrow strip of muddy boulder that has a string of glacial river material in forest beach bar. 5) Algutsrum Have a deeper soil layers where both till and other soil types present. 6) Southern (big) Alvaret Covered by an extremely thin moraine soil cover and patches are rocks totally bare. 7) Eastern Landborgsarea Pic.1. Characterized by the sea walls and meadows. Öland’s geology* 10
Approved 2012-01-10 §10

3.2 Baseline emissions, carbon dioxide
The carbon inventory has identified the following three main emission categories in Öland:

•Industrial Processes, 43.8%.
Of which the vast majority of emissions come from the mineral industry, almost exclusively
from the very energy-intensive cement production in the Cementa AB, Degerhamn, southern
Öland.

• Energy, 34.8%.
Electric heating plants account for the bulk of emissions, followed by self-heating and boiler
houses.

• Transportation, 17.9%.
Passenger transport accounts for more than half of total emissions in this category.

To reduce carbon dioxide emissions from these sectors focuses municipalities for actions
which initially involves energy efficiency in public sector activities with a focus on
transportation, changing behaviors in business and property management. To reach out with
the knowledge and inspiration for the island's residents and businesses, the officials from each
municipality and Öland Business Office will attend and arrange various energy activities such
as Energy Day and Bankable Project.

Emissions statistics was made based on figures taken from reference years 1990 and 2008
statistics from statistics Sweden (SCB), Swedish environmental emissions data (SMED),
Sweden’s geological survey (SGU), the environmental protection agency (Naturvårdsverket)
and local chimney sweep. The years were selected because 1990 is the year the EU is using as
a reference to 20-20-20-goals and the 2008 is a year of above-mentioned bodies have had
time to compile their statistics of the genre.

                       Total CO2 emission comparison between simular municipalities

                  600000

                  500000
     Tonnes CO2

                  400000

                  300000

                  200000

                  100000

                      0
                           1990    2000         2005          2006        2007           2008
                                                       Year
                                  Population Municipality   Area Municipality    Öland

 Fig. 3. Total carbon dioxide emissions, all sectors. Comparison between Öland
 and theSwedish municipalities corresponding to the same surface area (Örebro
 municipality) or numbers of population (Höganäs municipality).

                                                                                                11
Approved 2012-01-10 §10
From a carbon perspective, Öland’s three major climate-sensitive sectors are industry (the
mining industry), energy and transport. Compared with municipalities with similar surface
area and population, has always Öland (between the years of 1990 and 2008) had a higher
carbon dioxide emission number per capita in all those three sectors (Fig. 5,6,7).
Total CO2/capita comparison
18
16
14
Tonnes CO2
12
10
8
6
4
2
0
1990 2000 2005 2006 2007 2008
Year
Population Municipality Area Municipality Öland
Fig. 4. Total carbon dioxide emissions/ capita, all sectors. Comparison between
Öland and theSwedish municipalities corresponding to the same surface area
(Örebro municipality) or numbers of population (Höganäs municipality).
Öland carbon dioxide emissions/ capita for year 2008 is 17,5 tonnes (Fig. 4), which is more
than three times more than the Swedish average5 - which corresponds to 5 tons for the same
year. If you compare it with the municipalities of the same area (Orebro) or population
(Höganäs), has Öland over nine times more carbon dioxide emissions levels!
This huge difference is due to a major and decisive factor: Cementa AB, one of Sweden's
three largest cement factories. This factory is located in the southern part of Öland, in
Mörbylånga Municipality, namely in Degerhamn.
CO2/capita, industrial sector comparison
18
16
14
12
Tonnes CO2
10
8
6
4
2
0
1990 2000 2005 2006 2007 2008
Year
Population Municipality Area Municipality Öland
Fig. 5. Total carbon dioxide emissions/ capita, the industrial sector. Comparison between Öland and theSwedish
municipalities corresponding to the same surface area (Örebro municipality) or numbers of population (Höganäs
municipality).
12Approved 2012-01-10 §10
CO2/capita, energy sector comparison
18
16
14
Tonnes CO2
12
10
8
6
4
2
0
1990 2000 2005 2006 2007 2008
Year
Population Municipality Area Municipality Öland
Fig. 6. Total carbon dioxide emissions/ capita, the energy supply sector. Comparison between Öland and
theSwedish municipalities corresponding to the same surface area (Örebro municipality) or numbers of
population (Höganäs municipality).
CO2/capita, transport sector comparison
18
16
14
Tonnes CO2
12
10
8
6
4
2
0
1990 2000 2005 2006 2007 2008
Year
Population Municipality Area Municipality Öland
Fig. 7. Total carbon dioxide emissions/ capita, the transport sector. Comparison between
Öland and theSwedish municipalities corresponding to the same surface area (Örebro
municipality) or numbers of population (Höganäs municipality).
13Approved 2012-01-10 §10
Öland belongs to the
Population in Kalmar County 2008
County of Kalmar and
24 592 the island’s surface
10%
represents 12% of the
population (Fig. 9) and
10% of the county's
total population Fig. 8).
Of the county's total
carbon dioxide
emissions, has Öland’s
233 397 share increased from
90%
remarkable 25 % to 34
Kalmar County Öland % between the year of
1990 and 2008 (Chart
Fig. 8. Öland’s percentage share of the whole Kalmar County’s population
2008. 1). Of the county's total
carbon dioxide
emissions from its
Kalmar County area
industrial sector from
1 350,1
the same time aspect,
12% covers Öland’s mineral
industry (Cementa AB)
between 98 - 100%.
However, these high
figures are hardly
surprising when
Cementa AB's factories
9 867,7 (the remaining plants
88%
are located in Skövde &
Kalmar County Öland
Slite) account for about
4.4% of Sweden's total
Fig. 9. Öland’s percentage share of the whole Kalmar County’s surface area. carbon emissions. From
a global perspective the
cement industry covers around 5% of the world’s total (human) carbon dioxide emissions6.
Öland's total share of Kalmar County's carbon oxide emissions
1990 2000 2005 2006 2007 2008
Energy supply 20% 22% 13% 26% 27% 37%
Industrial processes 98% 98% 98% 98% 100% 99%
Transport 15% 14% 13% 14% 13% 14%
Machinery 17% 15% 17% 18% 16% 17%
Solvent use 10% 9% 10% 10% 6% 6%
Total 25% 25% 23% 28% 28% 34%
Chart 1. Öland’s percentage share of the whole Kalmar County’s carbon oxide emissions during the
years of 1990 and 2008.
14Approved 2012-01-10 §10
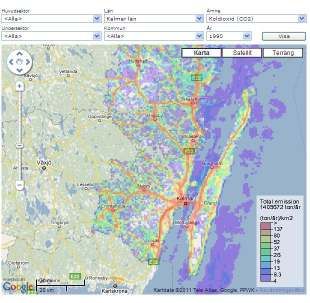
Geographic maps (Pic. 2, 3) from the Environmental Protection Agency7 below shows
Kalmar county with Öland’s municipalities and their total carbon emissions in 1990 and 2008
respectively.
By comparing the maps can
be concluded that the main
issues are around the towns
Borgholm, Färjestaden and
Mörbylånga, which in itself is
not particularly surprising
since these sites also has the
largest population and hence
most activity (such as traffic).
Thereafter comes smaller
villages like Grönhögen,
Degerhamn, Runsten, Böda
and Löttorp. The reason for
these regions point emissions
can be explained by activities
that are located there.
Common to Grönhögen,
Pic. 2. Löttorp and Byxelkrok is that
Kalmar county’s carbon dioxide emissions during 1990, all varieties carries stone
tonnes/year & km2 cutting operations.
Degerhamn has a very
energy-intensive cement
industry, Cementa AB, which
accounts for just over half of
Öland's total carbon dioxide
emissions.
Pic. 3.
Kalmar county’s carbon dioxide emissions during 2008,
tonnes/year & km2
15Approved 2012-01-10 §10
3.3 Business as usual until 2020
Everything indicates that the greenhouse gases will increase if no actions are taken.
Looking at CO2 comparing the EU-target and the Island target the island will pass the target
with more than 30% if no actions are taken.
Business As Usual-scenario compared with EU:s
20% CO2 reduction target, Öland
550000
500000
450000
400000
Tonnes CO2
350000
300000
250000
200000
150000
100000
50000
0
1990 2005 2007 2009 2011 2013 2015 2017 2019
Year
Eu:s target Business as usual
Business As Usual-scenario compared with Öland's 20% CO2
reduction target, Öland
600000
550000
500000
450000
Tonnes CO2
400000
350000
300000
250000
200000
150000
100000
1990 2005 2007 2009 2011 2013 2015 2017 2019
Year
Öland's target Business as usual
16Approved 2012-01-10 §10
Although the island have a very large cement industry which considerably changes the
emission balance, leaving this industry outside of the emissions statistics we will find that
Öland is close to reaching the target even with business as usual.
Business As Usual-scenario compared with EU:s 20% CO2
reduction target,
Öland without Cementa AB
600000
500000
Tonnes CO2
400000
300000
200000
100000
1990 2005 2007 2009 2011 2013 2015 2017 2019
Year
Eu:s target Business as usual, w ithout Cementa
Business As Usual-scenario compared with Öland's 20% CO2
reduction target,
Öland without Cementa AB
600000
550000
500000
Tonnes CO2
450000
400000
350000
300000
250000
200000
150000
100000
1990 2005 2007 2009 2011 2013 2015 2017 2019
Year
Öland's target Business as usual, w ithout Cementa
17Approved 2012-01-10 §10
Average estimated tonnes CO2/capita, Öland
25
23
21
19
Tonnes CO2
17
15
13
11
9
7
5
1990 2005 2007 2009 2011 2013 2015 2017 2019
Year
Regarding the future population we have looked at the development since 1990 finding only
small differences. While the Island is connected to the mainland by bridge the number of
part-time inhabitants will probably increase as many summer house owners tender to live
there an increasing number of months per year and in many cases all year round when retiring
from work.
Estimated population development for Öland
27 000
25 000
23 000
21 000
19 000
Borgholm Municipality
Numbers
17 000
Mörbylånga Municipality
15 000
Total,Öland
13 000
11 000
9 000
7 000
5 000
1990 2005 2007 2009 2011 2013 2015 2017 2019
Year
18Approved 2012-01-10 §10
3.4 Fulfilling the targets, a 2020 countdown
Each municipality’s energy- and climate strategy provides a number of actions which is to
take place inside the municipality. In order to reach the 2020-target of no more than
350.000 tons of CO2 the actions taken by official authorities only makes a small
contribution.
Close to 70.000 tons of CO2 has to be reduced by 2020 in total compared to 1990 where
the municipality actions stand for less than 3% of the target (2,1 ton CO2). That’s why it is
so important to take actions together with the inhabitants of the Island.
Due to the fact that the island has a well developed wind energy master plan we will reach
a 62% reduction of CO2 by 2020 compared to 1990.
1. Renewable energy production.
The dominant part is the development of new wind power farms on the Island.
By 2010 there are 85 MW of wind power in operation producing nearly 150 GWh
per year. These figures are likely to be more than doubled to 2020 according to the
developed wind power plan for the Island pointing out 17 areas suitable for wind
power without major impact on the Islands delicate nature and other interests. The
total of 380 GWh wind power will instead of imported electricity reduce CO2
emissions by 175.000 tons since 1990.
According to undergoing investigation is likely that the Island have a Biogas fuel
station before 2020, but as being newly introduced, it is unlikely to have any
significant effect on the CO2 emissions.
2. Conversion of fossil fuel to renewable fuel at industries.
The by far most important action will be the decision by the Cementa factory to
start burning waste from the nearby municipalities instead of coal. The contract has
been signed and will be in operation during 2012 or 2013. This action reduces CO2
emissions by 15.000 tons per year. They will also receive feathers from a nearby
poultry factory which, when operational, will reduce CO2 emissions by another
3.000 tons.
3. Use of renewable fuel in transport.
Although the Island most certainly has at least one biogas fuel station in 2020 is it
not likely to also have electricity production from biogas. So the exact reductions
of CO2 from transports are difficult to foresee. We know that there will be a small
amount of electric vehicles and biogas fuelled cars but there numbers are in small
scale. Yet the auto industry will produce more efficient cars as the price of fossil
fuel will increase and environmental and economic advantages are important to the
buyer. Together with the normal updating of the transport fleet and improved efficiency of the
vehicles it is likely that CO2 will be reduced by 15% in 2020 or
8.000 tons compared to 1990.
4. More efficient use of electricity.
Due to the EcoDesign-directive electricity use in households will decrease with at
least 20% when fully implemented. As consequence electricity use should drop
some 55.000 MWh or 6.600 tons CO2 by 2020. But you have to keep in mind that
the households are increasing their electric use with more and more domestic
gadgets so it probably that the final figure could be up to 50% less than expected.
The local energy advisors have a key role to create public awareness.
19Approved 2012-01-10 §10
Of the 6.600 tons of CO2 a mayor part will be electric heating efficiency.
The Island have some 12.000 summer houses which mostly are electric heated in
the winter to 5-10° C to avoid frost damages. There are, and are increasing in great
numbers, houses that are converted into air-to-air heat pumps. For a normal size
summerhouse that would be a reduction of CO2 by 420kg CO2/year each and with
75% of the houses converting we reach a possible reduction of 3.800 tons CO2.
Several projects are starting and will start coming years regarding energy efficiency
in industries, the goal is set to 20% improvement with no mayor investments
necessary.
Energy experts say it is an easy goal to reach. So without counting with the cement
factory the energy used by industry on the island was 205.000 MWh in 1990 and a
reduction by 20% in energy use would sum up 5.000 tons less of CO2.
How to reach the 2020 goals of CO2 reduction.
1. Renewable energy production 175.000 tons CO2
2. Conversion of fossil fuel to renewable fuel in industries. 18.000 tons CO2
3. Use of renewable fuel and increased efficiency in transport. 8.000 tons CO2
4. More efficient use of electricity. 11.600 tons CO2
5. Municipality owned actions 2.100 tons CO2
_____________________________________________________________________
214.700 tons CO2
To reach the Island 2020 target many actions are to be taken and require that the
municipality is ahead of the game leading the way and stimulates renewable energy
processes. The 2020-goal compared to 1990 is clearly achievable and a 50% reduction
compared to 2008.
Even now, 2011, the northern municipality of Borgholm is self-sufficient of renewable
electricity for public activity by 100% through its investment in wind power.
The southern municipality of Mörbylånga is already today self-sufficient with renewable
electricity by 75%.
20Approved 2012-01-10 §10
3.5 Industry
Öland is characterized mainly for its agriculture and farmland. The major industrial
operations on the island has a major impact on Öland's total carbon emissions, namely
Cementation AB.
Cementa
Cementa is the largest Swedish cement company (only?). The company is owned by the
German HeidelbergCement Group since 1999. Cementa has three sites across Sweden; the
largest on Slite (on the island Gotland), Skövde and the smallest in Degerhamn (Öland). The
reason for the placement of Degerhamn is explained by the proximity of raw material
excavation of limestone and the infrastructural advantageous port mode.
Cement industry in the world
Producing cement involves the need to heat the limestone crusher at a temperature of 1450
degrees Celsius, which requires a large energy expenditure. It is therefore hardly surprising
that the cement industry is the whim of climate-changing activities that it is in respect carbon.
The industry is estimated to account for 5% of total global emissions - which is more than the
entire aviation sector.
Cementa largest factory in Slite, is at the forefront in its field in terms of environmental
performance. The factory is one of the most modern and energy efficient cement plants in
Europe and is held up as an example of Swedish Nature Conservation Agency with regard to
industries that reduce their environmental impact.
Cement industry in Sweden
Sweden is a country that uses a minimum of cement per capita, because it’s more common to
build houses made of wood. There will not be any new established cement industries within
the northern Europe where it is seen as an overly expensive investment. A plant in the same
range as Slite, in Gotland, is estimated to cost as much as around four or five billion swedish
crowns. Instead, the emphasis is on developing the existing industries. In 2007 the estimated
production from cement three Swedish mills account for 90% of the total amount of cement
used in Sweden.
Cementas activity stands approximately for about 4,4 % of Sweden's total carbon dioxide
emissions, which is is less than the total transports in Sweden, but larger than any other single
swedish company contributes.
21Approved 2012-01-10 §10 Production Cement Manufacturing Tradition in Öland extends far back in time, until 1886 when Öland Cement Company Limited was formed and then start its production in Degerhamn two years later. In the factory, four different grades of specialty cements, known micro cement. This special production is best suited as a sealant of rock at the tunneling and large custom orders to include expansion of the E4 highway to Uppsala, the Hallandsås Tunnel, the City Tunnel in Malmö and the Botnia Line. In the early 1980’s was Cementa in a situation that was about to end in closure, but the company managed to rise, production has increased sharply since the somewhat weak economy in the early 2000’s. The good production figures resulted in an initial investment of 40 million in 2006 from Heidelberg Group, the money that was invested in the quality and energy efficiency work. The money was more than welcome when the Degerhamn plant was old and needed a renovation. Some of the measures undertaken was to ensure the safety of operations, phasing out an oil furnace and to adapt better after the then new environmental legislation. Fig.13. Cementa’s CO2 emission caused by their clinker production since 2006 22
Approved 2012-01-10 §10

Öland limestone quarry is classified as a mineral deposit with a national interest and the asset
is expected to be secured to 200 years.

Production (ton)                      Fuel use (ton)                       Raw material use (ton)
Cement           308 244              I EO1          109 632               Limestone       433 305
Clinker          276 882              Choal           35 228               Bauxite            2 372
CKD (cement waste) 2 172              KEO              5 350               Alox                2 358
                                      SPA              2 160               Sand              46 495
                                      Feather/Waste      500               Merox             10 687
                                                                           Gypsum            12 156
                                                                           Ferro              1 613
Chart 2. Cementa’s total production and fuel and raw material use in the year 2010.

Environmental efforts
Between the years 1993 and 2000, Cementa invested in environmental initiatives that costed
the company 200 million swedish crowns. Foremost was invested money in various technical
solutions to reduce dust, nitrogen oxide and sulfur oxide emissions but also to get a
functioning environmental management system in operation. Cementa in Degerhamn is a
company that has a major commitment in both the local business community and
environmental issues. The company has long had an open dialogue with the media, the local
construction and the municipality and is at the forefront with its many past and planned
research projects. One of the role models is Cementa factory in Slite that has come a long
way.

Cementa’s cement production requires high energy input for its energy-intensive production,
and the plant in Degerhamn is no exception. In fact, their special production requires a higher
concentration of the intermediate product clinker which gives higher carbon emissions per
tonne of cement than both the factories in Slite and Skövde.

Degerhamn main fuel (77.5%) are finely ground coal originating from Russia, but the fires
also solvents, KEO (converted fuel oil) and fuel oil - fuels the company gradually trying to
phase out with renewable fuels. One of the attempts made to reduce their carbon-based fuel
burning is the burning of plastic waste, which led to an agreement with the Kalmar regions
scavenger (KSRR) and an investment facility for a burning trial run for household waste.

Fuel                       Quantity          Energy           Share of        Energy        Energy
                           (ton)             (Gcal)           energy          consumption   content
                                                              (%)             (ton/h)       (kcal/kg)
Coal                       36 000            217 762          77,5            5,7           6 049,0
Solvent                    2 000             12 215           0,0             0,3           6 107,7
Fuel oil                   70                736              0,1             0,01          10 517,6
KEO                        4 000             40 137           19,2            0,6           10 034,3
Feathers/household         10 000            45 839           3,2             1,6           4 583,9
waste
Total                      52 070            316 690          100             8,2

Chart 3. Cementa’s total energy demand in the year of 2010.

                                                                                                       23
Approved 2012-01-10 §10 Cementa in Degerhamn started a collaboration with the chicken company Guldfågeln AB in 2010. The partnership means that the cement will begin to burn gold bird offal, feathers. This collaboration means that the cement reduces its coal and hence its dependence on fossil fuels while Guldfågeln reduce their waste by 22 000 miles of truck transportation. An investment of six million Swedish crowns are made of a spring plant where the springs are dried using waste heat from the lime kilns. Dried feathers have the same energy content as wood chips, which means that a pound of feathers is equivalent to two thirds of the energy contained in one kilogram of carbon. They estimate the climate benefit of the action to be about 3 000 tonnes decreased fossil carbon emissions per year. KSRR's federal council decided in August 2011 that Cementa in Degerhamn may burn their pre-sorted combustible waste. The decision means that the waste no longer need to transport around 55 000 tonnes of waste to Norrköping for combustion and that Cementa instead will be able to phase out its coal burning further. The new waste incineration does not contribute any ash or dust emissions since combustion is of very high combustion rate - higher than the current in Norrköping. Overall, we expect cement to reduce its fossil carbon dioxide emissions by 15 000 tons annually, equivalent to 3 000 Swedes' average annual emissions. Cementa plans to install an own new wind farm consisting of six works in one of Öland designated and approved wind areas, in the south of Degerhamn. The wind turbines capacity is not determined, but at present is 2,6 MW most current. The company is exploring ways to directly connect the turbines to the plant. Turbines would generate electricity equivalent to 15% of the entire island’s electricity demand - up to 40 GWh - which would cover the plant's annual energy needs. Cementa in the future Although Cementa in Degerhamn have not experienced such high production rates for that many years in a row previously, and that demand for cement is increasing, reason, leadership, however, that orders are one thing, while implementation is another. The underlying reason for this argument is that the large projects they distribute their cement is mostly publicly funded, which means that political decisions can be delayed depending on how they judge the economic situation. The need for cement plant is extensive and cement producers not only to the Swedish market longer, but also to the foreign since the mid-2000s, a market that paves the way for future production increases, facility developments and new challenges. The likelihood of increased production is high, which also would mean an increase in total emissions of CO2, although an increased environmental performance may mean a reduction on the ratio t CO2/producerad tons of cement. The burning of Guldfågeln AB’s feathers will be fully operational in time for January 2012 and the waste combustion begins in the second half of 2013 when the plant is expected to be fully completed. The discussion is now about infrastructure for the transport of waste and in the current situation, the emphasis is on the train between waste collection plant in Kalmar to boat over to Degerhamn. A permit application for a wind farm will be submitted in mid- October and the plants are expected to be operational sometime in 2013 if everything goes according to the plan. If the application is granted may be cemented in Degerhamn become Scandinavia's first wind-powered cement plant. 24
Approved 2012-01-10 §10
3.6 Municipal buildings
The municipality has converted the majority of its properties from electric and oil heating to
district heating in urban areas and the pellets and heat pumps in the smaller towns. A few
buildings remain, mainly those that are planned to be disposed of or located in areas where
heating could be established. To date, however, interest in operating a heating plant locally as
a contractor or contracting, has been weak.
In the municipal public buildings covering remote heat today approximately 71% of the total
heating and hot water needs.
Even among the small houses, there have been changes in the distribution between different
heating systems. The conversion to pellets and geothermal heat pumps are almost completely
made in the 2000s. For this group, the pricing of oil and electricity has been a strong incentive
to convert, and there have been a number of rendering assistance to search for individuals.
During the period 2010-2014, the municipalities have been awarded energy grants from the
Swedish Energy Agency to establish a comprehensive energy efficiency in both real estate
and transport to achieve the EU and Sweden's environmental policy in the environmental
field.
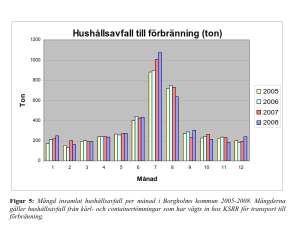
3.7 Waste
During the year 2008 were the total,
approximately 7489 tonnes of
household waste. The figure8 refers to
household waste in containers and
factions sludge. Bulky waste or
hazardous wastes are not included.
Looking at the distribution of the
seasons is uneven, because it doubles
during the summer months June, July
and August. The reason for this
imbalance is the major annual tourist
influx during the summer months. The
general trend is that the sorting does
not work so good with tourists who Fig.X.
rent cottages or camping, compared Amount of collected household waste per month,
with permanent housing sanitation Borgholm Municipality, 2005 - 2008.
subscribers.
Above (in fig.X) you can see annual breakdown of the fraction of household waste
incineration in the period 2005-2008 years in Borgholm's municipality.
Since the fall of 2007 have Kalmar’s sanitation company (KSRR) sent more containers and
container waste for incineration to Norrköping. Of course, is recovery of other factions such
as glass, plastic, newspapers, packaging, hazardous waste and metal, etc. done.
25Approved 2012-01-10 §10
3.8 Business & service
Öland's Business Office has developed guidelines to raise awareness about energy and
climate issues in order to choose the society and the environment most sustainable energy
source and to work and contribute to growth in a sustainable manner.
The municipality shall at all proceedings of the case and contacts with companies and
entrepreneurs information on the energy issue. The municipality shall at all proceedings of
the case and contacts with companies and entrepreneurs information on the energy issue. To
make an example could that be to cooperate with Öland Business Office and develop projects
to encourage entrepreneurship and increase the availability of alternative fuels and fuel as
well as local production of these
As previously mentioned, comprises the majority of Öland bedrock of limestone and the
island has given rise to a number of stone cutting operations primarily in Borgholm's
municipality, and the big cement industry Cementa AB Mörbylånga have chosen to put their
business on the island. The fact that Cementa operates, also means that the current situation
there is some inequality in terms of carbon dioxide emissions between Borgholm and
Mörbylånga municipality.
Mörbylånga has significantly more carbon emissions, which partly can be explained by that
two of Öland's three largest cities are located within the municipal boundary but above all
because of the fact that Cementa
AB's operates in this area, whose Carbon oxide emissions, industries, Kalmar county
emissions stood by as much as 2008
65.01% of the island's total
carbon emissions in 2008.
2
1,8
Today will be a collaboration 1,6
between the two largest 1,4
companies - Guldfågeln AB and 10 E+05 1,2 1,887
1
Cementa AB - in Mörbylånga tonnes 0,8
municipality and Cementa has 0,6
0,4
replaced its coal burning with 0,2 0,007 0,005
Guldfågens residue bird feathers, 0
Industries, Mineral Mineral
which saves on transport other industries, industries,
corresponding 220 000 Mörbylånga other
kilometers and a total carbon Fig. X. Type
dioxide reduction of about 3000 Showing Mörbylånga Municipality’s part of the Kalmar
tons. Also going on right now an county industrial sector and its overall carbon emissions.
investigation how Guldfågeln can utilize
its slaughterhouse waste as a feedstock
to a biogas producer.
With Öland’s membership in the Covenant of mayors, a Bankable Project is to be
implemented in the near future. This project involves collaboration between the municipality
and a private stakeholder in the wind power business.
26Approved 2012-01-10 §10
3.9 Household
It is the private dwellings that dominate the heating modes of land, water and geothermal heat
pumps (39%), followed by firewood (33%), oil (16%) and pellet (12%).
As for the district heating network, it supplies up and more than 1 485 properties with
renewable heating. Fuel mix is largely renewable materials in the form of wood chips, while
supporting the fuel used is fossil oil, and probably account for about 15% of the total energy
(which corresponds to approximately 45.2 GWh). Municipalities, however, intends to phase it
out in the future and replace them with fossil-such, preferably locally RME.
It is very likely that heat pumps will increase in number substituting oil and wood.
Although costs and use of renewable energy is increasing so is also the use of domestic
electricity which will be an important issue to handle.
27Approved 2012-01-10 §10 3.10 Transports 3.10.1 Gasoline Petrol and diesel for cars and heavy transport remains the dominant fuel. Although the vehicles have become more energy efficient, emissions of carbon dioxide increased. New guidelines that apply to public undertaking procurement and lease of vehicles is adopted in Borgholm and again in Mörbylånga municipalities. In October 2005 decided Borgholm municipality that it would replace its fleet of cars that can run on ethanol or biogas and Mörbylånga have the ambition to adopt similar decisions. In addition to that the vehicles will be smaller, will it be required that cars with ethanol, biogas or electricity primarily procured, while diesel cars with particulate filters only will be approved if none of the previous mentioned models are available on the market. Vehicles with only petrol must not be procured. In 2010, there were two filling stations for ethanol (E85) located in the towns Färjestaden and Borgholm. 3.10.2 Diesel Petrol and diesel for cars and heavy transport remains the dominant fuel. Although the vehicles have become more energy efficient, emissions of carbon dioxide has increased. The municipality can influence development by simply driving environmental friendly, low emission vehicles. In 2010, in line with the county's targets, all cars purchased or leased by the public sector shall be environmental friendly, according to the national definition that exists for government procurement9. It can also help to provide the residents with increased opportunities to choose alternative fuels. 3.10.3 Biogas As the situation is now, is there no produced biogas on Öland, the number of filling stations for this fuel is also missing. In 2010 conducted a conceptual study10 of Swedish Biogas International registrants who indicated that the Borgholm municipality in the county with the greatest potential for biogas production from manure, closely followed by Mörbylånga. The problem is the long distances between collection points on the island that could be resolved by Fig. 14. Fig. 15. building farm systems of an Biogas potential, Biogas potential, associated gas pipeline between them Mörbylånga municipality, Borgholm municipality, rather than a central collection point. measured in GWh, 2010 measured in GWh, 2010 For this to become reality, however, requires a strong commitment and a farmers market generated. 28
Approved 2012-01-10 §10

Total potential* of the island amounted to 179,7 GWh and is highest in Alböke, Gärdslösa and
Northern Möckleby.

Municipalities have the ambition to try to influence the oil companies to establish at least one
filling station in each municipality in the near future. In parallel, the municipality and the
public sector encourage local biogas potential suppliers (especially farmers) on the island and
explore the possibility of a future use of fuel cell engines.

3.10.4 Ethanol
In 2007, Öland got its first sale of ethanol and has since then expanded further with one more
place. The proliferation of these is one per municipality.

In the current situation, there is no production of ethanol on the island. According to one
study, it would at an establishment of an ethanol plant in Öland not be any problems with
local produce when the availability of cereals in the area. Location The issue also sees the
promising, and likewise there are good transportation facilities in connection roads and
shipping. However, seen Kalmar on the mainland as the next most appropriate place for an
ethanol production industry where probably neither Mörbylånga nor Borgholm, because of
their size can meet the heating demands of such activity or its requirement to dispose of
residual heat.

3.10.5 Electricity
In autumn 2010 Öland got his first pole charge, which is situated in Borgholm. When electric
cars are primarily geared to a more urban environment is electric cars are not the optimum for
the majority of the inhabitants of Öland. However, it is expected that low electric car
ownership in the county to rise as an increasing number of filling stations and over time
developed a better electric car selection.

3.10.6 Natural gas
Not used as fuel source.

3.10.7 RME
Not used as fuel source.

3.11 Energy production
3.11.1 Wind power
It’s blowing an average wind of 6.66 to 8.82 m / sec at a height of 71 meters above the
ground11 on Öland which makes the landscape of one of Sweden's windiest. In pace with the
increased interest in wind power in the country and the progress of technology development
in the area prompted the island's municipalities continuously on wind locations from both
landowners and energy companies. However, one can not only take into account the interest
in the need for renewable energy, but other interests as the preservation of natural and cultural
environments must also be met. Wind power as energy sources go hand in hand with Öland's
goal of becoming self-sufficient in energy by 2020. Therefore, a wind power plan12 is drawn
to explore the possibilities surrounding the expansion of wind power on Öland.

*
    In terms of sewage sludge, organic waste, manure from large farms and grassland (10% of cropland).
                                                                                                  29
You can also read