Renewable energy auctions in Japan: Context, design and results - www.irena.org - International ...
←
→
Page content transcription
If your browser does not render page correctly, please read the page content below
Renewable energy
auctions in Japan:
Context, design and results

                    www.irena.org
                                    1
© IRENA 2021
Unless otherwise stated, material in this publication may be freely used, shared, copied, reproduced, printed
and/or stored, provided that appropriate acknowledgement is given of IRENA as the source and copyright
holder. Material in this publication that is attributed to third parties may be subject to separate terms of
use and restrictions, and appropriate permissions from these third parties may need to be secured before
any use of such material.

CITATION
IRENA (2021), Renewable energy auctions in Japan: Context, design and results, International Renewable
Energy Agency, Abu Dhabi
ISBN 978-92-9260-298-7

    ABOUT IRENA
    The International Renewable Energy Agency (IRENA) serves as the principal platform for international
    co-operation, a centre of excellence, a repository of policy, technology, resource and financial knowledge,
    and a driver of action on the ground to advance the transformation of the global energy system. An
    intergovernmental organisation established in 2011, IRENA promotes the widespread adoption and sustainable
    use of all forms of renewable energy, including bioenergy, geothermal, hydropower, ocean, solar and
    wind energy, in the pursuit of sustainable development, energy access, energy security and low-carbon
    economic growth and prosperity.
    www.irena.org

DISCLAIMER
This publication and the material herein are provided “as is”. All reasonable precautions have been taken by
IRENA to verify the reliability of the material in this publication. However, neither IRENA nor any of its officials,
agents, data or other third-party content providers provides a warranty of any kind, either expressed or
implied, and they accept no responsibility or liability for any consequence of use of the publication or material
herein. The information contained herein does not necessarily represent the views of all Members of IRENA.
The mention of specific companies or certain projects or products does not imply that they are endorsed or
recommended by IRENA in preference to others of a similar nature that are not mentioned. The designations
employed, and the presentation of material herein, do not imply the expression of any opinion on the part of
IRENA concerning the legal status of any region, country, territory, city or area or of its authorities, or concerning
the delimitation of frontiers or boundaries.

ACKNOWLEDGEMENTS
This report, prepared under the guidance of Rabia Ferroukhi and Diala Hawila, was authored by Carlos
Guadarrama, Febin Kachirayil and Abdullah Abou Ali.
Various sections benefitted from the reviews and inputs of Michael Taylor, Imen Gherboudj, Mohammed
Nababa, Gerardo Escamilla, Sonia Rueda and Toshimasa Masuyama (IRENA), and Keiji Kimura (Renewable
Energy Institute).
IRENA is grateful for the generous support of the Ministry of Economy, Trade and Industry of Japan, which
made the publication of this report a reality. Masaomi Koyama, director of international affairs at the ministry’s
energy efficiency and renewable energy department, provided valuable input.

Available for download: www.irena.org/publications

For further information or to provide feedback: info@irena.org

2
Contents
    KEY FINDINGS                                                                        5

1   NATIONAL CONTEXT FOR RENEWABLE ENERGY AUCTIONS                                      6
     1.1 Japan’s energy and electricity sectors                                          7
     1.2 D
          rivers of renewable energy deployment                                         8
     1.3 Renewable energy policy and regulatory frameworks in the electricity sector    9

2   RENEWABLE ENERGY AUCTION RESULTS                                                    14
     2.1 Bidder participation and competition                                          15
     2.2 Price outcomes                                                                 17

3   FACTORS AFFECTING AUCTION PRICE RESULTS                                             20
     3.1 C
          ountry-specific conditions                                                   22
     3.2 Investor confidence and learning curve                                        24
     3.3 Policies supporting renewables                                                25

4   AUCTION DESIGN                                                                      26
     4.1 Auction demand                                                                 27
     4.2 Q
          ualification requirements and documentation                                  29
     4.3 W
          inner selection and contract award process                                   30
     4.4Risk allocation and remuneration of sellers                                    32

5   CONCLUSIONS                                                                        34

    REFERENCES                                                                          37
FIGURES                                                        ABBREVIATIONS
Figure 1. Generation mix in Japan (TWh), 2010-2018 8           CCGT Combined cycle gas turbine
Figure 2. Renewable installed capacity (GW),                  COD    Commercial operation date
           2010-2019                                      10   EIA    Environmental impact assessment
Figure 3. S
           olar PV FiTs project size eligibility              EPC 	Engineering, procurement and construction
          criteria and tariffs                            11   EPCo Electric power company
Figure 4. Undersubscription in                                FiT    Feedin tariff
           Japan’s biomass auctions                       16   GDP    Gross domestic product
Figure 5. Auctioned, registered, qualified,                   IPP    Independent power producer
           participating, awarded and contracted               JPEA 	Japan Photovoltaic Energy Association
           bids in solar PV auctions in Japan             17   JPY    Japanese yen
Figure 6. Project size and bid price of                       kWh    Kilowatt hour
           awarded projects in the fourth auction         19
                                                               kWp    Kilowatt peak
Figure 7. Solar auction results in Japan                      LCOE Levelised cost of electricity
           compared to other OECD countries               19
                                                               METI 	Ministry of Economy,
Figure 8. Factors affecting auction price results         21          Trade and Industry (Japan)
Figure 9. Utility-scale solar PV weighted-average             MJ     Megajoule
           LCOE trends in Japan, 2011-2019                22   O&M Operation and maintenance
Figure 10. Breakdown of utility-scale solar PV total          OCCTO 	Organisation for CrossRegional
            installed costs in selected countries, 2019   23          Coordination of Transmission operators
Figure 11. Solar irradiation in Japan                     24   OECD 	Organisation for Economic
Figure 12. IRENA’s framework                                         Cooperation and Development
            for the design of auctions                    27   p.a.   Per annum (per year)
Figure 13. Solar PV auction results in Japan                  PPA    Power purchase agreement
            compared to LCOEs and FiTs                    31   PV     Photovoltaic
                                                               RPS    Renewable portfolio standard
TABLES                                                         TWh Terawatt hour
                                                               USD    US dollar
Table 1. Results of the first five rounds
          of solar auctions in Japan                      18   WACC Weighted average cost of capital

BOXES
Box 1. Biomass auctions in Japan                          16
                                                               PHOTO CREDITS
Box 2. Zone-specific auctions for offshore wind           28
Box 3. Strict compliance rules                                 ages 13, 15: Shutterstock
                                                               P
        in the first solar PV auction                     32   Pages 7, 12, 29, 30, 36: Freepik
Key findings
• In 2017, with the feed in tariff (FiT) scheme          • Relatively  high auction prices do not
    becoming increasingly fiscally unsustainable,         necessarily tarnish an auction’s success. The
    Japan introduced renewable energy auctions.           average awarded prices were close to the
    As of October 2020, Japan had conducted               cost of electricity for solar PV power in Japan,
    five solar photovoltaic (PV) and two biomass          underscoring the price discovery attributes of
    auctions, and launched a zone-specific offshore       auctions. At the same time, resulting prices
    wind auction in June 2020. A feed in premium          were close to the auctions’ ceiling prices,
    (FiP) scheme was announced in 2020 to be              suggesting that higher competition, if issues
    introduced in 2022.                                   causing undersubscription in various rounds
                                                          were addressed, could potentially drive prices
• The five solar PV auctions have awarded almost          further down.
    one-third of the originally announced volumes
    (574 megawatt (MW) awarded out of a total            • The  main factor behind the high cost of
    1,663 MW auctioned). In addition, no biomass          generation of solar power in Japan is the
    project has yet been contracted through               relatively high installation and building cost,
    renewable energy auctions.                            as well as the cost of modules and inverters.
                                                          Risk perception can also explain high prices.
• The challenge in solar PV auctions has mainly           In Japan, developers must factorin the risk of
    been in retaining qualified bidders, as many
                                                          high curtailment rates without compensation
    dropped out during the process. Developers
                                                          and grid connection uncertainties.
    indicated that constraints regarding grid
    connection and land availability, as well as         • In the Japanese context, economies of scale
    strict bond confiscation rules in the first round,    due to grid connection and land availability
    reduced their interest in placing bids.               constraints do not play a major role.
                                                          Consequently, the increased participation of
• At the solar PV auctions, average awarded               small and new players in the fourth and fifth
    prices fell by more than 35% between
                                                          rounds did not prevent prices from falling.
    the first and fifth rounds. The first saw
    a weighted average awarded price of                  • Many  of the challenges that Japanese
    JPY 19.64 (Japanese yen)/kilowatt hour                auctions have faced can be tackled through
    (kWh) 1 (USD [US dollar] 174/ megawatt hour           auction design elements that go beyond
    [MWh]) in November 2017, while the fifth saw          price reduction. These elements can focus
    an average awarded price of JPY 12.57/kWh 2           on: smoother gridintegration of renewables,
    (USD 115/MWh) in January 2020. Yet solar PV           ensuring timely project completion, and/or
    prices in Japan are still higher than the global      supporting a just and fair energy transition.
    average, which was USD 56/MWh in 2018. Solar
    PV prices in Japan are also high compared to
    those achieved in other countries with similar
    macro-economic conditions and level of
    development of the solar PV energy sector.

1
    JPY 1 = USD 0.00886 in November 2017.
2
    JPY 1 = USD 0.00915 in January 2020.

                                                                                                            5
1   National context
     for renewable
    energy auctions

6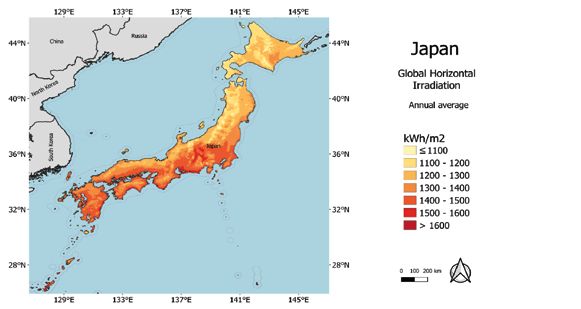
Renewable energy has yet to make a significant                        To meet its energy demand, Japan relies mainly on
dent in Japan’s energy and power mixes, which                         fossil fuels, which provided more than 95% of the
rely mainly on fossil fuels. The events at the nuclear                total primary energy supply in 2018 (METI, 2020a).
power plant in Fukushima following the 2011                           With almost negligible domestic production of
earthquake and tsunami marked a fundamental                           fossil fuels, Japan depended on imports for 99.7%
shift in Japanese energy policy into one where                        of its oil, 99.3% of its coal and 97.5% of its natural
renewables should assume a more important role.                       gas needs in 2018 (METI, 2020b).
Although a FiT scheme initially fuelled rapid                         Electricity represented almost a third (30%) of the
renewable energy deployment, this soon became                         country’s TFEC in 2018 (METI, 2020a). This is a
fiscally unsustainable. Since 2017, therefore, Japan                  considerably higher share than the global average
has opted for auctions as the key policy instrument                   of 21.8% in 2017 (UNSD, 2020a). Historically,
driving the national transition to renewables.                        nuclear energy generated up to one-third of
                                                                      Japan’s power. Following the 2011 Great East
1.1 J APAN’S ENERGY AND                                              Japan Earthquake, however, and the consequent
    ELECTRICITY SECTORS                                               accident at the Fukushima Daiichi nuclear power
Japan is the fifth largest energy supplier and                        plant, all nuclear power plants were shut down
consumer in the world (UNSD, 2020a). Per capita                       and only a small number have re-opened since.
total final energy consumption (TFEC) peaked in
2002, but it has decreased ever since to levels from
three decades ago, despite economic growth.3
In fact, per capita TFEC in 2018 was below that
of 1990 (UNSD, 2020a; UN DESA, 2020; METI,
2020a). The main reason behind this is Japan’s
emphasis on energy efficiency, with a myriad of
policies and measures having been implemented
since the 1970s and up to 2019 (IEA, 2019).
Accordingly, its energy intensity improved by
more than 29% over the 2000-2018 period, from
4.8 megajoules (MJ)/USD4 to 3.4 MJ/USD (UNSD,
2020b; World Bank, 2020).

3
     Japan’s gross domestic product (GDP) has grown every year since 2012, albeit at slow rates. Moreover, Japan is the world’s
    fourth largest economy. IRENA’s forthcoming report Socio-economic footprint of the energy transition: The case of Japan
    explores these topics in detail.
4
     USD purchasing power parity (PPP), constant 2017.

                                                                                                                                  7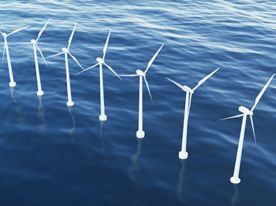
Even though most of that nuclear capacity             Paris Agreement. This placed environmental
                             has been replaced by fossil fuels, since 2011,        concerns at the heart of the country’s renewable
                             renewables have assumed a growing role in             energy plans.
                             electricity generation. The share of renewables       Japan is currently on track to reach this
                             in the generation mix increased from around 10%       emissions goal: emissions from the power
                             in 2010 to 16% in 2018 (Figure 1). Nevertheless,      sector in 2019 were 3% lower than they were
                             this share was still much lower than the global       in 2010. But the power sector still accounts for
                             average of 25% in 2018 (IRENA, 2020a).                about 40% of total emissions, with these peaking
                                                                                   in 2013, as fossil fuels replaced nuclear power.
                             1.2 DRIVERS OF RENEWABLE
                                                                                   Renewable energy, along with energy efficiency,
                                  ENERGY DEPLOYMENT
                                                                                   are thus now the main pillars of Japan’s efforts
                             The deployment of renewable energy in Japan has       to reduce emissions (IRENA, 2020b).
                             been driven by plans to diversify the electricity     Moreover, a heavy reliance on fossil fuels, which
                             mix, achieve environmental and socio-economic         are almost fully imported, has also meant a low
                             goals, and increase energy security.                  level of energy self-sufficiency in the country. This
                             In addition, events at the nuclear power plant in     level fell, in fact, from 20% in 2010 to just 9.6%
                             Fukushima following the 2011 earthquake and           in 2017 because of the nuclear phase out (METI,
                             tsunami marked an important turning point for         2020b). Renewables currently account for 70% of
                             Japan’s energy policy (Kucharski and Unesaki,         Japan’s domestic production of energy, with an
                             2017) and the diversification of the electricity      increase in renewable energy supply therefore able
                             mix. The first energy policy revision following       to help the country reach its energy self-sufficiency
                             these events, namely the 4th Strategic Energy         target. This goal is 24.3% by 2030 (METI, 2015).
                             Plan (2014), aimed to minimise dependency             In addition, the renewable energy industry is a large
                             on nuclear power and to accelerate the uptake         employer and source of income for the country. In
                             of renewables.                                        2019, the Japanese solar industry alone employed
                             At the same time, Japan pledged to reduce total       around 240 000 people at various links of the value
                             CO2 emissions by 26% between 2013 and 2030            chain. Because solar PV capacity additions in 2019
                             (METI, 2018) as part of its commitments to the        were almost half the volume of the year before, this

                             Figure 1. Generation mix in Japan (TWh), 2010-2018
                             1200

                         1000
                                                                                                                      Geothermal energy
                                                                                                                      Bioenergy
    Electricity generation

                             800                                                                                      Solar photovoltaic
                                                                                                                      Offshore wind energy
                                                                                                                      Onshore wind energy
            (TWh)

                             600                                                                                      Hydropower
                                                                                                                      (excl. pumped storage)
                                                                                                                      Other
                                                                                                                      non-renewable energy
                             400
                                                                                                                      Pumped storage
                                                                                                                      Nuclear
                                                                                                                      Natural gas
                             200                                                                                      Coal and peat
                                                                                                                      Oil

                                0
                                    2010     2011        2012   2013   2014      2015   2016      2017     2018
                             Source: IRENA (2020a)
                             Note: TWh = terawatt hour

8
was a reduction of 10 000 jobs from 2018 (IRENA, Electricity market structure and reforms
2020c). The deployment of other technologies Market liberalisation efforts have fostered a
such as biomass, wind and geothermal can also friendlier environment for renewables in Japan.
add economic value, create jobs, and reinforce These efforts began in 1995, with the liberalisation
the country’s position as a leader in technological of power generation, allowing independent power
advancement and innovation export. producers (IPPs) to compete with the then
Finally, renewables can help reduce the power vertically integrated electric power companies
system’s costs by 2030. Indeed, falling costs and (EPCos). Following reforms in 2000, 2005 and
more mature technologies have already placed 2008 that fostered retail competition and third-
renewables as the lowest-cost source of power party access rules, the Act for Partial Revision
generation in many countries (IRENA, 2020d; of the Electricity Business Act was passed in
IRENA, 2019a). While coal and combined cycle 2013 with three objectives: 1) to secure a stable
gas turbine (CCGT) are still cheaper generation electricity supply; 2) to reduce electricity rates;
sources than renewables in Japan, the levelized and 3) to expand choices for consumers and
cost of electricity (LCOE) of solar PV decreased by business opportunities.
64% from 2011 to 2019, and could decrease another The reform was designed to be implemented
62% by 2030 (IRENA, 2020d; IRENA, 2019a; IRENA in three stages. First, in 2015, the Organization
Renewable Costs Database). Furthermore, policy for Cross-regional Coordination of Transmission
makers aim to bring the generation cost of solar Operators (OCCTO) was established, as the 10
PV down from JPY 16.9/kWh (USD 153/MWh)5 in EPCos had done little to coordinate supply and
2018, to JPY 7/kWh (USD 64.1/MWh)6 by 2025. demand across their borders. One example of
This would imply a 59% reduction in cost (IRENA, this was power being transmitted at different
2019a; METI, 2019b). frequencies (The Economist, 2020) in different
regions. Second, in 2016, full retail competition
1.3 RENEWABLE ENERGY
was enforced. Lastly, complete legal unbundling
POLICY AND REGULATORY
between generation, transmission and distribution
FRAMEWORKS IN THE
activities was implemented in April 2020. Beyond
ELECTRICITY SECTOR
market liberalisation, an enabling environment
National plans and targets for renewables has also been put in place to support the
The 4th Strategic Energy Plan of 2014 represented development of the renewable energy sector in
a fundamental shift in Japanese energy policy Japan, including renewable portfolio standards,
into one where renewables should assume a more feed-in-tariffs and more recently, auctions.
important role. In July 2015, the Long-term Energy
Renewable portfolio standard from 2003 to 2012
Supply and Demand Outlook was approved, which
The first measure Japan used to promote
defined renewable energy targets of 13% to 14%
renewables was a renewable portfolio standard
in primary energy supply and 22% to 24% in the
(RPS). Introduced in 2003, this mandated
power mix by 2030 (METI, 2015).
generation targets for renewables (excluding
The 5th Strategic Energy Plan of 2018 set energy
large hydro). It has been difficult to assess the
policy objectives of ensuring, first and foremost,
effectiveness of the RPS, however, as it allocated
stable supply (energy security), while achieving
high risks to developers (Ito, 2015).
low costs by enhancing efficiency (economic
efficiency), but also safeness (safety). At the Administratively set tariff from 2009 to 2021
same time, the plan calls for maximum efforts In 2009, the first FiT was introduced to remunerate
to pursue environment suitability (environment). excess solar production fed into the grid. That
In keeping with this, renewables are set to play a programme was expanded in 2012 (the “FiT
more important role in achieving these priorities Act”) to cover all solar generation – not only the
(METI, 2018). The renewable energy targets, excess – as well as hydro projects below 30 MW
however, have not been updated (METI, 2020b).
5
1 JPY = 0.009059 USD (average 2018)
6
1 JPY = 0.009159 USD (average 2019 until September 10)
National context for renewable energy auctions 9in size, wind, geothermal, biomass and any other Solar PV FiTs
sources recognised as renewable by the Japanese The success of the FiT programme was largely
cabinet. The FiT Act replaced the RPS. 7 attributed to the attractive rates offered, which
The expanded FIT scheme of 2012 had been the were typically more than twice as high as those
main policy instrument promoting renewables in offered in Germany, Italy, or the UK (METI, 2012;
Japan. It resulted an annual renewable capacity Campoccia et al., 2014). Nevertheless, to adapt to
growth rate of 22% by 2017 since it was introduced, changing market dynamics, the tariff was revised
compared to 5% under the RPS and 9% under the downwards on a yearly basis, while the eligibility
first FIT scheme (METI, 2019d). Between 2010 criteria, based on different project sizes, also
and 2019, the renewable capacity (excluding changed. Importantly, starting in 2017, projects
large hydro) expanded 2.7-fold (Figure 2) and that exceeded the project size eligibility criteria
the renewables share in the power mix (excluding had to enter the auction scheme. Moreover,
large hydro) increased from 2.5% in 2010 to 9.1% the changes in eligibility criteria and FiTs made
in 2018 (see Figure 1). Strong growth of solar PV the year in which a developer was certified an
generation, which surged from 0.3% to 6% in the important factor. For instance, a 0.2 MW solar PV
generation mix, led this increase. In fact, solar plant would have received a FiT of JPY 40/ kWh 8
projects have accounted for around 90% of the (USD 500/MWh) in 2012, but only JPY 14/kWh 9
added capacity since 2012, placing Japan as the (USD 128.8/MWh) in 2019. Figure 3 shows how
second country in the world by solar capacity the eligibility criteria, based on project size, has
and the third in solar generation (IRENA 2020a; changed following the introduction of auctions.
METI, 2017; IRENA, 2019b), followed by bioenergy. By 2020, for example, only projects below
250 kW were eligible for the FiT, and the rest
had to participate in an auction. Furthermore,
the figure shows how the FiT prices have been
reduced over time.
Figure 2. Renewable installed capacity (GW), 2010-2019
100
Renewable energy installed capacity
80
60
(GW)
Geothermal energy
40 Bioenergy
Solar photovoltaic
Offshore wind energy
20 Onshore wind energy
Hydropower
(excl. pumped storage)
0
2010 2011 2012 2013 2014 2015 2016 2017 2018 2019
Source: IRENA (2020a)
7
See the Act on Special Measures Concerning Procurement of Electricity from Renewable Energy Sources by Electricity Utilities
(Japanese Cabinet, 2011).
8
1 JPY = 0.0125 USD in 2012.
9
1 JPY = 0.0092 USD in 2019.
10Figure 3. Solar PV FiTs project size eligibility criteria and tariffs
No limit
Project size
2
(MW)
1.5
1
0.5
No limit
0
2012 2013 2014 2015 2016 2017 2018 2019 2020
45
Project size
2
(MW)
40
1.5
35
1
(JPY/kWh)
Fit prices
30
0.5
25
0
20 2012 2013 2014 2015 2016 2017 2018 2019 2020
15
45
10
40 2012 2013 2014 2015 2016 2017 2018 2019 2020
35 Less than 10 kW More than 10 kW
More than 10 kW, but less than 2 MW More than 10 kW, but less than 250 kW
(JPY/kWh)
Fit prices
30 More than 250 kW, but less than 500 kW More than 10 kW, but less than 50 kW
More than 50 kW, but less than 250 kW Auctions
25
20
15
10
2012 2013 2014 2015 2016 2017 2018 2019 2020
Less than 10 kW More than 10 kW
More than 10 kW, but less than 2 MW More than 10 kW, but less than 250 kW
More than 250 kW, but less than 500 kW More than 10 kW, but less than 50 kW
More than 50 kW, but less than 250 kW Auctions
Source: METI (2020c)
Note: The FiTs depicted for less than 10 kW are those without double power generation and from 2015 to 2019, with no
obligation to install equipment for output control. Double power generation systems combine residential PV system
and fuel cells.
National context for renewable energy auctions 11Bioenergy FiTs FiTs Programme costs
Unlike solar PV, the FiTs for bioenergy have With the certified volumes of both solar
remained relatively constant. For instance, solid PV and bioenergy technologies increasing
biomass plants smaller than 10 MW have received significantly – and despite the tariff decline for
JPY 24/kWh 10 (USD 300/MWh) regardless of solar PV -, planners realised that the annual
the year of certification, but different FiTs have purchase cost of the FiT scheme would reach
applied to other biomass technologies according JPY 3.6 trillion 11 (USD 33 billion) by 2019, which
to the project size. Overall, certified FiT biomass would almost have reached the targeted yearly
installed capacity, including liquid biofuels, cost of JPY 3.7 trillion to JPY 4 trillion for the
accounted for 10.9 GW as of June 2019, though year 2030 (METI, 2018).
a large part of this was not operating. Notably,
these figures have increased sharply since 2016,
with 4.5 GW having been certified since.
10
1 JPY = 0.0125 USD in 2012.
11
JPY 2.4 trillion net, that is, after fuel savings (METI, 2020b).
12Hence, even though significant amounts of Moreover, the FiT scheme in general offers fixed
renewable capacity have been added, this has prices to generators with no price signals, giving
been achieved at a relatively high cost. Indeed, them little incentives to produce electricity when
one of the main challenges of a FiT scheme most needed. Although for solar PV, the bulk
is to set an adequate tariff level in a rapidly of generation coincides with periods of peak
changing environment (IRENA and CEM, 2015). demand, especially in summer, more provisions
Furthermore, between a quarter and more can be considered for increased renewable
than a half of the projects that were approved energy deployment. A system in which
during 2012 (23%), 2013 (49%) and 2014 (59%), renewables’ generators could help manage
had not been implemented by the end of 2018. supply-demand balances was thus considered
Among the main causes for delayed FiT project necessary (REI, 2019).
implementation were a missing mandatory Consequently, policymakers in Japan explored
time frame and grid connection difficulties. As alternatives to deploy renewables more
a result, the government announced a legislative competitively, in a timely manner and addressing
change for projects that had not come online system’s needs. They chose to adopt auctions,
by a deadline. This reduced FiT support to JPY which can be designed in a way that eases the
21/ kWh or less, instead of initial price (Sheldrick integration of renewable energy (see Chapter 3
and Tsukimori, 2018) of IRENA, 2019c) and ensures timely project
completion (see Chapter 2 of IRENA, 2019c).
In 2020, a feed-in-premium (FiP) scheme was
announced. It will be introduced in 2022, in
addition to FiT scheme.
National context for renewable energy auctions 132 Renewable energy
auction results
14Auctions have the potential to support Japan’s inclusive energy transition. IRENA’s study
objectives given their following strengths: Renewable Energy Auctions: Status and Trends
Beyond Price highlights design elements that
• Through a power purchase agreement (PPA), can support such objectives (IRENA, 2019c).
auctions can provide stable revenues for
developers and thus certainty regarding price – In 2016, the FiT Act was revised to enhance
as a FIT does – while also committing quantities competition in the market and reduce prices,
to help policy makers achieve renewable with Japan’s first renewable energy auctions then
targets, which is comparable to an RPS. announced (METI, 2017).
• Their ability to discover real prices, if designed 2.1 B
IDDER PARTICIPATION
to achieve that objective, can help deploy
renewables in a cost-effective fashion. AND COMPETITION
As of October 2020, Japan had conducted five
• Auctions are flexible in design and can help solar PV auctions and two biomass auctions.
achieve broader policy objectives. Indeed,
renewable energy auctions are increasingly Moreover, it had plans to conduct an offshore
being used around the world to achieve wind auction. Box 1 discusses the results of the
objectives beyond price, including timely biomass auctions to date, while the rest of this
project completion, the integration of variable report focuses on auctions for solar PV.
renewable energy, and supporting a just and
15BOX 1. BIOMASS AUCTIONS IN JAPAN
As of October 2020, Japan had conducted two biomass auctions. The first of these took place in late
2018 and had two demand bands: 180 MW for solid biomass projects of 10 MW and above; and 20 MW
for liquid biomass, without project size limits.
This auction attracted developers, as the registered volumes far exceeded the demand targets. Solid
biomass developers registered seven business plans for a total of 264 MW, while liquid biomass developers
registered 26 business plans for 169 MW. Thus, the registered capacity exceeded the auctioned volumes
by almost a half (47%) and more than eight-fold (845%), respectively.
However, only 95 MW (four business plans) in solid biomass and 10.5 MW (five business plans) in liquid
biomass met the qualification requirements. In addition, only one developer in each demand band
submitted a bid: for 35 MW solid biomass at JPY 19.6/kWh 12 (USD 178.4/MWh) and 2.3 MW liquid biomass
at JPY 23.9/kWh (USD 217.5/MWh). Since the latter bid was higher than the ceiling price of JPY 20.6/kWh
(USD 187.5/ MWh) – a price which applied for both bands – only the solid biomass band awarded its single
bid. Yet the awarded bidder did not pay the commitment bond and no bid was ultimately contracted.
Despite these outcomes, biomass continued deploying strongly (see Figure 2) under a FiT scheme
that offered JPY 24/kWh (USD 220.8/MWh) for smaller installations in 2018 and 2019. In an effort to
discover competitive prices for large projects, Japan conducted a second biomass auction in late 2019.
This time, however, it merged the two demand bands into one. In other words, solid and liquid biomass
projects competed for the same target volume of 120 MW. Only 83% of the volume to be auctioned was
registered (20 business plans for 101 MW) out of which only four business plans for 6.4 MW qualified.
The participation rate was higher, though, as only one qualified bidder dropped out (leaving 4.5 MW
participating). In the end, the three bids were above the ceiling price of JPY 19.6/kWh 13 (USD 180/MWh)
and no bid was awarded.
In sum, to date, no biomass project has been contracted in Japan through renewable energy auctions
(Figure 4). The first outcomes suggest that the qualification requirements were either too strict, or that
there is room for improvement in communicating business plan expectations to the developers.
Other elements, which may also be affecting the performance of solar PV auctions, are discussed in
the following sections. These include the continuation of an attractive FiT scheme that can discourage
participation in auctions, strict bond confiscation rules, or the role of (undisclosed) ceiling prices in low
competition environments.
Figure 4. Undersubscription in Japan’s biomass auctions
300 30
250 26 25
200 20 20
Capacity
(MW)
Bids
(#)
150 15
100 10
7
50 5 4 5
4
3
0 1 1 1 0
First biomass solid First biomass liquid Second biomass
(solid and liquid)
Auctioned capacity Registered capacity Qualified capacity Number of bids
Participating capacity Awarded capacity Contracted capacity
Source: METI (2019c)
12
1 JPY = 0.0091 USD in 2018.
13
1 JPY = 0.0092 USD in 2019.
16The first five rounds of solar PV auctions succeeded 2.2 PRICE OUTCOMES
in attracting bidders initially, but participation
Five solar PV auctions took place between
was deterred further along in the process.
November 2017 and January 2020. The volumes
Figure 5 shows auctioned, registered, qualified,
auctioned and awarded, as well as the average
participating, awarded and contracted bids in
price and price ceilings for each round are shown
solar PV between 2017 and 2020. The first five
in Table 1.
rounds attracted a large number of participants,
The first auction awarded 141 MW at an
with 29, 19, 38, 146 and 110 bids registered,
average awarded price of JPY 19.64/kWh
respectively, and the majority of those bids
(USD 174.1/ MWh) 14. The second auction, held in
were qualified. In fact, in the second, third and
September 2018, awarded no capacity, as the bids
fourth rounds, the capacities of the qualified bids
were above the ceiling price (see Section 4.3). The
exceeded the volumes auctioned (corresponding
third auction, held in December 2018, awarded
to 15, 32 and 107 bids, respectively). Even in the
197 MW at JPY 15.17/kWh (USD 135/MWh)15, while
first auction, qualified bids (23) corresponded
the fourth, in September 2019, awarded 196 MW
to almost 80% of auctioned volume. However,
at JPY 12.98/kWh (USD 123/MWh) 16. Finally, the
only 9, 9, 16, 71 and 72 bids were placed after
fifth auction, held in January 2020, awarded
qualifying. As a result, the first, second, fourth
39.8 MW at JPY 12.57/kWh (USD 115/MWh) 17.
and fifth rounds were undersubscribed, with
participating capacity below auctioned capacity. Interestingly, while prices continued falling in
the fourth and fifth rounds, at the same time,
As shown in Figure 5, although the auctions
there was an increased participation by small
succeeded at attracting bidders initially,
and new players. Indeed, many winners were
design elements —including strict qualification
not established market players, suggesting that
requirements, selection criteria, and compliance
experience is not a determining factor in winning
rules (discussed in Chapter 4) – may have deterred
an auction in Japan.
participants further along in the process. This was
likely coupled with difficulties in securing land
and grid access (Section 3.3).
Figure 5. Auctioned,
registered, qualified, participating, awarded and contracted bids
in solar PV auctions in Japan
800 160
146
600 120
110
107 88
Capacity
(MW)
Bids
(#)
400 80
71 72
63
200 40
38
29 32 27
23 19
9 9 15 9 16
0 7 6
0 4 0
1st auction 2nd auction 3rd auction 4th auction 5th auction
Auctioned capacity Registered capacity Qualified capacity Number of bids
Participating capacity Awarded capacity Contracted capacity
Source: METI (2019c); Bellini (2019a, 2019b, 2020); Publicover (2017, 2018); Matsuda et al. (2018); GIO (2019a, 2019b);
BNEF (2019); Kageyama (2018a, 2017a)
Note: The contracted capacities for the fourth and fifth rounds were unknown as of June 2020.
14
JPY 1 = USD 0.008866 (November 2017).
15
JPY 1 = USD 0.00892 (December 2018).
16
JPY 1 = USD 0.00945 (September 2019).
17
JPY 1 = USD 0.009229 (January 2020).
Renewable energy auction results 17Table 1. Results of the first five rounds of solar auctions in Japan
Volume Volume Weighted average
Date Ceiling price
auctioned awarded awarded price
Round 1 JPY 19.64/kWh JPY 21/kWh
500 MW 141 MW
Nov. 2017 (USD 174.1/MWh) (USD 186/MWh)
Round 2 JPY 15.5/kWh
250 MW 0 MW -
Sept. 2018 (USD 138.3/MWh)
Round 3 JPY 15.17/kWh JPY 15.5/kWh
197 MW 197 MW
Dec. 2018 (USD 135/MWh) (USD 138.3/MWh)
Round 4 JPY 12.98/kWh JPY 14/kWh
300 MW 196 MW
Sept. 2019 (USD 123/MWh) (USD 131.9/MWh)
Round 5 JPY 12.57/kWh JPY 13/kWh
416 MW 40 MW
Jan. 2020 (USD 115/MWh) (USD 119/MWh)
Total 1,663 MW 574 MW
Source: METI (2019c)
Figure 6 shows the project size and bid price of All in all, despite a price decrease by one-third
the projects awarded in the fourth auction: the from the first to the fifth auction, the average
majority of the projects below 2 MW – the size winning bids were still high compared to other
limit in previous rounds – bid lower than the four countries with similar context (income, resources
projects above 20 MW. The lowest bids – as low and level of development of the renewable energy
as JPY 10.5/kWh (USD 99/MWh) – were all for industry) (Figure 7).
projects below 2 MW, implying that economies Comparing auction prices between countries must
of scale do not seem to play a major role in be done with caution, however, as these depend
the Japanese context. This is mainly due to on many context-specific factors, including solar
the difficulty of securing land and obtaining resource quality, local supply chain maturity,
grid-connection permits – factors which mostly macro-economics, developer experience and
impact large-scale projects (BNEF, 2019). In fact, preferences, investor confidence, electricity
large solar PV projects (above 40 MW) will be sector regulations and broader energy policies,
subject to stricter environmental assessment as well as auction designs. Thus, an international
rules (IT Media, 2019). price comparison does not determine an auction’s
In the fifth round, all the awarded projects success. To determine this, a deeper analysis
ranged between 792 kW and 2 MW. This may of the factors impacting solar prices is needed.
have contributed to a significant drop in capacity This would have to include: understanding
allocation, however, with a total of less than what best practice is in terms of total installed
40 MW awarded out of the 416 MW auctioned. costs; capacity factors driven by the choice of
Initially, 450 MW had been planned, with some technology and local resource quality; operation
of the capacity not awarded in the fourth round and maintenance (O&M) costs; and the cost of
being rolled over. Importantly, the prevalence capital for renewable projects – which in turn
and competitiveness of plants below 2 MW is can be influenced by policy. In addition, auctions
related to the requirement of appointing a are increasingly adopted with the objective of
dedicated chief electrical engineer above that achieving complementary development goals,
project size, which raises costs significantly in addition to electricity price reduction.
(see Section 3.1).
18Figure 6. Project size and bid price of awarded projects in the fourth auction
14
13
(JPY/kWh)
Bid price
12
11
10
0 2 10 20 30 40
Project size
Source: GIO (2019c). (MW)
Figure 7. Solar auction results in Japan compared to other OECD countries
200
180
160
140
120
(USD/MWh)
Price
100
80
60
40
20
0
December 2016 June 2017 January 2018 July 2018 February 2019 September 2019 March 2020
Japan Australia Canada France Germany
Greece Israel Mexico Netherland Poland
Source: IRENA (n.d.); BNEF (2019); METI (2019c); Bellini (2020)
Renewable energy auction results 193 Factors affecting
auction price
results
20The relatively high auction prices in Japan do of finance, land and labour; 2) the degree of
not necessarily tarnish an auction’s success, as investor confidence related to, for example,
much depends on the relative competitiveness of the experience of the bidder and auctioneer,
the options available. In fact, renewables are not and credibility of the off-taker; 3) other policies
the only expensive power generation sources in related to renewable energy, including clear
Japan; the country has also some of the world’s targets, grid policies, priority dispatch, and
costliest coal-fired and CCGT generation (IEA local content rules; and 4) the design of the
and NEA, 2015). That said, a combination of auction itself, taking into consideration the
factors drives prices in any country’s renewable trade-offs between obtaining the lowest price
energy auctions. and achieving other objectives (Figure 8).
These can be grouped into four categories: The first three categories are discussed in this
1) country-specific conditions such as resource chapter, while Chapter 4 analyses the design
availability, the maturity of local supply elements of Japanese auctions and how they
chains, power market design and the costs have influenced results.
Figure 8. Factors affecting auction price results
Country-specific Investor confidence Policies supporting Auction
conditions and learning curve renewables design
· Potential of renewable · Credibility of the · Renewable energy Trade-off between lowest
energy resources off-taker and additional targets and national price and other objectives:
· Financing costs guarantees plans that provide a · Auction demand
· Installation and · Presence of a stable and trajectory for the sector (auctioned volume,
building costs enabling environment · Fiscal and financial off-taker, regularity
(land, labour, that is conducive to incentives for RE of auctions)
energy, etc.) market growth projects · Qualification
· Ease of access · Past experience with · Grid access rules requirements
to equipment auctions for both · Risk mitigation · Winner selection
· Foreign exchange auctioneer and instruments method and criteria
rates developers · Policies to promote · Risk allocation
· General fiscal · Clarity and transparency broader development (compliance rules,
legislation of auction objectives (incl. socio- distribution of financial
documentation* economic benefits and and production risks)
and project bankability industrial development)
Price resulting from an auction
Source: IRENA (2019c)
213.1 C
OUNTRY-SPECIFIC inverters) and of installation in Japan, whereas
CONDITIONS ‘soft costs’ were relatively competitive compared
to international benchmarks (Figure 10).
Cost of electricity for solar PV
Cost of equipment. In Japan, the average cost
Figure 9 shows the utility-scale solar PV of modules and inverters is significantly higher
weighted-average LCOE trends in Japan and than in comparable markets. This can partly
other selected countries 18 between 2010 and be explained by the preference for higher-cost
2019. Although the Japan’s LCOE declined by locally manufactured products. Indeed, half
64% from 2011 to 2019, it was still the highest in of all modules and almost threequarters of all
the sample. In fact, between 2018 and 2019, the inverters installed were produced by domestic
LCOE in Japan declined only 4%, the lowest rate manufacturers (Höller et al., 2019). Although
observed among the markets analysed. The LCOE these are of higher quality and require less
of newly commissioned utility-scale solar PV in maintenance in the long run, locally sourced
Japan was twice as high as that of India’s and modules and inverters are associated with higher
was more than twice the global weighted-average upfront costs (Kimura and Zissler, 2016).
LCOE of USD 0.068/kWh (IRENA, 2020d).
More recently, and even though average yearly
High total installed costs are considered the module prices between 2013 and 2019 declined
main factor behind the high prices resulting by 53% in Japan (IRENA, 2020d), Japanese
from solar auctions. 19 The data for Japan suggest manufacturers have not kept pace with decreasing
that at USD 2 070/kW, the total installed costs module prices around the world. Consequently,
of newly commissioned utility-scale solar PV developers have noted the increasing difficulty,
projects in 2019 were more than twice the from an economic perspective, of using modules
global average (USD 995/kW). Compared to produced in Japan. In fact, the share of imported
Germany and France, which had total installed modules and inverters has been increasing on a
costs for new projects in 2019 of USD 899/kW yearly basis and the share of the domestic market
and USD 979/ kW, respectively, the gap is even is expected to continue shrinking in the future
larger (IRENA, 2020d). This is predominantly (Kimura, 2019). However, this has done little so
due to the high cost of equipment (modules and far to reduce average module and inverter costs.
Figure 9. Utility-scale solar PV weighted-average LCOE trends in Japan, 2011-2019
Utility-scale solar PV weighted-average LCOE
0.6
(2019 USD/kWh)
0.4
-64%
0.2
0.0
2010 2019
Source: IRENA (2020d)
18
Australia, China, France, Germany, India, Italy, Netherlands, Republic of Korea, Spain, Turkey, Ukraine, United Kingdom, United
States and Viet Nam
19
It must be said that installed cost data for Japan are difficult to obtain.
22Figure 10. Breakdown of utility-scale solar PV total installed costs in selected countries, 2019
2 117
2 070
2 000
Utility-scale solar PV total installed costs
1 500
1 404
1 321 1 312
(2019 USD/kWh)
1 255 1 252 1 238 1 236
1 221
1 158
1 018 996
1 000 979
921 899
830
794
618
500
0
Russian Federation
Japan
Canada
South Africa
Argentina
Brazil
Republic of Korea
Mexico
Australia
United States
Indonesia
United Kingdom
Saudi Arabia
France
Turkey
Germany
Italy
China
India
Hardware Installation Soft costs
Modules Mechanical installation Margin
Inverters Electrical installation Financing costs
Racking and mounting Inspection System design
Grid connection
Permitting
Cabling/wiring
Incentive application
Safety and security
Monitoring and control Customer acquisition
Source: IRENA (2020d).
Installation costs. For a variety of reasons, Finally, perhaps the most relevant cost component
installation costs for solar PV in Japan are is the mandatory appointment of a chief electrical
significantly higher than in other countries. First, engineer, which accounts for 50% of the O&M
Japan is mountainous and its population density costs. Under Japan’s Electricity Business Act,
is high, which increases the costs of building solar 50 kW or above solar PV plants must appoint a
(and wind) plants compared to flat or empty chief electrical engineer. Importantly, 2 MW or
lands (The Economist, 2020). Moreover, the above plants must in general appoint a dedicated
installation process takes longer and international engineer, who cannot hold any position at another
best practice is not typically followed. As a result, power plant, nor be outsourced. This limitation
construction and installation time can be up to could explain the prevalence of projects below
seven times longer than in Germany, rendering 2 MW and the lower prices they offer. Given such
the process up to four times more expensive regulations, for a larger solar PV plant to make
(Kimura and Zissler, 2016). Second, the higher economic sense, its generation capacity would
costs may be linked to a shortage of skills and have to be at least 10 MW (Kimura, 2019).
a lack in the availability of human resources to Even though soft costs in Japan are competitive,
undertake such activities (Höller et al., 2019). there is still room for improvement to help achieve
Third, the installation costs significantly vary lower overall costs. Regarding system design,
according to the entity responsible for conducting for example, the type of contract can affect
the connection works. Normally, the developer solar PV costs. In Japan, it has been observed
pays the transmission or distribution companies that developers that outsource the engineering,
to conduct the power line installation. In the few procurement and construction (EPC) phase have
cases where this has been done by the developer, higher costs, as the EPC contractor demands
however, the costs have been significantly lower. a premium for bearing responsibilities and risks
Factors affecting auction price results 23during the construction phase. In contrast, when 1 365 kWh/kWp p.a. in south-western Cameroon
developers handle the design, procurement, and (World Bank, 2019a). Yet, the development of
construction of the plants themselves, they have solar PV projects in these locations, specifically
been able to optimise design arrangements and Hokkaido in the Northeast and Kyushu in the
operations (Kimura, 2019). South, presents great challenges, as they are far
Going forward, considerable cost reductions are from load centres and have limited grid capacity.
possible in Japan, if market scale and international
3.2 INVESTOR CONFIDENCE
best practices are unlocked. Indeed, solar PV costs
AND LEARNING CURVE
could decrease by two-thirds by 2030, mainly
driven by module/inverter and installation cost Credibility of the off-taker
reductions and a shift to best practice in mechanical The creditworthiness of Japanese public
and electrical installations (IRENA, forthcoming). utilities improved between 2012 and 2018,
If these significant cost reductions are achieved, when the World Bank’s Regulatory Indicators
solar PV could become the cheapest technology for Sustainable Energy (RISE) gave the country
for new plant deployment by 2030 (Kimura, 2019). the highest indicator score. This improvement
Resource availability occurred just in time for the utilities to be able to
shoulder the additional responsibilities allocated
Japan is not blessed with abundant solar
to them through the revision of the FiT act in
resources, as in arid and semi-arid regions (the
2016. Consequently, Japan’s counterparty risk
Middle East, North Africa, and North America).
assessment ranks among the best in the world
The country’s average annual global horizontal
(World Bank, 2019b) and is therefore not
irradiation ranges between 990 kWh/m2 and
considered a constraint.
1 660 kWh/m2. The highest levels (greater than
1 400 kWh/m2) fall on just 33% of the country’s Past experiences with auctions
total land area, which is mostly located in eastern Auctions were designed building on the FIT
and southern regions (Figure 11). The average scheme in which both the Japanese government
specific PV power output over these areas is and project developers already had considerable
1 372 kWh/kilowatt peak (kWp) per annum experience. Moreover, with five rounds of
(p.a.), which is comparable to the average of auctions, all the relevant stakeholders benefited
1 376 kWh/kWp p.a in northern Bangladesh or from a learning curve, especially developers
Figure 11. Solar irradiation in Japan
Source: World Bank (2019a)
Note: Copy in IRENA’s “Global Atlas for Renewable Energy” web platform.
Disclaimer: The boundaries shown in these maps do not imply official endorsement or acceptance by IRENA.
24that became familiar with the bidding process 3.3 POLICIES SUPPORTING
and were able to reuse some of the bidding RENEWABLES
documentation in subsequent rounds.
Renewable energy targets and national plans
Nevertheless, developers had little certainty
over medium- and long-term market prospects. Generally, Japan has a strong policy and regulatory
This constrained potential economies of scale in framework supporting renewables, compared
project development pipelines, as developers to the average high-income Organisation for
could not clearly anticipate how much volume Economic Cooperation and Development (OECD)
would be offered in upcoming auctions. This was a country (World Bank, 2018). Nevertheless, while
result of Japan conducting stand-alone auctions, Japan has defined targets for various renewable
for which it established volumes without showing energy sources, an increment of the energy mix
a long-term pathway. In fact, beyond 2018, there targets that go handinhand with long-term plans
was no clear outlook for auctions and the lack for systematic auctions and mid- and long-term
of a prospective bidding frame was identified transmission planning, are needed to support the
among developers as a main concern (Kimura, energy transition (REI, 2019).
2018; REI, 2019). To address this, a systematic
Grid access rules
auction scheme (see IRENA and CEM, 2015) is
Transmission companies struggle to cope with the
critical in improving investor confidence in Japan.
grid access needs of renewable developers, as
In such a scheme, volumes are announced for
their studies and reinforcement plans take longer
several years ahead -at least three to five years
than the actual construction of a renewable plant
would be needed in Japan-, in a multi-year plan
(REI, 2019). This results in constraints that raise
that also establishes the number of auctions (and
interconnection costs for new projects (Kenning,
volumes) in each year (Kimura, 2018; REI, 2019).
2020). Thus, network connection offers room
In 2018, Japan’s Ministry of Economy, Trade and
for improvement – particularly regarding grid
Industry (METI) took the first steps in tackling
access – as do planning and expansion indicators
this issue by announcing plans to schedule two
(World Bank, 2019b).
solar auctions (and one biomass auction) per year
(GIO, 2019a; GIO, 2019b; Matsuda et al., 2018). In fact, even though Japanese utilities are obligated
to accept grid connection requests, the cost is
Presence of a stable and enabling environment determined by them and fully allocated to the
Incorporating stakeholder feedback is another project developer (Matsubara, 2018). Notably, in
measure that can improve investor confidence. extreme cases, the grid connection cost can double
After 14 developers dropped out of the first the total cost of a project in Japan (Isono, 2019).
auction’s bidding stage (see Figure 5), the
Other instruments supporting renewables
Japan Photovoltaic Energy Association (JPEA)
investigated the reasons behind this result Other supporting policies can have direct and
through a survey among project developers. In indirect impacts on auction prices. The FiT
this survey, developers indicated that their main scheme, for instance, has allowed developers to
reasons for not participating in the auction were: obtain certification at generous tariffs and wait
difficulties securing land (26%); no available for the solar PV costs to decline before starting
system capacity (23%); the hard capacity limit operations, thereby maximising their profit margins.
(16%); and the strict confiscation requirements of This comes at a high cost for consumers and has
the commitment bond (26%) (Kageyama, 2017b). led to the labelling of renewables as “high cost”
Government bodies considered this input and sources in Japan (Kimura, 2018). Moreover, as
modified the auction design for further rounds. long as developers are allowed to hold on to early
Chapter 4 discusses at length these changes certifications and delay plant construction or
and their implications. operation, they will have less interest in participating
in an auction (see Section 2.1), thus hurting auction
participation rates and hindering their ability to
discover lower and more competitive prices.
Factors affecting auction price results 254 Auction design 26
The analysis of the Japanese auctions follows            technologies and ensure the diversification of the
IRENA’s framework (IRENA, 2019c; IRENA and               mix; and 2) they can support local industry, which
CEM, 2015), which classifies design elements             relies on the continued uptake of the technology.
into four main categories: 1) auction demand;            Additionally, this type of auction avoids the need
2) qualification requirements and documentation;         to compare different technologies with varying
3) winner selection and contract award process;          generation profiles.
and 4) risk allocation and remuneration of sellers       Yet technology-specific auctions also have
(Figure 12).                                             downsides. They can result in a reduced pool of
                                                         participants and, potentially, less competition
4.1 AUCTION DEMAND
                                                         (IRENA and CEM, 2015) – a major concern in
Product and technology specificity                       the Japanese context. Moreover, the technology
The product auctioned in Japan is power in the           supported might not necessarily be the most
form of installed capacity in MW. The country has        cost-competitive. For instance, in Japan, offshore
opted to conduct technology-specific auctions            wind, geothermal or hydropower might be more
for solar PV and biomass, with offshore wind             cost-competitive than solar PV. A technology-
launched in June 2020.                                   neutral auction would allow the discovery of the
                                                         most cost-competitive technology.
Technology-specific auctions allow policy makers
to pursue capacity targets for each renewable            Locational constraints
technology and support the development of                The solar PV (and biomass) auctions had no
these technologies according to the needs of each        locational constraints. While assigning the task
technology and the system. The main strengths of         of site selection to bidders can lead the selection
such auctions are: 1) they can introduce specific

Figure 12. IRENA’s framework for the design of auctions

   Choice of the auctioned volume,                                           How bids are collected,
   how it is divided among                                                   winners selected, and
   different technologies and                                                contracts awarded
   project sizes, and the auction  AUCTION                 WINNER
   category                        DEMAND               SELECTION AND
                                                          CONTRACT
                                                           AWARD
                                                           PROCESS

                                   QUALIFICATION RISK ALLOCATION
                                   REQUIREMENTS        AND
   Minimum requirement for              AND       REMUNERATION               Types of risk among
   participants in the auction     DOCUMENTATION    OF SELLERS               stakeholders and specific
   and necessary documentation                                               rules to ensure timely
                                                                             implementation of
                                                                             awarded projects

Source: IRENA (2019c), based on IRENA and CEM (2015).

                                                                                                               27
of the most promising sites, this option can also and 2018. Yet less than 600 MW have so far been
increase administrative costs, as developers awarded, with five rounds now carried out, when
would be responsible for obtaining permits, two additional rounds from the initial plans are
engaging with national and local stakeholders included. This underperformance is the result of
and securing land and grid access. With that undersubscription, meaning that the auctions
in mind, offshore wind auctions in 2020 will be have not received enough bids to meet the
zone-specific (Box 2). demanded volumes (see Section 2.1).
Volume auctioned Project size
The volumes auctioned in solar auctions have High project size floor limits may also discourage
been fixed in each tender. Auctioning fixed participation, especially for small players that do
volumes is the simplest way to determine not have the capacity to develop large projects.
renewable energy capacity additions, compared The first three solar PV auctions had a project-size
to price-sensitive demands or multi-criteria floor limit of 2 MW. This was reduced to 500 kW
volume setting auctions (see IRENA and CEM, in 2019 for the fourth and fifth auctions, with
2015). Targeting around 1 GW, solar PV auctions plans for a further reduction to 250 kW in the
were introduced via three rounds between 2017 future (Kageyama, 2018a).
BOX 2. ZONE-SPECIFIC AUCTIONS FOR OFFSHORE WIND
Offshore wind deployment in Japan has historically been hindered by a variety of factors. These have
included regulatory uncertainty, with land use rights at sea not clearly defined; environmental impact
assessments (EIA), which have often taken over four years to complete, and limitations in areas with
promising wind potential in northern Japan due to poor grid infrastructure (JWPA, 2017).
A first attempt to ease the regulatory uncertainty was an amendment to the Port and Harbour Act in
2016. This ensured usage rights of 20 years (with an option for extension) for winners of forthcoming
wind auctions. This period was significantly longer than the previous one, which required an extension
every 3-5 years (Eguchi et al., 2018). As the name of the Act implies, however, it only applied to the port
area – that part of Japan’s shores controlled by local port authorities. The port area offers pre-existing
infrastructure, but this is also used for other economic activities, creating substantial competition with
other stakeholders (JWPA, 2017).
In 2018, the Bill on Promotion of Use of Territorial Waters for Offshore Renewable Energy Generation
Facilities increased the area that could be exploited. It also authorised exclusive use of the General Common
Sea Area for offshore wind, which was otherwise and previously mainly used for fishing (JWPA, 2018). The
contract duration was extended to 30 years, but it added research, construction, and decommissioning
responsibilities for developers during the contract period (Eguchi et al., 2018).
Thus, offshore wind auctions are planned to be zone-specific. Zone-specific auctions are a broader
version of site-specific auctions and thus share many of their advantages and limitations (see IRENA,
2019c; IRENA and CEM, 2015). The cost and time of an EIA can be greatly reduced, for instance, if the
location is thoroughly evaluated by the government. Similarly, grid access could also be ensured through
parallel planning in line with the auctions.
Those are to be held in at least five different so-called Promotion Areas, selected by national authorities
based on information provided by local governments. Local councils and relevant stakeholders will
analyse the requirements for project bidding in each specific zone. Next, METI will publish the auction
guidelines for developers. In addition, relevant information on the environmental conditions, such as the
sea floor depth and wind conditions, will be provided, thus reducing the technical workload for project
developers (Matsuda et al., 2019).
Lastly, off-shore wind auctions in Japan will include criteria beyond price. In particular, selection of the
winner will be guided by how well the business plan aligns with local development plans, notably regarding
competition with fisheries, in order to minimise crowding-out (MacPherson, 2018).
28You can also read