2017 Offshore Wind Technologies Market Update - August 2018
←
→
Page content transcription
If your browser does not render page correctly, please read the page content below
2017 Offshore Wind Technologies
       Market Update
       August 2018

U.S. DEPARTMENT OF ENERGY   OFFICE OF ENERGY EFFICIENCY & RENEWABLE ENERGY   1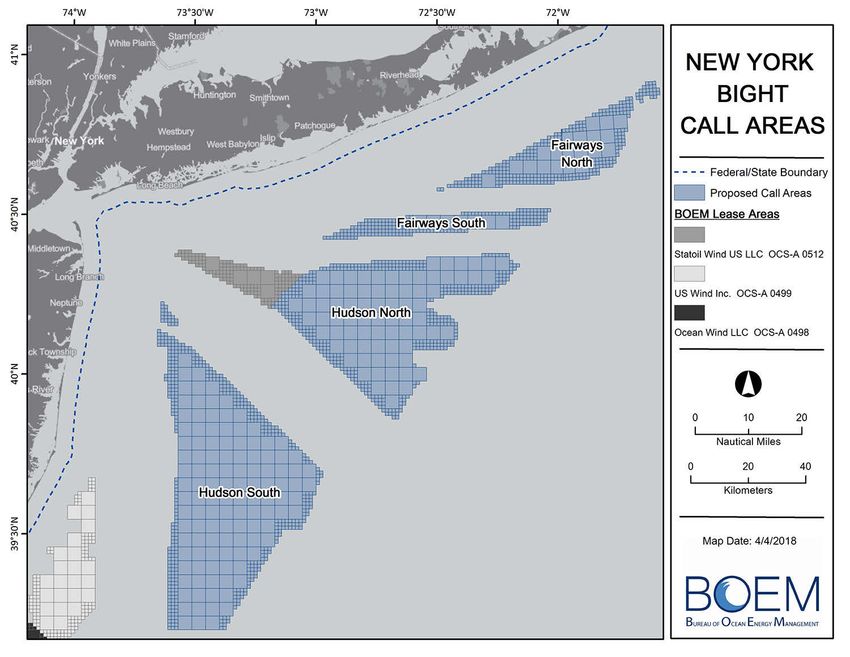
Acknowledgments
    This update was produced by Philipp Beiter, Paul Spitsen, Jake Nunemaker, Tian Tian, Walt Musial, Eric
    Lantz, and Vahan Gevorgian, and edited by Sheri Anstedt of the U.S. Department of Energy’s (DOE’s)
    National Renewable Energy Laboratory (NREL). We greatly appreciate the input, review, and support of
    Dan Beals, Alana Duerr, Patrick Gilman, Liz Hartman, Gary Norton, Mikayla Rumph, and Valerie Reed
    of DOE, Doug Arent, Garrett Barter, Paul Schwabe, Brian Smith, Tyler Stehly, and Amy Robertson
    (NREL), as well as James Glennie (Consulate General of Denmark), Seb Rae (The Renewables
    Consulting Group), Gavin Smart and Andrew McDonald (ORE Catapult), Liz Burdock (Business Network
    for Offshore Wind), Nils Bolgen (Massachusetts Clean Energy Center), Cheri Hunter and John Cushing
    (Bureau of Safety and Environmental Enforcement), Knut Aanstad and Peggy Brown (Equinor ASA), Jeff
    Kehne (Magellan Wind), Doreen Harris (New York State Energy Research and Development Authority),
    and Stephanie McClellan (University of Delaware). Cover photo provided by Equinor.

    Notes
    The Alliance for Sustainable Energy, LLC (Alliance) is the manager and operator of the National
    Renewable Energy Laboratory (NREL). NREL is a national laboratory of the U.S. Department of Energy,
    Office of Energy Efficiency and Renewable Energy. This work was authored by the Alliance and
    supported by the U. S. Department of Energy under Contract No. DE-AC36-08GO28308. Funding was
    provided by the U.S. Department of Energy Office of Energy Efficiency and Renewable Energy, Wind
    Energy Technologies Office. The views expressed in the article do not necessarily represent the views
    of the U.S. Department of Energy or the U.S. government. The U.S. government retains—and the
    publisher, by accepting the article for publication, acknowledges—that the U.S. government retains a
    nonexclusive, paid-up, irrevocable, worldwide license to publish or reproduce the published form of this
    work, or allow others to do so, for U.S. government purposes.

U.S. DEPARTMENT OF ENERGY   OFFICE OF ENERGY EFFICIENCY & RENEWABLE ENERGY                                     2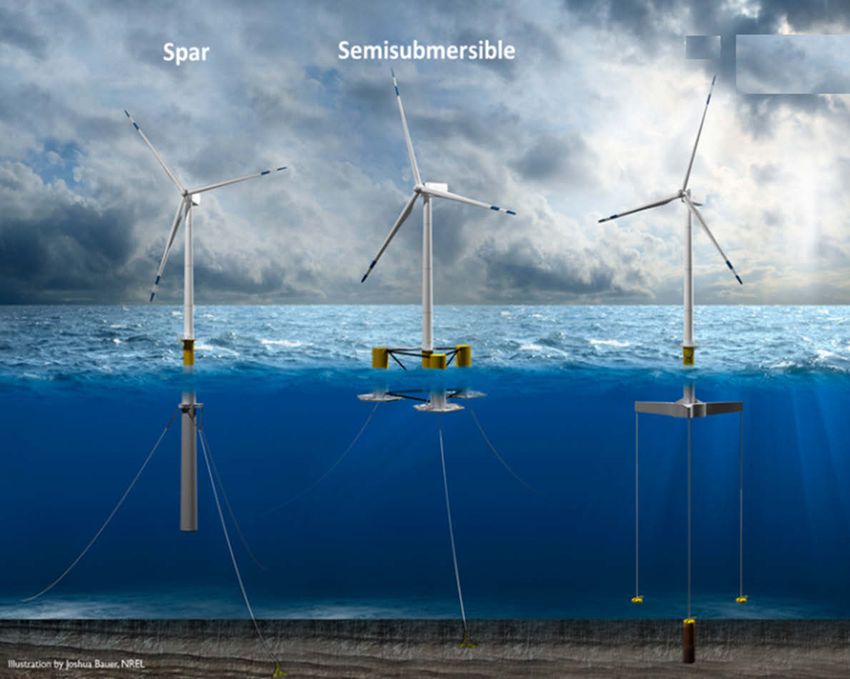
Preface
    •    The 2017 Offshore Wind Technologies Market Update was developed by NREL for
         DOE’s Office of Energy Efficiency and Renewable Energy, Wind Energy
         Technologies Office.
    •    This update complements the biennial Offshore Wind Technologies Market Report
         (Musial et al. 2017), which includes a more detailed discussion of the key trends
         and statistics included in this update.
    •    This work provides decision-makers, regulators, developers, financiers, and supply
         chain participants with quantitative information about the offshore wind market,
         technology, and cost status worldwide and in the United States.

U.S. DEPARTMENT OF ENERGY   OFFICE OF ENERGY EFFICIENCY & RENEWABLE ENERGY                    3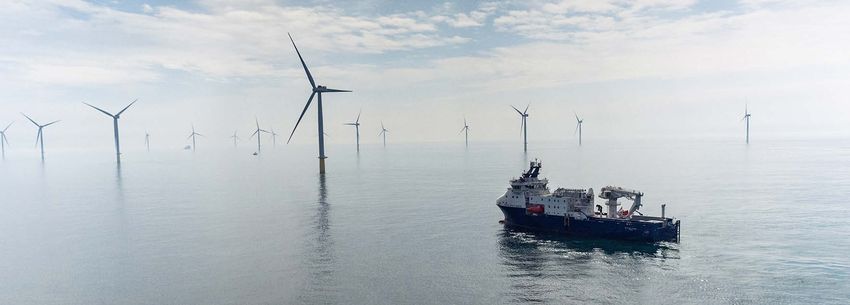
Table of Contents
                                                                             Slide
                                                                             Numbers

1 Key Findings                                                                5–11
2 Data and Methodology                                                       12–16
3 U.S. Offshore Wind Market Update                                           17–36
4 Global Market Update                                                       37–45
5 Cost and Pricing Trends                                                    46–56
6 Technology Trends                                                          57–66
7 Floating Wind Energy                                                       67–74
8 Additional Resources                                                       75–76
9 References                                                                 77–82
U.S. DEPARTMENT OF ENERGY   OFFICE OF ENERGY EFFICIENCY & RENEWABLE ENERGY             4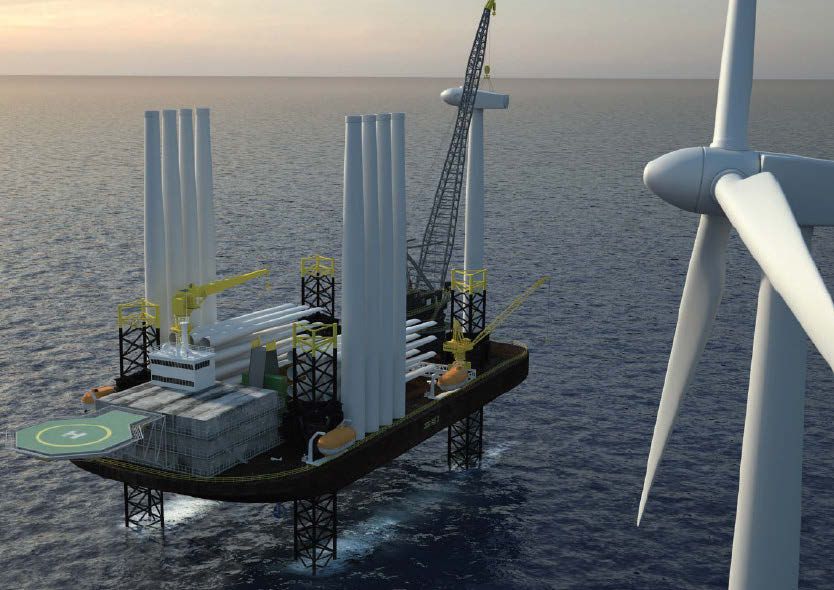
1           Key Findings

U.S. DEPARTMENT OF ENERGY   OFFICE OF ENERGY EFFICIENCY & RENEWABLE ENERGY   5
Key Findings
      United States
      U.S. Offshore Wind Projects Advance in Development While Total Project Pipeline
      Remains Relatively Constant
      The U.S. offshore wind market continues to evolve as state-level offshore wind
      deployment targets and procurement policies are introduced, projects advance in
      permitting and offtake processes, supply chain constraints are mitigated, and research
      and development (R&D) investments are made. Including the 30 megawatts (MW) of
      installed capacity, the United States now has a project pipeline of 25,464 MW of
      offshore wind.1
      •   Developers have announced that roughly 2,000 MW of new offshore wind capacity is expected to be
          operational by 2023.
      •   The U.S. pipeline continues to be led by projects along the U.S. Eastern Seaboard, of which a number
          have made steps toward a more advanced stage of development during 2017 and the first half
          of 2018.

  1 Potential capacity includes installed projects, projects under construction, projects moving through permitting and offtake processes, projects with site
  control, the Bureau of Ocean Energy Management’s unleased wind energy areas, and unsolicited lease applications submitted by developers. See Section 3 for
  a detailed discussion.

U.S. DEPARTMENT OF ENERGY       OFFICE OF ENERGY EFFICIENCY & RENEWABLE ENERGY                                                                                  6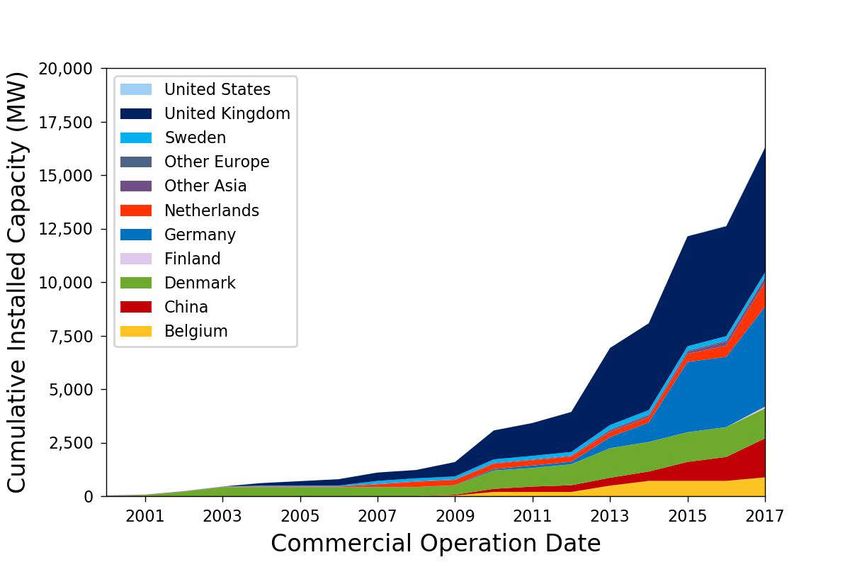
Key Findings (continued)
    Continued State Activity in U.S. Offshore Wind Development
    Dedicated state-level procurement and offtake mechanisms support U.S. offshore wind development:
    • New Jersey increased the state’s 2030 offshore wind commitment from 1,100 MW to 3,500 MW,
       initiated new legislation to restart the review process for Fishermen’s Energy Atlantic City project, and
       directed the Board of Public Utilities to implement the state’s offshore renewable energy credits
       (ORECs) (New Jersey State Legislature 2018a).
    • Massachusetts’ Energy Diversity Act (2016) mandated the procurement of 1,600 MW of offshore wind
       via competitive solicitations by 2027. The first round of solicitations was completed on May 23, 2018,
       with Vineyard Winds’ 800-MW proposal selected as the winner. The next solicitation is expected to be
       held before 2020 (General Court of the Commonwealth of Massachusetts 2016).
    • As part of the Massachusetts solicitation, Rhode Island was able to evaluate offshore wind project
       proposals. Rhode Island selected Deepwater Wind’s 400-MW Revolution Wind proposal to support the
       state’s goal of adding 1,000 MW of renewables by 2020 (Office of the Governor 2018).
    • In February 2018, Connecticut issued a request for proposal (RFP) for 825,000 megawatt-hours (MWh)
       per year of renewable energy from offshore wind. Connecticut’s Department of Energy and
       Environmental Protection selected Deepwater Wind’s 200-MW Revolution Wind proposal. The project
       will be incremental to Deepwater’s 400-MW Revolution Wind proposal approved by Rhode Island
       (Connecticut Department of Energy & Environmental Protection 2018).
    • New York’s clean energy standard requires 50% renewable energy by 2030, and Governor Cuomo has
       identified a 2,400-MW offshore wind target to help achieve that goal (New York State 2017).
    • Maryland has a 2.5% offshore wind renewables portfolio standard (RPS) carve out supported by
       offshore ORECs (House Bill 226 2013).

U.S. DEPARTMENT OF ENERGY   OFFICE OF ENERGY EFFICIENCY & RENEWABLE ENERGY                                    7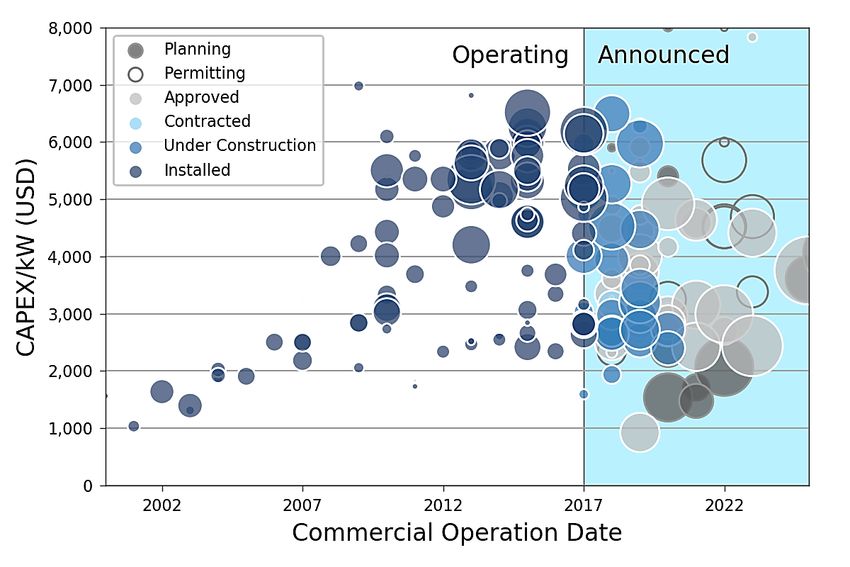
Key Findings (continued)
    Proposed Additions of New Wind Energy Areas (WEAs) in the Atlantic Are Underway
    Until March 2017, the Bureau of Ocean Energy Management (BOEM) competitive auctions have granted site
    control to developers in 13 lease areas with roughly 17 gigawatts (GW) of potential capacity (BOEM 2018a).
    • In response to state requests, BOEM has identified four new call areas in the New York Bight off the south
        coast of Long Island (BOEM 2018b).
    • As part of BOEM’s Renewable Energy Path Forward on the Atlantic, the organization is conducting a high-level
        evaluation of all areas on the Atlantic Coast for offshore wind development (BOEM 2018a).
    • The U.S. Department of the Interior plans to auction the two unleased portions of the Massachusetts WEA
        (BOEM 2018c).
    • The U.S. Department of the Interior’s Royalty Policy Committee recommended BOEM should develop 20 GW of
        offshore wind by issuing 2 GW of new leases annually, starting in 2024, to ensure the development of a
        robust domestic supply chain (U.S. Department of the Interior 2018).

    Offshore Wind Industry Developers Are Working With the U.S. Department of Defense
    (DOD), BOEM, and the States of California and Hawaii to Resolve Potential Project
    Siting Obstacles
    •    In California, DOD has indicated that offshore wind turbines may interfere with ocean-facing radar arrays and
         offshore training areas (U.S. Department of the Navy 2018). These issues may impact the development of
         potential lease sites currently under consideration in central California, including Morro Bay. Offshore wind
         developers have announced they will continue to work with DOD officials to minimize the impact of offshore
         wind development (Nikolewski 2018).
    •    Some developers are also considering potential projects in northern California, including Humboldt Bay, that
         are not anticipated to interfere with military training areas or radar (Redwood Coast Energy Authority [RCEA]
         2018).
U.S. DEPARTMENT OF ENERGY   OFFICE OF ENERGY EFFICIENCY & RENEWABLE ENERGY                                               8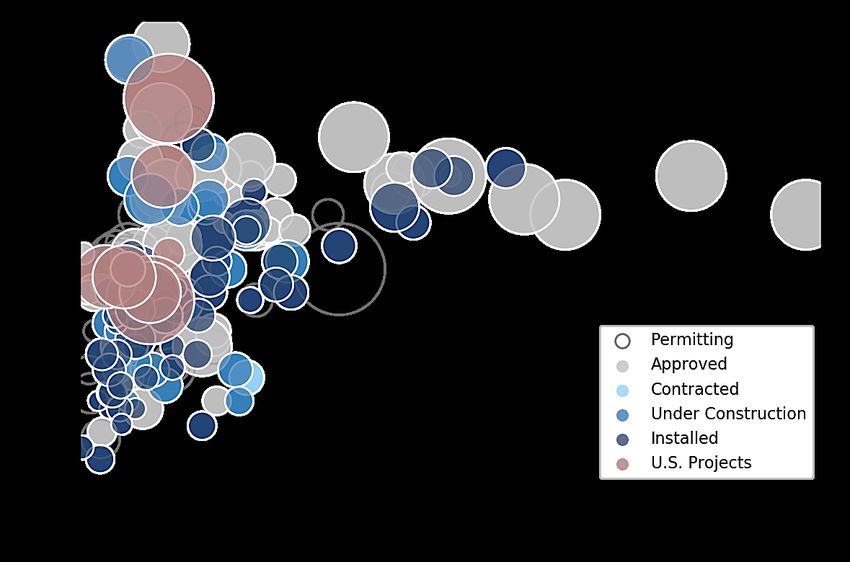
Key Findings (continued)
    U.S. Offshore Wind Technology Investments Aim to Spur Domestic Development and
    Overcome U.S. Deployment Barriers
    •    DOE’s Advanced Demonstration Projects, Lake Erie Energy Development Corporation’s (LEEDCo’s) Icebreaker,
         and the University of Maine’s Aqua Ventus I continue to advance and aim to demonstrate novel offshore wind
         technologies by 2022.
    •    Developers included energy storage solutions in their proposals submitted to Massachusetts 83C and 83D
         solicitations (Massachusetts Clean Energy 2017 and 2018).
    •    DOE announced on June 15, 2018, that it will begin negotiations with the New York State Energy Research
         and Development Authority (NYSERDA) to form an Offshore Wind Research Consortium. The award resulted
         from a $20.5 million DOE funding opportunity to encourage public-private offshore wind partnerships that
         address U.S. offshore wind technology issues.
    U.S. Supply Chain Seeing Some Early Activity Even Before Execution of Major Power
    Purchase Agreements
    •    Clemson University and MHI/Vestas have signed a 5-year partnership agreement to test the
         V164-9.5 MW turbine’s drivetrains (Clemson University 2017).
    •    Zentech/Renewable Resources International, AllCoast/AK Suda, and Aelous Energy Group all intend to deploy
         a U.S.-flagged turbine installation vessel before 2020.
    •    Developers and state agencies are actively assessing port infrastructure requirements and evaluating
         potential investment opportunities. For example, New York’s Master Plan identified New York Harbor, the
         Hudson River, and Long Island as potential sites for manufacturing, staging, or operation and maintenance
         (O&M) activities.

U.S. DEPARTMENT OF ENERGY   OFFICE OF ENERGY EFFICIENCY & RENEWABLE ENERGY                                        9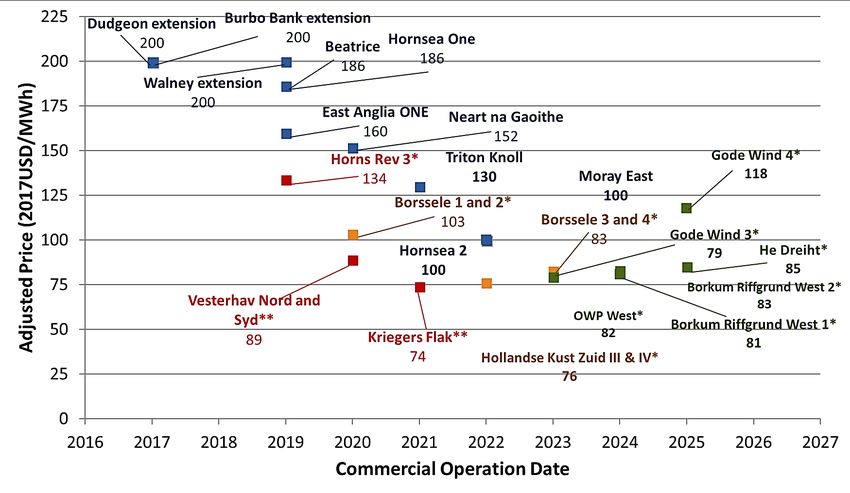
Key Findings (continued)
    Global
    In 2017, 3,387 MW of Offshore Wind Capacity Was Commissioned Globally, Resulting
    in a Cumulative Installed Global Capacity of 16.3 GW
    •      The United Kingdom is still the largest offshore wind market with 5,824 MW of cumulative installed
           capacity, followed by Germany (4,667 MW), China (1,823 MW), Denmark (1,399 MW), and the
           Netherlands (1,124 MW).
    •      France, Poland, and Italy have all shown renewed interest in offshore wind given its increased level of
           cost competitiveness.
    •      While China continues to be the largest offshore wind market in Asia, Taiwan signed agreements with
           Ørsted,2 WPD, Copenhagen Infrastructure Partners, Northland Power, and Yushan Power for 3,800 MW
           of capacity. Japan, South Korea, and India also continue to be emerging players in Asia’s offshore wind
           market.

    Globally, Auction Prices Continue To Fall: Developers Have Placed Four Bids that Were
    Termed as “Zero-Subsidy” to Date
    •      Bids in the most recent Dutch auction (700‒750 MW, March 2018) and the German Borkum Riffgrund
           West 1 project (420 MW, April 2018) were entered as “zero-subsidy” bids.3
    •      Despite higher prices in the past, the recent 2017 U.K. offshore wind auction saw bids prices fall in line
           with global averages.
    2   DONG Energy changed its name to Ørsted in October 2017. This update will refer to Ørsted from here on.
    3 Note that the Dutch and German auctions do not include the grid connection costs.

U.S. DEPARTMENT OF ENERGY        OFFICE OF ENERGY EFFICIENCY & RENEWABLE ENERGY                                    10
Key Findings (continued)
Globally, Turbines Continue To Grow in Capacity, Hub Height, and Rotor Diameter—
Decreasing Overall Project Costs
• General Electric (GE) announced the development of a 12-MW wind turbine, the first original
equipment manufacturer (OEM) to go above 10 MW (rotor diameter of 220 meters (m), 260 m total
height), which the company expects to be available by 2021. Senvion and Siemens Gamesa have also
announced 10-MW+ turbine designs.
Developers Continue To Test New Fixed-Bottom Substructures To Overcome
Geotechnical, Environmental, Domestic Content, and Installation Challenges
• EDF Renewables deployed the first cement gravity-based foundations at its Blyth Offshore
Demonstrator in the United Kingdom. Jysk Energi deployed gravity-based foundations at Nissum
Bredning in Denmark as part of a joint demonstration project with Siemens. Vattenfall installed its
suction bucket and jacket substructure at its European Offshore Wind Deployment Centre in Aberdeen
Bay, Scotland.
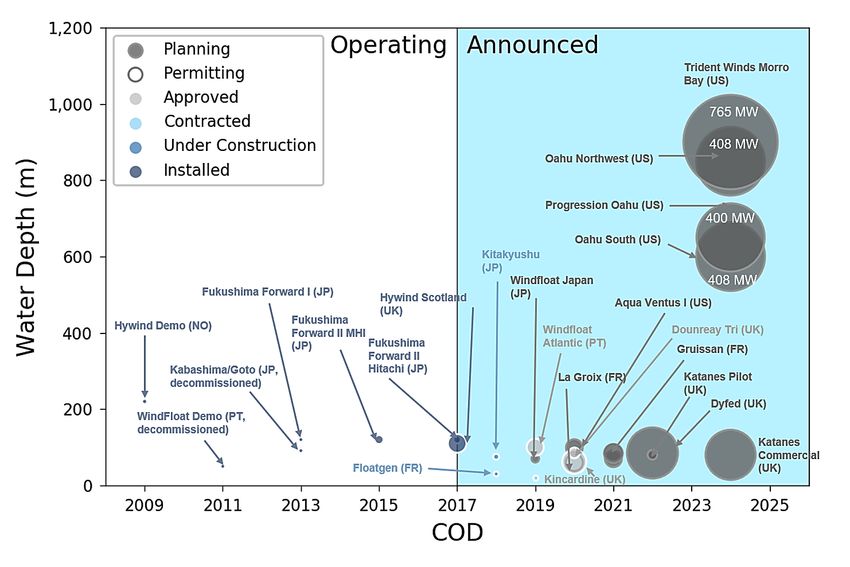
Numerous Floating Substructure Configurations Continue To Be Evaluated and
Demonstrated
• Equinor4 successfully installed its five-turbine, 30-MW Hywind, which uses a spar substructure, off the
coast of Scotland in October 2017.
• Senvion and Principle Power LLC have partnered to test floating platforms capable of supporting
offshore wind turbines that are 10 MW or larger in real-world conditions by 2021.
• Ideol’s Floatgen 2-MW demonstration project was assembled in port, towed to sea, moored to the
seafloor at Le Croisic (France), and connected to the grid in May 2018.
4 Statoil ASA changed its name to Equinor ASA in March 2018. This update will refer to Equinor from here on.
U.S. DEPARTMENT OF ENERGY OFFICE OF ENERGY EFFICIENCY & RENEWABLE ENERGY 112 Data and Methodology U.S. DEPARTMENT OF ENERGY OFFICE OF ENERGY EFFICIENCY & RENEWABLE ENERGY 12
Data and Methodology Data and
Methodology 2
• This update draws data from NREL’s internal offshore wind database, which is built
on internal research and a wide variety of data sources, including peer-reviewed
literature, press releases, industry news reports, manufacturer specification sheets,
and global offshore wind project announcements. For the database, NREL has
verified and sourced data from the following publications:
The 4C Offshore Wind Database (4C Offshore 2018)
Recharge News (Recharge Wind 2018)
WindEurope Annual Market Update (WindEurope 2018)
Bloomberg New Energy Finance (BNEF) Renewable Energy Project Database (BNEF 2018)
MAKE Consulting Global Offshore Wind Database (MAKE Consulting 2018).
U.S. DEPARTMENT OF ENERGY OFFICE OF ENERGY EFFICIENCY & RENEWABLE ENERGY 13Data and Methodology (continued) Data and
Methodology 2
• The scope of the report covers the global fleet of operating projects through
December 31, 2017. However, the report emphasizes recent developments and
events in the United States through the second quarter of 2018.
• Any estimates of capacities and project dates are shown as reported by project
developers and state/federal agencies.
• All dollar amounts are reported in 2017 U.S. dollars, unless indicated otherwise.
• In this analysis, U.S. pipeline capacity refers to the sum of project-specific capacities
and the undeveloped lease area potential capacities.
• For further discussion on methodology and data sources, please refer to the 2016
Offshore Wind Technologies Market Report (Musial et al. 2017).
U.S. DEPARTMENT OF ENERGY OFFICE OF ENERGY EFFICIENCY & RENEWABLE ENERGY 14Data and Methodology (continued) Data and
Methodology 2
Acronyms and Abbreviations
AC alternating current MW megawatt
BOEM Bureau of Ocean Energy Management MWh megawatt-hour
CapEx capital expenditures NREL National Renewable Energy Laboratory
CFD contract for difference O&M operation and maintenance
COD commercial operation date OCS Outer Continental Shelf
DOE U.S. Department of Energy OEM original equipment manufacturer
DOD U.S. Department of Defense OpEx operational expenditures
FID final investment decision OREC offshore renewable energy certificate
GW gigawatt OTM offshore transmission module
HVAC high-voltage alternating current PPA power purchase agreement
kV kilovolt R&D research and development
kW kilowatt RCEA Redwood Coast Energy Authority
LEEDCo Lake Erie Energy Development Corporation RFP request for proposal
LIPA Long Island Power Authority RES renewable energy systems
LLC limited liability company TBD to be determined
m meter(s) TSO transmission system operator
MHI Mitsubishi Heavy Industries WEA wind energy area
U.S. DEPARTMENT OF ENERGY OFFICE OF ENERGY EFFICIENCY & RENEWABLE ENERGY 15Data and Methodology (continued) Data and
Methodology 2
• For the global and U.S. project pipeline, the following classification was applied (see
Musial et al. 2017 for more details).
Criteria for Pipeline Classification of U.S. Offshore Wind Projects
Step Phase Name Phase Start Criteria Phase End Criteria
1 Planning Starts when developer or regulatory agency initiates formal site Ends when a developer obtains exclusive development rights to a site (e.g.,
control process through competitive auction or a determination of no competitive interest in
the United States)
2 Site Control Begins when developer obtains exclusive development rights to a site Ends when the developer files major permit applications (e.g., a construction
(e.g., through competitive auction or a determination of no operations plan for projects in federal waters in the United States)
competitive interest in the United States)
3 Permitting/ Starts when the developer files major permit applications (e.g., Ends when a regulatory body(s) grants authorization to proceed with
Offtake Agreement construction operation plan for projects in federal waters in the construction or when the project has signed an offtake agreement
United States)
4 Approved Starts when the project has been approved by the relevant regulatory Ends when sponsor announces FID and has signed contracts for major
bodies and is fully authorized to proceed with construction or when construction work packages
the project has a signed offtake agreement
5 Financial Close Begins when sponsor announces final investment decision (FID) and Ends when project begins offshore construction work
has signed unconditional contracts for major construction work
packages
6 Under Starts when offshore construction work is initiated Ends when project has been connected to the power grid and all units fully
Construction commissioned; COD marks the official transition from construction to
operations
7 Operating Commences when project has been connected to the power grid and Ends when the project has begun a formal process to decommission and
all units are fully commissioned; commercial operation date (COD) stops feeding power to the grid
marks the official transition from construction to operations
8 Decommissioned Starts when the project has begun a formal process to decommission Ends when the site has been restored and lease payments are no longer
and stops feeding power to the grid being made, or if the site has been repowered
9 On Hold/Canceled Starts if a sponsor stops development activities (i.e., discontinues Ends when the sponsor announces the restart of project development
lease payments) and/or abandons a prospective site activities
U.S. DEPARTMENT OF ENERGY OFFICE OF ENERGY EFFICIENCY & RENEWABLE ENERGY 163 U.S. Offshore Wind Market
Update
U.S. DEPARTMENT OF ENERGY OFFICE OF ENERGY EFFICIENCY & RENEWABLE ENERGY 17U.S. Highlights U.S. Market
Update 3
United States
• The U.S. offshore wind industry took a large leap forward as commercial-scale projects were
competitively selected in Massachusetts (800 MW), Rhode Island (400 MW), and Connecticut (200
MW). As of June 2018, the U.S. market has 1,906 MW of capacity that developers have announced to
commence operations by 2023 and 25,464 MW of potential capacity in the aggregate pipeline.
• U.S. offshore wind development is primarily driven by state procurement mechanisms, such as ORECs
employed in New Jersey and Maryland and competitive solicitations employed in Massachusetts,
Rhode Island, and Connecticut.
Massachusetts
• In December 2017, Bay State Wind, Deepwater Wind, and Vineyard Wind submitted responses to the
Massachusetts Section 83C of the Green Communities Act RFP (400–800 MW of capacity)
(Massachusetts Clean Energy 2017).
• On May 23, 2018, Massachusetts Department of Energy Resources in conjunction with the state’s
electric distribution companies selected Vineyard Wind’s 800-MW proposal as the winner of the 83C
RFP. Vineyard Wind has until July 31, 2018, to submit an offtake agreement for the Massachusetts’
Department of Public Utilities’ approval (Massachusetts Clean Energy 2018).
• Despite not being selected, Bay State Wind will continue to develop its project and plans to participate
in future solicitations in Massachusetts and neighboring states (Bay State Wind 2018a).
U.S. DEPARTMENT OF ENERGY OFFICE OF ENERGY EFFICIENCY & RENEWABLE ENERGY 18U.S. Highlights (continued) U.S. Market
Update 3
Massachusetts (continued)
• On December 1, 2017, Cape Wind Associates terminated its lease with BOEM and ceased
development of the proposed offshore wind project in Nantucket Sound.
• On April 11, 2018, BOEM issued a Proposed Sale Notice for companies interested in acquiring
Massachusetts lease areas OCS-A 0502 and OCS-A 0503, the two unsold lease areas in the
Massachusetts WEA (BOEM 2018c).
• On February 13, 2018, the Federal Energy Regulatory Commission authorized Anbaric Development
Partners to move ahead with an offshore transmission network composed of a 1,000-MW high-voltage
direct-current transmission line to the Southeast Massachusetts Load Zone and two 1,000-MW
offshore platforms with alternating current (AC) switching stations (Walton 2018).
• Vineyard Wind announced it will provide $2 million in funding to develop an offshore wind labor force in
Massachusetts (Demetre 2018) and was granted an Environmental Notification Form certificate for a
transmission cable to a substation on Cape Cod.
• Multiple offshore wind project proposals in Massachusetts also included energy storage. Although
neither project was selected, Deepwater Wind included a 40-MW/40-MWh Tesla battery with its
proposed 144-MW Revolution Wind project for the state’s 83D RFP, and Bay State Wind included a 55-
MW/110-MWh NEC Energy Solutions battery as part of its 83C RFP bid.
Rhode Island
• As part of Governor Raimondo’s goal to acquire 1,000 MW of renewable capacity by 2020, Rhode
Island issued a 400-MW offshore wind RFP in February 2018. As members of Massachusetts’ RFP
review team, Rhode Island energy officials were ultimately able to select Deepwater Wind’s 400-MW
Revolution Wind project as the winner of Rhode Island’s RFP (Office of the Governor 2018).
U.S. DEPARTMENT OF ENERGY OFFICE OF ENERGY EFFICIENCY & RENEWABLE ENERGY 19U.S. Highlights (continued) U.S. Market
Update 3
New York
• After signing a power purchase agreement (PPA) with the Long Island Power Authority in 2017, Deepwater
Wind’s 90-MW South Fork project continues to advance through state and federal environmental permitting
processes and is expected to commence operations in 2022.
• In his 2018 State of the State address, Governor Cuomo announced that New York will issue an RFP
to add at least 800 MW of new offshore wind capacity in 2018‒2019, in support of its goal of 2.4 GW of
offshore wind by 2030. He has also directed NYSERDA to fund $15 million of clean energy
workforce development (New York State 2018).
• New York’s Department of Public Service opened a docket for public comments on the state’s preferred
offshore wind offtake mechanism (New York State Department of Public Service 2018).
• The NYSERDA Offshore Wind Masterplan was released on January 29, 2018. The plan identifies areas for
consideration of potential offshore wind energy development and contains a series of environmental,
infrastructure, workforce, procurement mechanism, and cost analyses (NYSERDA 2018).
• BOEM published a Call for Information and Nominations on April 11, 2018, to understand interest from
companies that might consider commercial wind energy leases within its proposed area in the New York Bight
(BOEM 2018b).
New Jersey
• In January 2018, Governor Murphy signed Executive Order #8 directing the Board of Public Utilities to move
toward a goal of developing 3,500 MW of offshore wind by 2030 and fully implement the Offshore Wind
Economic Development Act (2010) by immediately offering ORECs for up to 1,100 MW of capacity to eligible
projects (State of New Jersey 2018). In April 2018, New Jersey also expanded its RPS goal to 50% by 2030
and codified its 3.5-GW offshore wind carve out (New Jersey State Legislature 2018a).
U.S. DEPARTMENT OF ENERGY OFFICE OF ENERGY EFFICIENCY & RENEWABLE ENERGY 20U.S. Highlights (continued) U.S. Market
Update 3
New Jersey (continued)
• Fishermen’s Energy was not able to secure a PPA by December 31, 2016, to be eligible for another round of DOE’s Offshore
Wind Advanced Demonstration Project funding. EDF Renewable Energy reached a preliminary agreement to acquire the fully
permitted Fishermen’s Energy project (24 MW). Governor Murphy signed S-1217, requiring New Jersey’s Board of Public
Utilities to accept an application from Fishermen’s Energy and review it for approval within 90 days (New Jersey State
Legislature 2018b).
Connecticut
• In January 2018, the Connecticut Department of Energy and Environmental Protection issued an RFP for 825,000 MWh/yr
of offshore wind. On June 14, 2018, the state selected Deepwater Wind’s Revolution Wind 200-MW proposal. The project will
be incremental to Deepwater’s 400-MW Revolution Wind proposal approved by Rhode Island (Connecticut Department of
Energy & Environmental Protection 2018).
Maryland
• US Wind continues to advance through federal and state permitting processes and is installing a meteorological (met) tower
in 2018 in the Maryland WEA. Deepwater Wind plans to submit a Site Assessment Plan in 2019 for its 120-MW Skipjack
offshore wind project located in the Delaware WEA (BOEM 2018e), which plans to sell power to Maryland.
Virginia
• Ørsted and Dominion signed an engineering, procurement, and construction contract to develop their Coastal Virginia
Offshore Wind 12-MW demonstration project, which originated in the DOE Offshore Wind Advanced Technology
Demonstration Project program.
Pacific Coast
• BOEM, state officials, and developers continue to plan for the deployment of a commercial floating offshore wind energy
project off the Pacific Coast. RCEA proposed a project off the coast of Humboldt Bay, California, and signed a public-private
partnership with an industry consortium led by Principle Power LLC. The group plans to submit an unsolicited lease proposal
to BOEM in the summer of 2018 (RCEA 2018). Please note that this project is not included in the overall pipeline because
the developers have not submitted an application to BOEM.
U.S. DEPARTMENT OF ENERGY OFFICE OF ENERGY EFFICIENCY & RENEWABLE ENERGY 21Project Development Pipeline U.S. Market
Update 3
• The total U.S. project pipeline grew by 1,299 MW in 2017. This brings the grand total of the U.S.
pipeline to 25,464 MW as of June 2018 with 30 MW already installed. The overall pipeline is
comprised of 3,922 MW of project-specific capacity and 21,542 MW of undeveloped lease area
potential capacity. Major changes were the Cape Wind (468 MW) lease termination and the addition
of Deepwater Wind’s Garden State offshore wind energy project (600 MW).
U.S. Offshore Wind Project Pipeline by Project Status as of June 2018
U.S. DEPARTMENT OF ENERGY OFFICE OF ENERGY EFFICIENCY & RENEWABLE ENERGY 22Project Development Pipeline (continued) U.S. Market
Update 3
• The U.S. pipeline continues to be led by projects along the U.S. Eastern Seaboard;
a number of these projects advanced in the project development process during 2017 and the first
half of 2018.
U.S. Project Pipeline by State as of June 2018
U.S. DEPARTMENT OF ENERGY OFFICE OF ENERGY EFFICIENCY & RENEWABLE ENERGY 23U.S. Project Pipeline Status U.S. Market
Update 3
Permitting
Under
Stage Planning Site Control Procurement Initiated Contract Awarded Approved FID Operating
Construction
Block Island
Undeveloped Portion of Fishermen’s
AW Oahu Northwest (HI) Maine Aqua Ventus I (ME) South Fork (NY) Wind Farm
Deepwater ONE North (MA) Energy (NJ)
400 MW 12 MW 90 MW (RI)
495 MW 24 MW
30 MW
Skipjack (MD)
AW Oahu South (HI) Deepwater ONE South (MA) Vineyard Wind (MA)
120 MW
400 MW 816 MW 800 MW
Revolution Wind
Progression Hawaii (HI) Bay State (MA) US Wind (MD)
(RI and CT)
400 MW 2,277 MW 248 MW
600 MW
Undeveloped Portion
Morro Bay (CA) Icebreaker (OH)
of Vineyard Wind (MA)
765 MW 21 MW
1,225 MW
WEA Wilmington East (NC) Empire Wind (NY)
1,623 MW 963 MW
Projects WEA Wilmington West (NC) Ørsted Ocean Wind (NJ)
627 MW 1,947 MW
Massachusetts WEA 502 (MA) US Wind (NJ)
3,012 MW 2,226 MW
Massachusetts WEA 503 (MA) Deepwater Garden State (DE)
1,707 MW 1,050 MW
US Wind (MD)
718 MW
Dominion (VA)
1,371 MW
Virginia Offshore Wind Technology
Advancement Project (VOWTAP) (VA)
12 MW
Avangrid Kitty Hawk (NC)
1,485 MW
Total 8,934 MW 14,585 MW 1,433 MW 458 MW 24 MW 30 MW
Estimated Capacity Project-Specific Capacity
U.S. DEPARTMENT OF ENERGY OFFICE OF ENERGY EFFICIENCY & RENEWABLE ENERGY 24U.S. Lease and Call Areas U.S. Market
Update 3
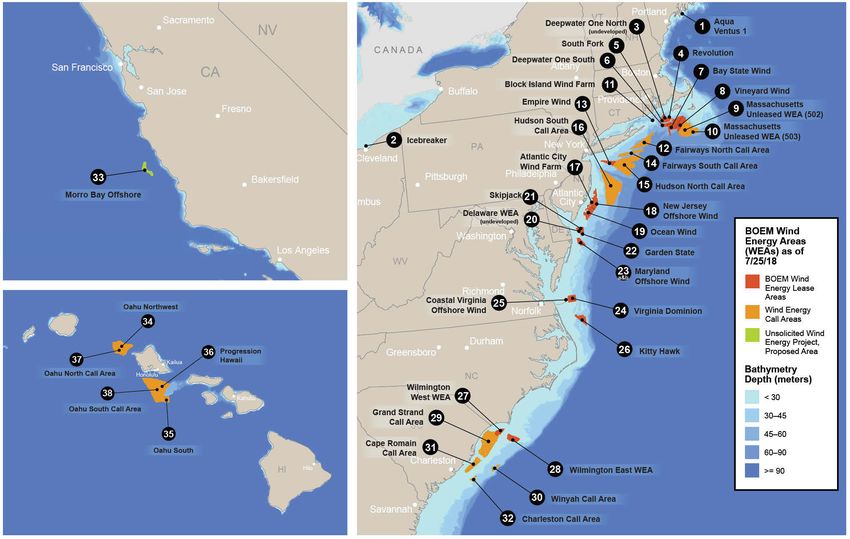
Map of U.S. Offshore Wind Lease and Call Areas
U.S. DEPARTMENT OF ENERGY OFFICE OF ENERGY EFFICIENCY & RENEWABLE ENERGY 25U.S. Lease and Call Areas (continued) U.S. Market
Update 3
• BOEM published a Call for Information and Nominations on April 11, 2018, to understand interest
from companies that might consider commercial wind energy leases within its proposed area in
the New York Bight (shown below).
BOEM Map of New York Bight Call Areas
Source: Reprinted from BOEM (2018)
U.S. DEPARTMENT OF ENERGY OFFICE OF ENERGY EFFICIENCY & RENEWABLE ENERGY 26U.S. Lease and Call Areas (continued)
Note: Project numbering corresponds to page 25. Pipeline capacity is the sum of project-specific capacity and undeveloped lease area potential capacity.
U.S. Market
Update 3
Project- Undeveloped Average
Pipeline Lease Water
Offtake Current Specific Lease Area Winning Date Wind
# Lease and Call Area Project Name Developer Capacity Area Depth
State Status Capacity Potential Bid Announced Speed
(MW) (km2) (m)
(MW) Capacity (MW) (m/s)
University of
1 Maine State Lease Maine Aqua Ventus I ME Permitting 12 0 12 9 N/A 6/4/2009 61–110 8.75
Maine
Cape Wind
N/A OCS-A 0478 Cape Wind MA Terminated N/A N/A N/A 119 N/A 10/6/2010 1‒18 8.7
Associates
3 Undeveloped MA Site Control 0 495 10/1/2013 30‒46 9.1
Deepwater One North
4 Revolution Deepwater Wind RI and CT Permitting 600 0 1,185 395 $3,089,461 5/23/2018 30‒46 9.1
OCS-A 0486
5 South Fork NY Permitting 90 0 1/25/2017 31‒36 9.2
Deepwater One South
6 Deepwater One South Deepwater Wind MA Site Control 0 816 816 272 N/A 10/1/2013 30‒46 9.2
OCS-A 0487
Massachusetts WEA Ørsted and
7 Bay State Wind MA Site Control 0 2,277 2,277 759 $281,285 4/1/2015 39‒50 9.3
OCS-A 0500 Eversource
Massachusetts WEA
8 Vineyard Wind CIP and Avangrid MA Site Control 800 1,225 2,025 675 $150,197 4/1/2015 36‒58 9.3
OCS-A 0501
Massachusetts WEA
9 Unleased WEA N/A N/A Planning 0 3,012 3,012 1,004 N/A N/A 34–62 9.3
OCS-A 0502
Massachusetts WEA
10 Unleased WEA N/A N/A Planning 0 1,707 1,707 569 N/A N/A 34–62 9.4
OCS-A 0503
North Atlantic
Block Island Wind
11 Rhode Island State Lease Deepwater Wind RI Operational 30 0 30 10 N/A N/A 23‒28 9.7
Farm
Fairways North
12 N/A N/A N/A N/A N/A N/A N/A N/A N/A N/A N/A N/A
Call Area
New York WEA
13 Empire Wind Equinor NY Site Control 0 963 963 321 $42,469,725 12/16/2016 20‒40 9.3
OCS-A 0512
Fairways South
14 N/A N/A N/A N/A N/A N/A N/A N/A N/A N/A N/A N/A
Call Area
Hudson North
15 N/A N/A N/A N/A N/A N/A N/A N/A N/A N/A N/A N/A
Call Area
Hudson South
16 N/A N/A N/A N/A N/A N/A N/A N/A N/A N/A N/A N/A
Call Area
Atlantic City Wind Fishermen’s
17 New Jersey State Lease NJ Approved 24 0 24 8 N/A 6/5/2011 8‒12 8.3
Farm Energy and EDF
New Jersey WEA New Jersey Offshore
18 US Wind NJ Site Control 0 2,226 2,226 742 $1,006,240 3/1/2016 17‒34 8.6
OCS-A 0499 Wind
New Jersey WEA
19 Ocean Wind Ørsted NJ Site Control 0 1,947 1,947 649 $880,715 3/1/2016 17‒34 8.4
OCS-A 0498
20 Undeveloped DE Site Control 0 450
Delaware WEA
21 Skipjack Deepwater Wind MD Permitting 120 0 1,170 390 $24,108 12/1/2012 9‒33 8.3
OCS-A 0482
22 Garden State DE Site Control 0 600
23a Maryland WEA OCS-A 0489 MD Permitting 248 148 396 132 $3,841,538 12/1/2014 16-29 8.2
Maryland Offshore
US Wind
Wind
23b Maryland WEA OCS-A 0490 MD Site Control 0 570 570 190 $4,859,560 12/1/2014 14-37 8.3
North Atlantic Subtotal: 18,360 MW 1,924 MW 16,436 MW 18,360 MW 6,244 km2 $56,602,829
U.S. DEPARTMENT OF ENERGY OFFICE OF ENERGY EFFICIENCY & RENEWABLE ENERGY 27U.S. Lease and Call Areas (continued) U.S. Market
Update 3
Note: This table reflects information available by the end of Q2 2018. Call Areas (shaded in light gray below) are not counted toward pipeline totals.
Winning bid amounts are not inflation-adjusted.
Project - Undeveloped Average
Pipeline
Offtake Current Specific Lease Area Lease Winning Date Water Wind
# Lease and Call Area Project Name Developer Capacity
State Status Capacity Potential Area (km2) Bid Announced Depth (m) Speed
(MW)
(MW) Capacity (MW) (m/s)
24 Virginia WEA OCS-A 0483 Virginia Dominion Dominion VA Site Control 0 1,371 1,371 457 $1,600,000 11/1/2013 18‒33 8.5
VOWTAP Research Lease Coastal Virginia Ørsted and
25
OCS-A 0497 Offshore Wind Dominion
VA Site Control 12 0 12 6 N/A 11/2015 20‒26 8.3
North Carolina WEA Avangrid
26 Kitty Hawk NC Site Control 0 1,485 1,485 495 $9,066,550 3/17/2017 31‒43 8.5
OCS-A 0508 Renewables
South Atlantic
27 Wilmington West WEA N/A N/A NC Planning 0 1,623 1,623 541 N/A N/A 14‒20 8.3
28 Wilmington East WEA N/A N/A NC Planning 0 627 627 209 N/A N/A 15‒29 8.4
Grand Strand Call
29 N/A N/A N/A N/A N/A N/A N/A N/A N/A N/A N/A N/A
Area
30 N/A Winyah Call Area N/A N/A N/A N/A N/A N/A N/A N/A N/A N/A N/A
Cape Romain Call
31 N/A N/A N/A N/A N/A N/A N/A N/A N/A N/A N/A N/A
Area
32 N/A Charleston Call Area N/A N/A N/A N/A N/A N/A N/A N/A N/A N/A N/A
South Atlantic Subtotal: 5,118 MW 12 MW 5,106 MW 5,118 MW 1,708 km2
33 Unsolicited Application Morro Bay Trident Wind CA Planning 765 0 765 275 N/A N/A 461‒996 7.81
Principle
N/A N/A Humboldt Bay CA N/A N/A N/A N/A N/A N/A N/A N/A N/A
Power/EDPR/RCEA
34 Unsolicited Application Oahu Northwest Alpha Wind HI Planning 400 0 400 133 N/A N/A N/A 8.3
Pacific
35 Unsolicited Application Oahu South Alpha Wind HI Planning 400 0 400 133 N/A N/A N/A 8.4
36 Unsolicited Application Progression Hawaii Progression HI Planning 400 0 400 133 N/A N/A N/A 8.4
37 N/A Oahu North Call Area N/A HI N/A N/A N/A N/A N/A N/A N/A N/A 8.3
38 N/A Oahu South Call Area N/A HI N/A N/A N/A N/A N/A N/A N/A N/A 8.4
Pacific Subtotal: 1,965 MW 1,965 MW 0 1,965 MW 724 km2
Lakes
Great
2 Ohio State Lease Icebreaker LEEDCo OH Permitting 21 0 21 10 N/A N/A 16‒19 8.1
Great Lakes Subtotal: 21 MW 21 MW 0 21 MW 10 km2
Total U.S. Pipeline Capacity: 25,464 MW 3,922 MW 21,542 MW 25,464 MW 8,816 km2 $67,269,379
U.S. DEPARTMENT OF ENERGY OFFICE OF ENERGY EFFICIENCY & RENEWABLE ENERGY 28U.S. Lease and Call Areas (continued) U.S. Market
Update 3
Atlantic
• BOEM issued a Request for Feedback on the Proposed Path Forward for Future Offshore Renewable
Energy Leasing on the Atlantic Outer Continental Shelf (OCS) to determine specific areas off the
Atlantic Coast that are optimal for offshore wind development and to identify factors that increase the
likelihood of projects being constructed (BOEM 2018a).
Massachusetts
• BOEM issued a Proposed Sale Notice for companies interested in acquiring lease areas OCS-A 0502
and OCS-A 0503—the two unsold lease areas in the Massachusetts WEA were originally part of the
auction held in January 2015 (BOEM 2018c).
• BOEM issued a Notice of Intent for an Environmental Impact Statement on Vineyard Wind’s
construction and operations plan to operate an 800-MW project offshore Massachusetts. If the
statement finds the construction and operations plan to be appropriate, Vineyard Wind can advance
toward project construction (Federal Register 2018a).
• On May 10, 2018, BOEM approved Vineyard Wind’s Site Assessment Plan for OCS-A 0501, allowing the
company to install up to two Fugro SEAWATCH Wind lidar metocean buoys (BOEM 2018d).
• On June 29, 2017, BOEM approved Bay State Wind’s Site Assessment Plan for OCS-A 0500 to install
two floating lidar buoys and one metocean/current buoy (BOEM 2018d).
• Bay State Wind was awarded accelerated federal permitting processes by the Federal Permitting
Improvement Steering Council under Title 41 of the Fixing America’s Surface Transportation Act (Bay
State Wind 2018c).
U.S. DEPARTMENT OF ENERGY OFFICE OF ENERGY EFFICIENCY & RENEWABLE ENERGY 29U.S. Lease and Call Areas (continued) U.S. Market
Update 3
Rhode Island and Massachusetts Area of Mutual Interest
• On October 12, 2017, BOEM approved Deepwater Wind’s Site Assessment Plan for lease area OCS-A
0486 to install an AXYS floating lidar 6M meteorological buoy (BOEM 2018c).
New York
• BOEM published a Call for Information and Nominations on April 11, 2018, to obtain nominations from
companies interested in commercial wind energy leases within its four proposed areas in the New York
Bight (Federal Register 2018b).
Maryland
• On March 22, 2018, BOEM approved US Wind’s Site Assessment Plan for OCS-A 0490 to install a
twisted jacket met tower designed by Keystone Engineering and deploy a seabed-mounted acoustic
Doppler current profiler and conductivity, temperature, and depth sensors (BOEM 2018e).
California
• RCEA issued a request for qualifications to identify a qualified entity or group to enter into a public-
private partnership that could develop an offshore wind project off the coast of Northern California
(RCEA 2018).
• RCEA selected a consortium including Principle Power, EDPR Offshore North America, Aker Solutions,
H.T. Harvey & Associates, and Herrera Environmental Consultants to lead the development of a 100- to
150-MW offshore wind project 20 miles off the coast of Eureka, California (RCEA 2017).
U.S. DEPARTMENT OF ENERGY OFFICE OF ENERGY EFFICIENCY & RENEWABLE ENERGY 30Siting and Environmental Developments U.S. Market
Update 3
Environmental
• In September 2017, the Fisheries Survival Fund and other plaintiffs filed a lawsuit against BOEM
regarding their current Empire Wind lease. Plaintiffs claim that BOEM did not adequately assess the
project’s impact on local fish populations, habitats, and shoreside communities.
• In March 2018, LEEDCo conducted additional assessments on the potential impact to avian species
after local environmental groups voiced concerns about the Icebreaker project’s potential negative
influence on the local bird and bat populations.
Visual
• In March 2018, officials representing Ocean City proposed Maryland House Bill 1135, which prohibits
turbine installation closer than 26 nautical miles from shore because of the potential negative visual
impact on tourism industries. The proposed legislation did not pass through the committee.
Military
• Currently, offshore wind industry developers are working with DOD, BOEM, and the state of California
to resolve potential conflicts with military operations, training, and radar that cover a wide portion of
the OCS in central California, as well as Hawaii. Offshore wind development is being considered in
portions of these areas.
U.S. DEPARTMENT OF ENERGY OFFICE OF ENERGY EFFICIENCY & RENEWABLE ENERGY 31Procurement Mechanisms U.S. Market
Update 3
• NYSERDA published the New York State Offshore Wind Master Plan, outlining a framework to develop
2,400 MW of offshore wind capacity. The plan identified several potential procurement mechanisms,
including fixed renewable energy certificates (RECs), bundled and split PPAs, utility-owned generation,
market ORECs, indexed ORECs, and forward ORECs (New York State 2018). In January 2018, New
York’s Department of Public Service opened a 60-day docket for public comments about
implementing offshore wind procurement mechanisms.
• The Connecticut Department of Energy & Environmental Protection issued an RFP for up to 825,000
MWh/yr of offshore wind. On June 14, 2018, the agency selected Deepwater Wind’s 200-MW
Revolution Wind proposal. The proposal will add to Deepwater’s 400-MW Revolution Wind project
approved by Rhode Island, growing the project’s overall size to 600 MW (Connecticut Department of
Energy & Environmental Protection 2018).
• In April 2018, Governor Phil Murphy signed New Jersey’s new RPS legislation targeting 50% renewable
energy and the procurement of 3,500 MW of offshore wind by 2030. The Governor’s Executive Order
#8 directed the Board of Public Utilities to implement the 2010 Offshore Wind Economic Development
Act by immediately offering ORECs for up to 1,100 MW of capacity to eligible projects (New Jersey
State Legislature 2018a).
• To help meet the Massachusetts’ procurement goal of 1,600 MW by 2027, the state’s Department of
Energy Resources selected Vineyard Wind’s 800-MW proposal in the first round of its competitive
solicitation.
U.S. DEPARTMENT OF ENERGY OFFICE OF ENERGY EFFICIENCY & RENEWABLE ENERGY 32State Offshore Wind Procurement Targets U.S. Market
Update 3
• Massachusetts’ target: 1,600 MW by 2027. Massachusetts will hold competitive
solicitations at least every 2 years to meet their target.
• Connecticut’s target: 825,000 MWh/yr. Offshore wind projects will be acquired via
RFPs.
• New York’s target: 2,400 MW by 2030. New York’s Public Service Commission
opened a docket to receive public comment on the optimal offshore wind
procurement mechanism.
• New Jersey’s target: 3,500 MW by 2030. The state will obtain offshore wind
capacity by holding RFPs and offering the winners New Jersey ORECs.
• Maryland’s target: 2.5% of the state’s total retail electric sales. Capacity will be
acquired by holding RFPs and offering the awardees Maryland ORECs.
U.S. DEPARTMENT OF ENERGY OFFICE OF ENERGY EFFICIENCY & RENEWABLE ENERGY 33Project-Specific Offtake Agreements U.S. Market
Update 3
Offtake Offtake
Project Name Details
State Mechanism
A term sheet was approved by the Maine Public Utilities Commission in 2013. This has not
been executed into a PPA. In 2018, the Maine Public Utilities Commission reopened the
Aqua Ventus I ME PPA
previously agreed-upon term sheet because of significant changes in the energy market since
2013.
Rhode Island’s Department of Energy Resources evaluated project proposals within
Massachusetts 83C RFP in an effort to help meet Rhode Island’s 1,000-MW-by-2020 goal and
Revolution Wind RI PPA selected Deepwater Wind’s 400-MW Revolution Wind project. Deepwater has until July 31,
2018, to reach an offtake agreement with an electric distribution company.
Block Island’s PPA is a 20-year agreement with National Grid for 30 MW of capacity. The price
Block Island Wind Farm RI PPA
of electricity increases 3.5% annually.
Connecticut issued a competitive solicitation in 2018 to potentially obtain a maximum of
825,000 MWh annually (~200 MW) from offshore wind under a PPA with a maximum duration
Revolution Wind CT PPA of 20 years. Project(s) must connect into ISO New England. Deepwater Wind’s 200-MW
proposal was selected as the winner. PPA negotiations with electric distribution companies are
ongoing.
Massachusetts issued an RFP to obtain between 200 and 800 MW of offshore wind capacity.
Vineyard Wind MA PPA Vineyard Wind’s 800-MW proposal was selected as the winner. Vineyard Wind has until July
31, 2018, to reach an offtake agreement with an electric distribution company.
South Fork’s PPA is a 20-year agreement with Long Island Public Power Authority for 90 MW of
South Fork NY PPA capacity at a yet-to-be-determined price. Harrington (2017) reports that the PPA is estimated
to be around $160/MWh.
Skipjack was awarded ORECs that are 20 years’ worth of MD ORECs for 120 MW of capacity.
Skipjack MD MD ORECs Each year, 455,482 ORECs will be sold with each credit valued at $131.93/MWh.
US Wind was awarded ORECs that are 20 years’ worth of MD ORECs for 248 MW of capacity.
US Wind MD MD ORECs Each year, 913,845 ORECs will be sold with each credit valued at $131.93/MWh.
Signed a memorandum of understanding to provide Cleveland with 25% of its generation at an
Icebreaker OH PPA undisclosed price. American Municipal Power agreed to purchase 30% of its generation.
Cuyahoga County signed a 10-year PPA to buy 8.6% of the project’s output.
U.S. DEPARTMENT OF ENERGY OFFICE OF ENERGY EFFICIENCY & RENEWABLE ENERGY 34Research and Development U.S. Market
Update 3
• DOE provided $20.5 million and selected NYSERDA to administer a public-private R&D consortium
focused on addressing U.S.-specific offshore wind research (June 2018).
• DOE’s two Offshore Wind Advanced Demonstration Projects, LEEDCo’s Icebreaker (OH), and University
of Maine’s Aqua Ventus I (ME) continue to progress through permitting and offtake processes.
• Clemson and MHI Vestas Offshore Wind agreed to utilize the Clemson 15-MW dynamometer to test
and validate the V164-9.5-MW turbine’s drivetrain (October 2017); the Clemson dynamometer facility
development was supported with DOE funds (Clemson University 2017).
• The New York State Offshore Wind Master Plan presented a collection of 24 analyses that identified
the best areas for offshore wind development, described potential economic and environmental
benefits, evaluated procurement mechanisms, analyzed cost reduction pathways, explored impact
mitigation options, assessed infrastructure/supply chain requirements, and identified workforce
development opportunities (December 2017).
U.S. DEPARTMENT OF ENERGY OFFICE OF ENERGY EFFICIENCY & RENEWABLE ENERGY 35Research and Development (continued) U.S. Market
Update 3
• NYSERDA issued a $5 million RFP to collect metocean data in potential offshore wind development
sites off New York’s coast using two floating lidar buoys (NYSERDA 2018).
• Bay State Wind signed agreements with the International Brotherhood of Electrical Workers; the Utility
Workers Union of America; the International Association of Bridge, Structural, Ornamental, and
Reinforcing Iron Workers; Bristol Community College; and the Massachusetts Maritime Academy to
develop an offshore wind workforce training center (Bay State Wind 2018d).
• Bay State Wind announced $2 million in grants for programs and R&D to protect New England fisheries
and whale populations and mitigate the potential impact of offshore wind activities (Bay State
Wind 2018e).
• Vineyard Wind announced a $10 million offshore wind industry supply chain accelerator, a $2 million
workforce development program, and a $3 million program to develop innovative ways to mitigate
marine mammals from offshore wind installation activities (Vineyard Wind 2018).
• The Commonwealth of Virginia Department of Mines, Minerals and Energy issued an RFP to conduct
an offshore wind supply chain and port infrastructure assessment to inform the long-term
development of offshore wind in Virginia (Commonwealth of Virginia Department of Mines, Minerals
and Energy 2018).
• The California Energy Commission signed a memorandum of understanding with the Danish Energy
Agency to share knowledge, data, and best practices relevant to developing offshore wind energy
(California Energy Commission 2018).
U.S. DEPARTMENT OF ENERGY OFFICE OF ENERGY EFFICIENCY & RENEWABLE ENERGY 364 Global Market Update U.S. DEPARTMENT OF ENERGY OFFICE OF ENERGY EFFICIENCY & RENEWABLE ENERGY 37
Highlights                                                                                  Global Market
                                                                                                   Update       4

    Europe
    •    During 2017, offshore wind auctions were held in Germany, the Netherlands, and the United Kingdom
         for projects with commissioning dates between 2021 and 2025. Auction prices were significantly lower
         than those from prior years and resulted in auction results that were termed as “zero-subsidy” bids in
         the German and Dutch auction (see additional detail in the Costs and Pricing Trends section).
    •    The Crown Estate announced that new seabed rights might be made available for offshore wind
         projects in late 2018 or early 2019 off the coast of England, Wales, Scotland, and Northern Ireland. As
         of May 31, 2018, it is no longer accepting applications for offshore wind farm extensions.
    •    The “Provence Grand Large” (24 MW) and “Groix & Belle-Ile” (24 MW) floating projects have submitted
         their consent applications, while results from France’s third round of floating auctions (“Dunkirk”) for
         bids of 250‒750 MW were announced in March 2018.
    •    The Equinor/Masdar Hywind floating project in Scotland (30 MW) commenced commercial operation in
         2017 and achieved a capacity factor of 65% in its first 3 months of operation (November‒January)
         (Equinor 2018).
    •    After its merger, Siemens Gamesa is now the largest OEM, with a market share of 68% of globally
         installed offshore wind capacity using Siemens Gamesa turbines.

U.S. DEPARTMENT OF ENERGY   OFFICE OF ENERGY EFFICIENCY & RENEWABLE ENERGY                                      38
Highlights (continued) Global Market
Update 4
Asia
• China’s offshore wind industry has seen gradual growth since 2015, increasing grid-connected
capacity to 1.2 GW in 2017, making the country the third-largest offshore wind market in the world. As
projects from the 2014‒2016 National Offshore Development Plan continue to progress toward
construction and commissioning, the pipeline is projected to grow steadily up until 2020. In addition,
nine provinces have developed offshore goals totaling 75 GW.
• China’s offshore industry has evolved from installing turbines at intertidal sites* to deeper offshore
wind marine sites as its supply chain has matured. In 2017, most of the Chinese turbine OEMs
supplied 3- to 4-MW turbines, whereas GE and Siemens supplied 5- to 6-MW models. Chinese
manufacturers are developing 5- to 6-MW models; however, most are still in the prototype phase.
• In April 2018, the Taiwanese Bureau of Energy awarded a total of 3,836 MW of grid connection
capacity to 11 offshore wind farms proposed by seven developers. Of this total, 738 MW will be
completed by 2020, with 3,098 MW to be installed between 2021 and 2025. All the projects have
been awarded feed-in-tariff contracts. International developers captured 85% of the grid capacity and
local developers were awarded 15% (BNEF 2018).
* Intertidal regions are coastal regions where turbine foundations may not always be submerged.
U.S. DEPARTMENT OF ENERGY OFFICE OF ENERGY EFFICIENCY & RENEWABLE ENERGY 39Highlights (continued) Global Market
Update 4
• In 2018, Taiwan embarked on a clean energy transition, aiming to add 25 GW of renewable energy by
2025, including 5.5 GW of offshore wind (Jacobsen 2018).
• Taiwan launched the “thousand wind turbines project” in 2012, which established targets for land-
based and offshore wind. At the end of 2017, Taiwan had installed two demonstration turbines.
Taiwan established a feed-in tariff for offshore wind of NT$6.0437 (approximately USD$0.20) per
kilowatt-hour, which has attracted interest from experienced European developers as well as local
developers.
• Planned Asian projects are more frequently located in deeper waters than installed projects elsewhere
in the world but at a similar distance from shore.
U.S. DEPARTMENT OF ENERGY OFFICE OF ENERGY EFFICIENCY & RENEWABLE ENERGY 40Installed Capacity Global Market
Update 4
• During 2017, more than 3.5 GW of installed capacity was added, making the cumulative offshore wind
installed capacity 16.3 GW by year’s end. The Netherlands added the largest percentage of installed
capacity with 115%, followed by China (65%), and Germany (36%), among established markets.
Operating Global Offshore Wind Capacity by Market (Annual and Cumulative)
Note: The cumulative totals reported on pages 41 and 42 in comparison to pages 43 and 45 differ by 186 MW. A new data sourcing methodology was introduced in
this year’s market update. The reported cumulative total on pages 43 and 45 reflect this new data sourcing methodology. For better comparison with the 2016
Offshore Wind Technologies Market Report (Musial et al. 2017), the annual totals (and cumulative total) shown on pages 41 and 42 still correspond to the data
sourcing methodology documented in Musial et al. (2017).
U.S. DEPARTMENT OF ENERGY OFFICE OF ENERGY EFFICIENCY & RENEWABLE ENERGY 41Installed Capacity (continued) Global Market
Update 4
Share of Cumulative Installed Offshore Wind Capacity by Country
Note: The cumulative totals reported on pages 41 and 42 in comparison to pages 43 and 45 differ by 186 MW. A new data sourcing methodology was introduced in
this year’s market update. The reported cumulative total on pages 43 and 45 reflect this new data sourcing methodology. For better comparison with the 2016
Offshore Wind Technologies Market Report (Musial et al. 2017), the annual totals (and cumulative total) shown on pages 41 and 42 still correspond to the data
sourcing methodology documented in Musial et al. (2017).
U.S. DEPARTMENT OF ENERGY OFFICE OF ENERGY EFFICIENCY & RENEWABLE ENERGY 42Installed Capacity (continued) Global Market
Update 4
• Offshore wind projects in China comprised only 11.2% of the installed global capacity at the end of
2017; however, China has the largest capacity of offshore wind projects under construction (3.2 GW),
followed by the United Kingdom (2.6 GW) and Germany (1.9 GW).
Comparison of Market Share for Projects that Operating vs. Under Construction
Note: The cumulative totals reported on pages 41 and 42 in comparison to pages 43 and 45 differ by 186 MW. A new data sourcing methodology was introduced in
this year’s market update. The reported cumulative total on pages 43 and 45 reflect this new data sourcing methodology. For better comparison with the 2016
Offshore Wind Technologies Market Report (Musial et al. 2017), the annual totals (and cumulative total) shown on pages 41 and 42 still correspond to the data
sourcing methodology documented in Musial et al. (2017).
U.S. DEPARTMENT OF ENERGY OFFICE OF ENERGY EFFICIENCY & RENEWABLE ENERGY 43Project Development Pipeline Global Market
Update 4
• Developer announcements indicate the global project development pipeline will grow annually by 24%
(compound annual growth rate) through 2023. This growth rate is supported by an uptick in global
installations in 2020, when 5.6 GW of Chinese offshore wind projects are scheduled to commence
commercial operation.
Developer-Announced Project Pipeline through 2023
U.S. DEPARTMENT OF ENERGY OFFICE OF ENERGY EFFICIENCY & RENEWABLE ENERGY 44Project Development Pipeline (continued) Global Market
Update 4
• The project pipeline in Europe is the most advanced, whereas a relatively large share of Asian and
North American projects are in the planning stages.
Operating and Developmental Pipeline for Offshore Wind Projects by Global Region
Note: The cumulative totals reported on pages 41 and 42 in comparison to pages 43 and 45 differ by 186 MW. A new data sourcing methodology was introduced in
this year’s market update. The reported cumulative total on pages 43 and 45 reflect this new data sourcing methodology. For better comparison with the 2016
Offshore Wind Technologies Market Report (Musial et al. 2017), the annual totals (and cumulative total) shown on pages 41 and 42 still correspond to the data and
sourcing methodology documented in Musial et al. (2017).
U.S. DEPARTMENT OF ENERGY OFFICE OF ENERGY EFFICIENCY & RENEWABLE ENERGY 45You can also read