WIND PROSPECTING ON THE CANARY ISLANDS - Geoffrey Hill - GÖTEBORG 2003 Department of Physical Geography
←
→
Page content transcription
If your browser does not render page correctly, please read the page content below

EARTH SCIENCES CENTRE
GÖTEBORG UNIVERSITY
B348 2003

   WIND PROSPECTING ON THE CANARY
              ISLANDS

                        Geoffrey Hill

               Department of Physical Geography
                      GÖTEBORG 2003
GÖTEBORGS UNIVERSITET
Institutionen för geovetenskaper
Naturgeografi
Geovetarcentrum

       WIND PROSPECTING ON THE CANARY
                  ISLANDS

                                            Geoffrey Hill

ISSN 1400-3821                                                                B348
                                                                              Projketarabete
                                                                              Göteborg 2003

Postadress               Besöksadress         Telefo          Telfax          Earth Sciences
Centre Geovetarcentrum   Geovetarcentrum      031-773 19 51   031-773 19 86   Göteborg University
S-405 30 Göteborg        Guldhedsgatan 5A                                     S-405 30 Göteborg
                                                                              SWEDEN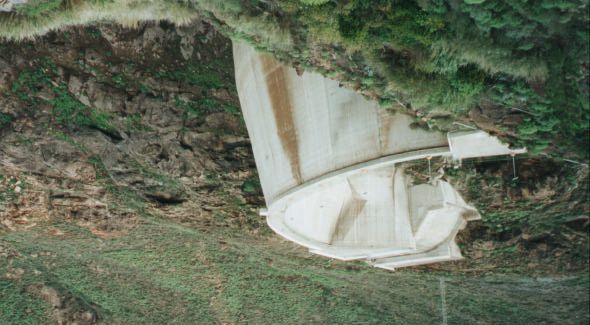
SUMMARY

   This thesis has been conducted to examine what information is required, when a potential
site for the establishment of a wind turbine is being prospected in respect to roughness class
of the area around the site, the influence of obstacles and the effect of local orography. Six
different sites on the Canary Islands have been compared, using information taken from the
European Wind Atlas and with the help of a computer program accessible from the Danish
Windpower Organisation. For each of the sites examined a Weibull distribution plot was
drawn and a wind speed comparison carried out. After recalculation from 10 metres to 100
metres a wind turbine power calculation established how much power a Vestas 600 kW wind
turbine could be expected to produce. One island, Gran Canaria, showed better results than
the others, and has been examined in more detail.
   On site wind speed measurements at nine different sites were carried out on Gran Canaria,
to examine any connection between increased height above sea level and increased wind
speed. In six of the nine measurement series a positive connection could be made reaffirming
the fact that the wind speed increases with higher altitude. This fact then brought up the
question as to why no windturbines were located at altitudes exceeding 200 m above sea level
or further in land than two kilometres from the coast. Another question raised was as to why
there are no sea based windturbines around Gran Canaria. Having studied sea charts of the
area, no suitable shallow offshore locations could be identified. The low altitude of the
present windturbines near the coast was presumed to be a result of, amongst other things,
inadequate access roads and lack of an established grid system further in land.
    Some speculation is made about the wind turbines already established on Gran Canaria, in
regards to their location, their importance for electrical production and for their proposed
future use in the desalination of sea water.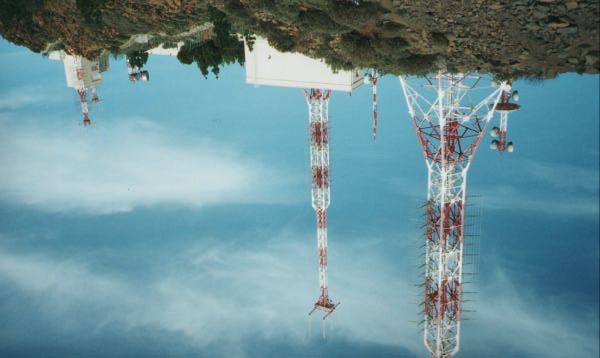
2

2

3

INDEX

  Summary

  Foreword                                                     4

1 Introduction
  1.1      Purpose of the study.                               5
2 Wind and Windturbines
  2.1      Coastal Zones.                                      6
  2.2      Effects of height.                                  6
  2.3      Sea Based Windturbines.                             7
  2.4      Alternative Employment.                             7
  2.5      Power Fluctuations.                                 8
  2.6      Wind Parks.                                         8
3 Description Of The Canary Islands
  3.1      Geological Origin.                                  9
  3.2      Wind Systems.                                       10
  3.3      Natural Resources.                                  12
  3.4      Spain and Wind power.                               13
  3.5      Wind Effects on Vegetation.                         13
  3.6      Station Location and Description.                   14
4 Method
  4.1      Method.                                             20
  4.2      Equipment.                                          20
  4.3      Weather Problems and Inaccuracies.                  20
  4.4      Sitting.                                            21
  4.5      Roughness Class.                                    21
  4.6      Shelter.                                            22
  4.7      Weibull Distribution.                               22
  4.8      Wind Power.                                         23
  4.9      Quantitative representation of wind resources.      24
5 Result
  5.1      Weibull Distribution Plots.                         25
  5.2      Wind Speed Calculation.                             27
  5.3      Wind Turbine Power Calculator.                      28
  5.4      Wind Speed Measurement Series Analysis.             29
  5.5      The Position of Gran Canaria Windturbines (1998).   35
  5.6      Crowded at the top.                                 38
6 Discussion                                                   40
7 Conclusion                                                   41
8 References                                                   42

                                               3
4

FOREWORD

    This thesis is part of a fourth term D course in geography at Göteborg University. The work
is equivalent to 10 points, half a term.
   I have considered wind power as a clean and unending source of power for the last ten
years and have bought shares in various wind projects in Sweden. I have also worked
politically to try and ease the way for groups applying for building permission. I have been on
trips to Denmark and visited both wind turbine manufacturing factories and wind turbine
parks. All of which helped to confirm my commitment to wind turbine energy production. My
work in Gambia and travels to other developing countries made me realise that their need for
cheap, clean energy could be satisfied with the help of wind turbines.
    I decided that to be of any use in helping to establish wind parks in developing countries I
needed not only enthusiasm, but knowledge as to what is required. This knowledge would
help me to be more critical of what the salesmen had to say, make me more aware of what the
consultants reports said and help me to translate this information to any politicians and
financiers involved in prospective projects.
   The Canary Islands were chosen as the site of my thesis because even though they are close
to the African continent, they are part of Europe and thus included in the European Wind
Atlas. I had tried to get information about wind conditions in The Gambia without success.
Having visited the Canary Islands, like many other tourist, I became aware of how far the
Island Authorities had already come in the establishment of wind turbine parks. The fact that
they consist of islands also interested me as I think islands throughout the world are certainly
prospective customers for wind turbines as the have plenty of coast but lack the connection to
mainland power sources.
    I would like to thank my supervisors Docent Björn Holmer and Docent Torbjörn
Gustavsson, for their help and guidance. I would also like to thank Mona Kock of the
magazine Windpower Monthly, for allowing me access to their database, Rikke Anne Nielsen
of Risoe National Laboratory, Alan Armour of Vestas and all the others who responded to my
pleas for help from a poor student.

Sollebrunn November 9th 2001

                                               4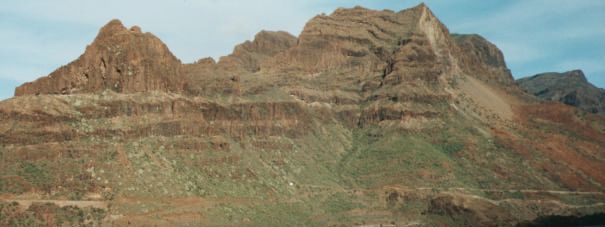
5

1 INTRODUCTION

    A tremendous amount of research is going on throughout Europe into the technical
development of the actual windturbines. Design consolidation has taken place with three
bladed designs predominating to an even greater extent than previously. There is increasing
use of variable speed systems. A major recent innovation has been the introduction of direct
drive generator technology (Wind Energy in Europe, 2001-11-08). The result of this research
is larger more effective wind turbines.
   At the school of Electrical and Computer Engineering at Chalmers Å. Larsson has
published a paper “The Power Quality of Wind Turbines”. His research is relevant to the
windturbines on the Canary Islands where they have had problems with grid instability on a
network mainly fed by conventional diesel-driven thermal stations. When the windturbines
produce too much electricity for the grid system, overloading and cut outs sometimes result.
With the aid of this knew technique more windturbines can be connected to the established
grid system without the risk of overloading it.
   Research is going on to locate new sites for windturbines on the Canary Islands and to
establish which particular windturbine modal is best suited to the area. The head of this
project is F. Ortega, Wind Division Co-ordinator, Centro De Investigacion En Energia Y
Agua, Instituto Tecnologico de Canarias, Las Palmas.
    Gazzilli (2001) from the University of Rome published a paper called “ In search of
mountain sites suitable for wind farms in the Mediterranean area using a diagnostic wind
model”. He states that “ Areas of complex topography provide the best candidate sites for
wind farms, because the local flow is enhanced by topographic features. Differential heating,
related to mountain slopes, gives rise to periodic mesoscale patterns in the lower layers”. The
object of his paper is to show how diagnostic numerical modals can be utilised for the siting
of wind farms in regions of complex topography.
    At the Risoe National Laboratory, the Department for Wind Energy is carrying out various
research projects including sea based wind park assessments. Unfortunately no one there has
time to talk to me, unless I am prepared to pay. They service the Danish wind industry or sell
books and courses on wind related subjects, including the European Wind Atlas.

1.1 Purpose of the study.

   The purpose of the study has been, to ascertain which of the Canary Islands has the best
wind conditions for the placing of a windturbine, if wind speed increases with increased
altitude and if so, to ascertain why no windturbines have been placed over the altitude of
200 m on the island of Grand Canary.

                                               5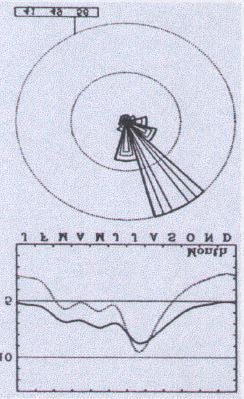
6

2 WIND AND WINDTURBINES

2.1 Coastal Zones.

Sea breezes are generated in coastal areas as a result of the different heat capacities of sea and
land, which give rise to different rates of heating and cooling. The land has a lower heat
capacity than the sea and heats up quickly during the day, but at night it cools more quickly
than the sea. During the day, the sea is therefore cooler than the land and this causes the
cooler air to flow shorewards to replace the rising warm air on the land. During the night the
direction of air flow is reversed (Boyle 1996. page 275).

2.2 Effects of height.

    Hills exert a profound influence on the flow of wind. Height changes in the terrain also
influence the flow. A height increase of 5% can have a 5% impact on the mean wind speed,
possibly at hub height, resulting in a 15% increase of the available power
(Petersen 1989, page 64).
    Orography gives rise to many local winds, such as föhns, mountain and valley winds,
mountain-gap winds, and katabatic winds. Depending on their magnitude and frequency of
occurrence they may give rise to sizeable wind energy potentials (Petersen 1989, page 72).
Areas of complex topography provide the best candidate sites for wind farms, because the
local flow is enhanced by topographic features. Differential heating, related to mountain
slopes, give rise to periodic mesoscale patterns in the lower layers (Gazzilli 2001, page 205).
    The wind power depends on the thermal stability and mean wind. It is necessary to
consider the different frequencies of occurrence of various patterns. Valley and mountain
winds usually occur with a diurnal periodicity in regions of complex terrain (Gazzilli 2001,
page 206).
    A problem arises when it is necessary to estimate the wind speed at a height different from
that at which the wind was measured. The rate at which wind speeds increase with height
varies with vegetation, terrain, and climate. The increase in wind speed with height is greatest
over rough terrain or numerous obstacles, such as in the suburbs, and smallest over smooth
terrain, such as the surface of a lake (Gipe 1998, page 147). There are two approaches to
estimating the increase in wind speed with height: the power law method common in North
America, and the logarithmic method in Europe (Gipe 1998, page 149).
    Logarithmic extrapolation is derived mathematically from a theoretical understanding of
how the wind moves across the surface of the earth. The power law equation is derived
empirically from actual measurements. It is commonly assumed in North America that the “
1/7 power law” applies. This often under estimates wind speed at hub height but helps to
counterweight the over optimistic projections of annual energy production by wind energy
proponents. The effect of height on wind speed is so important that it requires the help of
meteorologists.
    Computer models are now used in an attempt to predict the effects of topography on wind
speed. Data from the nearest wind measurement station, together with a description of its site,
are required and local effects are taken into account to arrive at estimated wind data for the
proposed wind turbine site. Used with care, such models can be useful for carrying out initial
assessments to identify potential wind energy sites (Boyle 1996, page 294).
    The wind speed does not increase with height indefinitely. Wind speed variations with
height measured at Merida airport in Mexico suggested an increase in wind speed from 6 m/s
at sea level to 11 m/ s at 700 m altitude, then a drop back to 6 m/s at 2400 m altitude

                                                 6
7
(Patel 1999, page 56). It is preferable to measure the actual speed distribution at the height at
which the turbine will operate (Gipe 1998, page 149).
2.3 Sea Based Windturbines.
Offshore wind energy is an extremely promising application of wind power, particularly in
countries with high population density, and thus difficulties in finding suitable sites on land.
Construction cost are much higher at sea, but energy production is also much higher.
(Krohn, 2000)
If wind turbines are to increase in size, locating them on land sites will inhibit their potential
growth. This is because their increased weight would require better access roads for the lifting
cranes and few suitable sites have the necessary infrastructure. Transportation from a
manufacturing company to a wind site often includes road, ship, then road again. This
requires expensive equipment and extra cost, sometimes adding too much to the total cost of
the project, making it sometimes unfeasible. A wind turbine manufactured close to a suitable
harbour, can be loaded onto a ship for transportation to potential customers accessible by sea,
anywhere in the world. Suitable lifting equipment on a sea going vessels, has the mobility to
reach potential windfarm sites in coastal areas, anywhere a vessel can reach.
A suitable coastal area would be 14 km from the mainland with a depth of 10 m. This
distance from the mainland means that the turbines can hardly be seen from land. The present
technique entails a 30 m concrete pole being pushed into the sea bed to a depth of 20 m. The
remaining 10 m reaching the sea surface, over which the windturbine is placed. This
monopole system means that the sea bed does not have to be levelled off, cutting cost.
(Sidén , lecture 2001-04-05).
The newest offshore turbines have rotors with a diameter of up to 80 m longer than the
wingspan of a Boeing 747. No doubt they will get even bigger. Blades seem to grow by 5m a
year as companies find solutions to manufacturing obstacles. Although five nations
(Denmark, Germany, the U.S., Spain, and India) now account for 80% of the world’s wind
turbines, they exist in 50 countries (Muller, 2001, page 40).
On average a similar windturbine placed at sea produces 50% more electricity than one
placed on land. This is because the wind is less turbulent at sea, which also reduces the wear
and tear on the equipment, prolonging its production life. Modern windturbines can now
deliver direct current (D.C.), so no expensive transformer is needed. The modern generators
work on a variable number of revolutions with frequency converters which means that they
can produce electricity at varying wind speeds. Generally speaking the sea winds blow when
the power is most needed, during the day and in the winter (Sidén , lecture 2001-04-05) .
I have studied the sea charts for the Canary Islands, an extract from which is shown in
figure 22, (Gran Canaria) and on a larger scale, figure 5. From these sources it can be seen
that the Canary Islands have very little shallow water coast, suitable for sea based wind parks.
The sea depth between some of these islands is up to 2000 metres, which makes it very
expensive to have power lines between the islands. Each island has its own independent
power source (Ortega, Interview 2001-12-18).
2.4 Alternative Employment.
A Spanish state-run weapons factory has recently been converted into a wind turbine blade
plant in co-operation with LM Glasfiber in Denmark. Dozens of redundant shipbuilders are
being drafted into the wind industry. Town mayors across the country, aware of the economic
incentives which can attract wind power revenues to their regions, are offering to rent
municipal land to potential developers in key windy areas.
78
Spain’s new electricity law, the Ley del Sistema Electrico, could stimulate wind power
growth even further. Like in the deregulated Swedish electricity market, the new law will
allow consumers to purchase power from whatever company they choose, permitting
environmentally conscious customers to get their electricity from companies who have wind
farms. Under Spain’s increasingly strict environmental policy, wind will continue to enjoy its
privileged position, premium prices included, well into the future.
(Windpower Monthly News Magazine, February, 1996:34).
2.5 Power fluctuations.
The operation of wind turbines has an impact on the power quality of the grid it is
connected to. Depending on the grid configuration and the type of wind turbine used, different
power quality problems may arise. All wind turbines have an uneven power production
following the natural variations of the wind. If the wind turbine is operating at fixed-speed,
the tower shadow and wind speed gradients will result in fluctuating power. The power
fluctuations caused by the turbine may cause flicker disturbances. In order to evaluate the
significance of flicker, measurements and subsequent flicker calculations must be performed.
In the case of variable-speed wind turbines, one drawback is the injection of harmonic
currents into the grid. Depending on the type of inverter used, different orders of harmonics
are produced. Fortunately new recommendations provide tools for predicting the interaction
between wind turbines and the grid and any incompatible units can be rejected at an early
stage in the planning of a new wind turbine park (Larsson, 2000).
2.6 Wind Parks.
Grouping wind turbines together permits much larger amounts of energy to be produced
from a given site. The capital invested in the project is spread over a number of machines, so
that if a turbine has to be shut down for any reason, the other machines can still continue
operating, continuing to produce energy and generate revenue. Infrastructure and maintenance
costs can be spread over all the machines. It is more cost effective to connect several wind
turbines to the grid than one. Running an operation and maintenance crew is cheaper per
machine, if the crew is managing or maintaining a group of machines (Boyle, 1996, p 271).
Usually an energy loss of around 5% would have to be allowed for in a wind park, as the
turbine in front slows down the wind behind it as it pulls energy out of the wind and converts
it to electricity (Krohn ,2000).
Every wind turbine I saw on Gran Canaria was in a wind park, sometimes concentrating up
to 30 wind turbines. Most wind parks on the east side of Gran Canaria seem to have the
turbines in a straight line, stretching from the coast to an inland boarder caused by the east
coast motorway. The next wind park, often with different modals and different owners, ran
parallel to the preceding wind park, separated by 200 metres of waste land. This layout seems
to offer maximum exposure to the northern winds with minimal wind shade from the hills
further inland.
89
3 DESCRIPTION OF THE CANARY ISLANDS
3.1 Geological Origin.
The Canary Islands of Spain are of volcanic origin, situated in the north Atlantic between
39 45' and 14 49' N, and between 31 17' and 13 20'W, 111 km off the north western coast of
Africa. They are characterised by rugged shorelines surrounded by an irregular oceanic
seabed. Their sublittoral slopes are steep and usually drop to great depths quite close to the
shoreline. Rocky sea beds are found everywhere, while sandy, clay or shell sediments are rare
though they are more common in the eastern islands. The rocky bottoms are very uneven and
craggy, with many shallows, cliffs and underwater caves (Montelongo, 2000, page 185).
There are seven major islands (Tenerife, Gran Canary, Fuerteventura, Lanzarote, La Palma,
La Gomera and El Hierro), several small islets and several rocks. The total land surface being
7542 km² with a total of 1490 km of coastline (Montelongo, 2000, page 185).
These islands have emerged from the ocean as a result of continental drift and the
accumulation of lava from several volcanic eruptions. They have emerged independently from
each other, and there are depths of between 1500 to 2000 m in the channels between them.
The small land area of these islands makes their slopes very steep, often resulting in great
depths close to the shoreline. The relatively short geological history of this area means that
their surrounding submerged platforms are small, not more than 200 m wide around most of
the islands. Many of these platforms have been further reduced in size by later lava flows
from successive volcanic eruptions. The older islands (Gran Canary, La Gomera,
Fuerteventura, and Lanzarote) have larger platforms towards their south-south-eastern coasts,
as much as 30 km wide around Fuerteventura (Montelongo, 2000, page 187).
Figure 1 shows a typical scene of mountain ranges on Gran Canary, in this case the photo
was taken while on a wind measurement recording trip (B). The uneven terrain at the highest
point makes it an unsuitable candidate as a potential site for a wind turbine park, despite the
relatively good wind conditions. Access is extremely limited and the volcanic rock is not a
firm foundation to build windturbine platforms on.
Fig.1 Scene looking west towards Morro de loss Majanos, 932 m. Photo Geoff Hill.
910
3.2 Wind Systems
Sinking air over the horse latitudes spreads out in both southerly and northerly directions.
In the northern hemisphere, the southerly moving winds become deflected to the west and
become the persistent north-east trade winds. The trade winds are the most constant winds and
can often blow for days or even weeks with only slight variation in direction and strength
(Boyle 1996, page 274). These blow towards the Canaries and present markedly seasonal
variations. They predominate in summer (90-95%) and less frequent in winter (50%). and
result in stable weather with stratus-cumulus clouds to the north of the islands and clear skies
toward the south. The Azores anticyclone is the primary factor resulting in the Trade Winds
and the stable weather.
Figures 6 to 11 give some indication of the wind patterns the Canary Islands are exposed
to. These show the wind roses for the varies stations included in this thesis and the
predominating wind direction is north to north-east. A noticeable increase of the recorded
wind speeds, during the month of July and sometimes August, can be observed.
When high pressure moves towards the west, outbreaks of colder air masses from the north
and, less frequently , hotter outbreaks from the Sahara may reach the islands. Another
consequence of the Trade Winds is the stratification of low troposphere into two layers, the
lower layer being wet and fresh and the upper layer dry and hot. This thermal inversion layer
is found between 950 m and 1500 m above sea-level and forms a sea of cumulus clouds
towards the north of the islands with the highest altitudes, where the altitude blocks the
passage of wind (Montelongo 2000, page 188).
The yearly as well as the daily variations of wind speed, are affected by both the large-scale
and the local conditions, but yearly variations is usually indicative of the regional
climatology. The Canary Islands, situated in the Trade Wind Belts, show a maximum during
the summer months, as compared with most areas in northern Europe, which have a minimum
in the same months (Petersen 1989, page 33). Figure 2 shows the prevailing wind patterns in
the winter and summer. The Canary Islands are exposed to the trade winds in both seasons.
1011
Figure 2. Average surface wind patterns over the ocean. Dotted lines indicate Doldrums.
A, Northern winter; B Northern summer (McCormick 1981, page 223).
1112
3.3 Natural Resources.
The Canary Islands have limited natural sources of energy, few running streams and hardly
any woodland. What they do have is ample wind, and for centuries have used wind power to
grind grain, and to pump water. (Berry 1997)
In 1996 plans were made by the authorities on the Canary Islands, that over the next ten
years, would multiply the archipelagos installed capacity by five, upping its current 26 MW to
128 MW. Even in 1996 the archipelago had the biggest wind power output in all of Spain,
with its 146 turbines. According to Sinda Hernandez Gonzalez of the Canary Islands
commerce and industry ministry, the Government has allotted most of the wind plant to Gran
Canaria (50 MW). The planned increase in wind power is part of the archipelagos renewable
energy plan for the region. The planned wind power projects in Gran Canaria did go ahead,
and this alternative form of energy now represents 15% of the entire islands demand.
(population 650 000). A similar situation has taken place on Tenerife (population 600 000)
(Murphy 1998, page 19).
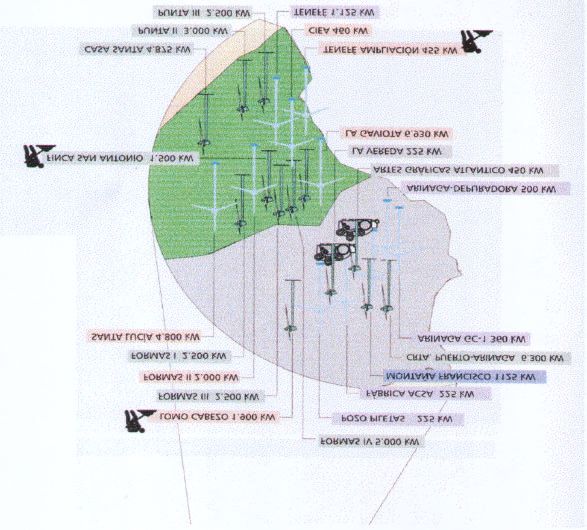
Fig. 3 A dried out fresh water reservoir at Embalse de Cueva de las Ninas. Photo Geoff Hill.
Fresh water is a natural resource where demand outweighs supply. There has been
insufficient rain to fill the water reservoirs on Montana Vista de Soria for the last seven years,
according to the local inhabitants I talked with. All four reservoirs were dry during my visit,
which is supported by the picture of the dry dam at Embalse de Cueva de las Ninas, shown in
figure 3. To help alleviate the shortage of fresh water, desalination of sea water is carried out.
Desalination supplies Gran Canaria with 30% of its fresh water according to information
given to me in an interview with Francisco Ortega (Wind Division Co-ordinator at the
Institute Technologic de Canaries). Wind turbines supply much of the energy required to
carry out this process.
There are no natural supplies of oil in the region, so everything is imported, including the
oil required to supply the electrical power stations on the various islands. Over 4000 metric
tonnes per year of crude oil are imported to the Canary Islands. (Estadisticas Energeticas de
Canarias 1998, p 12). There are no power cables connecting the islands, due to the sea depths,
1213
so each island produces its own power independently. On Gran Canaria there are two power
stations which produce annually 2500 000 MWh (Estadisticas Energeticas de Canarias 1998,
p 26) This is roughly 40% of the electric power manufactured in the Canary Islands, and the
demand for more power is steadily rising each year.
3.4 Spain and Wind power.
In 1996 it was predicted that Spain could be the biggest wind power producer in Europe by
the turn of the century. Planned projects included wind parks on the Canary Islands and in the
mainland regions of Galicia, Aragon, Asturias, Navarra and Catalunya. Reasons for this
optimism include the fact that many other European countries are either over populated or too
small for the kind of development being planned. Spain is neither small nor over populated
and in some areas, blessed with the perfect meteorological conditions required for wind
turbine electrical production. (Windpower Monthly News Magazine, February, 1996).
Having looked at The Windicator, a chart of operating wind power capacity, broken down
by country and by region, it can be seen that Spain almost achieved its objective. By the end
of the year 2000 it was producing 2402 Megawatts from wind power sources, second only to
Germany at 6113, and beating Denmark, who came in at third place with 2297 Megawatts.
(Windpower Monthly News Magazine, Windicator, 2001-10-22). These figures may not be
very accurate, but they do give an indication that Spain is taken wind power seriously.
3.5 Wind Effects on Vegetation.
Fig 4. Tilting tree due to prevailing northern winds. (Photo Geoff Hill).
The prevailing winds blowing from the north and north-east have a profound effect on the
local vegetation. This can be seen in figure 4. The photo was taken from the eastside and
shows the tree leaning towards the south, as it is exposed to the northern winds. There was far
less visible evidence that the wind had a profound effect on the vegetation on the south or
west side of the island. These areas are protected from the prevailing winds by the mountains.
The east coast exposure to the wind, and vegetation evidence, corresponded with the
establishment of the windturbine parks.
1314
3.6 Station Location and description.
The location of each station can be seen in figure 5. The graphical presentation of wind
data for each site helps to give a compact and informative overview. The station description
comprises the geographical location, a description of the setting and surroundings of the
station. The elevation of the station is given in metres above sea level (m a.s.l.).
The relative frequencies of winds coming from each of twelve sectors are shown in a wind
rose (the circle graph) for each site by the radial extent of the circle segments spanning the
sectors (thick lines). The contribution from each sector to the total mean speed and to the total
mean cube of speeds are given as the narrower segments and the central segments
respectively. For each quantity the normalisation is such that the largest segment extends to
the outer dotted circle. The corresponding value for each of the three quantities is given in the
small box in per cent. The inner dotted circle corresponds to half of this value (Petersen, 1989,
page 110).
Wind roses vary from one location to the next and form a meteorological fingerprint. Wind
roses from neighbouring areas are often fairly similar so it is often safe to interpolate the wind
roses from surrounding observations. They only tell you the relative distribution of wind
direction, not the actual level of the mean wind speed (Krohn 2000).
The average seasonal variation of the measured wind speed (full line) and cube of wind
speed (dashed line) is shown in the square graph. All data associated with the same calendar
month are averaged and the results plotted at the midpoint in each of the indicated monthly
intervals. The unit on the ordinate is msι for mean speeds and m³sγ for the mean of the cube
of the wind speed. Values read from the graph must be multiplied by the scale factor of 100
for the full line and one for the dashed line.
1415
Fig. 5 Map of the Canary Islands, showing bathymetry and station locations.
(Montelongo, 2000, page 186).
1) Tenerife (Los Rodeos) 28 28' 10" N 16 19' 04" W.
605 m a.s.l. 5,0 m a.g.l, mean 6,5 m/s. This observation site is located at the airport on the
island of Tenerife, 35 km NE of the mountain Pico de Teide (3715 m). The terrain slopes
down to the sea in all sectors except SW. Scattered houses and trees appear outside the airport
(Petersen, 1989, page 466).
1516
Fig. 6 Tenerife (Los Rodeos) Wind Rose and Mean Year.
2) Tenerife (Reina Sofia) 28 02' 00" N 16 34' 00" W.
Fig. 7 Tenerife (Reina Sofia) Wind Rose and Mean Year.
72 m a.s.l. 6,0 m a.g.l, mean 5,4 m/s. This observation site is located 2 km N of the S
coast of the island of Tenerife. The island slopes from the sea to the summit of Pico de Teide
(3715 m), 25 km to the North (Petersen 1989, page 468).
1617
3) Las Palmas 27 55' 45" N 15 23' 20" W.
Fig. 8 Las Palmas, Wind Rose and Mean Year.
24 m a.s.l. 4,5 m a.g.l , mean 7,0 m/s. This observation site is located at Gando airport on
the E coast of the island of Gran Canaria. The coastline is about 500 m to the E. The island of
Gran Canaria is roughly circular with a diameter of about 50 km and a height of 1900 m.
(Petersen 1989, page 446).
4) Lanzarote 28 56' 06" N 13 36' 35" W
Fig. 9 Lanzarote, Wind Rose and Mean Year.
1718
20 m a.s.l. 6,0 m a.g.l, mean 6,9 m/s. This observation site is located at the airport on the
island of Lanzarote, 5 km WSW of the city of Arrecife. The coastline to the south is oriented
WSW-ENE. A chain of hills, the most important being Montaña Blanca (596 m), runs parallel
to the coastline at a distance of 5 km from the observation site (Petersen 1989, page 444).
5) Fuerteventura 28 27' 00" N 13 51' 00" W
Fig. 10 Fuerteventura, Wind Rose and Mean Year.
17 m a.s.l. 6,0 m a.g.l., mean 6,2 m/s. This observation site is located at the airport on the
island of Fuerteventura, 3 km S of the city of Puerto del Rosario. The sea is to the E and the
coastline runs approx. N-S. The mountain Rosa del Taco (593 m) appears at a distance of 8
km to the West (Petersen 1989, page 436).
1819
6) El Hierro 27 48' 46" N 17 53' 07" W.
Fig. 11 El Hierro, Wind Rose and Mean Year.
31 m a.s.l. 6.0 m a.g.l. mean 7,3 m/s. This observation site is located on the E coast of the
island Hierro. The E part of the island forms a steep slope, from sea level to more than 1100
m a.s.l. in approx. 5 km (Petersen, 1989, page 434).
In temperate climates it is quite common for the wind to be stronger in winter than in summer,
and stronger during the day than at night. However having analysed the wind roses in figures
6 to 11 the conclusion can be reached that the opposite occurs on the Canary Islands. They
show that the winds blow more in the summer months, June to August.
1920
4 METHOD
4.1 Method.
The method used consisted of comparing the information gained from the European Wind
Atlas for each of the six designated sites described in 3.5 Station Location and description.
That information was then processed with the aid of a computer program obtained from the
Danish Wind Industry Association. A Weibull distribution was plotted for each site by
introducing the wind variation of the measured wind speed throughout the year. A Weibull
distribution shows the wind variation for the site during the course of a year and functions as a
probability density distribution. From this information a mean wind speed has been
determined for each site. The site which gave the best result was then examined in more
detail. Of the six sites chosen for comparison, Las Palmas had the overall best results and
Grand Canaria was chosen as the island for further investigation. If the wind speeds always
tends to be close to a certain value, the distribution will have a high k value, and be very
peaked. This is beneficial when choosing which turbine modal to place at a site.
The on site phase of my thesis, entailed nine different measurement series on the island of
Gran Canaria. A car was hired, and the wind speed at sea level measured. Travelling inland
and with increasing altitude the wind speed was measured at different intervals. The interval
variation was governed more by the terrain than a strict altitude scale. For this reason the
altitude between each site varied from 25 m to 100 m. The actual length of each measurement
series varied as it depended on the distance from the sea to the highest point of the road as it
wound its way further inland. Each site chosen had to have as little wind shade from houses
and vegetation as possible and preferably with a clear a view to the coast. Consideration had
to be given to traffic safety, especially on the hair pin bends, instead of scientific exactness, in
the choice of which altitude the wind speeds were measured. On each measurement location
the car was parked and wind speeds measured until an average speed was noted on the
handheld wind speed measurer. This was held in front of me at chest height, facing the wind.
Each measurement series took approximately two hours with on average 13 wind speeds and
altitudes being noted.
4.2 Equipment
The altitude was measured using a Casio barometer pressure sensor, module no. 2271. The
built-in altimeter uses a pressure sensor to detect the current air pressure, which is then used
to estimate the current altitude. The sensor is programmed with International Standard
Atmosphere pre-set values, which are used to convert air pressure readings to altitude values.
These readings were then compared with map issued by the tourist office, scale 1:150000.
The wind speed measurements were recorded by using a Silva handheld windwatch,
which is accurate to within +/- 4%, according to the instruction manual (Silva 2001).
4.3 Weather Problems and Inaccuracies.
The first two days of my stay on the island were wind still, so no effort was made to record
anything. The rest of the time had southerly winds, which are supposed to be unusual
according to the European Wind Atlas. The last day, when I planned to visit the northern part
of the island, started foggy and wind still, which developed into drizzle, but some
measurements could be recorded in the afternoon.
Unfortunately none of the roads used to gain altitude are straight, but serpentine up the
mountain sides, sometimes in lee of the wind, and sometimes more exposed. The roads
2021
usually followed valleys from the coast to points further in land. However at the highest most
exposed points, the wind speed usually exceeded the reading recorded at sea level. To confirm
the wind direction and that it was still blowing at sea level, binoculars were used to observe
factory chimneys at the coast, when this was possible.
Contact was made with a wind research unit on the island and a brief but productive
interview was obtained from the manager. Despite numerous attempts, no further help or
contact has been obtainable from this source.
The computer programs I used to work out different mean wind speeds would only allow
for a height increase of 100 m above the test station. Heights above this would have to be
measured on site and then compared to the measurements taken at the reference site. Due to
the short time of my stay on the island, any on site measurements would have to be purely
speculative. For this reason I have limited myself to 100 metres above each test station. It
should be noted that site 1) Tenerife (Los Rodeos) is located 605 metres above sea level and
in table 1 the highest recording (6.38 m/s) was placed at 100 m.
The latest edition of the European Wind Atlas was unavailable, so the wind information
used is somewhat dated, originating in 1982. The computer program I was lent is designed for
educational purposes, with limitations imposed on the variables that could be changed and as
a result, not very accurate.
4.4 Siting.
Siting is defined as estimation of the mean power production by a specific wind turbine at
one or more specific locations. (Petersen, 1989, page 73). A siting procedure includes the
following steps.
1) Select the appropriate regional wind climatology.
2) Determine the influence of the roughness of the surrounding terrain.
3) Determine the influence of nearby sheltering obstacles and the effect of local orography.
4) Calculate the resulting Weibull distribution and the power curve of the wind turbine.
4.5 Roughness Class
The roughness of a particular surface area is determined by the size and distribution of the
roughness elements it contains. For land surfaces these are typically vegetation, built-up areas
and the soil surface. Different types of terrain have been divided into four groups, each
characterised by its roughness elements. Each terrain type is referred to as a roughness class.
The roughness of a terrain is commonly parameterised by a length scale called the
roughness length. A roughness element is characterised by its height and the cross-section
facing the wind. For a number of roughness elements distributed evenly over an area, the
density can be described by the average horizontal area available to each element. When the
roughness elements are close together, the flow is lifted over them. The height of the lifting is
referred to as a displacement length and must be taken into account on sites with forests, cities
and tall vegetation (class 3). The energy production of a wind turbine must be determined on
the basis of climatology, primarily because of the variations of the weather; however, the
seasonal variations in the local terrain characteristics can also have a profound influence.
2122
Roughness Class. Terrain surface characteristics.
0 Sand, snow, bare soil, airport runway, open water, smooth surfaces.
1 Farmland with very few buildings or trees, open appearance.
2 Farmland with closed appearance, lots of trees or bushes.
3 Shelter belts, suburbs, cities or forest.
Figure 12 Roughness Class and surface characteristics (Petersen, 1989, page 58).
4.6 Shelter.
Shelter is defined as the relative decrease in wind speed caused by an obstacle in the terrain.
The effect of the shelter depends on its distance to the site, height, length and porosity of the
obstacle. (Petersen, 1989, page 59).
4.7 Weibull Distribution.
The presentation of wind data makes use of the Weibull distribution as a tool to represent
the frequency distribution of wind speed in a compact form (Petersen 1989, page 581).
Measured wind speeds throughout a year tend to vary from an occasional storm to a majority
of moderate to fresh winds. A histogram of measured wind speed data with a corresponding
fitted Weibull distribution, shows a probability density distribution. The area under the curve
is always exactly 1, since the probability that the wind will be blowing at some wind speed ,
including zero must be 100%.
In figures 14 to 19 the median is shown. Half of the blue area is to the left of the vertical
black line which is the median of the distribution. This means that half the time it will be
blowing to the left, lower wind speeds, and the rest of the time, to the right, higher wind
speeds. The mean wind speed is the average of the wind speed observations at this site. The
graphs show that the distribution of wind speeds is skewed, i.e. it is not symmetrical. The
most common wind speed for the site is called the modal value of the distribution.
(Krohn 2000).
For the purpose of determining the wind resources at sites in which the roughness class
changes with the wind direction, each of the 20 wind data sets has been divided into 12
further data sets according to wind direction. The parameters of the Weibull distribution
function fitted to the wind/speed direction data table with mean wind-speed values and the
corresponding mean energy contents of the wind for four roughness classes and the five
standard heights are given (Petersen 1989, page 23)
The validity of the statistics derived from a particular station depends both on the quality of
the data and the amount of information available (Petersen 1989, page 23). Most difficulties
in fitting to observed data are related to the treatment of very low and very high wind speeds.
The highest wind speeds are statistically very uncertain. At low wind speeds, limitations in
instrument response, reporting practices and data translation can lead to substantial errors in
the frequency of occurrence (Petersen 1989, page 583).
The two Weibull parameters are usually referred to as the scale parameter A and the shape
parameter k. The shape parameter, k tells how peaked the distribution is. If the wind speeds
always tend to be very close to a certain value, the distribution will have a high k value, and
be very peaked. If the shape parameter is exactly 2, the distribution is known as a Rayleigh
distribution. For a Rayleigh distribution, the wind speed which contains the highest energy on
the average is twice the most frequent speed (modal value) (Petersen 1989, page 581). The
vertical scale is the mean power at a given wind speed P(u) (Krohn 2000).
2223
4.8 Wind Power.
Power is defined as the rate at which energy is used or converted and can be expressed as
energy per unit of time, for example, as joules per second (J s-¹). The unit of power is the
watt (W) and one watt equals one joule per second, 1W = 1 J s-¹.
The energy contained in the wind is its kinetic energy and the kinetic energy of any particular
mass of moving air is equal to half the mass, m, of the air times the square of its velocity, V:
Kinetic energy = half mass x velocity squared = ½ m V²
where m is in kilograms and V is in metres per second.
The density of air at sea level is 1.2256 kg mÏ ³ at 15°c (Boyle, 1996, p 275).
Mass(m) of air per second = air density x volume of air passing each second. m = ñ AV.
Power in the wind P(watts) = kinetic energy in the wind per second (joules per second)
P = ½ ñ AV³.
The wind speed is extremely important for the amount of energy a wind turbine can
convert to electricity. If the wind speed is twice as high it contains eight times as much energy
(Krohn 2000). The power in the wind is proportional to the area through which the wind is
passing and the cube of the wind velocity. The power contained in the wind is not the amount
of power that can be extracted by a wind turbine. This is because losses are incurred in the
energy conversion process (Boyle, 1996, p 276). Even though wind turbines are now
manufactured in the mega watt size, the same principles still apply, and the size 225 kW is
representative of a vast number of modern turbines still being sold today, according to Vesta’s
sales figures. The maximum power produced by this size turbine is 225 kW. This is known as
its rated power, and the wind speed at which speed it reaches this power output, 13.5 m/s, is
known as its rated wind speed. Above this, there is a maximum wind speed, the cut-out wind
speed, at which the turbine is designed to shut down, and the blades stop turning in the wind.
This is to avoid damage in the event of high wind speeds. The lowest wind speed at which a
wind turbine will operate is known as the cut-in wind speed. At or above the rated wind
speed, the power output remains constant whatever the wind speed. Below this, the power
varies with the wind speed. Each wind turbine of a particular design, has a specific
relationship between the power it produces and the wind speed. A graph, known as the wind
speed-power curve, shown in figure 13 for this turbine, describes this relationship and must
be taken into consideration when deciding which turbine is most suitable for the prevailing
winds for a prospective site.
In temperate climates the wind tends to be stronger in winter than in summer, and stronger
during the day than at night but the opposite occurs on the Canary Islands according to figures
6 to 11. They show that the winds blow more in the summer months, June to August.
2324
Fig. 13 Wind speed-power curve for Vestas V27/225 kW wind turbine.
4.9 Quantitative representation of wind resources.
To give some kind of indication as to the amount of power or electricity that can be
produced and consumed, in one year, a certain wind turbine will be theoretically placed in the
coastal regions of the Canary Islands. The chosen turbine has a rotor diameter of 50 metres
and a rated effect of 1 MW. This can be compared to the Vestas V27, which has 27 metre
rotor diameter. The turbine is 50 metres above sea level. If one presumes that the annual
electricity consumption of one household is 4500 kWh, then in this case the number of
households turns out to be of the same magnitude as the power density at 50 metres, for this
area. Using these parameters, this wind turbine could supply electricity for over 700 houses
(Petersen 1989, page 35).
2425
5 RESULT
5.1 Weibull Distribution Plots.
Figures 14 to 19 describe the Weibull Distribution of each of the six sites under
investigation. They have been plotted on a computer program on loan from the Danish
Windpower Organisation. Information about each site has been taken from the European
Wind Atlas.
If the wind speeds always tends to be close to a certain value, the distribution will have a
high k value, and be very peaked. This is beneficial when choosing which turbine modal to
place at a site. Fuerteventura 2.78, El Hierro 2.81, and Las Palmas 2.66, have the best three k
values of the six test sites.
Fig 14 Weibull Distribution Plot for Fuerteventura.
Fig 15 Weibull Distribution Plot for Lanzarote.
2526
Fig 16 Weibull Distribution Plot for El Hierro.
Fig 17 Weibull Distribution Plot for Tenerife (Reina Sofa).
Fig 18 Weibull Distribution Plot for Las Palmas.
2627
Fig 19 Weibull Distribution Plot for Tenerife (Los Rodeos).
The separation between neighbouring stations is typically 100 km or more. Even though
the stations are situated in the same high wind regime of the NE trade winds, the high
volcanic mountains influence the flow strongly. This makes inter-comparison difficult and
each site therefore has to be judged on its own merits due to the wide fluctuation in median
results on the Weibull Distributions Plots (Petersen 1989, page 611).
The high mountains of Gran Canaria enhance the wind speeds experienced on the east
coast of the island, as the wind from the north tends to be funnelled along the coast instead of
climbing the mountains (Ortega, interview).
5.2 Wind Speed Calculation.
The mean average wind speed for each station was entered at the appropriate height into a
wind speed calculator table. This being the height above sea level for the measurement
equipment. A spread sheet for the average wind speeds at different height and roughness
classes was then calculated. Only roughness class 0 has been presented in table 1 for each site.
This is because the Weibull Distribution Plots were also calculated with this roughness class.
The results are not strictly valid if there are obstacles close to the wind turbine (up to 1 km).
However the monitoring stations used are all close to the coast which is classed as roughness
class 0, and it is from the sea the most prevailing winds were registered.
As can be seen from figure 20, Las Palmas has the greatest mean average wind speed
compared to the other five sites, 7.19 m/s at 10 m.a.s.l and 8.7 m/s at 100 m.a.s.l.
2728
10
9
8
7
Wind Speed m/s
6
5
4
3
2
1
0
Tenerife.R.S. Lanzarote Tenerife.L.R. Fuerteventura El Hierro Las Palmas
Monitoring Stations
100 m.a.s.l. 90 m.a.s.l. 80 m.a.s.l 70 ma.s.l. 60 m.a.s.l.
50 m.a.s.l. 40 m.a.s.l. 30 m.a.s.l. 20 m.a.s.l. 10 m.a.s.l.
Fig. 20 Diagram showing the six monitoring stations and their respective mean wind speeds
at heights above sea level from 0 to 100 metres.
5.3 Wind Turbine Power Calculator.
This calculation was done for each of the sites using a Vestas 600 kW wind turbine, with a
4 m/s cut in wind speed, 20 m/s cut out wind speed, 44 m rotor diameter and 100 m hub
height above sea level. The air density was set at 20°c giving 1.19079 kg/m³ density.
The wind distribution data for Las Palmas was given as 2.66 Weibull shape parameter and
8.72 m/s mean wind speed, resulting in 9.805 Weibull scale parameter. The height setting was
100 m.a.s.l with a roughness length and class of 0. The site power input results showed a
power input of 597 W/m² rotor area, with a maximum power at a wind speed of12.1 m/s with
the mean hub speed of 8.72 m/s.
The turbine power output results were 169 W/m² rotor area giving an energy output of
1481 kWh/m²/year. This could result in an energy output of 2252596 kWh/year. The capacity
factor is 43%. These results can vary up to 10% each way due to inaccuracies in wind
measurements. Only the results for Las Palmas are given here as they were the best overall.
By comparing the mean average wind speed for Las Palmas from 10 to 100 metres above
sea level, then setting these values into the formula for the power per m² in Watts = 0.5
×1.225 × v³, where v is the wind speed in m/s, the information has been shown graphically in
figure 21.
2829
450
400
350
Power W/m2
300
250
200
150
100
50
0
1 2 3 4 5 6 7 8 9 10
Height above sea level in metres x 10
Figure 21. Power ratios per m² in Watts for Las Palmas.
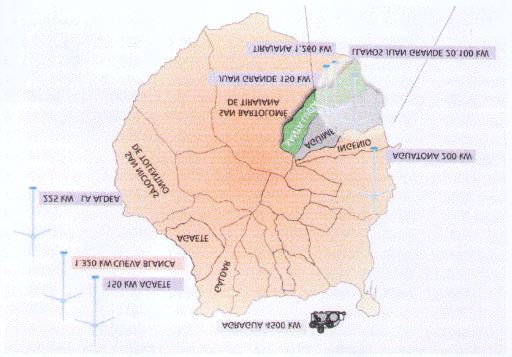
5.4 Wind Speed Measurement Series Analysis.
Each measurement series shown in figure 22 took approximately two hours to complete.
The first series usually started at sea level at nine o’clock in the morning and a road travelling
inland, with increasing altitude was travelled upon. Often 13 wind speeds were measured until
the road reached its highest point. Sometimes a change of plan proved necessary, for instance
on series C (Fig. 25), as the police had closed the road off. After reaching the maximum
altitude another route was chosen going back towards the coast and wind speeds were
measured in a descending altitude order. Series D (Fig. 26), B (Fig. 24), F (Fig. 28), and G
(Fig. 29) were afternoon, descending measurement series.
No control could be carried out to ascertain if the wind speed measured at the start of the
series still applied when the last wind speed was measured. This was because I was working
alone and only had one wind speed measurement device. That had no recording system so
could not be fixed as a permanent monitoring station. However with the aid of binoculars I
could see the direction of smoke from a cement factory chimney by the coast at the start of
series C (Fig. 25). The smoke never changed direction or angle of dispersal during the
measurement of series E (Fig. 27), C (Fig. 25), and D (Fig. 26). The wind speed was generally
constant in speed (2 to 3 m/s) and direction (South), at sea level throughout the day on each
day measurements were recorded, apart from the last day. Wind speed observations were
made throughout each day during my stay on the island in an attempt to gain knowledge about
the local wind conditions. On the last day (011218) the wind came from the north and at sea
level wind speeds ranged from 0 to 1,2 m/s. It rained lightly and visibility was limited to 1 km
by the low cloud base. During these limiting conditions series H (Fig. 30) and I (Fig. 31) were
recorded. This was attempted as it was my last day on the island and I wanted to have
measurement series from the whole island. It showed be noted that according to the wind rose
from Las Palmas, the predominating wind direction on the island is the north.
2930
Series A, B, and E were recorded in valleys that stretched in south to north directions. This
corresponded to the south wind. However it can be seen from figure 23 that the wind speed
drops considerably at 155 m and 615 m altitude. This was caused by the topography of the
valley causing some areas to be protected from the wind. This phenomenon can also be
observed in figures 25, 26 and 28. The opposite occurred in figure 24 at 100 m and 355 m
where the road crosses a valley ridge and abnormally high wind speeds were recorded. Figure
28 shows a high wind speed at 1510 m which then falls dramatically as the following
measurements were recorded behind the mountain peak, protected from the prevailing wind.
Turbulent winds were often experienced while monitoring the wind speeds in land at higher
altitudes.
The wind speed scale at the bottom of each figure has been adapted to give as clear a
picture as possible for that particular series. The low wind speeds recorded in figures 30 and
31 have a wind speed scale that stops at a maximum of 2,5 m/s.
Fig 22. Gran Canary, showing routes travelled for wind speed measurements.
Scale 1:300 000 (Haslam, 1984).
3031
Measurement series A
900
800
700
Height: m.a.s.l.
600
500
400
300
200
100
0
0 1 2 3 4 5 6
Windspeed: m/s
Fig 23. Puerto de Mogan to Embalse de Cueva (01-12-15) temp 22ºc, wind from south,
bottom of diagram..
Measurement series B
700
600
500
Height: m.a.s.l.
400
300
200
100
0
0 1 2 3 4 5 6
Windspeed: m/s
Fig 24. La Playa de Arguineguin to Montana Vista de Soria (01-12-15), wind from south,
bottom of diagram..
3132
Measurement series C
900
800
700
Height: m.a.s.l.
600
500
400
300
200
100
0
0 2 4 6 8
Windspeed: m/s
Fig 25. El Doctoral to La Hornilla (01-12-16). Wind from the south, left side of diagram.
Measurement series D
800
700
Height: m.a.s.l.
600
500
400
300
200
100
0
0 2 4 6 8
Windspeed: m/s
Fig 26. Pajonaies to Bahia de Arinaga (01-12-16). Wind from the south, left side of diagram.
3233
Measurement series E
1400
1200
Height: m.a.s.l.
1000
800
600
400
200
0
0 2 4 6 8
Windspeed: m/s
Fig 27. Maspalomas to San Bartolome de Tirajana (01-12-17) temp 26ºc, wind from south,
bottom of diagram.
Measuresment series F
2000
1800
1600
Height m.a.s.l.
1400
1200
1000
800
600
400
200
0
0 2 4 6 8
Windspeed: m/s
Fig 28. San Nicoas de Tolentino to Presa de los Hornos (01-12-17). Wind from the south,
bottom of diagram.
3334
Measurement series G
700
600
Height: m.a.s.l.
500
400
300
200
100
0
0 2 4 6 8
Windspeed: m/s
Fig 29. Las Marciegas to Inagua (01-12-17), valley N-S. Wind from the south, right side of
diagram.
Measurement series H
400
350
300
Height: m.a.s.l.
250
200
150
100
50
0
0 0,5 1 1,5 2
Windspeed: m/s
Fig 30. Punta la Salina to Mountana de Arucas (01-12-18), rain. Wind from the north, bottom
of diagram.
3435
Measurement series I
500
450
400
Height: m.a.s.l.
350
300
250
200
150
100
50
0
0 0,5 1 1,5 2 2,5
Windspeed: m/s
Fig 31. Agaete to Los Berrazales (01-12-18), valley N-S, rain. Wind from the north, left of
diagram.
5.5 The Position of Gran Canaria Windturbines (1998).
Below is a translation to help understand the key (fig. 32) for the map (fig.33).
Instalación – Installation Potencia – Potential Power.
En producción – In production 33100 kW
En tramitacion – Planned site 41405 kW
En obras – Being built 2355 kW
Autoconsumo – Desalination unit 5175 kW
Asignada concurso (960509) In production 17910 kW
Asignada concurso (961125) In production 28175 kW
Total conectada a red – Total connected to grid 71685 kW
Máxima penetración – Maximum production 80000 kW
Sin adjudicar – Surplus energy 8315 kW
3536
Fig. 32 Key to Location Map of Windturbines on Gran Canaria.
Figure 33 shows the position of the wind turbine parks on Grand Canaria in 1998. My visit
took place in 2001 and I could see for myself that even though the number of wind turbines
had increased since 1998, no new areas for wind parks had been exploited outside the areas
already shown in figure 33. Not one wind turbine could be observed outside of the area on the
east coast or the three smaller sites on the west coast, that was not a small scale farm wind
pump. No wind turbines were seen further than two kilometres from the coast or at altitudes
above 200 metres above sea level, during my tour of the island.
I spent sometime around the east coast wind park facilities and could observe several
hundred wind turbines simultaneously. Because at the time of my visit the wind was blowing
from the south, those turbines with no wind shade in that direction were active. There were
various wind turbines that were actually situated in front of hills that blocked them from any
south winds. However if the predominate winds for Las Palmas are from the north and north-
east as figure 8 suggest, then the siting of many of the wind parks ignored the fact that there
may be occasions when south winds are the only available. Every wind turbine I saw on the
island had no wind shade in the north or north east direction.
The east coast area containing wind parks stretches south from Las Palmas Airport to Juan
Grande. This area contained no tourist attractions or tourist hotels. It did suffer noise pollution
from aircraft landing or taken off at the airport, and smells from the cement factory. The
whole area was home to numerous small industries and abandoned farms. Many of these
showed evidence of storm damage, where shelters for vegetation had blown down.
Fuerteventura 2.78, El Hierro 2.81, and Las Palmas 2.66, had the best three k values of the six
test sites.
36You can also read