DRAFT SOUTH AUSTRALIAN ROAD SAFETY STRATEGY 2020 TOWARDS ZERO TOGETHER - May 2011 - Dpti
←
→
Page content transcription
If your browser does not render page correctly, please read the page content below
DRAFT SOUTH AUSTRALIAN
ROAD SAFETY STRATEGY 2020
TOWARDS ZERO TOGETHER

May 2011
DRAFT SOUTH AUSTRALIAN ROAD SAFETY STRATEGY 2020
TOWARDS ZERO TOGETHER

INVITATION TO COMMENT

The Road Safety Advisory Council invites comments on the Draft South Australian

Road Safety Strategy 2020 – Towards Zero Together. The strategy is an initiative of the

Council whose role is to monitor road safety performance in South Australia and make

recommendations to the Minister for Road Safety and the Government of South Australia

for strategies and actions to reduce road trauma.

Comments close Friday 10 June, 2011.

Comments are welcome online at dtei.sa.gov.au/roadsafety or by mail to:

Draft Road Safety Strategy 2020 - Towards Zero Together

GPO Box 1533

Adelaide SA 5001

DRAFT SOUTH AUSTRALIAN ROAD SAFETY STRATEGY 2020 - TOWARDS ZERO TOGETHER
Contents

Towards Zero Together                                                       1
      Targets 2011 to 2020                                                  1

Setting The Scene                                                           2
      United Nations Decade of Action                                       2
      Draft National Road Safety Strategy 2011 – 2020                       2

Road Safety In South Australia - History, Costs
and Opportunities                                                           4

      Predicting The Future                                                 5
      Where and When Crashes Happen                                         6
      Who Is Involved In Crashes                                            8

Why This New Approach                                                      10

What We Will Do                                                            13
      Safer Roads                                                          13
      Safer Speeds                                                         18
      Safer Vehicles                                                       22
      Safer People                                                         25

Managing The Strategy                                                      33

                                                                           37
Bibliography

DRAFT SOUTH AUSTRALIAN ROAD SAFETY STRATEGY 2020 - TOWARDS ZERO TOGETHER
TOWARDS ZERO TOGETHER Our vision is that the whole South Australian community work together to address the deaths and serious injuries caused by everyday use of the roads, no matter the people or circumstances involved. Targets 2011 to 2020 The targets for South Australia will meet the challenge of the draft national road safety strategy to reduce serious casualty trauma by at least 30% during the decade. This reduction represents the minimum improvement we can accept while recognising that we will strive to do better throughout the life of the strategy. On average between 2008 and 2010, there were 112 fatalities and 1126 serious injuries per year on South Australian roads. A 30% reduction target as set out in the draft national road safety strategy would provide a new target for South Australia of less than 80 fatalities, and less than 800 serious injuries by 2020. The analysis undertaken for the draft national strategy suggests that it will take significant effort to achieve a 30% reduction in fatalities and serious injuries. Different mixes of intervention are possible, but road infrastructure, vehicle safety and speed management are the areas which have the greatest potential to significantly influence casualty reductions. Programs aimed at increasing driver behaviour compliance will also produce further improvements. Three to four year action plans will be developed and published throughout the life of the strategy to set out the key actions that will be undertaken towards achieving the targets. One of the first actions will be to undertake a more precise analysis of what is required to achieve the road safety target that South Australia adopts. Progress towards meeting the targets relating to deaths and serious injuries will be reported on a quarterly basis. A comprehensive monitoring framework will be developed that gives greater emphasis to the total burden of injury – for example, minor injuries account for approximately half of the annual Compulsory Third Party claim costs. The framework will also include a second level of indicators that can be used to more directly analyse changes in critical aspects of the safety of the road transport system. Key indicators differentiated by road and crash type, travel speed, vehicle safety technology, as well as behavioural measures such as drink driving and restraint wearing, will allow us to regularly assess the progress of our actions in these different areas. Reporting on the delivery of key programs will also be undertaken. DRAFT SOUTH AUSTRALIAN ROAD SAFETY STRATEGY 2020 - TOWARDS ZERO TOGETHER 1
Setting The Scene
South Australia has benefitted from a significant and sustained reduction in road trauma
over the last three decades. As we look towards the next decade, it is useful to see our
progress in a broader context.

United Nations Decade of Action
Road trauma is a problem around the world. Over one million people die each year
on roads and this is predicted to be two million by 2020 if urgent action isn’t taken.
Worldwide, road trauma is the leading cause of death for the 15 to 29 year age group and
ranks in the top three for deaths of people between 4 and 44 years old.

The United Nations considers this situation to be unacceptable and declared 2011-2020
to be a decade of action for road safety. Eighty countries including Australia support
this resolution, which has as its goal, to stabilise and then reduce the level of road traffic
fatalities around the world. The aim is to reduce the 2020 predicted worldwide road toll by
50% through activities at the regional, national and global levels.

South Australia will support this decade of action by making South Australia safer and
by providing an example for countries in our region with less advanced road transport
systems than ours. We will also look for opportunities to participate in road safety activities
which could have an international impact.

Draft National Road Safety Strategy 2011-2020
The draft National Road Safety Strategy 2011–2020 that was released for consultation
put forward a target of a 30% reduction in deaths and serious injuries over the decade.
The draft national strategy draws from the established safe systems approach to road
safety, and challenges Australians to adopt a new vision of a safe road transport system
and build a national culture of road safety.

Australia has a strong record in reducing road trauma which has largely been based on
individual State and Territory and Commonwealth actions. However continued reduction
in trauma will require better coordination, national agreement and cross fertilisation. In an
increasingly mobile society, what happens in the rest of Australia affects South Australia
and vice versa.

Nationally agreed actions are necessary to achieving our agreed safety goals during the
next decade. South Australia will actively participate in the cooperative development of
national licensing schemes for novice drivers, motorcyclists and older drivers.

DRAFT SOUTH AUSTRALIAN ROAD SAFETY STRATEGY 2020 - TOWARDS ZERO TOGETHER                          2
The draft national strategy identified that funding for safety focussed infrastructure
improvements needs to be significantly increased to help meet the crash reduction
targets. South Australia will continue to play its part in infrastructure funding, and will need
to lobby for increased Commonwealth funding for safety programs on national highways
and local road networks as a vital contribution to meeting this goal.

There are also areas where Commonwealth leadership is required such as the regulation
of vehicles through the development of new Australian Design Rules (ADRs). As vehicle
technology continues to improve, the timely introduction of new ADRs is required to make
sure maximum safety benefits are achieved as soon as possible.

This strategy will complement and support the national strategy. It gives local expression
to the vision and targets and discusses those areas where South Australia most needs to
direct its efforts.

DRAFT SOUTH AUSTRALIAN ROAD SAFETY STRATEGY 2020 - TOWARDS ZERO TOGETHER                           3
Road Safety In South Australia - History, Costs and
Opportunities
South Australia has seen a substantial reduction in the number of deaths and serious
injuries due to road crashes during the last 30 years. The average road toll for the years
1981-1983 was 252, this reduced to 155 for the period 2001-2003 and reduced to 112
for the period 2008-2010.
Similar reductions have been seen for serious injuries with an average of 3104 for
1981-1983 reducing to an average of 1126 for the years 2008-2010.
Figure 1 – Road Deaths and Serious Injuries, South Australia, 1981 - 2010
300 4000
3500
250
3000
200
2500
Number of Number
Fatalities 150 2000 of Serious
Injuries
1500
100
Fatalities
Serious Injuries
1000
50
500
0 0
1981
1982
1983
1984
1985
1986
1987
1988
1989
1990
1991
1992
1993
1994
1995
1996
1997
1998
1999
2000
2001
2002
2003
2004
2005
2006
2007
2008
2009
2010
Many actions have contributed to these improvements including:
>> Black spot programs to improve sites with poor crash histories.
>> Infrastructure safety programs such as road shoulder sealing.
>> The introduction of a 50km/h default speed limit in urban areas.
>> Increased and better targeted enforcement.
>> A network of 80 safety cameras at high risk intersections.
>> Increased use of seatbelts and child restraints.
>> Static and mobile driver testing for alcohol and drugs.
>> Mandatory alcohol interlock program.
>> Increased numbers of 4 and 5 Star vehicles which provide better protection
for occupants.
>> More vehicles fitted with Electronic Stability Control (ESC) to assist drivers to
avoid crashes.
>> Graduated licensing schemes for young drivers.
DRAFT SOUTH AUSTRALIAN ROAD SAFETY STRATEGY 2020 - TOWARDS ZERO TOGETHER 4Despite these improvements there is still much more to do with over 100 South
Australians being killed and over 1000 seriously injured each year. These figures represent
an enormous amount of grief, suffering and loss as well as a cost of about $1billion each
year for the South Australian community.
Figure 2 – Fatalities with Major Initiatives, South Australia, 1981 - 2010
2003 - 50km/h default urban speed limit
introduced;
280
1987 - RBT Doubled - Lowering of Speed Limit from 110 to
100km in Rural Areas and 100km to
1988 - Red Light Cameras 80km in Adelaide Hills;
Introduced
2005 - Unlimited Mobile RBT;
230 - Immediate Loss of Licence
Introduced;
1981 - RBT Introduced - Enhancements to GLS
1995 - Laser Guns
Introduced 2006 - Drug Driving
1996 - Laser Guns Tripled & RBT Testing Introduced
180 Doubled
2007 - Rural Road
Safety
1990 - Speed Cameras Program
Introduced Commenced
1991 - 0.05 BAC Limit 2002 - State Black Spot
130 Program Commenced;
Introduced
- Shoulder Sealing
1999 - Advanced Speed Program Commenced
Cameras Introduced 2009 - Mandatory Alcohol
Interlock Scheme Began
80
1981
1982
1983
1984
1985
1986
1987
1988
1989
1990
1991
1992
1993
1994
1995
1996
1997
1998
1999
2000
2001
2002
2003
2004
2005
2006
2007
2008
2009
2010
Predicting the Future
Predicting the future number of road crashes is difficult to do with any kind of precision.
The long-term trend in fatalities and serious injuries has been downward for 30 years.
These trends suggest that fewer people should die as a result of being involved in
road crashes into the future. However, the recent past would suggest that there are no
guarantees – road crash statistics do not change in an orderly way.
Figure 3 – Fatalities, South Australia, 2001 – 2010
180
160 154 154 156
147
139
140
125
117 119 118
120
99
100
80
60
40
20
0
2001 2002 2003 2004 2005 2006 2007 2008 2009 2010
DRAFT SOUTH AUSTRALIAN ROAD SAFETY STRATEGY 2020 - TOWARDS ZERO TOGETHER 5In the seven years from 1997 to 2003, South Australia recorded on average 157 deaths
per year, with almost no trend downward. This was followed by steep declines from 2003
to 2008 to an average of 112 deaths per year from 2008 to 2010. This period coincided
with the introduction of some significant new road safety initiatives.
Evidence-based, system-wide changes to speed limits reduced vehicle speeds and
crashes that, together with other changes to the system, reduced road deaths by over
20% over the period of the last strategy. Reduced crashes have brought other significant
benefits to the community through reduced injury, property damage costs and reduced
pain and suffering.
We may be confident that the initiatives introduced in the last strategy will continue to
deliver benefits for years to come, but the rapid declines associated with these initiatives
will lessen without further effective initiatives being introduced.
While general improvements to vehicles will deliver some reduction, substantial initiatives
that will significantly reduce crash risks to many road users in the community will
be required.
The changes required will need to be as effective as the changes successfully made
during the period of the last strategy.
We will not reach our target unless we are willing to work together and adopt new
approaches to reducing road trauma.
Where And When Crashes Happen
Road safety is a state-wide challenge. Over half of the serious injury crashes and 37
percent of fatal crashes occur in metropolitan Adelaide.
Figure 4 – Location of Fatal & Serious Injury Crashes, South Australia, 2008 – 2010
Fatal Serious Injury
Metro Rural
Rural Adelaide 30%
Metro
36% 37% Adelaide
51%
Within
100km of
Within 100km
Metro
of Metro Adelaide
Adelaide 19%
27%
DRAFT SOUTH AUSTRALIAN ROAD SAFETY STRATEGY 2020 - TOWARDS ZERO TOGETHER 6The remainder are spread throughout the State with a particular area of concern being
the area outside metropolitan Adelaide, but within 100km of Adelaide, which accounts for
27% of fatal crashes and 19% of serious injury crashes. 29% of all fatalities also occur in
this area.
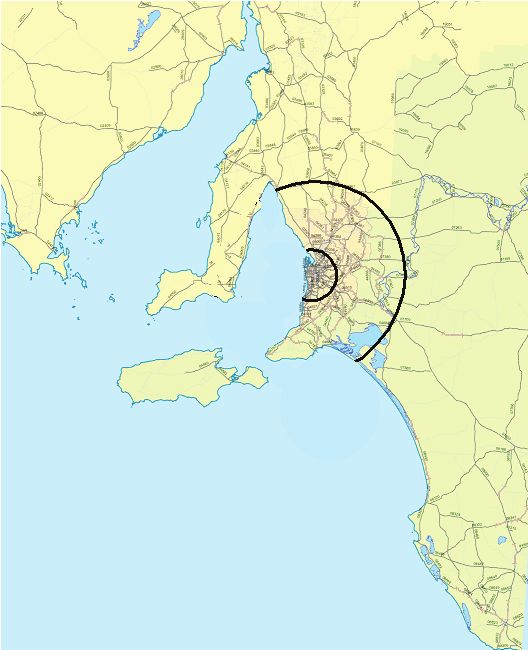
Figure 5 – Map of Location of Serious Casualty Crashes (Fatal & Serious Injury), South Australia,
2008-2010
50% of serious
casualty crashes
occur within Metro
Adelaide
Another 20% of
serious casualty
crashes
occur within
100km of
Adelaide CBD
The remaining
30% of serious
casualty crashes are
widely dispersed
DRAFT SOUTH AUSTRALIAN ROAD SAFETY STRATEGY 2020 - TOWARDS ZERO TOGETHER 7Crashes happen at all times of day. Just over half of all fatalities and about 25% of all
serious injuries occur in the hours of darkness. A large number of crashes occur at
intersections in both urban and rural areas. For minor injuries the most common crash
type is a rear end crash.
Figure 6 – Serious Casualty Crashes, By Crash Type, South Australia, 2008-2010
Metropolitan Adelaide Rural South Australia
All other Intersection
All other
Crash Crashes
Crash
types 14%
types
30% 20%
Intersection
Crashes
49%
Single Vehicle
Run-Off Single Vehicle
21% Run-Off
66%
Who is Involved in Crashes
48% of people killed or seriously injured in crashes are drivers and another 22% are motor
vehicle passengers. Pedestrians, cyclists and motorcyclists make up the remaining 30%.
Figure 7 – User Type In Serious Casualty Crashes, South Australia, 2008-2010
Pedestrian
9%
Cyclist
6%
Motorcyclist
15%
Driver
48%
Passenger
22%
DRAFT SOUTH AUSTRALIAN ROAD SAFETY STRATEGY 2020 - TOWARDS ZERO TOGETHER 8Figure 8 –Serious Casualties By Age Group, South Australia, 2008-2010
16%
14%
14%
13%
12%
11%
% of Involvement
10%
8%
8% 8%
7% 7%
6%
6%
5% 5%
4%
4%
3% 3% 3%
2%
2%
1% 1%
0%
0-15 16-19 20-24 25-29 30-34 35-39 40-44 45-49 50-54 55-59 60-64 65-69 70-74 75-79 80-84 85-89 90+
Road users aged 24 years or younger account for approximately 34% of those killed and
31% of those seriously injured.
Other important factors are alcohol and the use of seatbelts. On average, between
2008-2010, 34% of fatally injured drivers and riders had a BAC over 0.05 and 37% of
vehicle occupants killed were not wearing a restraint. Fatigue also plays a major role in
crashes but the extent of the problem is hard to quantify. However, research has indicated
that between 15% and 30% of drivers involved in crashes were suffering from fatigue.
DRAFT SOUTH AUSTRALIAN ROAD SAFETY STRATEGY 2020 - TOWARDS ZERO TOGETHER 9Why This New Approach This strategy presents the view that road deaths and injuries are not inevitable and society has a responsibility to prevent them. Road safety is a community issue and the strategy includes roles and responsibilities for everyone. It sets direction for a change in culture. A culture in which fatalities and serious injuries on our roads are not accepted as inevitable, and which strives to avoid them occurring. This change in culture includes every driver, every passenger, every pedestrian, every cyclist, every motorcyclist, every truck or delivery driver, every bus or taxi driver, every individual responding appropriately to safety rules and their ongoing enforcement. This change in culture also includes each organisation and part of society. Those engaged in building and managing roads have a responsibility to provide a safe network, manufacturers have a responsibility to design and market the highest standard of safety in their vehicles, organisations and businesses purchasing vehicles have a responsibility to build a safe vehicle fleet, road users have a responsibility to comply with the law, and enforcement agencies have a responsibility to increase compliance. Most importantly the community has the responsibility to demand safe travel on our roads and support the actions that will make a difference. There is a belief in the community that road fatalities and serious injuries are the result of risk taking or extreme behaviour, and these crashes can receive extensive media coverage. However, research shows that in South Australia over half of all fatal crashes, and 90% of injury crashes, are the result of mistakes or common lapses in judgement. We want a system that minimises injuries and their severity in the event of road crashes. This approach adopts a holistic view of the road transport system and the interaction between people, vehicles and the road environment. It recognises that people will always make mistakes and poor choices, and may always have road crashes, but seeks to ensure that those actions do not result in a fatality or serious injury. The Safe System approach to road safety is built on several key principles: >> Human Factors – no matter how well we are trained and educated about responsible road use, people make mistakes, and the road transport system needs to accommodate this. >> Human Frailty – the finite capacity of the human body to withstand physical force before a serious injury or fatality can be expected is a core system design consideration. >> Forgiving Systems – roads that we travel on, vehicles we travel in, speeds we travel at, and communities we live in, need to be more forgiving of human error. >> Shared Responsibility – everyone has a responsibility to use the road safely and organisations, businesses and communities have a responsibility to design, manage and encourage safe use of the road transport system. DRAFT SOUTH AUSTRALIAN ROAD SAFETY STRATEGY 2020 - TOWARDS ZERO TOGETHER 10
We have made major gains in reducing road trauma using our traditional approach but it
will not take us the rest of the journey. A new approach is necessary if we are to continue
to make gains and move towards a truly safe road system. We will have to keep doing all
the things we have done so far but also implement actions which put safety at the centre
of all our transport choices.

A new approach is needed to fully recognise the road environment as the essential
building block for a safe road transport system. Our new approach will seek to increase
safety priorities in land use and transport planning decisions by building connections
with the planning process. An important step will be to increase the involvement of local
government in building a safe system.

A major opportunity for integrating safety into planning is the development of the 30 Year
Plan for Greater Adelaide. Liveability and sustainability are priorities for the 30 Year Plan
which seeks to reduce the dependence of Adelaide on the private motor vehicle. It will be
important to make sure that implementation of the plan is achieved so that the potential
safety benefits of changed travel patterns can be realised.

In the short term the major opportunity for reducing road trauma is a reduction in travel
speeds. An important step in making sure speeds are appropriate is to ensure the road
environment provides the right signals to road users about the appropriate travel speed.

A new approach is needed to harness the major technological benefits that are on offer
to improve road safety. By accepting that humans are fallible, we encourage technology
solutions that can dramatically reduce the chances of vehicle-to-vehicle, vehicle to
infrastructure and vehicle to pedestrian collisions and improve the quality and timeliness
of safety information to road users. Advances in technology will also increase the
effectiveness of enforcement activity when safety standards are breached.

More significantly, a technology perspective on safety opens up opportunity to further
explore the latent capacity within modern vehicles to address longstanding behavioural
issues, such as drink driving, as well as safety communications between vehicles, and
between vehicles and roads.

A safe system approach will require us to take advantage of known successful
technologies and be flexible enough to incorporate new developments as they occur.

A new approach is also required to encourage many different organisations to integrate
road safety into their priorities and activities. An important part of this strategy is to build
the partnerships and connections necessary to make this happen. Within government,
the existing partnership between the Department for Transport, Energy and Infrastructure,
the South Australia Police and the Motor Accident Commission will continue and be
strengthened, as will the important roles of the health, education, research and local
government sectors.

DRAFT SOUTH AUSTRALIAN ROAD SAFETY STRATEGY 2020 - TOWARDS ZERO TOGETHER                           11
The strategy will also look for new opportunities and new partners to address road safety
from as many directions as possible. Private organisations all have a major role to play in
building a safe system. A priority of this strategy for example will be to form partnerships
with those organisations with large fleets of vehicles to find ways to prioritise safety in
vehicle purchasing.

A new international standard under development (ISO 39001 Road Traffic Safety
Management) is expected to assist organisations to build road safety plans suitable
for their business.

DRAFT SOUTH AUSTRALIAN ROAD SAFETY STRATEGY 2020 - TOWARDS ZERO TOGETHER                       12
What We Will Do
The strategy sets a direction that will have a significant impact on road trauma in South
Australia over the next 10 years. The strategy will be supported by detailed action plans
covering shorter time periods within the life of the strategy, the four key intervention areas
where action will be required – safer roads, safer speeds, safer vehicles and safer people
– and the management activities to support them.

SAFER ROADS
Investment in infrastructure can be highly effective in reducing trauma. New road
construction and safety focussed retrofits is expensive, but when well planned, designed
and managed can provide lasting safety benefits to road users. Research in Victoria and
South Australia has shown that expenditure over the length of rural roads can produce
crash savings with a value at least 10 times the cost of the infrastructure and even greater
benefits can be achieved for treatments at specific sites.

Safer road infrastructure is seen in a strongly positive light by road users and the
community in general, and understanding is growing about the most important safety
treatments such as roadside hazard management. The Australian Road Assessment
Program (AusRAP), part of an international program developed by automobile clubs,
takes this further in the form of consumer advocacy which rates the safety of Australian
roads on behalf of road users and is communicated in an easy to understand star rating
system. It is important for the community to understand where most road safety gains can
be made and to support improvements in these areas.

Planning
A safe road transport system starts with better planning. Urban planning decisions
have the potential to influence how the road network is used and what infrastructure
investments are required. Traditionally decisions about urban planning and road safety
have been made independently, and we need to make sure that transport infrastructure
is provided which supports both planning and safety objectives. This will require a
partnership between all levels of Government.

Liveability and sustainability are becoming more important to the community and are
priorities for the 30 Year Plan for Greater Adelaide. This plan seeks to change urban
form and build a walking and cycling friendly city served by increased and better public
transport services, with reduced dependence on the private motor vehicle.

The changes to Adelaide envisaged in the 30 Year Plan (which include new major projects
to improve freight efficiency, increase public transport coverage and improve access for
people walking and cycling) have the potential to produce significant road safety benefits.
These benefits could be further increased if road safety criteria were explicitly included
in the planning process so that safe road environments are provided for pedestrians,
cyclists, light and heavy vehicles.

DRAFT SOUTH AUSTRALIAN ROAD SAFETY STRATEGY 2020 - TOWARDS ZERO TOGETHER                         13
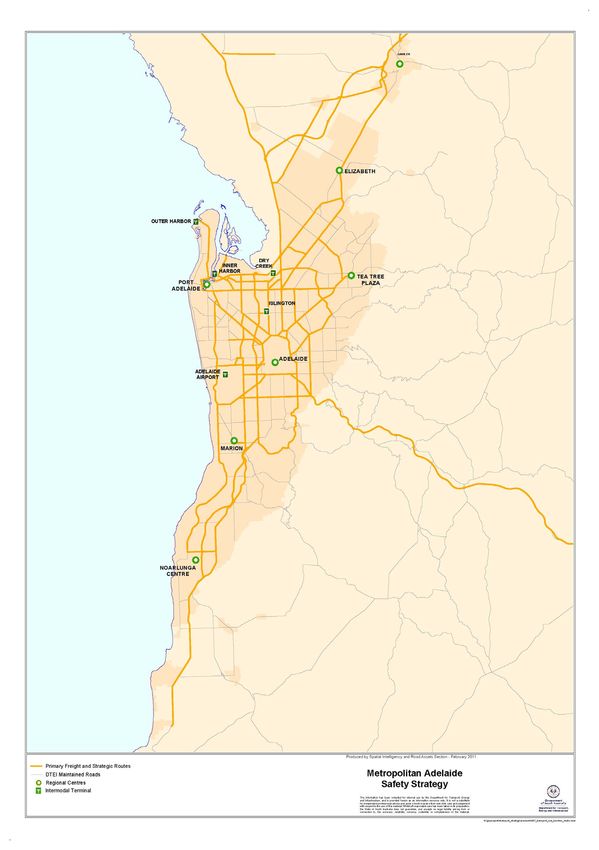
It is not always clear to the road user that different roads in South Australia’s road
network perform different functions. Applying a clear, functional hierarchy of roads,
that is more deliberately articulated to the community would assist road users to
understand the road environment. Figure 9 shows the strategic and primary freight
corridors in South Australia.

In the long term, for example, greater consistency in the road network will support
better compliance with speed limits, which are ideally set to be consistent with the
function and design standard of the road. During the life of the strategy we will move
closer to consistent speed limits for roads with similar functions, design standards and
access management.

Investment
Infrastructure investment is expensive and it is important that funding is applied where
it will achieve the most benefits. South Australia will continue to improve its methods
for developing and targeting effective infrastructure programs, including regular safety
assessments and audits of the network, and monitoring of the effectiveness of
new programs.

Economic assessment of programs is also important, and the productivity focussed
measures that are currently used do not reflect the true value that the community
places on avoiding the pain and suffering that comes with deaths and serious injuries
on the road. South Australia will move towards a new holistic approach to valuing safety
improvements, as reflected in the Draft National Road Safety Strategy 2011-2020, and
applied in many other developed economies.

More investment in safety focussed improvement programs will be needed to support
achievement of the new safety targets, and the dedication of fine revenue to safety
programs in South Australia will continue to support this.

Funding programs are also essential to allow local government as a significant road
network owner to make major progress in developing safe systems. South Australia
will work with the Commonwealth to seek a mechanism for local government to access
increased safety funding.

Irrespective of the level of investment, the greatest share will be allocated to where the
greatest potential trauma reductions are possible. The investment will also be focussed on
the most effective treatments that can be applied to the key crash types, consistent with
safe system principles.

DRAFT SOUTH AUSTRALIAN ROAD SAFETY STRATEGY 2020 - TOWARDS ZERO TOGETHER                     14
Figure 9 - Strategic and Primary Freight Corridors, South Australia

    Primary Freight and
    Strategic Routes

    DTEI Maintained Roads

    Regional Centres
T   Intermodal Terminal

                                                                        Primary Freight and Strategic Routes
                                                                        DTEI Maintained Roads

              DRAFT SOUTH AUSTRALIAN ROAD SAFETY STRATEGY 2020 - TOWARDS ZERO TOGETHER                         15
Run off the road crashes Most South Australian rural roads are two way, two lane roads with unforgiving roadsides. 66% of serious casualty crashes on rural roads involve a vehicle running off the road and either hitting a fixed object or rolling over. Each year approximately 25 people die when their vehicle strikes a tree after leaving a rural road. There are a number of measures which have been proven to reduce the trauma resulting from run off the road crashes. >> Sealed shoulders and audio tactile edge lines reduce the risk of vehicles leaving the roadway and has already been successfully used in South Australia. >> Widening sealed shoulders and traffic lanes at curves will reduce the number of vehicles leaving the road at these higher risk locations. >> Clearing areas next to the road reduces the risk of a vehicle striking a fixed object and also the severity of collisions when they do occur. >> Safety barriers next to the road are a highly effective way of preventing vehicles from striking roadside objects. Priority will be given to treating those sections of the road network where most run off the road crashes occur. Giving initial priority to treating curved sections of roads has been shown to provide higher risk reductions for each dollar invested. Treatments which reduce run off road crashes will also reduce head on crashes, which often result from a loss of control situation when vehicles leave the road to the left, over-correct and enter the opposing traffic lane. This also means that median treatments, including wire rope barriers, wide painted medians and audio tactile lines have a significant role to play. Run off road crashes, particularly those involving a fixed object are also a major issue in urban areas where the main types of objects struck are trees and stobie poles. Stobie poles are common throughout Adelaide and are unforgiving when struck by an out of control vehicle. A program exists to replace stobie poles with underground power but this is expensive. As part of this strategy we will look for initiatives to increase the importance of safety in setting a pole removal program. Intersections Over 50% of casualty crashes in urban areas occur at intersections. One of the most difficult tasks undertaken by drivers is to judge gaps in the opposing traffic when turning right or entering a major road from a local road. Effective treatments will reduce the frequency at which drivers need to make these individual judgements. DRAFT SOUTH AUSTRALIAN ROAD SAFETY STRATEGY 2020 - TOWARDS ZERO TOGETHER 16
Appropriate treatments for urban intersections can be complex to develop and implement.
The best site specific mix is dependant on the type and volume of traffic and factors such
as the space available for redesign and the land use around the intersection. A program of
intersection treatments will be developed including:

>> The provision of roundabouts at suitable locations.
>> Working with local government to reduce uncontrolled right turns including increasing
   the number of fully controlled right turns at signalised intersections.
>> Installing engineering treatments to reduce speed at intersections, particularly in areas
   with high numbers of people walking and cycling.
In some cases the most appropriate treatment to improve safety may be to reduce
speed through the intersection. 27% of rural casualty crashes also occur at intersections
and these are distributed throughout the many intersections in the rural area. The most
effective solution is often the installation of a roundabout.

As part of this strategy we will develop a prioritised program for the treatment of rural
intersections.

Vulnerable Road Users
In urban areas provision for people walking and cycling is important and in some locations
these modes should be given priority over motorised traffic when designing the road
network. The strategy will include infrastructure initiatives to address the particular needs
of vulnerable road users. Initiatives will include the provision of safe and separate facilities
for people walking and cycling and the provision of a safe speed environment when
separation is not possible. It is important to recognise the different needs of pedestrians
and cyclists and that it will often be necessary to provide different infrastructure solutions.

Motorcyclists are also vulnerable to greater injury when involved in a crash and high use
motorcycle routes will be identified and the feasibility of removing hazards assessed.
The possibility will be explored of funding this infrastructure investment through a
motorcycle registration levy as suggested in the draft national strategy.

Key Strategies for Safer Roads
>> Integrate safety into all stages of urban / rural and transport /corridor
   planning processes.
>> Form stronger partnerships between State and Local Government to apply
   safe system principles when improving the local road network.
>> Target infrastructure safety investment with the most effective safe system
   treatments at locations with the highest volumes of crashes.

DRAFT SOUTH AUSTRALIAN ROAD SAFETY STRATEGY 2020 - TOWARDS ZERO TOGETHER                           17
SAFER SPEEDS
An overall framework for safe and credible speeds requires a stronger functional approach
to management of the road network.

National and international research has consistently shown that reductions in travel
speeds save lives and injuries, and these benefits have been clearly demonstrated on
South Australian roads. The reduction in urban speed limits to 50km/h produced a
reduction of over 20% in urban crashes. Other targeted speed limit reductions, such as
in parts of the Adelaide Hills where the speed limit was reduced to 80km/h and selected
110km/h rural roads with a lower limit of 100km/h, have produced similar results.

Reductions in average travel speed across the network would produce significant road
safety benefits and is the most effective and swift way to reduce road trauma. A reduction
of 5km/h in average travel speed would reduce rural casualty crashes by about 30% and
about 25% in urban crashes and even a modest reduction of 3km/h in average travel
speed across the network is capable of generating a 15% overall reduction in casualties.

Travel speeds have consequences for crash risk, and also for injury severity when a crash
occurs. Biomechanical research into the capacity of the human body to absorb crash
energy without significant harm suggests that safe travel speeds would ideally be less
than 30km/h in areas where conflict with people walking and cycling is possible, less than
50km/h where side impacts with rigid objects are possible and less than 70km/h on roads
where head on collisions are possible. This illustrates the need to address speed within a
functional approach to road management.

Reductions in speed and speed limits can also be the most publicly contentious way to
reduce road trauma. Sustained improvement in speed management will only occur with
the support of the community and other stakeholders, and the adoption of a total change
management approach. It will be vital to explain the importance of speed management to
a safe system and the community gains that can be achieved from even small reductions
in travelling speed. This message needs to be heard consistently from as many sources
as possible, in particular from local government and community groups.

The wider benefits of reducing speeds, including better fuel consumption, lower
greenhouse gas emissions, less traffic noise, and better support for active travel modes,
contribute to South Australia’s environmental, sustainability, and wellbeing objectives.
Increasing understanding of the role of speed, setting appropriate speed limits and
improving compliance with all speed limits are all important parts of this strategy.

DRAFT SOUTH AUSTRALIAN ROAD SAFETY STRATEGY 2020 - TOWARDS ZERO TOGETHER                     18
Appropriate Speed Limits
International work has shown that to achieve our vision, speed limits need to take into
account potential crashes and the likely outcomes of these crashes based on the impact
of forces on the human body. Investing in a safer road network that achieves safe and
credible speed limits and helps remove these conflicts, could be suitably illustrated
through a range of urban and rural road demonstration projects.

                        Collision-force
Figure 11 – Collision–Force                and
                            and Risk Of Fatality   outcome
                        Risk of Fatality
                100%

                   80

                                                                   ision
                                             ian

                                                       act

                                                               Coll
                                            estr

                   60

                                                     -imp

                                                              d-on
                                           Ped

                                                    Side
                   40

                                                             Hea
                   20

                    0
                        0             20     40      60        80          100km/t

The default speed limit in South Australia is 50 km/h in urban areas and 100 km/h in rural
areas. Speed enforcement and speed limit reductions will be targeted to roads and road
sections with high crash rates and where land-use and infrastructure planning does not
justify a limit above the default.

Demonstration projects for retrofitting safe and credible speed limits will be progressed in
rural and metropolitan areas, taking into account:

>> sustainability and liveability aims of the 30 Year Plan for Greater Adelaide, and the
   need to support safe movement for pedestrians and cyclists which may include
   reducing speeds in urban areas where there are large concentrations of people
   walking and cycling.
>> the concentration of trauma in rural areas close to Adelaide, including fringe areas
   undergoing changes in traffic volumes and demographics, such as the collaborative
   approach to speed limit reductions taken by the Onkaparinga, Adelaide Hills and
   Barossa Council areas.
>> increased understanding of the impact of a rural road network of two-way two
   lane roads with speed limits of 110km/h, which is out of step with the most
   successful road safety countries and where major benefits could be achieved
   from reduced speed limits.

DRAFT SOUTH AUSTRALIAN ROAD SAFETY STRATEGY 2020 - TOWARDS ZERO TOGETHER                       19
Reducing speed limits has been shown to be a successful safety countermeasure but is sometimes of concern to the community through an overestimation of related costs and an underestimation of related benefits. Travelling at 100km/h uses on average 8% less fuel than travelling at 110km/h which equates to paying about 10c per litre extra for fuel when travelling at 110km/h. The safety benefits of small speed reductions are not intuitively obvious and more public information needs to be provided to explain the extent of the benefits possible. Compliance With Speed Limits Whatever the speed limit, improved compliance with the limit plays a vital role in improving the safety of all road users. Enforcement is vital in achieving compliance with speed limits, and will continue to play a key role throughout the life of the strategy. The current network of fixed safety cameras in urban areas will continue to expand, including greater attention given to mid-block cameras. These traditional automated enforcement approaches will continue to be supplemented by targeted deployment of SAPOL personnel operating with a range of technologies including mobile cameras and mobile radars at their disposal. New technologies have the potential to increase the range and effectiveness of enforcement resources. Point-to-point speed cameras that measure the speeds of all vehicles between relatively distant points on the road are more effective than one-point speed cameras. They can monitor all vehicles over a long section of road continuously and are considered fairer as they do not penalise momentary breaches of the speed limit. Focusing on major regional and interstate routes, the development of a comprehensive point-to-point speed enforcement system will begin, with an initial focus on the key routes into and out of Adelaide. The penalties in place to deter users who may otherwise flout the law and create unacceptable risk to others are a critical part of the mix of speed compliance interventions. The current mix of demerit points and fines for speeding offences does not match the fundamental safety risk associated with the offence. Drink driving penalties are comparatively much higher. While significant safety benefits will be achieved by reducing the speed of the large number of vehicles travelling within 10km/h of the speed limit, a change in penalties will mean considerably more severe consequences for the much smaller number of offenders travelling at very high speeds. Over the life of this strategy, it is expected that new vehicle technologies will begin to provide the ultimate support for the vast bulk of drivers who have no intention of breaking the law but may inadvertently travel above the speed limit. Intelligent speed adaptation is a proven technology that has been trialled in Australia and around the world and has been shown to provide strong safety benefits. DRAFT SOUTH AUSTRALIAN ROAD SAFETY STRATEGY 2020 - TOWARDS ZERO TOGETHER 20
Focusing initially on demonstration and voluntary take-up, a proposal will be investigated
for a digital speed map of South Australia that provides verifiable real-time in-vehicle
information to drivers about the speed limit at any point in the network. Once established
and operational in South Australia, this technology could become a useful support over
time for all drivers.

Key Strategies for Safer Speeds
>> Align speed limits to the function, standard and use of the road and apply
   consistently across the State.
>> Strengthen public information explaining the impact of speed and speed limits
   on crashes.
>> Target speed limit reductions for roads according to crash rates and a functional
   road hierarchy.
>> Increase the use of new technologies to boost speed limit compliance.
>> Increase the penalties for speeding to better match the risk posed and
   comparability with drink driving.

DRAFT SOUTH AUSTRALIAN ROAD SAFETY STRATEGY 2020 - TOWARDS ZERO TOGETHER                     21
SAFER VEHICLES
Improvements in vehicle safety are important contributors to reducing trauma. These
improvements help drivers to avoid crashes, and protect occupants and other road
users when crashes happen. Vehicle technology is being developed at a rapid rate and
new technologies will emerge during the life of this strategy. However, the average age
of the South Australian fleet is just over 11 years so it takes considerable time for new
technologies to be available to the majority of road users.

A major aim of this strategy is to develop methods to accelerate the take up of proven
safety technologies into the vehicle fleet. Some technologies such as Intelligent Speed
Adaptation (ISA) and alcohol interlocks can be retrofitted to existing vehicles so a
quicker realisation of benefits from these devices may be possible but other important
technologies such as stability control and occupant protection measures are not suitable
for retrofitting.

New vehicles are becoming safer but there is evidence that those drivers at higher risk,
particularly novice drivers, are more likely to drive older cars. One challenge is to find ways
for our highest risk drivers to be driving the safest cars.

Over the next ten years, many of the innovations in new vehicles will become more
commonplace in vehicles driven by many South Australians. For example, more than 50
percent of vehicles will have electronic stability control and about the same proportion
will have a 5-star safety rating (based on the standards of today). Because of the slow
turnover of vehicles, many of the advances in new vehicles made in the past decade are
only now beginning to become commonplace. Therefore, part of the benefit of newer
vehicles will come from momentum already in the vehicle system.

Consumer Driven Safety
The safety of new vehicles varies considerably and if buyers are to choose safer cars
they need reliable, understandable and accessible information. The Australian New Car
Assessment Program (ANCAP) assesses the crashworthiness and safety features of new
vehicles and assigns stars based on safety performance.

The Used Car Safety Rating (UCSR) program provides real world data about the safety of
different vehicles in the used market. These star rating programs allow all buyers to make
informed decisions and encourage levels of safety that exceed those required
by regulation.

Taking every opportunity to promote and explain ANCAP and UCSR results is an
important part of this strategy. Consumer support and demand has led to this becoming
a de-facto standard for many manufacturers.

DRAFT SOUTH AUSTRALIAN ROAD SAFETY STRATEGY 2020 - TOWARDS ZERO TOGETHER                          22
Another important part of this strategy will be to continue to promote and explain ANCAP
and UCSR results. South Australia will continue to contribute to the development and
improvement of the program as more vehicle safety systems become available over the
next 10 years.

We will also look for new ways to encourage manufacturers to ensure that vehicles selling
in high volumes are of the highest standard.

A large proportion of the private vehicles now travelling on South Australian roads were
first registered as part of a private or government fleet. Encouraging fleet buyers to adopt
safe buying practices will have strong flow on benefits and over time improve vehicle
safety in the total fleet. There are a number of possible approaches for influencing fleet
buyers which need to be investigated. These approaches include provision of better
information, public recognition for “safe fleets”, financial incentives and incorporation into
occupational health and safety requirements. Consultation will be carried out with fleet
buyers to identify which strategies will be the most practical and effective.

New technologies
There are new technologies available which provide information to the vehicle and
driver about road and traffic conditions, such as ISA. These technologies rely on
vehicle-to-infrastructure and vehicle-to-vehicle communication. Providing the necessary
digital mapping and fixed technology to allow the deployment of these technologies will
be part of this strategy.

There are currently important emerging technologies which research has shown to have
the potential to significantly reduce road trauma. The best example in 2011 is frontal
collision avoidance technology, which allows the vehicle to reduce speed so as to avoid
a collision or reduce its severity. Accelerating its introduction into the fleet would generate
further injury savings.

The frontal design of vehicles can have a major effect on the severity of injuries to
pedestrians. ANCAP tests the pedestrian friendliness of vehicles, but while the ANCAP
star rating for occupant protection has improved considerably there has been little change
in vehicle safety ratings for pedestrian collisions in the same period. South Australia is well
placed to explain and promote the importance of the pedestrian rating as the relevant
crash testing is conducted in Adelaide. A known risk to pedestrians is the widespread use
of bull bars in urban areas. Ways to discourage the unnecessary fitting of bull bars will be
explored as part of this strategy.

Another example is Anti-Lock Braking Systems (ABS) on motorcycles, which have been
shown to improve the safety of motorcycles and reduce out of control crashes. Mandating
ABS would be possible for inexperienced motorcyclists who are currently restricted to a
limited range of vehicles and would reduce crashes for this group. Mandating ABS for all
new motorcycles would be an even more significant step.

DRAFT SOUTH AUSTRALIAN ROAD SAFETY STRATEGY 2020 - TOWARDS ZERO TOGETHER                          23
New vehicle technologies may provide opportunities to modify driver behaviour and
enhance enforcement. Alcohol interlocks are already in use and there is potential in
the future to use speed-limiting ISA devices to deal with recidivist offenders. Further
appropriate technologies may be developed during the life of the strategy.

The health sector plays a major role in improving road safety. Timely and effective post
crash care is clearly vital and cooperation is needed between health, road designers and
vehicle regulators to ensure advantage is taken of new technologies which allow more
rapid and accurate reporting and locating of crashes.

The Draft National Road Safety Strategy 2011-2020 includes a number of vehicle related
initiatives including extending ANCAP, streamlining the vehicle regulation system and
strengthening vehicle regulations for heavy vehicles and motorcycles. South Australia will
actively support these initiatives.

Key Strategies for Safer Vehicles
>> Promote adoption of safest vehicle fleet buying policies by public and private
   fleet owners.
>> Continue to support and promote ANCAP and UCSR in cooperation with other
   national initiatives, including the promotion of pedestrian safety initiatives.
>> Accelerate the introduction of a range of new vehicle technologies such as frontal
   collision avoidance and intelligent speed adaptation.

DRAFT SOUTH AUSTRALIAN ROAD SAFETY STRATEGY 2020 - TOWARDS ZERO TOGETHER                     24
SAFER PEOPLE
Influencing the behaviour of road users is critical to prevent death and serious injury on
our roads. At an individual level, road users need to comply with the road rules, remain
alert and safety conscious, and accept that continual improvement in their behaviour
and the behaviour of others is critically important to achieve improvement in road safety.
At a societal level, a culture of road safety in the community is required where it is not
accepted as inevitable that loss of life and injury on the road will occur, and where the
cost of making significant improvement in safety is accepted.

While progress has been made there are still a number of key priority areas that require
addressing in order to further reduce road trauma. Reducing the incidence of driving while
impaired by alcohol, drugs or fatigue, addressing the small number of vehicle occupants
who do not use restraints and providing greater protection for young drivers whilst they
are at their most vulnerable stage of driving experience by limiting their exposure and
encouraging the use of safer vehicles.

Graduated Licensing Schemes
Good practice and safe experience for young drivers will continue to be important, but
research indicates that maturity does not stop being an issue for the driving population
until the mid 20s, which is why government agencies do not promote driver licensing in
high school years. Licensing age, consumption of alcohol, excess speed, carriage of
passengers, and driving at night are all factors which significantly increase the risks for
young drivers and need to be considered and discussed. Addressing these factors for
young drivers will have a substantially positive effect on road safety, and helping young
people to drive in the safest way possible can set the scene for a lifetime of safe
driving behaviours.

Graduated licensing schemes (GLS) have proved an effective way of gradually introducing
young drivers to the network and helping them to gain experience. Further enhancements
to the GLS will be considered as part of this strategy especially those that have proven
benefits and provide for restrictions that are progressively lifted as experience and maturity
is gained. South Australia will also strongly support any national moves to improve the
consistency and safety of graduated licensing schemes. We will also continue to increase
and improve educational support for young people who enter the licensing system. This
will leverage off the major improvements to web based licensing information and continue
to utilise new media options that give the best chance of engaging young people.

GLS is also an effective measure for motorcyclists. Current licensing requires new
motorcyclists to undertake training and restricts them to certain types of motorcycles
while gaining experience. Measures to strengthen motorcycle licensing will be considered.

DRAFT SOUTH AUSTRALIAN ROAD SAFETY STRATEGY 2020 - TOWARDS ZERO TOGETHER                         25
Alcohol and Drugs
Impairment due to alcohol and drugs continues to be a major contributor to death and
serious injury with on average 34% of drivers and riders killed recording BAC levels above
the legal limit. Research shows that with every increase of 0.05 above zero in BAC level
doubles the risk of being involved in a casualty crash.

The majority of driver and rider fatalities that test positive to an illegal BAC are more than
three times the legal limit.

Reducing the involvement of alcohol in crashes will need to be further addressed through
strong enforcement, together with public education and a penalty regime that sends a
clear message to drivers/riders about the severity of drinking and driving.

The increased use of technological solutions including the use of alcohol ignition interlocks
will need to be further explored as a mechanism for recidivist offenders who are not
responsive to mainstream deterrence methods. In the later years of this strategy, vehicle
technology and consumer interest may have developed so that passive alcohol interlocks
are fitted into new cars. Encouraging this development may be the most effective
long-term measure to reduce drink driving.

There is a range of evidence linking certain illegal and prescription drugs to increased
crash risk and South Australia currently undertakes a higher rate of random testing for
drugs than any other jurisdiction. Maintaining this level will be important, as will ongoing
monitoring and increasing our understanding of the problem.

Restraint Use
37% of all fatalities between 2008-2010 were not wearing a seatbelt at the time of the
crash, and this rate of non compliance amongst fatalities is generally higher in rural areas
than in metropolitan Adelaide. Research shows that wearing a seatbelt doubles your
chances of surviving a serious crash yet there are a small number of road users that
continue to travel unrestrained and put themselves and others at much higher risk of
death and injury.

There is evidence that seat belt reminders in vehicles can improve seatbelt wearing rates,
and South Australia will promote investigation into regulation in this area. During the life
of this strategy, however, focus will remain on co-ordinated enforcement and publicity
efforts which will be necessary to improve and maintain public understanding and use of
seatbelts. In addition, the use of appropriate child restraints will also greatly improve child
safety in vehicles.

DRAFT SOUTH AUSTRALIAN ROAD SAFETY STRATEGY 2020 - TOWARDS ZERO TOGETHER                          26
Aboriginal Road Users _________________________________________________________
Aboriginal people make up 1.5% of the State’s population but on average account for 4.5% of road
deaths, this is three times the road fatality rate for non-Aboriginal people. Significant numbers of
Aboriginal crash casualties are vehicle passengers, and factors for this may include - failure to wear
seatbelts, traveling in the rear of utilities or trucks and in some instances over-crowding of vehicles.
Also, almost as many Aboriginal pedestrians as drivers are admitted to hospital each year. Many crashes
involving Aboriginal people are not reported.

Many Government policy statements recognise that driver licensing, custodial sentences, employment
and life expectancy for Aboriginal people, whether in urban, rural and remote situations, are inextricably
linked. Systematically increasing the numbers of Aboriginal people who obtain as well as retain their
driver’s licence through a dedicated Aboriginal Driver Licensing Program would be a powerful start.

These and other approaches all serve to raise the profile of road safety as a key issue of concern in
Aboriginal communities. Infrastructure treatments such as road sealing and maintaining roads within and
around Aboriginal communities, together with improved road signage, help reduce road trauma for all
drivers as well as Aboriginal drivers.

Older Road Users _________________________________________________________________
During the last 10 years 162 people over the age of 70 were killed and 904 seriously injured while using
the South Australian road network. Those killed included drivers, motorcycle riders, vehicle passengers,
cyclists and pedestrians.

Research has shown that although older drivers are involved in a small number of crashes these crashes
are of higher severity, probably because of the frailty of these older users. Older drivers have been shown
to be more cautious and to exhibit less illegal and dangerous driving behaviour than other age groups and
there is evidence that older drivers self regulate to avoid risky situations and times of day.

Common crash types for older drivers are right turn crashes and crashes due to disobeying a traffic
signal or sign. The use of safer vehicles could provide benefits for older drivers particularly in providing
increased protection when a crash occurs. Improvements to the road environment are also important,
for example lower speed limits and controlled phases at traffic signals would prove beneficial for older
drivers. Improved safety for pedestrians and improved public transport will be important to older drivers
to maintain mobility and access to services without the need to drive a private motor vehicle.

Young Road Users ________________________________________________________________
Over the last ten years almost 4000 young people aged between 16 and 24 have been killed and seriously
injured on our roads. Young drivers are over represented in crashes and the resulting deaths and injuries
are a serious loss for South Australia. People aged 16 to 19 make up 5% of the population but account
for 13% of fatalities and 14% of serious injuries in South Australia each year. On average in South
Australia 31% of deaths of people between 15 and 24 are attributed to road crashes.

Younger drivers have a significantly higher risk of death relative to the number of kilometres they drive,
compared to other driver age groups. Neurological research shows that the human brain’s final stage
of development, particularly for males, continues well into a person reaching their early 20s. Young
drivers are at a high risk of crashing and also often have a high exposure at higher risk times of day. The
combination of these factors result in young drivers accounting for a significant proportion of the total
South Australian road toll.
Research has shown that young drivers are at most risk of crashing during their first year of driving
independently. Measures to limit exposure to high-risk situations during this first year have the potential
to significantly reduce trauma for younger drivers.

In the early months of driving independently young drivers are involved in high numbers of right turn and
run off the road crashes which would suggest skill and judgement issues. However, drivers aged 16 to
24 are also involved in crashes involving excessive speed and illegal alcohol levels at much greater rates
than older drivers which would suggest an involvement of risk taking behaviour.

DRAFT SOUTH AUSTRALIAN ROAD SAFETY STRATEGY 2020 - TOWARDS ZERO TOGETHER                                       27
You can also read