Initial report on Tunnel Air Quality - Advisory Committee on Tunnel Air Quality
←
→
Page content transcription
If your browser does not render page correctly, please read the page content below
Advisory Committee
       on Tunnel Air Quality

   Initial report on
Tunnel Air Quality

                  JULY 2014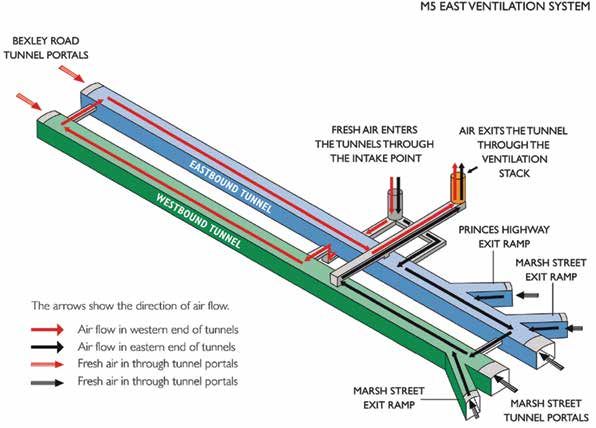
Executive Summary

NSW Government agencies have more than two              The NSW Government, therefore, established
decades’ experience in assessing and operating          an Advisory Committee on Tunnel Air Quality
long motorway tunnels.                                  – chaired by NSW Chief Scientist & Engineer,
                                                        Professor Mary O’Kane – to provide a ‘whole-
Sydney has five lengthy motorway tunnels with
                                                        of-government’ understanding of the scientific
significant ventilation systems incorporating stacks
                                                        and engineering issues informing road tunnel
to manage vehicle emissions. These tunnels, and
                                                        ventilation design and operation based on NSW,
the years in which they opened, are:
                                                        national and international experience.
   •   Sydney Harbour Tunnel – 1992
                                                        In this, its Initial Report, the Committee presents
   •   Eastern Distributor – 1999
                                                        information on the design, assessment and
   •   M5 East – 2001
                                                        operation of road tunnels; describes how the
   •   Cross City Tunnel – 2005                         application of current knowledge can be used to
   •   Lane Cove Tunnel – 2007                          make informed decisions regarding the design
                                                        and operation of road tunnels; and identifies
Community groups have raised concerns about
                                                        additional work that is recommended to improve
major tunnel developments over the years partly
                                                        decisions regarding the design and operation of
because of the potential impacts on air quality.
                                                        road tunnels.
In response, successive NSW Governments have
subjected Sydney’s road tunnels to detailed             Up until now, approval conditions and
environmental assessment prior to approval.             requirements placed on one tunnel project have
The M5 East, Cross City and Lane Cove tunnels           formed the starting point for the next, with the
are required to undertake extensive monitoring          added inclusion of any precautionary controls
of in-tunnel air quality during operation.              to address emerging issues. However, a fresh
                                                        approach is required for Sydney’s newest road
The effectiveness of the stacks in dispersing
                                                        tunnel projects to address:
tunnel emissions from the M5 East, Cross City and
Lane Cove tunnels has also been measured as                •   Community concern as to whether
part of separate air quality monitoring programs,              air quality criteria properly address
which have demonstrated that nearby residents                  vehicle emissions
experienced little, if any, increase in exposure to        •   Changes to vehicle technologies that,
vehicle emissions.                                             while reducing the magnitude of vehicle
                                                               emissions, have also altered the composition
Community confidence in the management of air
                                                               of those emissions
quality within tunnels, as well as preserving local
                                                           •   Experience from the Lane Cove and Cross
ambient air quality, is critical to the acceptance of
                                                               City tunnels that has shown that the
road tunnels as an effective traffic and transport
                                                               ventilation systems are over-designed and
solution. This will be particularly important
                                                               that the approval conditions have resulted
for Sydney’s NorthConnex and WestConnex
                                                               in inefficient operating regimes.
motorway projects, as the associated road tunnels
are likely to be the longest in Australia.              While motor vehicles remain a significant source
                                                        of air pollution in Sydney, stricter emission
                                                        standards and improved fuel quality have resulted
                                                        in substantial reductions in pollution in the past
                                                        two decades and, by national and international
                                                        standards, the city’s overall air quality is
                                                        generally good.

                                                                               Initial report on Tunnel Air Quality!|!i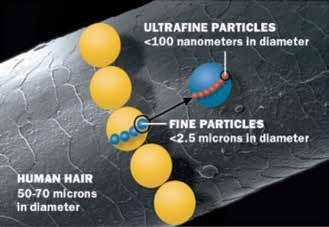
Executive Summary

The Committee called for a review of the up-to-         The Committee therefore recommends that
date science literature, which concluded emissions      further work be undertaken in three areas to
from well-designed road tunnels cause a negligible      improve decisions regarding the design and
change to surrounding air quality, and as such,         operation of road tunnels:
there is little to no health benefit for surrounding    1. Provide information and make
communities in installing filtration and air               recommendations on the assessment and
treatment systems in such tunnels.                         management of portal emissions to improve
Outside Australia almost all road tunnels use portal       ventilation system efficiency, reduce
emissions. Reductions in emissions has reduced             overall environmental impacts and provide
the need for ventilation stacks, and it has become         appropriate protection of the air quality for
possible to meet both in-tunnel and outdoor air            tunnel users and the community in the vicinity
quality requirements using portal emissions alone          of the tunnel portals.
for some or all of the time. However, in urban areas    This should include exploring the potential for:
portal emissions are often supplemented by the
use of stacks, which are seen as a precautionary        a. optimising portal design on new tunnel projects
measure – providing flexibility and resilience in the      to maximise dispersion and minimise impacts
ventilation system design.                                 through the use of physical or computer
                                                           models (eg wind tunnels or computational
Despite it being common practice internationally           fluid dynamics)
to allow portal emissions, operating conditions
have been set for the M5 East, Cross City and Lane      b. an investigation of the potential for partial
Cove Tunnels requiring all emissions be expelled           portal emissions at an operating Sydney tunnel
through stacks, which requires significant energy          without increasing nearby residents’ exposure
use and, during periods of low traffic, may deliver        to vehicle emissions.
little appreciable environmental benefit.

ii!|!Advisory Committee on Tunnel Air Quality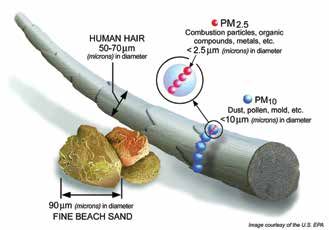
2. Research, develop and make
   recommendations on in-tunnel NO2 limits
   that would provide an appropriate level of
   protection in the medium to long-term.

At the present time an appropriate level of
protection from the effect of all road vehicle
pollutants in-tunnel is provided through a
combination of the existing CO and visibility limits.
However, as the composition of vehicle emissions
continues to change as emissions decrease, the
addition of a duly considered NO2 limit would
ensure an appropriate level of protection continues
in the medium to long-term.

3. Investigate and recommend fit-for-purpose
   standard methods for monitoring in-tunnel
   air NO2 levels to improve consistency
   across projects.

Pollutant concentrations are routinely monitored
in Sydney road tunnels to manage ventilation
systems. Monitoring methods for CO and visibility
are well established. Monitoring in-tunnel NO2
levels is a more complex task than monitoring
CO or visibility. There are a number of techniques
for monitoring in-tunnel NO2 levels. Although
standard methods are specified for stack and
ambient NO2 monitoring, they do not take
into account the specific circumstances of the
in-tunnel environment.

                                                        Initial report on Tunnel Air Quality!|!iii
Contents
Glossary 1 6. Regulation of tunnels 32
6.1. Role of government agencies 32
1. Introduction 2 6.2. Air quality criteria for tunnels 32
6.2.1. Ambient criteria 32
2. Context 4 6.2.2. Emission limits 32
2.1. Air quality trends in Sydney 4 6.2.3. In-tunnel criteria 32
2.1.1. Ozone 5 6.3. Monitoring tunnel emissions and impacts 33
2.1.2. Particulate matter 6 6.3.1. Standard monitoring methods 33
2.2. Air quality – how Sydney compares 10 6.3.2. In-tunnel monitoring 33
2.3. Motor vehicle emissions – sources and trends 15 6.3.3. Portal emission monitoring 33
2.3.1. National vehicle emission standards 16
2.4. Health effects of traffic-related air pollution 19 7. Conclusions and recommendations 34
2.4.1. Health effects of proximity to traffic 19
2.4.2. Health effects from ozone exposure 19 8. References 35
2.4.3. Health effects from fine
particle exposure 20
Eleven technical papers have been produced by
2.4.4. Health effects from exposure
to nitrogen dioxide 20 the advisory committee on tunnel air quality to
provide additional background on key aspects
2.4.5. Carcinogenicity of air pollution
and its constituents 20 contained in this interim report.
2.5 Summary 20
Technical papers
Technical paper 1
3. Control of tunnel pollution by ventilation 21 Trends in motor vehicles and their emissions
3.1. Tunnel ventilation system design 21 Technical paper 2
Air quality trends in Sydney
3.2. Stack operation and performance 22
Technical paper 3
3.2.1. Predicting and assessing the Health effects of traffic related air pollution
impact of stacks 23
Technical paper 4
3.3. Portal emissions 23 Road tunnel ventilation systems
3.3.1. Predicting and assessing the impact Technical paper 5
of portal emissions 25 Road tunnel stack emissions
3.4. Energy use 25 Technical paper 6
Road tunnel portal emissions
4. Options for reducing emissions Technical paper 7
Options for reducing in-service vehicle emissions
from road tunnels 27
Technical paper 8
4.1. Reducing overall vehicle
Options for treating road tunnel emissions
fleet emissions 27
Technical paper 9
4.2 Smoky vehicle program 27
Evolution of tunnels in Sydney
4.3. Low-emission zones 27
Technical paper 10
4.4. Filtration and air treatment 28 Role of regulators for tunnel projects
Technical paper 11
Criteria for in-tunnel and ambient air quality
5. Evolution of tunnels in Sydney 30
iv!|!Advisory Committee on Tunnel Air QualityGlossary
Term Description Term Description
ADR The Australian Design Rules (ADRs) Particulate Very small solid particles or liquid
are national standards for vehicle matter droplets, which may become
safety, anti-theft and emissions suspended in air.
Airshed Part of the atmosphere that shares Piston The forcing of air through a road
a common flow of air and that is effect tunnel as a result of moving vehicles.
exposed to similar influences.
Plume A parcel of air in which substances
Ambient Ambient pollutant concentrations (air pollutants) are present at
refer to the concentrations of concentrations higher than the
pollutants in the air, which are surrounding airshed.
generated by all local pollutant
sources, ie the term refers to the PM Particulate matter
general pollutant loads in the air. PM10 Particulate matter with an
CO Carbon monoxide equivalent aerodynamic diameter
of 10 micrometres or less.
DP&E Department of Planning and
Environment PM2.5 Particulate matter with an
equivalent aerodynamic diameter
EPA Environment Protection Authority of 2.5 micrometres or less.
EU European Union ppb Parts per billion describes the
concentration of a pollutant in
HDV Heavy Duty Vehicle; a truck, air in terms of volume ratio. A
semi-trailer or bus concentration of 1 ppb means that for
IARC International Agency for Research every billion (109) units of air, there
on Cancer is one unit of pollutant present.
kg kilogram ppm Parts per million describes the
concentration of a pollutant in
km kilometre air in terms of volume ratio. A
LCV Light commercial vehicle – any rigid concentration of 1 ppm means that
vehicle seating 12 or less with a cab for every million (106) units of air,
chassis construction, greater than there is one unit of pollutant present.
1.5 but less than 4.5 tonne gross pphm Parts per hundred million describes
vehicle mass (GVM), and two axles. the concentration of a pollutant
LDV Light Duty Vehicle; a car, van or in air in terms of volume ratio. A
small bus seating 12 or less. concentration of 1 pphm means
that for every hundred million (108)
LEZ Low Emission Zone. LEZs are areas in units of air, there is one unit of
which vehicles are required to meet a pollutant present.
minimum emissions standard.
TSP Total suspended particulate matter.
mg/m3 milligram per cubic metre. A
concentration of 1 mg/m3 means that UFP Ultrafine particles (UFPs) are
one cubic metre of air contains one particulate matter with an
milligram (0.001 grams) of pollutant. equivalent aerodynamic diameter
of 0.1 micrometres or less.
MW and A megawatt (MW) is a unit for
MWh measuring power that is equivalent µg/m3 microgram per cubic metre.
to one million watts. One megawatt A concentration of 1 µg/m3 means
is equivalent to the power of that one cubic metre of air contains
10 automobile engines. one microgram (0.000001 grams)
of pollutant.
A megawatt hour (MWh) is 1,000
kilowatts of electricity being used VKT Vehicle kilometres travelled (VKT)
continuously for one hour. It is is the total distance travelled by
about equivalent to the amount of the specified group of vehicles.
electricity used by about 330 homes For example, total annual VKT in
during one hour. Sydney is the number of kilometres
travelled by all vehicles in Sydney
NO2 Nitrogen dioxide during one year.
NOX Oxides of nitrogen, including nitric VOCs Volatile organic compounds.
oxide (NO) and NO2 Organic compounds that vaporise
(become a gas) at room temperature.
O3 Ozone
WHO World Health Organization
OEH Office of Environment and Heritage
Initial report on Tunnel Air Quality!|!11. Introduction
NSW Government agencies have in excess of Previously, approval conditions and requirements
20 years’ experience in assessing and operating for one tunnel project have formed the starting
long motorway tunnels. Sydney has five lengthy point for the next project, with the inclusion of
motorway tunnels with substantial ventilation any additional precautionary controls deemed
systems incorporating stacks. These tunnels, and necessary to address emerging issues.
the years in which they opened, are:
However, a fresh approach is required for Sydney’s
• Sydney Harbour Tunnel – 1992 newest road tunnel projects to address:
• Eastern Distributor – 1999 • Community concern as to whether
• M5 East – 2001 air quality criteria properly address
• Cross City Tunnel – 2005 vehicle emissions.
• Lane Cove Tunnel – 2007 • Changes to vehicle technologies that,
while reducing the magnitude of vehicle
Some community groups have expressed
emissions, have also altered the composition
concern about major tunnel projects over the
of those emissions.
years partly because of the potential impacts on
• Experience from the Lane Cove and Cross
air quality. Successive NSW Governments have
City tunnels that has shown that the
responded by subjecting these tunnels to detailed
ventilation systems are over-designed and
environmental assessment prior to approval,
that the approval conditions have resulted
and extensive monitoring of in-tunnel air quality
in inefficient operating regimes.
during operation.
The NSW Government, therefore, has established
The effectiveness of ventilation stacks in
an Advisory Committee on Tunnel Air Quality –
dispersing emissions from the M5 East, Cross
chaired by the NSW Chief Scientist and Engineer,
City and Lane Cove tunnels have been measured
Professor Mary O’Kane – to provide it with a
as part of project approval conditions which
‘whole-of-government’ understanding of the
required extensive ambient air quality monitoring
scientific and engineering issues informing tunnel
to ensure that residents in surrounding areas
ventilation design and operation based on NSW,
experience little, if any, increase in exposure to
national and international experience.
vehicle emissions.
Community confidence in the management
of air quality within tunnels, as well as the
preservation of air quality in surrounding areas,
is vital to the acceptance of road tunnels as an
effective traffic and transport solution. This will be
particularly important for Sydney’s NorthConnex
and WestConnex motorway projects, as the
associated road tunnels are likely to be the longest
in Australia.
2!|!Advisory Committee on Tunnel Air QualityThe Advisory Committee on Tunnel Air Quality has This initial report presents a synthesis of these
commissioned the following Technical Papers: Technical Papers, and:
• Trends in motor vehicles and their emissions • Provides information on the design,
(Technical Paper 1) assessment and operation of measures
• Air quality trends in Sydney to manage air quality associated with
(Technical Paper 2) road tunnels.
• Health effects of traffic related air pollution • Describes how the application of current
(Technical Paper 3) knowledge can be used to make informed
decisions regarding the design and
• Road tunnel ventilation systems
operation of measures to manage air
(Technical Paper 4)
quality associated with road tunnels.
• Road tunnel stack emissions
• Identifies additional work that is
(Technical Paper 5)
recommended to improve decisions
• Road tunnel portal emissions
regarding the design and operation of
(Technical Paper 6)
road tunnels.
• Options for reducing in-service vehicle
emissions (Technical Paper 7)
• Options for treating road tunnel emissions
(Technical Paper 8)
• Evolution of tunnels in Sydney
(Technical Paper 9)
• Role of regulators for tunnel projects
(Technical Paper 10)
• Criteria for in-tunnel and ambient air quality
(Technical Paper 11)
Initial report on Tunnel Air Quality!|!32. Context
Information about air quality in and around road tunnels needs to be understood in the context of air
quality more generally. This section of the report addresses these background issues and includes a
discussion of ambient air quality in Sydney, the sources of air pollution (including motor vehicles) and a
discussion of the possible health effects of air pollution.
2.1. Air quality trends in Sydney
The National Environment Protection (Ambient Air Quality) Measure (‘AAQ NEPM’) establishes national
standards for air pollutants (NEPC, 2003). The AAQ NEPM standards were set based on scientific
studies of air quality and human health, with Australian conditions taken into account in estimating likely
exposures. Each standard includes the maximum acceptable concentration (in ppm or µg/m3) and the time
period over which that concentration is averaged (in hours, days or years) (DEH, 2005). A summary of the
maximum observed concentrations of air pollutants in Sydney during 2012, and how these perform against
the standards in the AAQ NEPM, is provided in Table 2.1. Annual trends in air pollutant concentrations are
shown in Figure 2.1. The different particle size fractions are explained in Section 2.1.2.
In the Sydney region, carbon monoxide (CO), nitrogen dioxide (NO2) and sulphur dioxide (SO2)
concentrations are consistently well below the national standards. Ozone (O3) and particulate matter (PM)
levels occasionally exceed the national standards in the Sydney region, with no apparent downward trend
in the concentrations of these pollutants.
Table 2.1: National air quality standards and maximum concentrations observed in Sydney 2012
(OEH data)
Averaging Maximum concentration % of the
Pollutant period Standard in 2012 Standard
Carbon monoxide (CO) 8 hours 9.0 ppm 2.2 ppm 24
1 hour 0.12 ppm 0.062 ppm 52
Nitrogen dioxide (NO2)
1 year 0.03 ppm 0.013 ppm 43
1 hour 0.20 ppm 0.025 ppm 13
Sulphur dioxide (SO2) 1 day 0.08 ppm 0.005 ppm 6
1 year 0.02 ppm 0.001 ppm 5
Photochemical oxidants 1 hour 0.10 ppm 0.095 ppm 95
(as ozone O3)
4 hour 0.08 ppm 0.084 ppm 105
Particles as PM10 1 day 50 µg/m3 99.2 µg/m3 199
1 day 25 µg/m3(a) 116.7 µg/m3 467
Particles as PM2.5
Annual 8 µg/m3(a) 8.5 µg/m3 107
(a) AAQ NEPM Advisory Reporting Standard – the NEPM goal is to collect sufficient PM2.5 data to develop
national standards.
4!|!Advisory Committee on Tunnel Air QualityFigure 2.1: Maximum annual average pollutant concentrations recorded for Sydney, 1994 – 2012
(OEH data)
2.0 40
PM10 and PM2.5 annual average concentration (μg/m3)
CO (ppm), NO2 (pphm), O3 (pphm) and SO2 (pphm)
O3
1.5 30
annual average concentration
1.0 20
PM10
NO2
0.5 10
CO
PM2.5
SO2
0.0 0
1994 1996 1998 2000 2002 2004 2006 2008 2010 2012
2.1.1. Ozone
Ozone is a major component of photochemical smog. It is formed in the lower atmosphere when a number
of ‘precursor’ compounds – mainly oxides of nitrogen (NOx) and volatile organic compounds (VOCs) –
react in warm, sunny conditions. Peak ozone levels in Sydney are therefore typically observed between
November and March.
Road transport is the main source of NOx emissions in Sydney, and is the second largest source of
VOCs. NSW Office of Environment & Heritage modelling shows that motor vehicle emissions are a major
contributor to peak ozone concentrations in Sydney. Other significant sources of precursor emissions
include domestic/commercial activities and natural processes (EPA, 2012). Factors affecting ozone
concentrations in Sydney include changes to precursor emissions, meteorological conditions, and changes
in background ozone concentrations. Figure 2.2 presents maximum ozone concentrations and number of
days exceeding the AAQ NEPM standards from 1994 to 2011.
Initial report on Tunnel Air Quality!|!52. Context
Figure 2.2: Maximum 1-hour and 4-hour average ozone concentrations in Sydney and number of
days exceeding national standards during November (previous year) to March (following year)
Maximum 1hr Maximum 4hr
concentration concentration 1hr exceedance 4hr exceedance
200 40
150 30
Number of exceedances
Max
Concentration (ppb)
1hr
Max
4hr
100 20
50 10
0 0
1994- 1996- 1998- 2000- 2002- 2004- 2006- 2008- 2010-
1995 1997 1999 2001 2003 2005 2007 2009 2011
Ozone season
Figure 2.2 suggests that there has been a decrease 2.1.2. Particulate matter
in the number of high ozone days since 2003.
Particulate matter (PM) in the air can come
However, as ozone concentrations are strongly
directly from natural sources such as bushfires and
influenced by the occurrence of hot, sunny
dust storms, and also from human activities such
conditions, there is variability associated with
as wood burning, quarrying and mining, motor
climatic fluctuations. A comprehensive statistical
vehicle use and industrial processes. Particulate
analysis over the period 1994–2010 concluded that
matter is also produced or altered by chemical
there has been no significant upward or downward
reactions between gases, or between gases
trend in ozone concentrations in Sydney when
and other particles in the air. Particle pollution is
climatic variation is removed (Johnson and
evident as the brown haze sometimes seen in the
Quigley, 2013).
cooler months of the year.
While particles larger than 10 micrometres in
diameter readily deposit on the ground over short
distances from their source, smaller particles may
be carried long distances. Airborne particles cover
a wide range of sizes, and they are commonly
defined by the following size-based terms:
6!|!Advisory Committee on Tunnel Air QualityUltrafine particles (UFPs) are particles of 0.1 PM10 are particles of 10 µm in aerodynamic
micrometres (µm) in aerodynamic diameter or less. diameter or less and include both UFPs and PM2.5.
UFPs are formed during combustion processes or The majority of particles in the size range PM2.5
by chemical reactions in the atmosphere. They are to PM10 (referred to as the coarse fraction) are
transformed rapidly due to coagulation, adsorption typically generated by mechanical action such as
and secondary particle formation (WHO Regional vehicles on dirt roads and wind-blown dust from
Office for Europe, 2013). UFP lifetimes in the landfills and quarries.
atmosphere can be very short; under typical
The sizes of airborne particles are placed into
urban conditions the half-life is around one
context in Figure 2.3, in which they are compared
hour for particles with a diameter of 0.02 µm
with a human hair and beach sand.
(WHO Regional Office for Europe, 2006).
PM2.5 (fine particles) are particles of 2.5 µm in
aerodynamic diameter or less and include ultrafine
particles. PM2.5 may be emitted directly into
the atmosphere, and also created by reactions
between gas-phase pollutants. Sources of direct
PM2.5 emissions include wood heaters, diesel
vehicles, ships and industrial processes. Sources
of the precursor pollutants that chemically react
to form PM2.5 include motor vehicles, shipping,
agriculture, off-road industrial vehicles and
evaporative emissions from paints and solvents.
Figure 2.3: Illustration showing the different particulate matter size fractions
Figure 2.4 shows some of the most important sources of airborne particles in different size ranges,
as well as the processes (mechanical and chemical) by which they are formed.
Initial report on Tunnel Air Quality!|!72. Context
Figure 2.4: Particulate matter size fractions, sources, formation mechanisms and composition
Primary particles
– mechanical grinding/crushing
– dust from industry and energy generation
– resuspension of dust
– ocean spray
– biological sources (plants, animals micro-organisms)
Secondary particles
– gases react and
form particles
Primary particles
– from combustion
tion
gula
Coa
Accumulation Coarse
Nucleation
mode mode
mode
0.01 0.1 1 2.5µm 10 100
particle diameter (µm)
PM10
PM2.5
Ultra Fine
Smoke and soot
Wind blown dust
Diesel exhaust
Vehicles on dirt road
The particle size fractions that are monitored in not yet been adopted by any major jurisdiction
Sydney (and across NSW) are PM10 and PM2.5. internationally. UFP measurement techniques are
With recent advances in instrumentation and actively being developed to address issues such as
measurement technology, it is now possible the high cost and lack of robustness required for
to measure atmospheric UFPs. UFPs are most field operation (Kumar et al., 2011).
appropriately measured in terms of their number
PM pollution varies significantly from year to year
concentration. This is because their numbers
(Figure 2.5). High peak and average PM10 and PM2.5
are large, whereas their mass is small compared
levels are typically recorded during years that are
with the mass of larger particles. However, UFP
affected by large bushfires (eg 2001–2003) or by
measurement is still primarily a research activity,
major dust storm events (eg September 2009).
and air quality standards relating to UFPs have
8!|!Advisory Committee on Tunnel Air QualityFigure 2.5: PM10(a) and PM2.5(b) maximum 24-hour average concentrations and numbers of days
exceeding national 24-hour standards in Sydney
PM10 exceedances PM2.5 exceedances
35
PM10 and PM2.5 annual maximum concentration (μg/m3)
30 300
25
Number of days above standards
20 200
15
PM2.5
10 100
PM10
5
0 0
1997 1999 2001 2003 2005 2007 2009 2011
(a) The AAQ NEPM permits maximum allowable exceedences of the PM10 standard of 5 days per year.
(b) AAQ NEPM Advisory Reporting Standard – the NEPM goal is to collect sufficient PM2.5 data to develop
national standards.
Initial report on Tunnel Air Quality!|!92. Context 2.2. Air quality – how Sydney compares Air quality in Sydney is good by national and international standards. Care must be taken when comparing air quality in different urban areas. Differences in monitoring equipment, in the rationale behind placement of stations, and in the number of stations can influence the comparability of pollutant concentrations. Nevertheless, the data from various sources confirm that Sydney has good air quality by international standards. Figures 2.6 to 2.12 compare Sydney’s air quality with that of other Australian and international cities/regions. Figure 2.6: Annual average PM10 concentrations in 1,600 urban areas*, 2008–2013 Reproduced with permission 10!|!Advisory Committee on Tunnel Air Quality
Figure 2.7: Global annual average PM2.5 2001–2006 (Donkelaar, 2010)
Reproduced with permission from Environmental Health Perspectives
Figure 2.8: International PM2.5 comparisons
Annual Average PM2.5 2011
30
PM2.5 (μg/m3)
20
10
0
Sofia
Warsaw
Rome
Brussels
Lyon
Berlin
Barcelona
Amsterdam
Paris
Hamburg
Prague
London
Chicago
Pittsburgh
Madrid
Houston
Phoenix
Milwaukee
Washington
Calgary
Boston
Montreal
Edmonton
Seattle
Stockholm
Denver
Toronto
Ottowa
Sydney
Vancouver
Source – Environment Canada http://ec.gc.ca/indicateurs-indicators/default.asp?lang=en&n=1B7C2AC9-1
Initial report on Tunnel Air Quality!|!11NO2 (ppb)
0
10
20
30
Rome
Barcelona
London
Paris
Lyon
2. Context
Madrid
Chicago
Brussels
Denver
Amsterdam
12!|!Advisory Committee on Tunnel Air Quality
Athens
Zürich
Figure 2.9: International NO2 comparisons
Phoenix
Sofia
Stockholm
Prague
Bucharest
Toronto
Berlin
Boston
Annual average NO2 2011
Edmonton
Calgary
Hamburg
Warsaw
Washington
Milwaukee
Source – Environment Canada http://ec.gc.ca/indicateurs-indicators/default.asp?lang=en&n=1B7C2AC9-1
Montreal
Pittsburgh
Vancouver
Houston
Sydney
OttawaFigure 2.10: International ozone comparisons
Annual average of daily 8-hr maximum ozone concentrations
60
Ozone (ppb)
40
20
0
Denver
Phoenix
Pittsburgh
Washington
Athens
Sofia
Houston
Chicago
Madrid
Milwaukee
Rome
Berlin
Boston
Stockholm
Barcelona
Lyon
Toronto
Calgary
Prague
Edmonton
Warsaw
Hamburg
Ottawa
Zürich
Paris
Montreal
Sydney
London
Seattle
Brussels
Amsterdam
Vancouver
Bucharest
Sources – Environment Canada http://ec.gc.ca/indicateurs-indicators/default.asp?lang=en&n=1B7C2AC9-1, Office of
Environment and Heritage, New South Wales (2014) http://www.environment.nsw.gov.au/AQMS/search.htm
Note: The above ozone indicators are based on the annual average of the 8-hour daily maximum
concentrations for a given city for the calendar year 2011. However the value for Sydney represents the
annual average of the 4-hour daily maximum concentrations for the same year. This thus overstates the
Sydney ozone indicator compared with other locations.
Initial report on Tunnel Air Quality!|!132. Context
Figure 2.11: PM10 trends in Melbourne, Sydney, Brisbane and Perth
Melbourne Sydney Brisbane Perth
80
70 NEPM Standard
60
Concentration (μg/m3)
50
40
30
20
10
0
1999 2000 2001 2002 2003 2004 2005 2006 2007 2008
http://www.environment.gov.au/science/soe/2011-report/3-atmosphere/3-ambient-air-quality/3-1-state-and-trends#ss3-1-2
Note: The above PM10 indicators are based on the 95th percentile 24-hour average PM10 concentrations
averaged across all city monitoring sites in Melbourne, Sydney, Brisbane and Perth, 1999–2008.
Figure 2.12: Ozone trends in Melbourne, Sydney, Brisbane and Perth
Melbourne Sydney Brisbane Perth
a NEPM Standard b NEPM Standard
0.12 0.12
Concentration (ppm)
Concentration (ppm)
0.10 0.10
0.08 0.08
0.06 0.06
0.04 0.04
0.02 0.02
0.00 0.00
1999
2000
2001
2002
2003
2004
2005
2006
2007
2008
1999
2000
2001
2002
2003
2004
2005
2006
2007
2008
http://www.environment.gov.au/science/soe/2011-report/3-atmosphere/3-ambient-air-quality/3-1-state-and-trends#ss3-1-2
Note: Graph (a) shows the maximum four-hour ozone concentrations averaged across all city monitoring
sites and Graph (b) shows the 95th percentile four-hour average ozone concentrations averaged across all
city monitoring sites.
Additional detail on air quality trends in Sydney is provided in Technical Paper 2.
14!|!Advisory Committee on Tunnel Air Quality2.3. Motor vehicle emissions – sources and trends
Motor vehicles are a major source of human many other sources of particles from both natural
generated air pollution in Sydney, contributing processes (eg bush fires) and human activities
62 per cent of oxides of nitrogen (NOx) emissions, (eg wood burning, quarrying and mining).
24 per cent of volatile organic compound
Figure 2.13 below shows the emissions from motor
(VOC) emissions, and 13 per cent of PM2.5
vehicles compared with other human generated
emissions during 2008. While motor vehicles
emissions sources (such as industry and wood
are contributors to particle pollution, there are
heaters) (EPA, 2012).
Figure 2.13: Contribution of motor vehicle emissions to anthropogenic emissions in Sydney 2008
Motor
Motor vehicles
vehicles 14%
24%
Other
38% Motor
vehicles Other Other
62% 76% 87%
PM2.5
NOx emission sources VOC emission sources
emission sources
Based on data from the 2008 Calender Year Air Emissions Inventory for the Greater Metropolitan Region in NSW, (EPA, 2012)
Initial report on Tunnel Air Quality!|!152. Context
2.3.1. National vehicle emission standards ‘Euro VI’ for HDVs is currently under investigation.
Meeting these standards will require the
New on-road motor vehicle emission limits are
widespread adoption of diesel particulate filters
set by the Commonwealth Government via the
on new vehicles. Diesel particulate filters are very
Australian Design Rules (ADRs). The first ADR
effective at reducing both the mass of PM and
governing vehicle emissions (from petrol cars)
the number of UFPs emitted. Implementation of
was set in 1972, with ADR26 setting a limit for
the new standards led to a decrease in UFP levels
the exhaust concentration of CO at engine idle.
in European environments (Jones et al., 2012;
The emission standards for light-duty vehicles
Wåhlin, 2009).
(LDVs) and heavy-duty vehicles (HDVs) have been
progressively tightened over time based on United The current LDV emission standards are
States and – more recently – European Union approximately 95 per cent lower than the original
(EU) standards. 1976 standards (Figure 2.14). The current HDV
diesel standards are 75 per cent lower for NOx and
Australia has adopted the ‘Euro 5’ and ‘Euro 6’
nearly 95 per cent lower for PM than those first
emission standards for petrol and diesel LDVs, and
introduced in 1996 (Figure 2.15).
the ‘Euro V’ standards for HDVs. The adoption of
Figure 2.14: Emission standard requirements for new heavy-duty diesel engines with time
Heavy Duty Diesel Emission Limits
100
NOx Particulate Matter
Percentage of 1996 emission standards
75
50
25
0
1996 (Euro I) 2003 (Euro III) 2008 (Euro IV) 2011 (Euro V) 2017 (Euro VI Proposed)
16!|!Advisory Committee on Tunnel Air QualityFigure 2.15: Emission standard requirements for new petrol passenger vehicles with time
Passenger Vehicle Emission Limits
100
Hydrocarbons
Percentage of 1976 emission standards
NOx
75
50
25
0
1976 1986 (US 75) 1999 (US 90) 2006 (Euro 3) 2010 (Euro 4) 2013 (Euro 5)
As a result of these increasingly stringent emission standards, and also improvements in fuel quality, total
exhaust emissions from motor vehicles have decreased over the past two decades. Emissions from road
transport are also expected to continue to fall (Figure 2.16), despite a projected increase in the number
of vehicles and the number of kilometres driven (Figure 2.17).
Figure 2.16: Projected emission trends for motor vehicles in the NSW Greater Metropolitan Region
shown as a percentage of baseline year 2003
Oxides of nitrogen Particulate matter (PM2.5)
100 100
100 100
Percentage of Baseline Year 2003
80 68 80 68
60 60 50 47
2003 40
2003
40 31
2011 2011
20 15 20 2021 2031
2021 2031
0 0
Baseline Baseline
Volatile organic compounds Particulate matter (PM10)
(mostly unburnt fuels)
100
100 100
80 80 75
64 64
55
60 60
2003 2003
40 27 40
2011 2011 2021 2031
17
20 20
2021 2031
0 0
Baseline Baseline
Initial report on Tunnel Air Quality!|!172. Context
Figure 2.17: Historical and projected average weekday vehicle kilometres travelled (VKT) in NSW
Greater Metropolitan Region
Cars Motorcycles Articulated Trucks
Rigid Trucks LCV Bus
120,000,000
VKT Av Weekday (Rigid, Artic, Bus, MC)
12,000,000
VKT Av Weekday (Cars, LCV)
100,000,000 10,000,000
80,000,000 8,000,000
60,000,000 6,000,000
40,000,000 4,000,000
20,000,000 2,000,000
0 0
2000 2005 2010 2015 2020 2025 2030 2035 2040
Year
Figure note: The vehicle classes represented by the dashed lines refer to the right hand axis.
Additional detail on trends in motor vehicles and their emissions is provided in Technical Paper 1.
18!|!Advisory Committee on Tunnel Air Quality2.4. Health effects of relationship. These outcomes were the onset
of childhood asthma, non-asthma respiratory
traffic-related air pollution
symptoms, impaired lung function, total and
Exposure to motor vehicle pollution is linked cardiovascular mortality, and cardiovascular
to several adverse health outcomes – ranging morbidity. The HEI report identified that the area
from irritation of the airways to early mortality. in the first 300 to 500m from a major road was
Reducing this exposure will provide various public the most highly affected by traffic emissions
health benefits, including improved cardiovascular (HEI, 2010).
and respiratory health and reduced rates of cancer.
Non-combustion processes (brake wear, engine
One way of looking at the effects of motor vehicle abrasion, tyre wear) also generate airborne PM.
pollution on health is to estimate the contribution Toxicological studies have demonstrated that
of air pollution to the total burden of disease. these non-exhaust emissions contribute to the
Exposure to motor vehicle pollution is estimated health impact from exposure to traffic-related
to contribute less than 1 per cent of the health pollution (WHO Regional Office for Europe, 2013).
burden in Australia, as the Australian Institute Non-exhaust emissions are a significant source of
of Health and Welfare calculated that urban air on-road particle emissions in Sydney (NSW EPA,
pollution was responsible for 1 per cent of the total 2012). As exhaust emissions are further regulated
burden of disease and injury in Australia in 2003 and reduced, understanding non-exhaust
(Begg, 2007). emissions will increasingly become the focus to
address health risks from future traffic pollution
In-tunnel exposure to motor vehicle pollution is
(HEI, 2010; WHO Regional Office for Europe, 2013).
typically a small component of total exposure.
2.4.1. Health effects of proximity to traffic 2.4.2. Health effects from ozone exposure
Short-term exposure to ozone (hours) can result
Adverse health effects have been observed
in reduced lung function, exacerbation of asthma
in association with proximity to roads. These
and chronic respiratory diseases, and irritation and
effects persist after adjustment for traffic noise
inflammation of the eyes, nose, throat and lower
and socioeconomic status, and are only partly
airways. There is a growing body of evidence to
explained by exposure to PM2.5. Therefore, it is
support the hypothesis that long-term exposure
likely that they result from exposure to other
to ozone (years) may affect respiratory and
traffic-related pollutants, either individually
cardiovascular mortality, and respiratory morbidity
or in combination (WHO Regional Office for
(WHO Regional Office for Europe, 2013).
Europe, 2013).
The evidence is inconclusive for a threshold below
The Health Effects Institute synthesised the
which exposure to ozone is not associated with
research on traffic-related air pollution exposure
adverse health effects. However, from available
and health outcomes in 2010 (HEI, 2010), and
evidence, if there is a threshold it would be below
concluded that exposure to traffic-related air
0.045 ppm (1 hour average) (WHO Regional Office
pollution causes exacerbation of asthma. The
for Europe, 2013).
evidence linking exposure to traffic-related
air pollution to several other health outcomes
was weaker, but was suggestive of a causal
Initial report on Tunnel Air Quality!|!192. Context
2.4.3. Health effects from fine 2.4.4. Health effects from exposure
particle exposure to nitrogen dioxide
A discussion of the commonly used PM Nitrogen dioxide is a good marker of traffic-related
measurement metrics was provided in pollution. Toxicological studies have found effects
Section 2.1.2. The health effects associated with of NO2 at levels far exceeding those normally
these metrics are summarised below. observed in ambient air (WHO Regional Office
for Europe, 2006). Nitrogen dioxide is highly
PM10
correlated with other pollutants from combustion
Exposure to PM10 is associated with cardiovascular sources, which has made it very difficult to
disease, respiratory disease and mortality. separate the effects of NO2 from the effects
However, because PM10 includes PM2.5 there of other traffic-related pollutants, especially
is some uncertainty about how much of the PM. However, there is increasing evidence that
observed effect is due to PM2.5 and how much is indicates there are independent effects of NO2
due to the coarse PM size fraction (PM10-2.5). separate from PM (WHO Regional Office for
PM2.5 Europe, 2013).
There is very good evidence that exposure to 2.4.5. Carcinogenicity of air pollution
PM2.5 causes cardiovascular disease, respiratory and its constituents
disease and mortality. Associations have also
The International Agency for Research on Cancer
been observed between PM2.5 exposure and
(IARC) has classified outdoor air pollution as
reproductive and development effects such as
carcinogenic to humans (IARC Group 1) (Loomis
low birth weight.
et al., 2013). The IARC has also concluded that
UFPs diesel engine exhaust is carcinogenic to humans
(Group 1). In coming to this conclusion, IARC
Motor vehicle exhaust is an important source
found that diesel exhaust is a cause of lung cancer
of UFPs in urban settings (HEI, 2013). Ultrafine
(ie there is sufficient evidence of this) and noted
particles are thought to play a role in the adverse
a positive association (ie there is limited evidence
health impacts seen in association with exposure
of this) with an increased risk of bladder cancer
to PM pollution, although the epidemiological
(Benbrahim-Tallaa et al., 2012). Benzene and
evidence of their effects is limited (HEI, 2013;
formaldehyde (VOCs linked to vehicle exhaust)
WHO Regional Office for Europe, 2013). The World
have also been classified by IARC as Group 1
Health Organization (WHO Regional Office for
carcinogens (IARC, 2009).
Europe, 2013) recommends that current efforts to
reduce the numbers of UFPs in vehicle emissions Further information on the health effects
should continue and, until there is clearer evidence of traffic related air pollution is provided in
of the concentration-effect relationship for UFPs, Technical Paper 3.
management of PM should continue to focus on
PM10 and PM2.5. 2.5 Summary
A key feature of PM is that no threshold has been Having provided an overview of the characteristics
identified below which exposure is not associated and issues related to ambient air quality and air
with adverse health effects, therefore, reductions quality related to vehicular traffic, the sections that
in ambient concentrations of PM would provide follow deal more specifically with road tunnels and
public health benefits. associated air quality.
20!|!Advisory Committee on Tunnel Air Quality3. Control of tunnel pollution by ventilation
Good practice for tunnel ventilation must achieve the following requirements:
• Air quality inside the tunnel meets the relevant criteria for health and visibility.
• Discharges of vehicle emissions to the external atmosphere comply with the relevant ambient air
quality standards, guidelines and targets.
• During fire events heat and smoke is managed and extracted from the tunnel, safe exit of vehicle
occupants is enabled, and access for emergency services to deal with the fire is provided.
3.1. Tunnel ventilation system design
Figure 3.1 illustrates the three basic design options for tunnel ventilation, and these are described in the
following paragraphs.
Figure 3.1: Illustration of the airflow in longitudinal, transverse and semi-transverse
ventilation systems
Fresh air Exhaust air
Longitudinal ventilation system
Fan Fan Fan
Flow of traffic
Transverse ventilation system
Flow of traffic
Semitransverse ventilation system
Flow of traffic
Initial report on Tunnel Air Quality!|!213. Control of tunnel pollution by ventilation
Passive ventilation air (the more common option) or the removal
of exhaust air at points along the full length of
Vehicles moving through a tunnel induce their
the tunnel.
own airflow in the same direction. This is known
as the ‘piston effect’, and it is the basis of Longitudinal, transverse and semi-transverse
passive ventilation. Passive ventilation requires systems can all be designed to use exhaust stacks,
no additional ventilation infrastructure, and is so that some or all of the air is discharged at
generally only used over shorter distances. It is height from stacks where improved dispersion of
most effective if all the traffic is proceeding in the tunnel air is required to protect local air quality
same direction. In situations where traffic flows around a portal.
in opposite directions within the same tunnel
Additional information on road tunnel ventilation
tube, there is reduced or no piston effect as the
systems is provided in Technical Paper 4.
vehicle (and resulting air) flowing in opposite
directions may cancel each other out. This is one
of the reasons why many road tunnels have two 3.2. Stack operation
separated tubes, one for each direction of travel. and performance
Mechanical longitudinal ventilation Even when apparently still, the atmosphere is
very dynamic and the air is constantly moving.
Mechanical longitudinal ventilation refers to
Stacks work by exploiting this turbulent mixing
installations in which the piston effect is boosted
to efficiently disperse pollutants. This point has
by fans to increase the ventilation rate. The
been recognised by air quality scientists and air
significant reduction in vehicle emissions since
pollution engineers for decades, and has led to the
the 1970s has enabled longitudinal ventilation
widespread adoption of the stack as a means of
systems to be used in longer tunnels while
reducing the impact of atmospheric releases.
maintaining acceptable in-tunnel air quality during
operation. According to the French Centre for The predictive air quality modelling of tunnel
Tunnel Studies, mechanical longitudinal systems stacks is well tested and conservative in nature.
can be used for any tunnel length provided there Due to the very long history of stacks being
is an emergency smoke extraction system (CETU, used to disperse industrial air pollution, there
2003). Mechanical longitudinal systems have been are numerous validated and extensively used
routinely used since the 1990s in long, busy urban atmospheric dispersion models to predict
tunnels. Examples include the M5 East tunnel stack impacts. These models are used by
(Sydney), the Cross City tunnel (Sydney), Tate’s regulatory agencies and research communities;
Cairn tunnel (Hong Kong) and the Shing Mun these communities continue to improve these
tunnel (Hong Kong), all of which are over 2 km models over time.
long. All road tunnels built in Australia in the last
Discharging vehicle emissions via well-designed
20 years have been designed with longitudinal
stacks ensures that they are dispersed and
ventilation systems.
diluted so that there is minimal or no effect on
Transverse and semi-transverse ventilation local ambient air quality (NZ Transport Agency,
Transverse ventilation is a system that delivers 2013). Modelling and monitoring studies generally
fresh air and removes exhaust air at points along conclude that the impacts of emissions from road
the full length of the tunnel. Normally, fresh air tunnel stacks on their surrounding communities
enters via the roof and exhaust air leaves through are mostly indistinguishable from the impacts
the floor. However, tunnels with a fully-transverse from all other sources (principally surface traffic
system are uncommon, and semi-transverse emissions, domestic and industrial emissions,
ventilation systems are more prevalent. These and background contributions, including natural
systems are based on either the provision of fresh sources) (NHMRC, 2008).
22!|!Advisory Committee on Tunnel Air QualityAs an example, modelling by CSIRO using In general, there is a ‘diminishing returns’
actual emission data from the M5 East tunnel relationship between stack height and ground
predicted the maximum contribution of the stack impact, with increases in stack height leading
to annual average concentrations is less than 1 to progressively smaller reductions in ground
per cent of background for PM10, and less than level concentrations. The accuracy of dispersion
3.6 per cent of background for NOx (Hibberd, modelling for road tunnel stacks hinges on
2003) at any location around the stack1. These accurate estimates of traffic flow, traffic
predicted levels would not be measurable by composition, traffic speed, vehicle emission
ambient monitoring equipment because they factors, ventilation system operating parameters,
are significantly smaller than normal day-to-day and the stack exhaust temperature (which
variation in background levels. influences how buoyant the emissions are).
Uncertainty relating to these parameters is
Extensive ambient monitoring around motorway
generally addressed by making appropriately
tunnels such as the M5 East, Lane Cove and
conservative assumptions for the model inputs.
Cross City tunnels demonstrates that tunnel
stack emissions for those tunnels does not have It is common practice to assess stack impacts
a measurable impact on local or regional air against air quality standards and guidelines,
quality (Holmes Air Sciences, 2001 and 2008; such as those specified by the NSW EPA in
PAE Holmes 2009). the Approved Methods for the Modelling and
Assessment of Air Pollutants in New South Wales.
3.2.1. Predicting and assessing the impact
of stacks Further information on road tunnel stack emissions
The use of stacks for dispersing air pollution is provided in Technical Paper 5.
has a long history – dating back to the industrial
revolution. Consequently, numerous validated 3.3. Portal emissions
atmospheric dispersion models are available
A key operating restriction for the M5 East,
(and used) for predicting the impacts of stacks.
Cross City and Lane Cove tunnels is the planning
These models perform well in predicting the
approval requirement for zero portal emissions.
dispersion of air pollutants, especially in locations
This restriction was initially applied to the M5 East
with flat or simple terrain.
tunnel as a precaution to protect residents around
In areas where the terrain is more complicated the tunnel portals, and was retained for the Cross
(eg significant valleys and ridges) model City tunnel and Lane Cove tunnel.
predictions can be more uncertain. In these
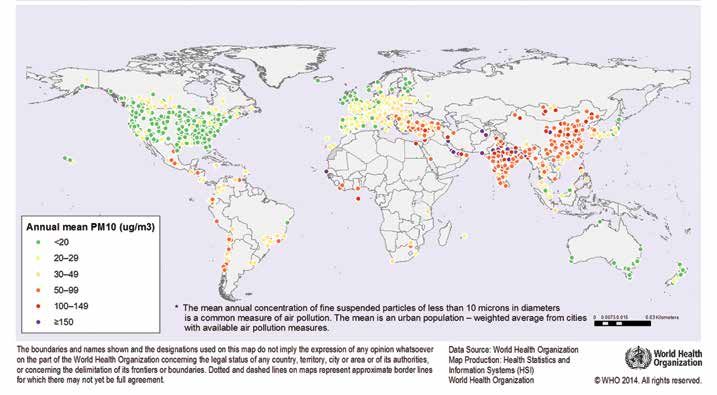
To achieve zero portal emissions all tunnel air must
situations, the model uncertainty is generally
be expelled from a stack, with air being drawn in
compensated for by modelling conservative
from all portals (Figure 3.2). This requires drawing
scenarios (eg worst case and/or applying safety
air against its natural direction of flow due to the
factors). Uncertainty in dispersion modelling
piston effect at the exit portal. This increases
may arise if tall or large buildings are close to the
the quantity of ventilation air required to be
stack. This uncertainty is generally managed by
discharged through the stack, and increases the
carefully selecting a model that best handles the
girth of the stack.
local challenges, using conservative assumptions
or safety factors in the modelling, or avoiding
such locations if possible.
1 The greater contribution of NOx reflects that motor vehicles contribute a much greater proportion of NOx than
PM emissions.
Initial report on Tunnel Air Quality!|!233. Control of tunnel pollution by ventilation
The implications of operating the ventilation time. Furthermore, avoiding excessive ventilation
system in this way can vary significantly with time is desirable from the point of view of energy
of day, and may not be warranted at all times. efficiency. For instance, the semi-rural Hafnerburg
For example, during periods of low traffic volume tunnel on Zurich’s busy by-pass had stacks
at night the air quality inside the tunnel may be removed from its design, and nearby on the same
essentially identical to the air quality outside the motorway the stacks for the new third tube of the
tunnel. Requiring the tunnel to meet a zero portal 3.3 km-long Gubrist tunnel are expected to be
emissions condition during off-peak periods may used for fire emergency use only.
have little appreciable environmental benefit, and
Both the 2.5 km-long Roer tunnel in the
could require significant energy use with related
Netherlands and Hong Kong’s busy 1.2 km-long
environmental and cost impacts.
Nam Wan tunnel both opened in 2009 without
Outside Australia almost all road tunnels have stacks. Stacks have generally been retained for
portal emissions. In most cases the impact of urban tunnels in areas of particularly poor ambient
portal emissions on outdoor air quality is mitigated air quality, or where there is a risk that the impact
through design of the portal and/or its location. of portal emissions may not be adequately
In urban areas it has historically been the norm for mitigated. Stacks can be seen as a precautionary
long road tunnels to supplement portal emissions measure that provides flexibility and resilience in
through the use of ventilation stacks. For example, the ventilation system design.
in two new major road tunnel projects currently
3.3.1. Predicting and assessing the impact
planned for Hong Kong, 60 – 90 per cent of
of portal emissions
emissions are anticipated to be dispersed from
stacks to reduce emission levels at the portals An important consideration in managing portal
(AECOM, 2013; Arup-Mott MacDonald Joint emissions is the potential for these emissions
Venture, 2013). to adversely impact air quality of people near
the portals.
Reductions in vehicle emissions over the last
few decades have meant that the need for The key characteristic of portal emissions is rapid
ventilation stacks has diminished. In many cases and effective dispersion, reducing concentrations
overseas it has become possible to meet both to background levels over relatively short
in-tunnel and outdoor air quality requirements distances. Our understanding of the impact of
using portal emissions alone for some or all of the portal emissions on air quality comes from four
types of evidence: computer modelling, wind-
Figure 3.2: Illustration showing tunnel air flow direction to avoid portal emissions
Stack
emission
Fresh air in Air inflow
at exit
Vehicle generated air flow portal
(piston effect)
24!|!Advisory Committee on Tunnel Air Qualitytunnel modelling, tracer-release experiments and 5. There is generally little or no impact of portal
air quality monitoring. Results from each of these emissions on the land above where the tunnel
approaches are broadly consistent. More specific goes underground (Brousse et al., 2005).
key findings are:
While allowing portal emissions is common
1. Air exits the portal as a relatively fast-moving practice internationally, there is limited experience
plume, but rapidly mixes with the ambient air. in NSW or Australia among proponents, operators
and regulators in assessing and managing road
2. In the immediate vicinity (about 10m) of
tunnel portal emissions. This has been identified as
the portal, air quality can be substantially
an area for further investigation, and there would
worsened with the potential to exceed ambient
be benefit in developing a framework for the
air quality guidelines. However, the affected
assessment and approval of portal emissions in a
zone is normally limited to the roadway
way that optimises energy use and operating costs
(McCrae et al.,2009, COB, 2009, Kuschel &
while protecting the air quality of people living
Wickham, 2013).
near the portals.
3. Away from the immediate vicinity of the portal,
These investigations should give specific
concentrations of pollutants decrease rapidly,
consideration to NO2 levels surrounding portals
especially moving away from the roadway.
due to the potential for extra NO2 to be rapidly
The impact of portal emissions on roadside
formed from in tunnel NO reacting with ozone (O3)
concentrations typically only extends up to
in the external air.
about 100–200m from the portal (McCrae et al.,
2009, Kuschel & Wickham, 2013). Beyond this More information on road tunnel portal emissions
distance, it is difficult to distinguish the impact is provided in Technical Paper 6.
of the portal from the surface road section
(Brousse et al., 2005). 3.4. Energy use
4. If the roadway is in a trench or cutting as it Table 3.1 shows the energy (electricity)
enters the portal, or is otherwise separated consumption, tunnel length and daily traffic
from the surroundings, the elevated volume for four Australian road tunnels (three
concentrations can persist in the trench to in Sydney and one in Melbourne). The energy
larger distances from the portal, but locations consumption per km per year has also been
to either side of the road will be afforded extra calculated for each tunnel to allow a more
protection as lateral dispersion of pollutants is direct comparison.
constrained (Brousse et al., 2005, COB, 2009).
Table 3.1: Electricity consumption for four Australian road tunnels
Electricity Total (2 way)
consumption tunnel length Traffic (vehicles MWh/km
Project (MWh/annum) (km) per day) per annum
Eastern Distributor tunnel 4,400 3.2 110,000 1,375
Lane Cove Tunnel 15,400 7.2 70,000 2,139
CityLink tunnel (Melbourne) 21,500 5 100,000 4,300
M5 East tunnel 54,000 8 100,000 6,750
Initial report on Tunnel Air Quality!|!25You can also read