Environment Committee Meeting - 10 June 2020 "Soil Quality in the Marlborough Region in 2019"
←
→
Page content transcription
If your browser does not render page correctly, please read the page content below
Environment Committee
          Meeting
                   10 June 2020

     This Report relates to Item 6 in the Agenda

“Soil Quality in the Marlborough Region in 2019”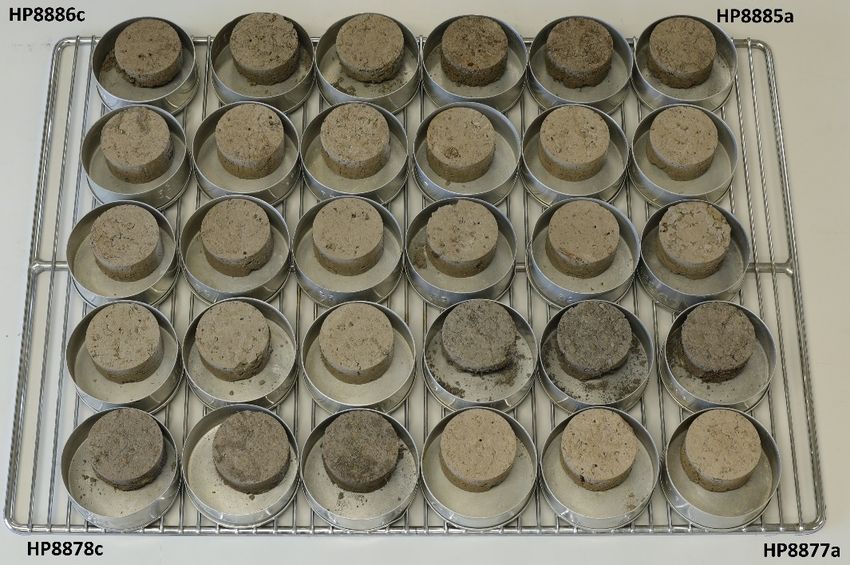
Soil Quality in the
Marlborough Region
in 2019

Technical Report No: 20-003
May 2020
Soil Quality in the Marlborough Region 2019

                                MDC Technical Report No: 20-003

                                       ISSN 1179-819X (Online)

                                 ISBN 978-1-927159-90-3 (Online)

                      File Reference/Record No: E355-001-001-19/2074033

                                              May 2020

           Report Prepared by:                                    Final Edition approved by
       Matt Oliver & Jorgia McMillan                                     Peter Hamill
       Marlborough District Council                              Marlborough District Council

                                  Marlborough District Council
                                        Seymour Square
                                           PO Box 443
                                         Blenheim 7240
                                        Phone: 520 7400
                               Website: www.marlborough.govt.nz

                                         Acknowledgements:
The Marlborough District Council wish to thank the landowners and managers for providing access to
 their properties to allow soils to be sampled and supplying relevant site management information
           Also, thanks to Jorgia McMillan for bravery in the face of Excel spreadsheets.

Soil Quality in the Marlborough Region 2019

Executive Summary
Regional councils (and Unitary Councils) have a responsibility for promoting the sustainable
management of the natural and physical resources of their region. Under Section 35 of the Resource
Management Act (1991), one of the physical resources that we have a duty to monitor and report on is
soil. Specifically, to report on the “life supporting capacity of soil” and to determine whether current
practices will meet the “foreseeable needs of future generations”. To help meet these goals, the
Council undertakes a soil quality monitoring programme that involves collecting soil samples from a
network of sites that represent the main land use activities and soil types within the region and
analysing these samples for a suite of soil physical, biological and chemical properties that have been
shown to be robust indicators of soil quality. The aim of this report is to summarise both the current
state of, and the long-term trends in, soil quality in the Marlborough region as determined by the
results of soil analysis from sampling across a range of land use activities and soil types.

In this investigation, soils were sampled from fourteen monitoring sites that included 5 vineyards, 7
pasture sites, 2 exotic forests. These sites represented 9 different soil types from 2 soil orders.

This year’s results are similar to last year’s results. While many sites show good soil quality, most soils
show the effects of human land use with soil quality indicators for many of these falling outside target
ranges. 67% of sites (mostly vineyards) reported soil compaction measurements outside the target
range. These results put these soils at risk of poor aeration and impeded drainage which may
potentially affect pasture production and predispose the soil to surface runoff, nutrient loss, erosion
and flooding. While soil compaction may not be permanent, it clearly should be avoided and
remediated where necessary. A range of beneficial management options to prevent and remediate soil
compaction are outlined in the report.

Cadmium levels remain a concern for dairy farmers but rising levels in other farmed land uses should
not be ignored, especially in the context that 44% of this year’s sites reported low phosphate levels.
Cadmium is a contaminant of phosphate fertiliser, additional fertiliser will be required to maximise
production on properties with low P values. While cadmium levels are not likely to exceed target
ranges in the short-term, continued use of phosphate fertiliser will mean levels will continue to rise
and continued monitoring will be required.

A new soil quality test has been introduced this year. Hot water carbon (HWC) measures the easily
available sources of carbon in the soil and provides indications on the level of microbial activity within
the soil. In addition, HWC can help understand what risks are posed to soil structure, nutrient
availability and water retention from a loss of this soil carbon fraction. A provisional target of >1900
mg/kg has been set and worryingly, 21 of the 24 samples failed to reach this target indicating that
although more samples are required, Marlborough soils may have low microbial activity and face risks
of structural degradation.

The long-term analysis introduced in 2016 has been repeated this year. The results from a new set of
samples confirm the concerns outlined in the 2016, 2017 and 2018 reports that soil compaction, soil
organic matter loss and loss of nutrients to water are significant problems for Marlborough.

As in 2017, landscape change was again a focus this year to investigate the changes from pastoral
production to viticulture that are commonplace in Marlborough. The results show major reductions in
soil organic matter and increases in soil compaction occurring within 12 months of vineyard conversion.
It should be emphasised that this analysis is based on only 2 sites and very small data sets. If the data
is accurate, it implies large amounts of carbon are being lost from soils.

MDC Technical Report No: 20-003                                                                         i
Soil Quality in the Marlborough Region 2019

Table of Contents

Executive Summary ............................................................................i
1.    Introduction .............................................................................. 1
2.    Materials and Methods ................................................................. 3
      2.1. Sampling Sites ........................................................................................ 3
      2.2. Soil Sampling .......................................................................................... 4
             2.2.1.     Changes to sampling sites ................................................................ 4
             2.2.2.     Viticulture sampling sites ................................................................. 4
      2.3. Soil Quality Measurements ......................................................................... 5
      2.4. Soil Analysis ........................................................................................... 6
             2.4.1.     Chemical Analysis .......................................................................... 6
             2.4.2.     Biological Analysis.......................................................................... 6
             2.4.3.     Physical Analysis............................................................................ 6
             2.4.4.     Targets and Ranges ........................................................................ 7
             2.4.5.     Data Display and Analysis ................................................................. 7
3.    Results and Discussion ................................................................. 9
      3.1. Comparison of Target Ranges ..................................................................... 9
      3.2. Soil Chemical results ............................................................................... 10
             3.2.1.     Soil pH ...................................................................................... 10
             3.2.2.     Olsen P ..................................................................................... 12
             3.2.3.     Trace Elements ........................................................................... 14
      3.3. Soil Biology Results ................................................................................. 18
             3.3.1.     Anaerobically Mineralisable Nitrogen ................................................. 18
             3.3.2.     Total Carbon .............................................................................. 20
             3.3.3.     Hot Water Carbon ........................................................................ 22
             3.3.4.     Total Nitrogen ............................................................................ 24
             3.3.5.     Carbon: Nitrogen Ratio .................................................................. 24
      3.4. Soil Physical Results ................................................................................ 28
             3.4.1.     Bulk Density ............................................................................... 28
             3.4.2.     Air Filled Porosity ........................................................................ 30
             3.4.3.     Aggregate Stability....................................................................... 32
4.    Changes in Soil Quality through time ............................................. 34
      4.1. Introduction .......................................................................................... 34
      4.2. Nutrient loss to water .............................................................................. 35
             4.2.1.     Phosphorus risk ........................................................................... 35
             4.2.2.     Nitrogen risk .............................................................................. 36
             4.2.3.     Soil compaction risks .................................................................... 38
             4.2.4.     Loss of Soil Organic Matter ............................................................. 41

MDC Technical Report No: 20-003                                                                                        iii
Soil Quality in the Marlborough Region 2019
4.3. Trace Element Contamination ................................................................... 42
4.4. Land use changes ................................................................................... 44
4.4.1. Land use change – Site 28............................................................... 44
4.4.2. Land use change – Site 9 ................................................................ 47
4.4.3. Land use change - Discussion .......................................................... 48
5. Summary................................................................................ 49
6. Bibliography ........................................................................... 50
7. Appendix A. Soil Target Values .................................................... 53
iv MDC Technical Report No: 20-003Soil Quality in the Marlborough Region 2019 List of Figures Figure 1. The percentage of sites not meeting their target range for a specific soil quality indicator ................................................................................................................. 9 Figure 2: Soil pH by land use for 2019 samples. ............................................................... 11 Figure 3: Soil pH by land use for all samples since 2000. .................................................... 11 Figure 4: Olsen P values by land use for 2019 samples. ...................................................... 13 Figure 5: Soil Olsen P values for all samples since 2000. ..................................................... 13 Figure 6: Soil cadmium concentrations by land use for 2019 samples. .................................... 15 Figure 7: Soil cadmium concentrations by land use for all samples since 2000 .......................... 15 Figure 8: 2019 Anaerobically mineralisable nitrogen values for 2019. ..................................... 19 Figure 9: AMN concentrations by land uses for all samples since 2000. .................................. 19 Figure 10: Total carbon values for 2019. ........................................................................ 21 Figure 11: Total carbon by land use for all samples since 2000. ............................................ 21 Figure 12: Hot Water Carbon values for 2019. ................................................................. 23 Figure 13: Total Nitrogen values for 2019. ...................................................................... 25 Figure 14: Total Nitrogen by land use for all samples since 2000........................................... 25 Figure 15: Dry bulk density by landuse for 2019 samples. ................................................... 29 Figure 16: Soil dry bulk density values for all samples since 2000. ......................................... 29 Figure 17: Air filled porosity by land use for 2019 values. ................................................... 31 Figure 18: Air filled porosity by land use for all samples since 2000. ...................................... 31 Figure 19: Regional Olsen P averages by Land use. ........................................................... 36 Figure 20:Anaerobically mineralisable nitrogen by land use. ................................................ 37 Figure 21: Total nitrogen by land use. ........................................................................... 37 Figure 22: Change in bulk density for all landuses ............................................................ 39 Figure 23: Change in AFP for all landuses ....................................................................... 39 Figure 24: Change in bulk density in vineyards................................................................. 40 Figure 25: Change in AFP in vineyards ........................................................................... 40 Figure 26:Total carbon by Land use. ............................................................................. 42 Figure 27:Cadmium levels by land use. .......................................................................... 43 Figure 28: Bulk density of Sites 27 and 28 following vineyard establishment ............................ 45 MDC Technical Report No: 20-003 v
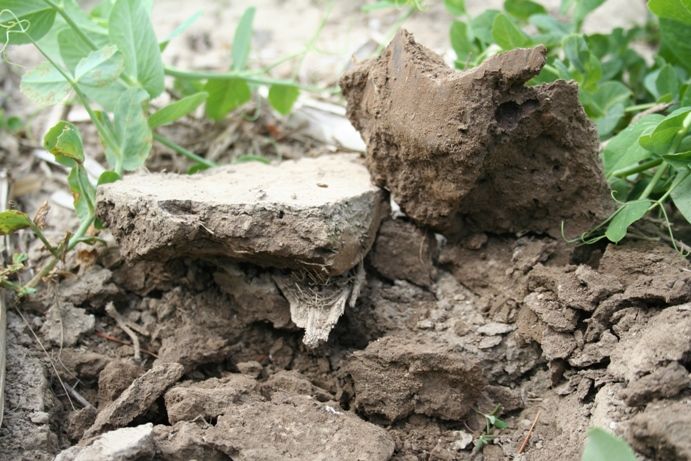
Soil Quality in the Marlborough Region 2019

Figure 29: Air filled porosity for Sites 27 and 28 following vineyard establishment ..................... 45

Figure 30: Total carbon for Sites 27 and 28 following vineyard establishment ........................... 46

Figure 31: Site 9, Air filled porosity of former dairy pasture following conversion to viticulture. ... 48

List of Tables
Table 1: Soil type, soil classification and land use management of sites sampled in
Marlborough in 2019 ................................................................................................... 3

Table 2 Indicators used for soil quality assessment ............................................................ 5

Table 1: Soil type, soil classification and land use management of sites sampled in 2019 .............. 3

Table 2 Indicators used for soil quality assessment ............................................................ 5

Table 3: Soil chemical results. .................................................................................... 16

Table 4: Soil Biological results .................................................................................... 26

Table 5: Soil Physical Results. ..................................................................................... 33

List of Plates
Plate 1: (a) Collecting a composite of core samples along a transect using a soil corer. (b) One of
three intact core samples taken at each site, to establish the physical properties of the soil. ........ 4

Plate 2: An example of dried cores inside their extraction rings following oven drying. ................. 6

Plate 3: Compacted topsoil at one of the cropping sites ..................................................... 41

vi                                                                                 MDC Technical Report No: 20-003
Soil Quality in the Marlborough Region 2019

1.        Introduction
Regional councils have a responsibility for promoting the sustainable management of the natural and
physical resources of their region. Under Section 35 of the Resource Management Act (1991), one of
the physical resources that we have a duty to monitor and report on is soil. Specifically, to report on
the “life supporting capacity of soil” and to determine whether current practices will meet the
“foreseeable needs of future generations”. The collection of detailed soil monitoring data is therefore
vital because it provides information on what effect current land use activities are having on soil
quality and whether we need to change or prioritise the way we manage the land environment. This is
becoming increasingly important as land use activities such as dairying and viticulture are intensifying
across New Zealand and putting pressure on our soils.

Furthermore, the way soils respond to different land use activities can affect other parts of the
environment, for example water quality. This is because soils act as buffers to; capture and store
nutrients such as nitrogen, phosphorous and microbes, treat a range of waste products as well as to
store and filter water.

To help determine what effect land use practices are having on soil quality, in 2000 the Marlborough
District Council (MDC) became a participant in a national soil quality monitoring programme known as
“The 500 Soils Project”. At the completion of this project MDC implemented its own soil quality
monitoring programme commencing in 2008 to continue assessing the quality of soils throughout the
Marlborough region. This programme is largely based around the framework developed as part of the
national programme and is in line with soil quality monitoring currently undertaken in other regions in
New Zealand.

The objectives of the soil quality monitoring programme are to:

     •   Provide information on the physical, chemical and biological properties of soils to assess overall
         soil health.
     •   Provide an early-warning system to identify the effects of primary land uses on long-term soil
         productivity and the environment.
     •   Track specific, identified issues relating to the effects of land use on long term soil
         productivity.
     •   Assist in the detection of spatial and temporal changes in soil quality; and
     •   Provide a mechanism to determine the effectiveness of regional policies and plans.

A network of 96 soil quality monitoring sites has been established in Marlborough. The report discusses
if they meet their target ranges for soil quality. This report presents results for 14 sites last sampled
between 2008 to 2018. The wider spread of sites reflects changes made in 2016 to the frequency of
sampling to help improve data reliability. Three sites (27,28 &9) have been sampled specifically to
capture soil quality changes that may have occurred following conversion from pasture to vineyard.

MDC Technical Report No: 20-003                                                                       1
Soil Quality in the Marlborough Region 2019 2 MDC Technical Report No: 20-003
Soil Quality in the Marlborough Region 2019

2.        Materials and Methods
The Soil Quality Monitoring Programme samples a range of different soils in a representative manner
depending on the soil order and landuse. The aim is to have a representative combination of all soil
orders and all landuses. Soil orders are the broadest classification of soils under the New Zealand Soil
Classification (Hewitt, 2010). As examples, Raw soils come from areas where unweathered parent
material has gathered such as stony riverbeds. Raw soils are young, undeveloped soils. In contrast,
Brown soils are more developed, mature soils can be found in many locations around New Zealand. Soil
orders are further broken down into smaller groupings, these are Groups, sub-Groups, Families and
Siblings. Soil type is a common term for a Soil Family. An example of a Raw soil Family is Waimakariri
which is named after the Waimakariri river and a Brown soil type is Wairau, named after the Wairau
Plains.

2.1.      Sampling Sites
Soils were sampled from;1 site previously sampled in 2008 and 2013. 2 sites previously sampled in
2014. 8 sites previously sampled in 2009 and 2014 as well as 3 sites last sampled in 2017 and 2018.
They include 5 vineyard sites, 7 pasture sites and 2 exotic forestry sites. The sampled sites represent 9
different soil families from 2 soil orders (Table 1).

Table 1: Soil type, soil classification and land use management of sites sampled in Marlborough in 2019

                     Sampling
Site Code                              Soil Type/Family        Soil Order*   Land use; management
                     years
SOE_Soils_Site09     2017, 2018        Paynter                 Pallic        Vineyard - Recent conversion

SOE_Soils_Site27     2017, 2018        Motukarara              Gley          Vineyard

SOE_Soils_Site28     2017, 2018        Motukarara              Gley          Vineyard - Recent conversion

SOE_Soils_Site35     2008, 2013        Jordan                  Pallic        Pasture
SOE_Soils_Site45     2014              Dashwood                Pallic        Vineyard
SOE_Soils_Site46     2014              Sedgemere               Pallic        Vineyard
SOE_Soils_Site47     2009, 2014        Sedgemere               Pallic        Pasture
SOE_Soils_Site48     2009, 2014        Sedgemere               Pallic        Pasture
SOE_Soils_Site54     2009, 2014        Weld                    Pallic        Pasture
SOE_Soils_Site55     2009, 2014        Weld                    Pallic        Exotic forest
SOE_Soils_Site56     2009, 2014        Warwick                 Pallic        Pasture
SOE_Soils_Site57     2009, 2014        Wither Hill             Pallic        Pasture
SOE_Soils_Site59     2009, 2014        Waihopai Steepland      Pallic        Exotic forest
SOE_Soils_Site60    2009, 2014         Waihopai Steepland      Pallic        Pasture
*New Zealand Soil Classification

MDC Technical Report No: 20-003                                                                           3
Soil Quality in the Marlborough Region 2019
2.2. Soil Sampling
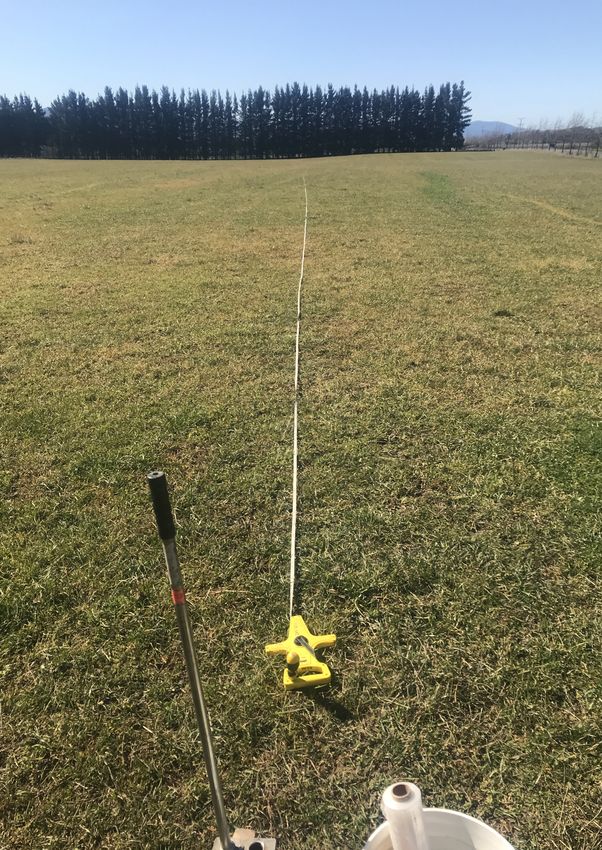
Two types of soil samples are collected from each site. Firstly, a composite sample comprising 25
individual cores taken at 2 m intervals along a 50 m transect at a depth of 100 mm (Plate 1a). These
samples are combined into one large sample and used for chemical and biological analysis. In addition,
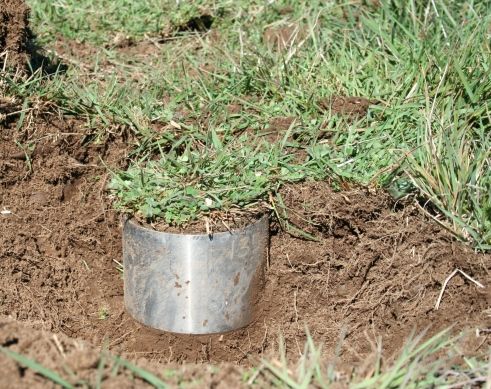
three undisturbed soil cores (100 mm diameter by 75 mm depth) are sampled at 15-, 30- and 45-m
positions along the transect (Plate 1b). These soil cores were removed as one unit by excavation
around the liner, bagged and loaded into padded crates for transport to the laboratory for analysis.
These soil samples are used for soil physical analysis. Samples are collected from mid-October to early
November. In 2019, most sites had reasonable soil moisture conditions.
Plate 1: (a) Collecting a composite of core samples along a transect using a soil corer. (b) One of
three intact core samples taken at each site, to establish the physical properties of the soil.
2.2.1. Changes to sampling sites
The location of sampling sites should not change. However, a key objective of this project is to
monitor land use and landscape changes to these sites. The majority of the sites sampled in this round
are being sampled for the second or third time. This means some sites are now up to 17 years old and
may have changed markedly from the original. Field notes from past sampling rounds help staff to
locate the original transects so samples can be replicated as closely as possible. However, it has not
been possible to replicate exactly the location of the original transect on some sites. Reasons for this
include large changes in vegetation (especially in forested areas and where landuse has changed),
errors in GPS location markers and unclear field notes. Where transects could not be located
accurately, a new transect was established as closely as possible to the original using the original site
photographs. New transects were documented with explicit notes and photographs to ensure location
in the future.
2.2.2. Viticulture sampling sites
Because of the economic importance and scale of viticulture in Marlborough, it was decided in 2012
that vineyard monitoring should encompass 3 samples per vineyard site. Samples are taken from under
the vines, in the wheel tracks and in the inter-row region. This is done to allow the impact of various
management practices to be evaluated. These include:
• Under vine
o banding of fertiliser
o herbicide applications
o maintenance of bare ground
o absence of traffic
o irrigation
o transfer of inter-row mowing’s
• Wheel tracks
o soil compaction
• Inter-row
4 MDC Technical Report No: 20-003Soil Quality in the Marlborough Region 2019
o inputs of organic matter including pruning’s
o lower rates of fertiliser
o rainfall inputs only
2.3. Soil Quality Measurements
Several different soil properties are measured to assess soil quality. Soil chemical characteristics are
assessed by soil pH, Olsen P and trace element concentrations. Soil biological characteristics are
determined by measuring anaerobically mineralisable nitrogen, total carbon, total nitrogen and
carbon: nitrogen ratio.
Soil physical conditions are assessed using bulk density, particle density and water release
characteristics which in turn were used to calculate total soil porosity, air filled porosity and
macroporosity (Table 2). In the past, additional microbial samples have been collected and analysed to
provide insight into soil ecological properties. This work will be reported on later as results become
available.
Table 2 Indicators used for soil quality assessment
Indicators Soil Quality Information Method
Chemical properties
Soil pH Acidity or alkalinity Glass electrode pH meter,
Olsen P Plant available phosphate Bicarbonate extraction,
molybdenum blue method
Trace elements Deficiency or toxicity of trace Acid digestion, ICP-OES
elements in soil Spectroscopy
Biological properties
Anaerobically mineralisable N Readily mineralisable Waterlogged incubation at 40
nitrogen reserves ºC for 7 days
Total Carbon Organic matter status Dry combustion, CNS analyser
Total Nitrogen Organic N reserves Dry combustion, CNS analyser
Carbon: Nitrogen Ratio Decomposition rate of Calculated from above
organic matter
Physical properties
Dry bulk density Compaction, volumetric Soil cores
conversions
Total porosity, air capacity and Soil compaction, aeration, Pressure plates
macroporosity drainage
MDC Technical Report No: 20-003 5Soil Quality in the Marlborough Region 2019 2.4. Soil Analysis Descriptions of the different soil analysis process are detailed below. In general, analysis follows the processes described by (Hill & Sparling, 2009) for soil quality parameters and (Kim & Taylor, 2009)for trace element analysis. 2.4.1. Chemical Analysis All chemical analysis was undertaken by Hills Laboratory, Hamilton. Soil pH was measured in a 1:2 (v/v) soil:water slurry followed by potentiometric determination of pH (Blakemore, 1987). Soil phosphorus is determined with Olsen extraction followed by Molybdenum Blue colorimetry (Olsen, Cole, Watanabe, & Dean, 1954). Trace element determination made by Nitric/hydrochloric digestion followed by ICP-OES (Hills Laboratories, 2018). 2.4.2. Biological Analysis Biological analysis was carried out by Hill Laboratory, Hamilton. Anaerobically mineralisable nitrogen was estimated anaerobic incubation followed by extraction using 2M KCl followed by Berthelot colorimetry (Keeney & Bremner, 1966). Total carbon and nitrogen were determined by dry combustion of air-dry soil (Hills Laboratories, 2018). Hot water carbon extraction carried out on a dried and sieved (
Soil Quality in the Marlborough Region 2019

measurement (defined in this report as air filled porosity), although the -5kPa data is included for
reference because this has been used and reported by the MDC and others in the past.

2.4.4. Targets and Ranges
To aid in the interpretation of soil quality indicators, an expert panel (in several workshops) developed
guidelines for the seven soil quality indicators now commonly used by regional councils (Hill & Sparling,
2009). The panel determined target ranges for the assessment of soil quality (e.g. very low, optimal,
very high etc.) for the predominant soil orders under different land uses. The interpretative ranges
from Hill & Sparling, (2009) are presented in Appendix A. However, Olsen P targets have recently been
revised with new target values reported in (Mackay, Dominati, & Taylor, 2013)and used in this report
(Appendix A).

The trace element results (except for cadmium) have been compared against the soil limits presented
in the New Zealand Water and Wastes Association (NZWWA, 2003) ‘Guidelines for the Safe Application
of Biosolids to Land in New Zealand’ (referred to as the biosolids guidelines) (Appendix A). While
guidelines containing soil contaminant values like the biosolids guidelines have been written for a
specific activity (i.e. biosolids application), the values are generally transferable to other activities
that share similar hazardous substances. Cadmium results were compared to values in the Tiered
Fertiliser Management System (TFMS) from the New Zealand Cadmium Management Strategy (MAF,
2010).

2.4.5. Data Display and Analysis
Readers of early Soil Quality reports will note several changes in the presentation of the data. Firstly,
the names of the sites were changed in 2016 in order to provide better referencing in the Council
computer database. Sites were previously labelled using an "MDC" number e.g. MDC 15. These have now
been renamed SOE_Soils_Site15. The number of each site remains the same. Vineyard sites are
labelled SOE_Soils_Site63a_vine, b_wheel or c_inter-row.

The second change in data presentation from early reports has been to present data in groups
according to soil order or land use. This change allows the reader to more clearly understand how a
soil conforms to its target values which are set according to soil order or land use. Soil order and land
use are the two factors that have the greatest influence on soil quality. Readers can refer to Appendix
A for target ranges of soil quality indicators. Information on soil orders and the New Zealand Soil
Classification can be found at https://soils.landcareresearch.co.nz/describing-soils/nzsc

This report displays data in two ways. Firstly, Table 3 and Table 4 show the raw chemical and
biological data from the bulked sample. Table 5 shows the physical data for each sample as a single
averaged value for the three soil cores extracted from each site. Secondly, the long-term data uses a
5-year rolling average. Each data point for a given year is the average of all data from the proceeding
5 years for that data. This is done to smooth data outliers and to help illustrate long-term trends in
the data.

As a result of the on-going review process for the Soil Quality Monitoring program, it has been
identified that some land uses have insufficient sites to justify presenting this data as annual values (5
–year rolling average). Readers of the 2016 report will have noted the inconsistencies in native forestry
results. This is due to the low number of sites (five) that are available for sampling (a reflection of the
small number of remaining lowland native forests in Marlborough). Previous procedure was to sample
these on a 10-year rotation; however, this has resulted in only 11 sample points for this land use over
the entire course of the programme. Exotic forestry follows a similar pattern although this land use
has 17 total sample points. As a result, data from these land uses is no longer presented as a time
series but as a single point derived from the average of all data for that land use. This provides a
reference for these land uses while reducing the effect of individual outlier data points. Future
options for this data are to identify more sites or sample more often although costs limitations may
constrain this.

As mentioned in section 2.4.3, previous Soil Quality reports used the term macroporosity to refer to
soil pore measurements. However, these measurements used data more correctly called air-filled

MDC Technical Report No: 20-003                                                                        7
Soil Quality in the Marlborough Region 2019

porosity. This report now refers to air-filled porosity -10kPa to clarify which measurement is being
used.

This report discusses changes in soil quality indicators over time. This is done to improve the
understanding of soil quality changes on a regional basis. This has allowed the determination of some
key issues for land managers to be aware of. See section 4 for further details.

Where appropriate, data were expressed on a weight/volume or volume/volume basis to allow
comparison between soils with differing bulk density. Olsen P values are reported in different units
(mg/L) than previous reports to account for differences in soil bulk density between samples.

8                                                                     MDC Technical Report No: 20-003
Soil Quality in the Marlborough Region 2019

3.        Results and Discussion

3.1.      Comparison of Target Ranges
Figure 1 shows the percentage of sites not meeting their target for a specific soil quality indicator. All
sites for pH ,trace elements, total C, total N met their target ranges. Olsen P, anaerobically
mineralisable nitrogen, hot water carbon and air-filled porosity all showed a large number of sites
failing to meet the target ranges (15, 9, 21,16 sites respectively). C:N ratio, and bulk density had
smaller numbers not meeting their soil quality target. 40 samples were taken from 24 sites in 2019.

  100%

   90%

   80%

   70%

   60%

   50%

   40%

   30%

   20%

   10%

     0%
            pH      Olsen P     Trace    AMN    Total C    HWC     Total N C:N ratio    Bulk Air Filled
                              elements                                                 Density Porosity

Figure 1. The percentage of sites not meeting their target range for a specific soil quality indicator

The results of soil chemical, biological and physical analyses from soils sampled at each site are given
in Table 3, Table 4 andTable 5 respectively and are discussed separately below.

MDC Technical Report No: 20-003                                                                        9
Soil Quality in the Marlborough Region 2019 3.2. Soil Chemical results Results of soil chemical analysis (pH, Olsen P and Trace elements) are reported in Table 3. Each of the chemical properties is discussed individually. The target values appropriate to the relevant soil order can be found in Appendix A. 3.2.1. Soil pH Soil pH is a measure of the acidity and alkalinity in soil. It is an important soil indicator because it affects nutrient and contaminant availability in plants and the functioning of beneficial soil macro- and micro-organisms. Most plants and soil organisms will have an optimum pH range for growth, and the pH of the soil affects which species will grow best. As indicated in Table 3, all sites had soil pH values within the acceptable target for their respective land use. Differences are evident between land uses. Vineyards have slightly higher pH than other land uses with exotic forestry having the lowest pH (most acidic) readings. Analysis of pH by soil type shows no significant difference in pH between soil types. Figure 2 is a box and whisker plot that shows the maximum and minimum values (whiskers), first and third quartiles (top and bottom of the box) and the median (central line in the box). The differences seen in Figure 2 are most likely due to land use. This is probably a reflection of fertiliser practice under the different land uses. Low input land uses will tend to lower pH due to the natural acidifying effects of plant growth. Farmed land will often receive fertiliser (and lime) relative to the value of the products coming from this land. As a result, it is common practice to apply fertiliser and lime annually to vineyards with a consequent lift in pH. The lower returns and larger-scale of pastoral farming often restrict fertiliser applications to correction of limiting nutrients only. This seems to have led to an overall lower pH for pastoral land uses. Interestingly, the average pH values shown for viticulture in 2019 are in the high end of the range that is normally preferred (5.8-6.8). This is similar to the longer-term samples (Figure 3). This would imply that some sites have much higher pH. Although it is not possible to determine with this data set, the implication is that pH management in vineyards may need to be improved. Because of the regular application of fertiliser to vineyards, often small amounts of nutrients will be applied. This often requires lime to be added to the other nutrients for these to be spread effectively. Given the increased emphasis on sound nutrient management (and the financial costs of fertiliser), it is suggested that vineyard managers may wish to examine fertiliser practice more closely. 10 MDC Technical Report No: 20-003
Soil Quality in the Marlborough Region 2019

         7

        6.5

         6

        5.5
   pH

         5

        4.5

         4
                         Exotic Forest                    Pasture                       Vineyard

Figure 2: Soil pH by land use for 2019 samples. Target ranges vary for landuses. Refer Appendix A

        8

       7.5

        7

       6.5

        6
  pH

       5.5

        5

       4.5

        4
              Cropping        Dairy      Exotic   Native Bush   Pasture   Vineyard    Vineyard     Vineyard
                                         forest                             Vine      Interrow      Wheel

  Figure 3: Soil pH by land use for all samples since 2000. Target ranges vary for landuses. Refer
                                             Appendix A

MDC Technical Report No: 20-003                                                                               11
Soil Quality in the Marlborough Region 2019 3.2.2. Olsen P Phosphorus is an essential nutrient for both plants and animals. Only a small amount of the total phosphorus in soil is in forms able to be taken up by plants (plant-available P). The Olsen P method is a chemical extractant that provides a reasonable estimate of the amount of plant-available phosphorus by measuring phosphate from soil solution and exchange surfaces (Olsen et al, 1954). Olsen-P can also provide an indicator for the risk of phosphorous loss to water. Phosphorus in run-off water is known to increase with increased Olsen-P values. From the 24 Olsen P samples taken in 2019, concentrations varied from 7mg/L to 71 mg/L. This year, the lowest values are found in forestry, native bush and pasture samples (Figure 4). The highest values were found in vineyard samples. The maximum Olsen P target for all soils is set at 50 ml/L (Mackay et al, 2013). One vineyard site (3 samples, Site 9) showed Olsen P values well in excess of this (62 to 71 ml/L). These values are related to its previous history as a dairy farm. Site 45b showed a high Olsen P (56mg/L) in 2019. This is a lift from previous values and would indicate a fertiliser application since the last sample in 2014. In this case it is notable that the A_vine sample shows a lower value (32) with the C_interrow value slightly lower (42). This would indicate that any fertiliser application was likely made sometime ago and has been taken up by vines and to some extent by the interrow grasses. However, the wheel tracks in this case are unvegetated and it is likely that the fertiliser lies unused in this area. If soil was lost from the wheel tracks (via erosion or on tractor tyres) it could pose a risk to water quality. Eleven sites had Olsen P values below the optimal for their land use. These sites may be operating at Olsen P values below concentrations considered optimal for maximum pasture/crop production. These sites cover several different land uses. Some sites are reflective of previous land use. Site 9 is a vineyard converted from dairying in the past year. It is noted that the maximum values seen in Figure 5 for dairy and vineyard are all from this site. The 2016 Soil quality report noted the high Olsen-P levels seen in dairy sites. Site 28 is similarly a recent vineyard conversion but from unimproved pasture, hence the low Olsen-P values. Of the remaining low Olsen-P samples, some have lifted since their last sampling indicating the application of fertiliser (sites 27 and 28) and some have fallen probably as a result of removal of nutrients in products (site 54,55,56,57). This leaves 6 sites with previously low values that have remained low at this sampling. These consistently low samples from sites (27, 28, 35, 47,48 and 55) would suggest that fertiliser practice should be reviewed to ensure adequate productivity is being obtained from these sites. The trends in the 2019 values are consistent with the longer-term samples (Figure 5). Farmed sites generally reflect higher Olsen P concentrations compared to unfarmed sites or sites with lower returns. 12 MDC Technical Report No: 20-003
Soil Quality in the Marlborough Region 2019

                         80

                         70

                         60

                         50
       Olsen-P value (mg/L)

                         40

                         30

                         20

                         10

                              0
                                            Exotic forest                   Pasture                       Vineyard

Figure 4: Olsen P values by land use for 2019 samples. Target maximum is 50 mg/L for all landuses,
                  Target minimum for exotic forestry is 5, other landuses 15mg/L

                         100

                              90

                              80

                              70

                              60

                              50
  Olsen P (mg/kg)

                              40

                              30

                              20

                              10

                                  0
                                      Cropping    Dairy     Exotic   Native Bush   Pasture   Vineyard   Vineyard     Vineyard
                                                            forest                             Vine      Wheel       Interrow

            Figure 5: Soil Olsen P values for all samples since 2000. Target maximum is 50 mg/L for all
                    landuses, Target minimum for exotic forestry is 5, other landuses 15mg/L

MDC Technical Report No: 20-003                                                                                             13
Soil Quality in the Marlborough Region 2019 3.2.3. Trace Elements Trace elements accumulate in soils either naturally through weathering of minerals contained in the soil parent material or from anthropogenic sources. While many trace elements are essential for healthy plant and animal growth, i.e. copper and zinc, at high concentrations in soils these can have a negative impact on soil fertility and plant and animal health. Furthermore, some trace elements, i.e. cadmium and arsenic are not essential in soils and their accumulation can also have a negative impact on soil, plant and animal health and in some cases, there is potential for them to accumulate in the human food chain. Table 3 summarises trace element concentrations in soils from the monitoring sites. No sites showed trace elements in excess of the guideline values in 2019. On average the 2019 sample concentrations were 3.9 mg kg-1 for arsenic, 0.14 mg kg-1 for cadmium, 19.4 mg kg-1 for chromium, 12.3 mg kg-1 for copper, 11.6 mg kg-1 for lead, 13.6 mg kg-1 for nickel, below detection for mercury and 58.4 mg kg-1 for zinc. These average concentrations are within the suggested upper limits for trace elements in soils as suggested by the New Zealand Water and Waste Association (Appendix A). Concentrations are also similar to those that have been found in soils in other parts of New Zealand ( Auckland Regional Council , 1999; Greater Wellington Regional Council, 2005; Canterbury Regional Council, 2006; Curran- Cournane & Taylor, 2012) and what has previously found in Marlborough (Gray C. , 2011b). For cadmium, average concentrations in farmed soils were approximately double typical background concentrations found in soils (0.2mg/kg). Non-farmed soils such as native forest samples typically only show background levels of cadmium (Figure 6). The source of cadmium is most likely phosphate fertiliser which has been shown to contain cadmium as an incidental impurity (Longhurst, Roberts, & Waller, 2004). Overall, the 2019 results reflect the wider situation of cadmium concentration. Typically, farmed land uses have a higher cadmium concentration than non-farmed (i.e. forestry or native bush). Within the farmed land uses, the concentration of cadmium is generally higher in land uses that have higher value returns reflecting the frequency with which fertiliser is applied (Figure 7). While there is a wide spread of values, Dairy continues to have the highest cadmium concentrations indicative of that industry’s historic reliance on phosphate fertilisers to boost pasture (and clover) growth. The concentration of vineyard cadmium samples have lifted slightly this year with the conversion of site 9 to Vineyard. This site was a long-term dairy and had cadmium values of near 60 mg Cd/kg. Addition of this site has raised the maximum vineyard values but not changed the median or quartile values significantly. It is noted that as this site has been sampled annually for the last 3 years, this may have some influence on the 5-year average and whole-of-study values for vineyards. This will be reviewed in 2020 prior to the next sampling period. 14 MDC Technical Report No: 20-003
Soil Quality in the Marlborough Region 2019

                                  0.7

                                  0.6
  Cadmium concentration (mg/kg)

                                  0.5

                                  0.4

                                  0.3

                                  0.2

                                  0.1

                                   0
                                               Exotic forest                       Pasture                        Vineyard

                 Figure 6: Soil cadmium concentrations by land use for 2019 samples. Maximum value 0.6mg/kg.

                                  1.1

                                   1

                                  0.9

                                  0.8
  Cd concentration (mg/kg)

                                  0.7

                                  0.6

                                  0.5

                                  0.4

                                  0.3

                                  0.2

                                  0.1

                                   0
                                        Cropping     Dairy     Exotic forest Native Bush   Pasture   Vineyard    Vineyard    Vineyard
                                                                                                       Vine       Wheel      Interrow

Figure 7: Soil cadmium concentrations by land use for all samples since 2000

MDC Technical Report No: 20-003                                                                                                     15
Soil Quality in the Marlborough Region 2019
Table 3: Soil chemical results.
Trace Elements
Site Soil type Soil Order Landuse pH Olsen P Zn Cu Cr As Pb Ni Hg Cd
(mg/L) (mg/kg) (mg/kg) (mg/kg) (mg/kg) (mg/kg) (mg/kg) (mg/kg) (mg/kg)
SOE_Soils_Site09a_vine Paynter Gley Vineyard 6.1 71 83 21 22 6.3 15.3 15 < 0.12 0.24
SOE_Soils_Site09b_wheel Paynter Gley Vineyard 6.3 69 82 20 21 6.4 14.9 13.52 < 0.12 0.25
SOE_Soils_Site09c_interow Paynter Gley Vineyard 6.4 62 80 21 19.5 6.1 14.4 13.4 < 0.12 0.22
SOE_Soils_Site27a_vine Motukarara Gley Vineyard 6.2 18 72 21 21 5.3 15.9 23 < 0.12 0.12
SOE_Soils_Site27b_wheel Motukarara Gley Vineyard 6.3 40 67 20 21 5 15.8 2 < 0.12 0.12
SOE_Soils_Site27c_interow Motukarara Gley Vineyard 6.5 21 66 18 23 5.3 16.5 24 < 0.12 0.12
SOE_Soils_Site28a_vine Motukarara Gley Vineyard 6.1 20 62 16 23 5.4 15.1 26 < 0.12 0.1
SOE_Soils_Site28b_wheel Motukarara Gley Vineyard 6.3 19 60 15 21 5.1 14.9 25 < 0.12 0.11
SOE_Soils_Site28c_interow Motukarara Gley Vineyard 6.4 10 59 15 20 5 14.9 24 < 0.12 0.12
SOE_Soils_Site35 Jordan Pallic Pasture 5.9 7 33 4 14.5 2.2 7.2 7.6 < 0.12 0.12
SOE_Soils_Site45a_vine Dashwood Pallic Vineyard 6.7 32 86 12 20 3.5 11.8 12.1 < 0.12 0.2
SOE_Soils_Site45b_wheel Dashwood Pallic Vineyard 6.4 56 80 11 19.3 3.5 12 11.8 < 0.12 0.21
SOE_Soils_Site45c_interow Dashwood Pallic Vineyard 6.3 42 76 12 18.3 3.6 11.6 10.9 < 0.12 0.18
SOE_Soils_Site46a_vine Sedgemere Pallic Vineyard 6.8 26 50 7 23 2.7 7.4 11.2 < 0.12 0.15
SOE_Soils_Site46b_wheel Sedgemere Pallic Vineyard 6.5 21 44 7 14.2 2.6 7.6 7.5 < 0.12 0.16
SOE_Soils_Site46c_interow Sedgemere Pallic Vineyard 6.6 12 44 8 57 2.1 7.2 25 < 0.12 0.15
SOE_Soils_Site47 Sedgemere Pallic Pasture 6.2 14 37 5 23 2 6.9 12.7 < 0.12 0.12
SOE_Soils_Site48 Sedgemere Pallic Pasture 5.8 12 39 5 15.5 2 7.2 8.3 < 0.12 0.12
SOE_Soils_Site54 Weld Pallic Pasture 5.5 13 64 12 10.2 4.9 13.5 7.9 < 0.12 0.07
SOE_Soils_Site55 Weld Pallic Exotic forest 5.9 12 60 12 14.2 3.8 15 12.5 < 0.12 0.06
SOE_Soils_Site56 Warwick Pallic Pasture 5.9 8 61 10 11.6 3.2 10.1 10.1 < 0.12 0.16
SOE_Soils_Site57 Wither Hill Pallic Pasture 5.6 7 29 7 8.9 3.4 8.3 5 < 0.12 0.1
SOE_Soils_Site59 Waihopai Steepland Pallic Exotic forest 5.4 20 35 8 12 1.4 8.2 8.6 < 0.12 0.1
SOE_Soils_Site60 Waihopai Steepland Pallic Pasture 5.5 8 34 8 12 1.8 8.2 9.1 < 0.12 0.1
Red cross indicates exceeds target range, red arrow below target range, yellow exclamation indicates exceeds TMFS level 1.
16 MDC Technical Report No: 20-003Soil Quality in the Marlborough Region 2019 MDC Technical Report No: 20-003 17
Soil Quality in the Marlborough Region 2019

3.3.     Soil Biology Results
Results of soil biological analysis (anaerobically mineralisable nitrogen, total nitrogen, total carbon and
C:N ratio) are reported in Table 4. A new analysis has been introduced this year, hot water carbon.
Each of these organic matter properties is discussed individually. The target values appropriate to the
relevant soil order can be found in Appendix A.

3.3.1. Anaerobically Mineralisable Nitrogen
Anaerobically mineralisable nitrogen (AMN) is a measure of the amount of nitrogen that can be supplied
to plants through the decomposition of soil organic matter by soil microbes. It is a useful measure of
soil quality that determines the ability of organic matter to store nitrogen. However, the amount of
AMN has also been found to correspond with the amount of soil microbial biomass – hence it is also a
useful indicator of microbial activity in soils (Myrold, 1987)

AMN can provide an indication of N loading in soil as organic matter and plant residues are mineralised
(converted by microbes to mineral N). Mineralisation rates are strongly influenced by many factors
such as temperature, moisture and C: N ratio. If the rate of mineralisation exceeds the rate of plant
uptake, this will increase the amount of NO3--N in soil solution (Havlin, Tisdale, Nelson, & Beaton,
2013). Increased soil solution N increases the risk of nitrate leaching. However, NO3--N losses are also
controlled by other factors such as soil texture and soil structure which affect the rate of water
movement (drainage) in the soil and therefore the rate of NO3--N loss. In addition, because soils are
only sampled to the 10-cm depth, it isn’t necessarily going to accurately reflect other processes that
may happen to the nitrate-N further down the soil profile such as denitrification.

Typically, anaerobically mineralisable nitrogen concentrations vary widely between sites with the
lowest values found on unfarmed sites. Nine sites had values higher than their target range in 2019
(Table 4 & Figure 8). Typically, sites with higher inputs of organic matter such as pasture grasses,
manure and urine have higher readings of AMN (Figure 9 – dairy, native bush, pasture). Given the
higher AMN values on these sites, organic matter may be providing a large portion of soil solution N.
Tools such as Overseer can be used to estimate the nitrogen flux in soil.

Sites with lower organic matter inputs or with a high level of soil disturbance will report lower levels of
AMN. Increased soil disturbance increases oxidation of soil organic matter and this can be seen in both
cropping and exotic forestry sites.

Few sites have fallen below the minimum AMN target level for their land use, but clear differences are
seen between land uses (Figure 9). Particularly striking is the lower AMN values within vineyards.
Vineyard wheel tracks and inter-rows show similar AMN values but the area under the vines has
noticeably lower AMN values. The continual use of herbicide in this area is probably limiting organic
matter input. The long-term effect of this will be to limit nitrogen availability in this area potentially
leading to increased fertiliser use.

18                                                                     MDC Technical Report No: 20-003
Soil Quality in the Marlborough Region 2019

                                                             300

                                                             250
                Anerobically Mineralisable Nitrogen (ug/g)

                                                             200

                                                             150

                                                             100

                                                             50

                                                              0
                                                                          Exotic forest                Pasture                    Vineyard

Figure 8: 2019 Anaerobically mineralisable nitrogen values for 2019. Target range for Pasture 50
to 200 ug/g (dashed line). All other landuses 150 to 20 ug/g (solid line).

                                                  400

                                                  350
  Anerobically Mineralisable Nitrogen (ug/g)

                                                  300

                                                  250

                                                  200

                                                  150

                                                  100

                                                             50

                                                              0
                                                                   Cropping     Dairy     Exotic   Native Bush   Pasture   Vineyard    Vineyard    Vineyard
                                                                                          forest                             Vine       Wheel      Interrow

Figure 9: AMN concentrations by land uses for all samples since 2000. Target range for Pasture 50
to 200 ug/g (dashed line). All other landuses 150 to 20 ug/g (solid line)

MDC Technical Report No: 20-003                                                                                                                               19
Soil Quality in the Marlborough Region 2019 3.3.2. Total Carbon Total carbon in soil includes carbonates and soil organic matter carbon. Typically, New Zealand soils contain only small amounts of carbonate; hence total carbon is generally considered a good measure of organic matter carbon in soil. Organic matter is important for soil health because it aids in the retention of moisture and nutrients, contributes to a stable soil structure, provides a source of energy for soil microbes and is a source of nutrients e.g. nitrogen, phosphorus and sulphur. In contrast, low soil C increases the risk of structural degradation in soils e.g. low aggregate stability, high bulk density, low air-filled porosity, formation of surface crusts and compaction. All sites had total soil carbon contents within the acceptable target ranges for their respective soil orders in 2019 (Figure 10). It is clear from Figure 11 that organic matter accumulation and protection is greatest under native bush. This represents the carbon accumulation from deposition of organic matter over many thousands of years in some cases. The median figure for native bush of 5.6% could be taken as a guide to the pre- European level of soil carbon through much of lowland Marlborough. The long-term Figure 11 illustrates a similar situation to that of AMN. Land uses with high inputs of organic matter (dairy, forest, pasture) have higher levels of total carbon. Land uses that involve the disturbance of soil (cultivation) have reduced total carbon. It is interesting to note the difference between the exotic and native forest data (Figure 11). The exotic forest has lower total carbon compared to native bush most likely due to the intermittent soil disturbance (and burning) that occurs (occurred) during forest harvesting and establishment. 20 MDC Technical Report No: 20-003
Soil Quality in the Marlborough Region 2019

                     7

                     6

                     5
     Total Carbon (%)

                     4

                     3

                     2

                     1

                     0
                                    Exotic forest                   Pasture                       Vineyard

Figure 10: Total carbon values for 2019. Minimum values 2% for Pallic soils (dashed line), 2.5% all
other soil orders.

                     12.000

                     10.000

                         8.000
  Total Carbon (%)

                         6.000

                         4.000

                         2.000

                         0.000
                                 Cropping      Dairy   Exotic   Native Bush Pasture   Vineyard    Vineyard   Vineyard
                                                       forest                           Vine       Wheel     Interrow

Figure 11: Total carbon by land use for all samples since 2000. Minimum values 2% for Pallic soils
(dashed line), 2.5% all other soil orders.

MDC Technical Report No: 20-003                                                                                         21
Soil Quality in the Marlborough Region 2019 3.3.3. Hot Water Carbon Recent work by Taylor, et al., (2017), Curtin, et al., (2017) and (Lawrence-Smith, McNally, Beare, & Lehto, 2018) has shown that hot water carbon extractions could provide a better soil quality indicator than the current set of organic matter indicators. In 2019, MDC undertook the first set of Hot Water Carbon analysis. Further work is currently underway regarding this indicator but a provisional target level has been set for all landuses and soil orders. This provisional level is set at >1900 mg of carbon per kg of soil (Taylor, et al., 2017). It is generally accepted that soils exposed to more cultivation will lose soil carbon and consequently suffer from degraded soil structure. These soils typically show low HWC readings and this infers reduced microbial activity, reduced soil structure and consequently reduced ecosystem services such as water storage, water filtration and nutrient supply (Ghani, Mackay, Clothier, Curtin, & Sparling, 2009). HWC is thought to consist of two pools of soil carbon, a very active pool and a slowly active pool. These are thought to represent both the dissolved organic fraction and some of the recalcitrant compounds that increase soil stability. These compounds are mainly root exuded compounds that are water soluble and can; improve nutrient availability, alleviate metal toxicity and serve as a carbon and energy source for microorganisms. Relationships between microbes and the soils dissolved organic carbon (and dissolved organic matter in general) are important in regulating the fluxes of carbon in surface soil horizons and can also play a critical role in stabilisation of SOM, carbon dynamics and contributes to soil water repellancy (Taylor, et al., 2017). The soil carbon fractions measured by HWC are important in the global soil carbon cycle as they represent the carbon most easily lost to the atmosphere as C02 (Grunwald, Thompson, & Boettinger, 2011) and to water as dissolved carbon following cultivation and the use of N fertilisers (Boyd, 2015) It is startling to see all but 3 out of 24 samples fall below the 1900mg/kg provisional limit in the 2019 samples (Figure 12 and Table 4). As the 1900 mg/kg limit is provisional, a lower limit of 1700 mg/kg is also included for this first sampling. 6 samples fell between the 1900 and the 1700mg limits and these are indicated by red arrows in Table 4. The most worrying aspect of this new data is the large gap between the median values and the target line. This would indicate that, in general, all landuses are implicated in reduced microbial activity with potential implications for soil structure, nutrient cycling and water retention. No samples have yet been taken from native bush sites in Marlborough but it is expected that these will have HWC values well above the provisional limit. This is supported by Taylor, et al., (2017) who found that the average HWC value in native areas (North Island study area) was 4670 mg/kg. 22 MDC Technical Report No: 20-003
Soil Quality in the Marlborough Region 2019

                             2500

                             2000
  Hot Water Carbon (mg/kg)

                             1500

                             1000

                             500

                               0
                                    Cropping   Pasture   Exotic   Vine         Wheel         Interow

Figure 12: Hot Water Carbon values for 2019. Note provisional target value of 1900 mg/kg (red
line)

MDC Technical Report No: 20-003                                                                           23
Soil Quality in the Marlborough Region 2019 3.3.4. Total Nitrogen Nitrogen is an essential major nutrient for plants and animals, and the store of organic matter nitrogen is an important measure of soil fertility. Typically, in topsoils, organic matter nitrogen comprises more than 90% of the total nitrogen. However, organic matter nitrogen needs to be mineralised to inorganic forms (i.e. ammonium and nitrate) by soil microbes before it can be utilised by plants or lost from soil by leaching. In 2019, all sites returned values above the target values for total nitrogen. Note that no target values are set for total nitrogen for cropping or horticulture (including vineyards). However, it is interesting to note the differences between the different vineyard samples. While all samples in 2019 would meet the pasture standard of 0.25% total N, the under-vine samples are notably lower and this has been a consistent finding of this work over time. This is likely due to the low inputs of organic matter from the herbicide strip under the vines (Figure 13). As total Nitrogen content is closely related to organic matter levels, soils with low inputs of organic matter or high loss rates caused by cultivation will have low total Nitrogen. This can be seen in Figure 14 in cropping, exotic forest and under-vine strips. 3.3.5. Carbon: Nitrogen Ratio The balance of the amount of carbon to nitrogen in soil is called the carbon: nitrogen ratio (C:N). This ratio is important as a guide to the state of decomposition or likely ease of decomposition and mineralisation of nutrients i.e. production of nitrates and ammonium from organic residues in soils and is a measure of organic matter quality. It is therefore also a guide to the risk of N mobility (nitrate leaching) in soil. Amongst the 2019 samples, 4 out of 24 samples had C:N ratios below 10:1 (Table 4) though most are close to 10:1. As C: N ratio increases above 10:1 (nitrogen becomes scarce in relation to carbon), soluble nitrogen is immobilised (taken up) by soil microbes, the soil solution N concentration falls and the risk of nitrogen leaching decreases (Havlin et al, 2013). Nitrogen cycling then becomes more dependent on microbial activity. Low C:N ratios (15 but are variable depending on whether they have been planted directly into cleared bush, a prepared site, second or third rotation, scrub, or former pasture. The current years data is in line with this with exotic forest reporting wide C:N ratios depending on the stage of forest development. 24 MDC Technical Report No: 20-003
You can also read