Broadening our scope 2012 IPC POSTAL SECTOR SUSTAINABILITY REPORT - International Post Corporation
←
→
Page content transcription
If your browser does not render page correctly, please read the page content below

Broadening
our scope
2012 IPC POSTAL SECTOR SUSTAINABILITY REPORT

        THE NATURAL PARTNER FOR THE POSTAL INDUSTRY
1. Introduction

                                                                            • EMMS participants                      3

                                                                            • Statement from the CEO                 4

                                                                            • Key figures                            8

                                                                           2. Carbon Management
                                                                           	•	The Environmental Measurement and    9
                                                                           		 Monitoring System
                                                                           	• Carbon management proficiency         12
                                                                           	• Carbon emissions                      16

About the International                                                     3. Posts’ Best Practice Cases
Post Corporation
                                                                             • Broadening the scope                 23

                                                                             • Post's best practice cases            24

The International Post Corporation is a cooperative association of 24
member postal operators in Asia Pacific, Europe and North America.
Over the past two decades IPC has provided industry leadership by
driving service quality and interoperability, supporting its members
to ensure the high performance of international mail services and
developing the IT infrastructure required to achieve this. IPC engages     4. Annex & Assurance
in industry research, creates business-critical intelligence, provides a
range of platforms for member post CEOs and senior management to
                                                                            • Indicator definitions                  38
exchange best practices and discuss strategy, and gives its members an
                                                                            • Exclusions and estimations             39
authoritative, independent and collective voice. IPC also manages the       • Independent assurance report 	        40
system for incentive-based payments between postal operators. With
members delivering some 80% of global postal mail, IPC represents the
majority of the world’s mail volume. For more information please visit
our website at www.ipc.be.
EMMS participants
In 2008 International Post Corporation launched its
Environmental Measurement and Monitoring System                        An Post                                         Ireland    Magyar Posta Zrt                           Hungary
(EMMS), the first ever global approach for carbon emissions            Australian Postal Corporation                Australia     New Zealand Post Ltd                  New Zealand
reduction for a services industry. Now, four years on, we are          bpost                                         Belgium      Nigerian Postal Service                     Nigeria
well on track to reach the ambitious goals of cutting the              Canada Post Corporation                        Canada      Österreichische Post                        Austria
global postal sector’s carbon emissions by 20%. Over the               Empresa Brasileira de Correios e Telégrafos       Brazil   Poste Italiane                                  Italy
last year the programme has continued expanding both its               Correos y Telégrafos                              Spain    Posten Norge                               Norway
                                                                       CTT Correios de Portugal                      Portugal     PostNord                       Denmark and Sweden
measurement scope and its geographical reach.
                                                                       Deutsche Post DHL                            Germany       PostNL                                 Netherlands
                                                                       Entreprise des Postes et                                   Royal Mail Group Plc               United Kingdom
                                                                       Télécommunications Luxembourg             Luxembourg       South African Post Office              South Africa
                                                                       Le Groupe La Poste                              France     Swiss Post                              Switzerland
                                                                       Hellenic Post-ELTA                             Greece      United States Postal Service          United States
                                                                       Itella Ltd                                     Finland

International Post Corporation   Postal Sector Sustainability Report
                                                                                                                                                                                          3
Introduction

    Statement from the CEO
                   With the passing of another year of commendable mitigation     This year we have also seen a substantial increase in the
                   efforts and carbon emission reductions, International Post     number of participants measuring and reporting emissions
                   Corporation is pleased to announce the results of the postal   emerging not just from the operations under their direct
                   industry’s environmental sustainability efforts in 2011.       control, but from the wider value chain. As these indirect
                   Under IPC’s global postal sustainability programme, the        aspects can have a large impact, it is vitally important that
                   IPC Environmental Measurement and Monitoring System            they are not overlooked in our measurement and monitoring
                   (EMMS), participating postal operators have collectively       activities. In recognition of this fact, the 2012 IPC Postal
                   reduced CO2 emissions by over 3.5% since 2010, equivalent      Sector Sustainability Report has been dedicated to the
                   to a reduction of 261,000 tonnes.                              management of emissions across the value chain. In the
                                                                                  following pages we illustrate how EMMS participants are
                   Our current rate of progress far exceeds the required rate     going further, to address the indirect impacts throughout the
                   to meet our collective target of a 20% absolute reduction      value chain, with case studies to provide concrete examples
                   in emissions by 2020. When combined with the emissions         of some of the innovative mitigation approaches that are
                   reduction achievements of the past years, the EMMS             now being rolled out across the sector.
                   participants are now almost three-quarters of the way to
                   achieving our group target. If we continue at this rate,       We believe that collaboration is essential to effectively
                   we will reach our goal much earlier than expected. These       address the environmental challenges we currently face.
                   impressive results reflect the continued efforts by the EMMS   We have therefore been working hard to increase the
                   participants to innovate, both in terms of the efficiency of   geographical scope of our global sustainability programme.
                   their products, services and technologies and in driving the   As the first sector-wide carbon reduction initiative for a
                   behavioural changes needed to address the challenge of         services industry, we have always focused on engaging as
                   climate change.                                                many postal operators from around the world as possible.

                                                                                       International Post Corporation   Postal Sector Sustainability Report
4
Introduction

Following last year’s inclusion of the South African Post
Office in the EMMS, we are delighted to welcome two new
                                                                       in our journey towards the achievements of our targets
                                                                       for 2020. We will be working vigilantly to ensure that our
                                                                                                                                       “ Our current rate of progress far exceeds
participants: Empresa Brasileira de Correios e Telégrafos              participants are provided with the necessary support in their    the required rate to meet our collective
(Correios Brazil) and Nigerian Postal Service (Nigeria Post).          mitigation efforts, to provide on-going monitoring and           target of a 20% absolute reduction in
These two new entrants represent a significant expansion               oversight and to encourage the sharing of best practice
of the programme into two highly populated and rapidly                 approaches among peers. We invite you to listen, as we have      emissions by 2020.
developing countries. We feel that this is a further                   done, to the multiple voices of our industry stakeholders and    If we continue at this rate, we will reach
                                                                                                                                                                               ”
demonstration of how the postal sector is working to bridge            look forward to further years of continuous improvement.
the perceived divide between developed and developing                                                                                   our goal much earlier than expected.
economies in tackling a truly global problem. Correios
Brazil is one of the largest postal sector organisations in the
world and is located in an important emerging economy.                 Herbert-Michael Zapf,
Furthermore, we hope that the addition of Nigeria Post                 IPC President & ceo
as the second African postal operator in the programme
will support our ambitions to expand further still into the
developing nations of Africa.

Once again, I have found the considerable progress made
over the year extremely encouraging and would like to
congratulate all of our participants on their excellent
achievements in enhancing their sustainability performance.
However challenges remain and we must not be complacent

International Post Corporation   Postal Sector Sustainability Report
                                                                                                                                                                                       5
New Participant - Brazil

             Correios Brazil is set to make far-reaching impact
             through the EMMS programme, as Latin America’s largest
             postal service
             Empresa Brasileira de Correios e Telégrafos (Correios Brazil) has   The social and environmental activities undertaken by Correios
             been experiencing consistent growth and increasing revenues         Brazil are aligned to national and international guidelines
             in recent years as the post continues on its path to be a           for sustainability, including the United Nations Millennium
             world-class company in terms of organisational management,          Development Goals and the thirteen national guidelines of
             procedures and results.                                             the instrument of the Presidency. The post has also positioned
                                                                                 its strategy based on the ‘Triple Bottom Line’ of economic,
             Since its origins in 1663, Correios Brazil has been striving        social and environmental concerns. In the current global
             to create a modernised service that meets the quality               landscape of major technological change and new habits,
             expectations of its customers. Historically the company             Correios Brazil is very much aware that environmental issues,
             has always played an important role of social inclusion and         including climate change, are increasingly emerging as critical
             integration in national development. It has also acted as an        topics of strategic concern to the growth and development
             important government agent in the social field; its many roles      of both enterprises and nations. Correios Brazil has already        From left to right: Mr Wagner Pinheiro de Oliveira,
             include the distribution of textbooks, the payment of pensions,     been demonstrating its commitment to support these causes           President, Correios Brazil; Dr Herbert-Michael Zapf,
             the transportation of emergency support, campaigns related to       for many years. The implementation of the Environmental             President and CEO, International Post Corporation
             breastfeeding and the training of needy youngsters. Correios        Administration System (SGAC), has increased its capability to
             Brazil will continue to push for excellence in its products and     measure its environmental impacts and has driven continuous         The company believes that the EMMS programme is
             services in order to contribute to the competitiveness of the       improvement. Among numerous other initiatives, the                  vitally important in driving down global carbon impacts
             country and improve the quality of life of society at large.        company has its EcoPostal initiative to reuse uniforms and          from the postal industry through its provision of sector-
                                                                                 postal mailbags, promotes sorted recyclable waste collection        wide management proficiency assessments, emissions
                                                                                 and responsible waste management, has carried out pilot             measurement, sector benchmarking, results reporting and
                                                                                 testing of electric vehicles, and is involved in the direction of   group targets. As the leading postal operator in Latin America’s
                                                                                 environmental education and the promotion of eco-efficient          largest economy, Correios Brazil has acknowledged that its
                                                                                 products and services.                                              participation in the programme represents a crucial expansion
                           Key facts - Brazil                                                                                                        of the postal industry’s focus and co-ordinated carbon
                           Capital:           Brasília                           In June this year Mr. Wagner Pinheiro de Oliveira, CEO of           reduction action. The EMMS programme provides a global
                           Population:        193,947,000                        Correis Brazil, announced the participation of Correios Brazil      framework through which the post can support its sector
                           Total area:        8,514,877 km2                      in the IPC Environmental Measurement and Monitoring                 peers in a collaborative way, share best practices, and drive
                                                                                 System (EMMS), a participation that is a logical next step          continuous improvement as global problems require global
                           Official language: Portuguese
                                                                                 in the organisation’s environmental sustainability strategy.        solutions.

                                                                                                                                                          International Post Corporation   Postal Sector Sustainability Report
     6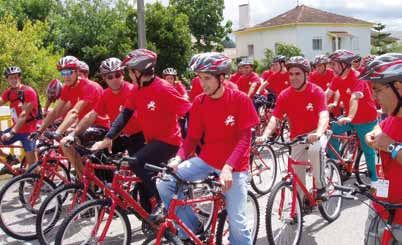
New Participant - Nigeria

Nigeria Post (NIPOST) fully supports the EMMS and
is ready to play its role in further expansion of the
programme across the African continent
Nigeria Post provides vital services in both urban centres             I am delighted that Nigeria Post has joined International Post
and rural communities, acting as an essential force in                 Corporation’s EMMS sector sustainability programme. I am in
community development for Nigeria’s population of over                 full support of the ambitions of IPC to bring African nations
165m. Since the country’s independence in 1960, Nigeria                into this global system of carbon emissions management
Post has been striving to work towards the creation of a               and reporting. As a consequence of our strong regional
service that is ever more efficient and responsive to public           role and our participation in this sustainability programme
needs, whilst maintaining reasonable costs.                            as the second African participant, we will be able to set an
                                                                       example to other developing postal operators and work to
Presently there are 1,176 post offices and over 2,442                  further increase engagement with the programme across the
postal agencies throughout the Federation providing                    African continent. Efficient use of natural resources and the
postal, logistic, financial and other communication                    conservation of energy should be a key concern for all African    From left to right: Mr Pieter Reitsma,
services to the populace. Based in the most populous                   nations. Furthermore, joining the EMMS programme will             Sustainability Manager, International
African country and one of the largest economies on the                allow Nigeria Post to contribute to an important global effort,   Post Corporation; Mr Ibrahim Mori Baba,
continent, NIPOST is one of the leading posts in West                  share best practices and learn from its peers around the world.   Postmaster General and CEO, Nigerian Postal
Africa.                                                                                                                                  Service
                                                                       In line with our participation in the EMMS, I affirm the
However, while we anticipate significant growth in the                 commitment of Nigeria Post to sustainable business
coming decades, we are also committed to ensuring that                 development and commit our solidarity to contributing to
this growth is managed in a fully sustainable way. To this             the collective attainment of the sector’s carbon emissions
end, we hope to play a leading role in societal issues such            reduction target for 2020.
as the campaign against stigmatisation of people living
with HIV and the fight against its spread, promoting a
greener and better working environment for our workers,                                       Mr Ibrahim Mori Baba                          Key facts - Nigeria
carbon emissions reduction and other important topics.                                        Postmaster General and CEO                    Capital:           Abuja
We believe that collaboration between postal operators,                                       Nigerian Postal Service                       Federation:        36 States and
working together across both developing and developed
                                                                                                                                                                Federal Capital
economies, is essential for us to be able to tackle the
common, global problem of climate change and which in
                                                                                                                                            Population:         166,629,000
the long run would ensure a more efficient management                                                                                       Total area:         923,768 km2
of our resource and promote environmental responsibility.                                                                                   Official language: English

International Post Corporation   Postal Sector Sustainability Report
                                                                                                                                                                                                       7
Carbon management
    In 2011 the IPC Environmental Measurement and Monitoring System
    participants continued their collective efforts to reduce carbon
    emissions, resulting in yet another year of impressive results.
    This year full Scope 3 reporting was included in the reporting, in order
    to monitor carbon emissions throughout the entire value chain.
    With Carbon Management Proficiency scores continuously improving
    and carbon emissions decreasing significantly, participating posts
    have once again seen their management and mitigation efforts pay off.

                                                        International Post Corporation   Postal Sector Sustainability Report
8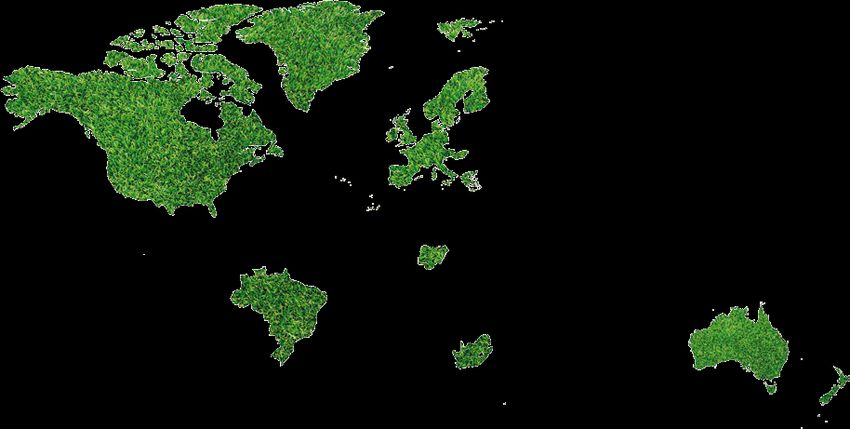
Carbon management

The Environmental Measurement and Monitoring System

The Environmental Measurement and Monitoring System (EMMS) was               Comprehensive data collection
developed in 2008, in direct response to requests from CEOs working                                                                                         Carbon Management
throughout the postal industry. The system was built with the aim of         The EMMS process begins with the participating postal companies                Proficiency
implementing a common carbon measurement and reporting framework,            completing an annual comprehensive self-assessment questionnaire
                                                                                                                                                            • Average CMP score of 70%
in line with customer requirements and stakeholder expectations. A pilot     on their management proficiency which entails a primarily qualitative
                                                                                                                                                            • 5% improvement from
of the system was carried out in 2008, in collaboration with our EMMS        assessment across ten management proficiency areas.
participants.                                                                                                                                                  2010
                                                                             The results of the questionnaire are analysed and used in our assessments      • ON TARGET to achieve
In 2009, the full programme was rolled out with the first data collected     for the Carbon Management Proficiency (CMP) section of the EMMS.                  >90% goal for 2020
and progress measured for the 2008 calendar and financial reporting          The next part of the process involves reporting on performance trends,
year. This represents the benchmark year of the EMMS programme.              sector averages and company scores, for both the qualitative Carbon
The objective is to drive both carbon management proficiency and             Management Proficiency (CMP) section of the EMMS and a suite of 16
performance by providing a common reporting structure for posts to           Carbon Performance Indicators (CPI) across five categories: Overall Sector
disclose their environmental management strategies and achievements.         Indicators, Scope 1, Scope 2, Scope 3 and Activity Indicators.

EMMS participants employ around 2.0 million staff across the globe           In order to ensure consistency of the data, participants are encouraged
at over 100,000 facilities, with well over half a million delivery and       to use our calculator tool and are provided with an exhaustive guidance        Carbon Performance
transport vehicles. Through fuel combustion, the energy used to heat         document for reference. This year we have implemented an additional            Indicators
and cool buildings and several other sources, these companies release        plausibility checking process to further ensure consistency and accuracy of    • 3.5% or
significant volumes of CO2 into the atmosphere. At IPC, we are working       data collected across the group. The final results are subject to review by     261,000 tonnes
to systematically address these impacts and collaborating to combat global   IPC and Maplecroft, an independent advisory consultancy specialising in
                                                                                                                                                               reduction from 2010
climate change across the sector through our EMMS programme. We              global risks management. This review process also stimulates constructive
                                                                                                                                                            • IPC group Scope 1 & 2
believe that through the sharing of knowledge and the encouragement          feedback, monitoring and continuous improvement of the programme for
of positive action, the entire postal industry will be able to lower its     the future.                                                                       emissions
environmental impacts, thus addressing stakeholder concerns about its                                                                                        7,173,000 tonnes
contribution to greenhouse gas emissions.                                    The calculator tool and associated guidance materials are aligned with         • ON TARGET to achieve
                                                                             the requirements of international best practice standards including ISO           20% reduction goal for
                                                                             14001 (environmental management), ISO 14064 (carbon accounting), the
                                                                                                                                                               2020
                                                                             Greenhouse Gas Protocol, Dow Jones Sustainability Index, FTSE4Good,
                                                                             and current best practice as used by members of the Carbon Disclosure
                                                                             Project and the US Climate Registry. Each participant is provided with their
                                                                             results in the form of an individual scorecard and assessment and given
                                                                             ample opportunity to engage and share feedback on their experiences
                                                                             and progress.

International Post Corporation   Postal Sector Sustainability Report
                                                                                                                                                                                              9
Carbon management

                    Broadening our scope
                    IPC continues to broaden the scope of participation in the EMMS                 indicated. For a detailed overview of participation in both the carbon
                    programme. This year we welcome two new EMMS participants, Empresa              management proficiency and carbon performance aspects of the EMMS,
                    Brasileira de Correios e Telégrafos (Correios Brazil) and The Nigerian          please refer to the exclusions and estimations in the Annex p39.
                    Postal Service (Nigeria Post) which will bring the total number of EMMS
                    participants to 25. Correios Brazil and Nigeria Post will be formally           This report presents the overall results of our EMMS programme for
                    integrated and report their first set of EMMS results in 2013.                  the calendar year 1st January to 31 December 2011. In limited and
                                                                                                    unavoidable cases, some degree of estimation has been necessary. For
                    The South African Post Office (SAPO) has submitted its quantitative carbon      example, in order to ensure consistency in scope, some participants may
                    performance data this year, representing the company’s first step towards       have been obliged to make estimations of their performance in certain
                    the achievement of our collective goal. As part of the review procedures        areas. In such cases, estimations are made very carefully by the reporting
                    for this report, SAPO was also visited by our external accountant PwC.          postal operator to ensure that they are as accurate and realistic as
                    With the aim of ever increasing disclosure, participants have increased the     possible.
                    scope of their submissions by including subsidiaries or other parts of their
                    business such as newspaper delivery and direct marketing services. For          In this report, IPC has also provided the range of coverage provided by
                    more information see Annex p39.                                                 the data for each indicator, calculated as follows: the percentage of the
                                                                                                    business, as quantified by operational revenue, that reports data on a
                    Consistent with previous years, the figures presented in this report            certain indicator, is divided by the total revenue of all EMMS participants.
                    continue to reflect the mail and parcel operations of our participants.         Coverage data is provided in relevant carbon performance data tables in
                    Information relating to express and logistics services, while included in the   brackets, in cases where this is not 100%.
                    overall EMMS programme, has not been included in this report in order
                    that we can focus our analysis on the core comparable mail and parcel           To provide additional assurance, this report has been reviewed and
                    operations. To facilitate accurate year-on-year comparisons, all carbon         approved by the management of IPC. We have followed reasonable
                    performance data is categorised according to whether it relates to the          steps and taken great care to ensure that the information and indicators
                    original set of EMMS participants (excluding Österreichische Post, Poste        published in this report are accurate to the best of our knowledge. In
                    Italiane and the South African Post Office, which have joined since 2009).      addition, we have instructed our external accountant PwC to review the
                    The original set of participants can then be compared to the ‘extended          key sector indicators. The metrics verified by PwC are indicated by a
                    group’, which also includes these three new entrants. The figures provided      rhombus symbol (♦) accompanying the relevant reporting category. The
                    in this report relate to the original set of participants unless otherwise      results can be found in the Assurance Report on p40.

                                                                                                                       International Post Corporation   Postal Sector Sustainability Report
10
Carbon management
Sector scorecard
IPC provides all participants with a detailed scorecard and assessment of Figure 1: EMMS Sector Scorecard
their performance in both carbon management proficiency and carbon
emissions performance. The scorecard contains more than 800 data
points and trend indicators to give each participant a detailed overview 2012
IPC EMMS
Sector Scor
ecard 2012
IPC EMMS Sector Scorecard
of their performance and to allow benchmarking with previous years. As Carbon pe
rformance
indicators
the standard EMMS scorecard for each company contains confidential
22 y Telégrafos,
EMMS participants bpost, Canada Post, Correos
The Carbon
Corp, Austria Post Corp, Post ELTA, Itella carbon em Performance sect
An Post, Australian Postal Groupe La Poste, Hellenic ion of the
Participating postal , Deutsche Post DHL, Le , P&T issions and
CTT Correios de Portugal Posten Norge, PostNL, PostNord outlets and energy use EMMS is
an asse
organisations Zealand Post, Poste Italiane, Postal Service financial across the
six categor ssment of the qua
information, we are not in a position to make these public. However, in Ltd., Magyar Posta, New Swiss Post, United States services.
South African Post Office, The results ies of ma ntitative
Royal Mail, presented
Luxembo urg, here focus il, parcels, expess aspects of carbon
EMMS Gr on the cor (na
e 'mail and tional and interna
managem
301,262m oup Emiss ent
tional), log , including
Postal volume (items) ions (Mail parcels' acti
line with our intention to promote disclosure and increase transparency of
vities. istics, reta
52,819,000m
2 & Parcel) il
Building area - Tonnes of
2,039,000
Scope
2008
CO
2
No. of employees
the EMMS programme, this year, we have produced an additional overall
2009
571,000 2010
No. of vehicles 2011
1&2 Key drivers
iency 8,360,000
sector scorecard to be made available to the public. Carbon management profic
cy is measured using the
EMMS questionnaire, which
involves an assessment
section takes inco account
across ten areas
the qualitative aspects
7,763,00
7,434,000
Scope 2 ele
in buildin ctricity purchased
7,173,000
gs for use
Carbon Management Proficien systems approach. This significant has been the sing
-check-act' management source sinc le most
aligned with IPC's 'plan-do manage ment proficiency (CMP). programm
e, makin
e the sta
rt
of each postal compan
y's carbon 2011 2010 3 combined g up 48.5% of the
2008 2009 NC Scope 1 & of the
2 impact
64.9/100 69.9/100 10,014,000 Outsourc in 2011.
The sector scorecard contains overall group summary information such as 61.3/100 ed
transport or sub-contracted
8,722,000
ncy score 56.4/100 10,292,000 has been
Carbon management proficie
road
87.9/100 90.4/100 source sinc the most
84.9/100 83.3/100 making up
e the sta
rt of the
significant
– IPC leader Required pro
31.7/100 impact in 42.2% of the total gramme,
a list of participants, total group postal volumes, total vehicle numbers and 21.4/100 annual red
19.1/100 20.4/100 uction to
achieve the
2011. Scope 3
– IPC lowest (on Scope IPC target
1 & 2 em of 20%
to achieve 90% by 2020 issions) by
s in line with the IPC target
the total reported group building area. Carbon management proficiency Annual pro 2020
Annual progres EMMS gress in line
Leader Group Em with this -139,333
(score 2011) issions Re IPC target tCO
(score 2008) (score 2009) (score 2010) IPC range ductions pr 2
ogress
scores are provided for 2008-2011 including a graph and summary table
Lowest
Tonnes
Annual emis
(%) 9,000,000 sions redu
ction (on
Scope 1 &
detailing performance trends for the four year period. In terms of carbon
2) towards
100 2020 targ
8,500,000 et (Mail and
Parcel)
Target 90
8,000,000
performance, the sector scorecard summarises the total group emissions 80
70
7,500,000 -7.1%
reductions progress in comparison to the group target and provides an 60
50
2020
Target
6,688,000
7,000,000 - 4.2%
tonnes
6,500,000 - 3.5%
explanation of EMMS reporting protocols. 40
30
6,000,000
2020
The two page EMMS sector scorecard can be found online at
5,500,000 Target
20 -20%
5,000,000
10
http://www.ipc.be/Services/Sustainability/EMMS/EMMS_Scorecard
and reporting
management
and verification
Performance
Value chain
Measurement
0 2008
engagement
Further de
Disclosure
and standards
Management
and Strategy
2009
tails
procedures
Employee
Policy and
Targets
2010
Activity
Principles
The figures 2011
relating to presented on this
scorecard
58.8% 65.8% 59.8% this scorec express and logisti reflect the
74.0% ard in ord cs core mail
81.9% 65.6% 60.5% 71.7% accurate er that we services, while inc and parcel
yea luded in
2011 47.1% 79.0%
66.2% 72.7% 51.8% 60.0% 54.3% Austria Pos r-on-year compar can focus our ana the overall operations of our
56.9% t, Poste Ital ison lysis EM par
45.4% 74.1% 81.4% 58.9%
52.5% 50.5% iane and s, the data presen on the core compar MS programme, has ticipants. Informa
50.5% the South ted tion
2010 64.8% 68.8% African Pos relates to the origable mail and par not been
78.6% 54.3% 52.9%
t) which cel operat included on
40.5% 69.0% 49.7% 42.9% have join inal set of EMMS ion
2009
50.2% 60.5% 58.7% 41.9% ed since
2009. participan s. To facilitate
63.5% 71.4% 50.9% ts (excludin
EMMS in other publications
2008 30.5% ENVIRON
MEN g
TAL MEA
Date: 2012 V2 SUREMENT
AND MO
NITORING
(EMMS) SYSTEM
MENT AND MONITORING SYSTEM (EMMS)
ENVIRONMENTAL MEASURE
Date: 2012
V2
As the EMMS programme continues to expand its global reach and
demonstrate impressive group-wide management proficiency increases recognised. Apart from being published in over a dozen sustainability
and emissions reduction achievements, its success is increasingly being reports of our participants, the EMMS has also been acknowledged
by global media and external publications, an indication that the
programme is having an influential effect across the sector.
We anticipate further recognition of the programme and attention
focused on the achievements of our EMMS members as we continue to
progress towards our targets for 2020.
International Post Corporation Postal Sector Sustainability Report
11Carbon management
Carbon management proficiency
In 2011, EMMS participants achieved an average score of 70%, evidence In 2011 an additional company reported their endorsement of the
that our target is both realistic and attainable. Over this three year period, United Nations Global Compact – Caring for Climate voluntary action
the annual current rate of improvement in management proficiency is over platform, bringing the total sector engagement to over 66% and an
4 percentage points per year, well exceeding the required rate to achieve increase of over 38% since the start of the programme (2008: 29%). In
our goal in 2020. addition, the number of companies submitting their information to the
Table 1: Key Carbon Management Proficiency results 2008-2011
CMP score 2008 Required
CMP score 2009 CMP score 2010 CMP score 2011 Goal for 2020 Target status
(baseline) improvement
56% 61% 65% 70% > 90% ~ 3% per year On target
We believe that these improved results indicate an increasing appreciation Carbon Disclosure Project has risen by over 14%. As EMMS participants
of energy and carbon emissions as a strategic priority in business incorporate the guidance and commitments of this initiative into their
management, and that EMMS participants are continually working to operational and strategic approaches, we anticipate further improvements
update and improve their management systems, policies and procedures in both carbon management proficiency and emissions reductions.
to accommodate these priorities. Over 85% of participants reported
performance improvements. We believe that continued improvements at We have observed an overall increase in the participants demonstrating
this rate (approximately 5% per annum) will enable us to reach our 2020 their environmental commitments with over 86% of participants publicly
goal well ahead of schedule. Our projections indicate that we will have stating their greenhouse gas reduction targets, an increase of 29%
reached our target by 2017, and possibly even earlier. from the start of the EMMS programme. Six participants have made
commitments to become carbon-neutral in the future, or by a specified
Consistent with previous years, in 2011 IPC companies again performed date and two thirds also have their own independently developed targets
best on issues relating to policy and procedures (82%), management and in place that are at least in line with the sector 20% by 2020 reduction
strategy (79%), target setting (74%) and measurement and verification goal (known as the ‘20-2020 target’).
(72%). The use of systematic environmental management approaches
has been steadily increasing, with 76% of participants now operating a Responsibility for climate change, carbon management and emissions
developed, documented and communicated environmental management is clearly defined for the majority of participating posts, with many
system. Furthermore, 62% of participants are either seeking or have also having individual energy and carbon metrics in senior manager
implemented internationally recognised certification for these systems performance appraisals and performance-related pay schemes.
such as EMAS or ISO 14001.
International Post Corporation Postal Sector Sustainability Report
12Carbon management
It is encouraging to see that the management of environmental impacts Figure 2: Range and average carbon management proficiency scores by section
across the value chain has been steadily increasing year on year. In
100%
2008, EMMS participants typically rated their value chain management
programmes as ‘under development’. In 2009, as we began to see
the benefits of this development, 85% had developed at least general 90%
environmental requirements for their suppliers. In 2011, 24% of
participants have gone even further to impose specific energy and carbon
requirements. These are being progressively rolled out for all primary 80%
82%
81%
79%
contracts and sub-contractors in many cases. In addition, over 95% of
79%
participants are now actively communicating with customers or suppliers
74%
74%
73%
70%
72%
71%
on carbon management issues. However, there remain opportunities for
70%
69%
69%
value chain best practices to be extended across the sector, in particular
66%
66%
65%
65%
65%
with regard to the methods of assessment used, such as second or third
63%
60%
61%
60%
60%
party auditing.
60%
59%
60%
59%
58%
57%
56%
54%
54%
53%
52%
50%
52%
51%
49%
50%
50%
49%
47%
45%
40%
42%
42%
41%
30%
20% 31%
10%
0%
1. 2. 3. 4. 5. 6. 7. 8. 9. 10.
Overall Principles & Management Policy & Employee Activity Measurement Targets Performance Disclosure & Value Chain
Standards & Strategy Procedures Engagement & Verification Reporting Management
2008 2009 2010 2011
Minimum and maximum ranges in 2008 and 2011
International Post Corporation Postal Sector Sustainability Report
13Carbon management
Figure 3: Projected carbon management proficiency scores through 2020 The ten focus areas of the carbon management proficiency assessment
include questions carefully designed to evaluate specific aspects of
100% each participant's approach to carbon management. Important group
Projected attainment
in 2017 (vs. 2020) developments since 2008 include:
90% IPC EMMS goal of 90%
80% • t he UN Global Compact – Caring for Climate voluntary action
70% Required rate of increase programme has gained support from two thirds of EMMS
70% 65% to achieve 2020 goal
participants;
61%
60%
56% • increased information submissions to the Carbon Disclosure Project
(CDP), an initiative designed to encourage full public disclosure of
50% carbon performance data;
40%
• a significant increase in the number of participants that carry out
assessments of the risks as well as the opportunities related to
30% carbon management and climate change;
• a larger proportion of participants that incorporate carbon
20%
management indicators, objectives and targets into management
10% performance reviews;
• a substantial increase in the number of companies transporting post
0%
by vehicles using alternative fuels;
2008 2009 2010 2011 2012 2013 2014 2015 2016 2017 2018 2019 2020
• a notable increase rise in the number of companies referencing their
IPC required rate IPC current rate
sustainability reporting against the Global Reporting Initiative;
•g rowing popularity of the use of formalised supplier assessment
methods including self, second and third party auditing, and the
setting of minimum performance criteria.
International Post Corporation Postal Sector Sustainability Report
14Carbon management
Areas for improvement
The three carbon management proficiency areas which registered the Such initiatives require detailed cost-benefit analysis as well as the
lowest scores were; principles and standards (47%); performance (59%) availability of appropriate national infrastructures, such as the suitability
and value chain management (60%). This trend has remained consistent of rail networks and timetables. In addition, EMMS participants across
with previous years, however all three areas have shown year-on-year the globe have regional and seasonal climate differences to take into
improvements since 2008. account. To overcome these challenges can often require the development
of technologies with specific minimal technical standards. Several EMMS
We will be encouraging our participants to improve their scores in the participants are also exploring and testing potential alternative energy
principles and standards section, for example by promoting engagement sources including solar power, geothermal and wind in both buildings and
with relevant international organisations and initiatives, such as the UN vehicles.
Global Compact – Caring for Climate, Carbon Disclosure Project and
certification to internationally recognised EMAS or ISO 14001 standards.
Many companies have already implemented ‘quick-win’ emission
reductions initiatives, such as switching to green electricity, increasing fuel
efficiency and vehicle route optimization. To achieve further reductions,
leading participants will be required to make more significant and longer
term investments in infrastructure developments, for example through
the construction of LEED (Leadership in Energy and Environmental Design)
or BREEAM (Building Research Establishment Environmental Assessment
Method) buildings, and further increasing the use of alternative fuel
vehicle fleets. Through engagement with our EMMS participants, we
have learned that the development of alternative vehicle delivery fleets
is ongoing. For example, piloting activities and negotiations with vehicle
manufacturers to develop bespoke delivery vehicles are still being carried
out by several participants. This indicates that the update of alternative
vehicles is likely to increase even further in future years.
International Post Corporation Postal Sector Sustainability Report
15Carbon management
Carbon emissions
In the carbon performance section of the EMMS, we assess the In 2011, the Scope 1 and Scope 2 carbon emissions from EMMS
quantitative elements including carbon emissions and energy use across participant ‘mail and parcel’ activities amounted to 7,173,000 tonnes
the six categories of mail, parcels, express (national and international), (2010: 7,434,000). Please see Figure 8 (p18) for a detailed breakdown
logistics, retail outlets and financial services. The results presented in this across the entire EMMS group. This year’s decrease of 261,000 tonnes
report focus on the core ‘mail and parcels’ activities with assessments is less pronounced than the 329,000 tonnes reported last year and
carried out using 16 carbon performance indicators. Emissions reductions less still than the decrease of 597,000 tonnes reported between 2008
have been tracked according to international greenhouse gas accounting and 2009. This trend of decreasing reductions may be driven in part
standards, in particular the World Resources Institute Greenhouse Gas because the ‘low hanging fruit’ in carbon reductions have already been
Protocol. In line with this protocol, we will refer to direct and indirect achieved. Nevertheless, the decrease is still nearly double the required
emissions using the following Scope 1, Scope 2 and Scope 3 terminology: annual reduction of 140,000 tonnes and we remain assured that EMMS
participants are on target to reach the group target of a 20% reduction by
Scope 1: All direct GHG emissions, including those from buildings and 2020.
transport owned by the company (see Figure 6, p18);
In order to maintain the comparability of the figures, the figures presented
Scope 2: Indirect GHG emissions, from consumption of purchased above exclude the increased scope and emissions coverage associated
electricity, heat or steam (see Figure 7, p18); with three new participants since 2009; Austria Post, Poste Italiane and
the South African Post Office. If we increase the coverage to include the
Scope 3: Other indirect emissions, including transport-related activities by emissions from these operators, the result is a sector output of 7,645,000
vehicles not owned or controlled by the reporting entity, business travel tonnes. This represents an overall decrease of 155,000 tonnes from last
and employee commuting, outsourced activities, waste disposal, etc. year’s figures (2010: 7,800,000 tonnes).
IPC provides each EMMS participant with a detailed summary of its carbon
performance alongside its carbon emissions data. The data provides
insights into carbon efficiency across various aspects and categories of
their business and is designed to enable continuous improvement through
focused emission reduction initiatives. The figures disclosed herein relate
to the ‘mail and parcels’ categories, excluding peripheral express and
logistics services.
Table 2: Annual carbon emissions
Performance 2008 Required
Performance 2009 Performance 2010 Performance Goal for 2020 Target status
(baseline) improvement
8,360,000 tonnes 7,763,000 tonnes 7,434,000 tonnes 7,173,000 tonnes 6,688,000 tonnes ~2% reduction per year On target
(- 7.1%) (- 11.1%) (-14.2%) (- 20%)
International Post Corporation Postal Sector Sustainability Report
16Carbon management
Figure 4: Mail & parcel Scope 1 & 2 carbon emissions (excluding new participants)
9,000,000
8,360,000
8,500,000
7,763,000
8,000,000
7,434,000
7,500,000
7,000,000
7,173,000
CO2
6,500,000
2020 Target
6,000,000
(6,688,000 tonnes)
5,500,000
5,000,000
2008 2009 2010 2011
Figure 5: Projected Scope 1 & 2 mail and parcel carbon emissions reductions through 2020 (excluding new participants)
9,000,000 8,360,000
8,000,000
7,763,000
CO2
6,688,000
7,000,000 7,434,000
7,173,000 IPC EMMS 2020 20% reduction goal IPC EMMS 2020:
6,000,000
5,000,000
-20%
4,000,000
4,521,000
3,000,000
2,000,000
1,000,000
0
2008 2009 2010 2011 2012 2013 2014 2015 2016 2017 2018 2019 2020
IPC required rate IPC current rate
International Post Corporation Postal Sector Sustainability Report
17Carbon management
Emissions sources
In 2011, total Scope 1 impacts amounted to 3,553,000 tonnes, Carbon emissions associated with purchased electricity consumption
representing a notable 13.6% decrease from 2008 levels (4,112,000 in buildings, including sorting centres, post offices and administrative
tonnes). However, when compared with 2010, Scope 1 impacts have operations, represents the largest Scope 2 source. This year we are
remained overall stable with a very slight increase from 3,536,000 pleased to report reduced emissions of 3,470,000 tonnes, a reduction of
tonnes. The most significant contributory emissions source was 11% from our 2010 figure of 3,898,000 tonnes. Since the start of the
owned or leased road transportation, with over three quarters of programme in 2008, IPC participants have achieved an overall reduction
the total group Scope 1 emissions (see fig 6). Overall emissions from of 18.3% in emissions from purchased electricity, indicative of the
transportation in 2011 were 2,700,000 tonnes, a small increase of effectiveness of carbon mitigation measures and increased use of green
2.8% from 2010 levels (2,676,000 tonnes). Emissions produced from electricity.
buildings (as heating) exhibited a reduction of 4.0% from 2010 to
826,000 tonnes (2010: 860,000 tonnes).
Activity indicators
Figure 6: Scope 1 Figure 7: Scope 2 Figure 8: Combined
emission sources emission sources Scope 1 & 2 emissions sources Emissions per item
In 2011, the total CO2 emitted in grams per item was 25 (2010: 24
0.9% 3.6% 1.8% 0.5% grams). There remain challenges in separating mail and parcels in our
accounting exercises as several of the postal providers were unable
11.5%
23.3%
to distinguish emissions from mail versus parcel deliveries due to the
significant shared infrastructures and sorting facilities. We believe that
this slightly higher grams per item figure for 2011 is due in part to a
48.5%
continuing trend of declining mail volumes throughout the sector. Total
group postal volumes between 2010 and 2011 have reduced from 297
37.7%
75.8% to 283 billion items of mail. This makes sustained emissions reductions
96.4% per item a significant challenge. In addition, our EMMS participants
operate under national regulations which often include a Universal
Service Obligation (USO) to make daily deliveries to every household by
P roduced from buildings: As heating P roduced from buildings: Scope 1 Road transport law. Such regulations may reduce the flexibility of participants to adapt
Road transport As electricity purchased Scope 1 Produced from buildings: As
Others (e.g. Stationary purpose Produced from buildings: heating the efficiency of their operations.
combustion) As heating (inc. district heating and Scope 2 Produced from buildings:
steam) As electricity purchased
Scope 2 Produced from buildings:
As heating (inc. district heating and
steam)
Others (e.g. Stationary purpose
combustion)
International Post Corporation Postal Sector Sustainability Report
18Carbon management
Renewable energy Table 3: Figure 9: Alternative
EMMS participants are required to provide energy use data for levels of vehicle / alternative fuel
renewable electricity purchased (‘green’ electricity). There were large capable vehicle types
variations in the percentage of renewable electricity used in buildings
among operators, with 48% of EMMS participants purchasing some Alternative vehicle type Number reported 7.6%
form of green electricity in 2011 (45% in 2010). IPC also collects E85 (Ethanol fuel blend) 39,754 8.6%
energy use data for a range of alternative energy sources, including Self-propelled (e.g. bicycles) 37,214
43.3%
geothermal, biomass, solar and wind power. If we expand our coverage Electric 7,017
to include these sources, in 2011 67% of EMMS participants reported Others - inc. Hybrid, Compressed Natural Gas
7,891
on the use of some form of renewable energy, a substantial increase (CNG) & Liquid Propane Gas (LPG)
from the 41% in 2010. Total alternative vehicles 91,876 40.5%
The total percentage of green electricity as a proportion of total electricity In 2011, alternative vehicles/alternative fuel capable vehicles made up
consumption within the group was 11%, an increase of 4% from over 17% of the total reported vehicles figure, representing an impressive E85 (Ethanol fuel blend)
2010. When combined with green electricity, renewable energy sources increase from the 10% recorded for 2010. The largest single category Self-propelled (e.g. bicycles)
accounted for 6.3% of all energy used by EMMS participants in buildings, was E85 capable vehicles (an ethanol fuel blend). There has also been a Electric
Other - including hybrid, Compressed
representing an increase from 2010 (4%). Note, these calculations relate substantial increase in reporting relating to self-propelled vehicles, e.g. Natural Gas (CNG) & Liquid Propane
to acknowledged additional emissions reduction activities only and do bicycles. IPC will continue to measure and encourage further uptake of Gas (LPG)
not include standard green energy currently included in the grids of host alternative vehicles throughout the EMMS group.
countries due to hydropower or other lower carbon sources.
Table 4:
Alternative vehicles
This year we required our EMMS participants to provide a greater degree
of disclosure and categorisation on their alternative vehicles/alternative 2009 2010 2011
fuel capable vehicles. Participants were asked to provide numbers of Total vehicles 585,700 568,400 527,200
alternative vehicles across ten categories. This will allow us to deduce
Total alternative vehicles 57,900 57,700 91,900
detailed group trends in alternative vehicle usage for future years.
% alternative vehicles in EMMS
Alternative vehicle types reported across the EMMS group are provided in 10% 10% 17%
group
the following table.
Note: Reported figures differ slightly from those reported last year due to restated data
provided by one participant.
International Post Corporation Postal Sector Sustainability Report
19Carbon management
Table 5: Carbon performance data in tonnes of CO2 (coverage is 100% unless indicated in brackets)
Original participants Extended Group
Indicator
2008 2009 2010 2011 2009 2010 2011
Scope 1: Transport (vehicles, aviation, rail) ♦1 2,948,000 2,857,000 2,676,000 2,700,000 3,008,000 2,828,000 2,858,000
Scope 1: Heating (gas, heating, fuel, oil, steam) ♦ 1,164,000 979,000 860,000 826,000 1,057,000 920,000 891,000
Scope 2: Electricity (including electric vehicles) ♦ 4,248,000 3,927,000 3,898,000 3,470,000 4,062,000 4,052,000 3,713,000
TOTAL2 8,360,000 7,763,000 7,434,000 7,173,000 8,143,000 7,800,000 7,645,000
Total CO2 in tonnes per 1000 euro turnover3 ♦ 0.067 0.064 0.063 0.058 0.058 0.056 0.052
Total CO2 in grams per item – mail and parcels ♦ 29 (84%) 25 24 25 25 25 26
Percent of renewable electricity used in buildings ♦ 13% (93%) 9% 7% 11% 11% 10% 14%
Percent of renewable energy used in buildings ♦ 8% (79%) 7% 4% 6% 9% 6% 8%
Percent of alternative vehicles in fleet ♦4 10% 10% 10% 17% (95%) 11% 10% 16% (96%)
Notes: 1The rhombus symbol (♦) denotes data on which PwC has provided limited assurance. 2Due to differences in inter-departmental accounting procedures, the stated figures may not sum to equal the total. 3Figures per
€1,000 turnover were calculated using average annual currency conversion statistics sourced from the Organisation for Economic Co-operation and Development (OECD). 4 Reported figures in 2009 and 2010 of the Original
participants differ slightly from those reported last year due to restated data provided by one participant.
Scope 3 emissions sources • Outsourced or sub-contracted road transport
• Outsourced or sub-contracted air transport
Scope 3 includes indirect emissions associated with the wider supply chain • Employee commuting
and distribution networks. Since the boundaries of Scope 3 emissions are • Business travel
potentially very broad, IPC has produced a guidance document covering
specific reporting procedures which is communicated to all participants, We believe that the collection of Scope 3 inventories will be very useful
providing a consistent set of parameters for industry-wide reporting of for our EMMS participants to better understand the upstream and
Scope 3 emissions. The guidance builds on the framework set out in downstream greenhouse gas implications of their corporate activities. The
the GHG Protocol Corporate Standard. Our current focus is primarily on above sources are examined in our performance monitoring system as
transport-related impacts and in 2011, based on participant feedback and part of our commitment to continuous improvement and in order to build
analysis of past years data; we narrowed the scope of our data collection a more comprehensive and accurate account of greenhouse gas emissions
to the following four core categories. These categories make up over 95% across the EMMS group. Please note that although employee commuting
of total Scope 3 emissions: impacts are significant, several posts are currently unable to collect
International Post Corporation Postal Sector Sustainability Report
20Carbon management
data on this source for privacy/legal reasons. Therefore, in some cases • The average operational coverage level of outsourced or sub-contracted road
national averages have been used. In these cases, mitigation activities transport figures was 47%;
focused on employee commuting will not result in measurable decreases • All respondents reported data on this emissions source.
in emissions from this source.
Outsourced or sub-contracted air transport
In a significant improvement from last year, 20 of the participating • 66% of respondents that reported on this source estimated their figures, based
companies submitted Scope 3 emissions data in their EMMS calculator, on tonne/km or distance data;
representing group coverage of 95% compared with an 82% response • The remaining participants made actual measurements, based either on
rate in 2009 and 2010. The sector has exhibited an overall increase in the actual fuel consumption or the monetary value spend on fuel by sub-
Scope 3 emissions of approximately 1,874,000 tonnes, an increase of contractors;
22% from 2010 levels. The increase is not cause for concern however, • The average operational coverage level of outsourced or sub-contracted air
as it is driven by increasing disclosure of sources from several of our transport figures was 93%;
EMMS participants who have expanded their Scope 3 reporting • Three respondents did not report on this emissions source.
boundaries. The largest Scope 3 impact emerged from outsourced or
sub-contracted road transport with 4,330,000 tonnes, representing Employee commuting
42% of the total group impact. A further 30% is associated with sub- • 55% of respondents that reported on this source estimated their figures, based
contracted air transport. The least significant reported Scope 3 impact on national statistics on average commuting;
was from business travel, with only 1% of the group total (see Figure • The remaining 45% estimated their employee commuting figures based on
10, p22). other factors, such as data collected through internal surveys;
• Four respondents made use of systematic planning and monitoring systems to
Scope 3 survey estimate their employee commuting figures, for example fuel cards and barcode
As part of the 2012 EMMS, we encouraged all EMMS participants scanning;
to complete a survey on the topic of their Scope 3 reporting policies • The average operational coverage level of employee commuting data was 99%;
and approaches, in order to gain deeper insights into what remains a • Six respondents did not report data on this emissions source.
developing area of EMMS reporting. For the 2011 reporting year we had
15 respondents to the survey representing 71% of participants. Business travel
• Business travel emissions were measured, based on an overview of actual flights
Outsourced or sub-contracted road transport by 60% of respondents;
• A third of respondents estimated their outsourced or sub-contracted • All other respondents made an estimation, for example based on costs spent on
road transport figures, based on the total number of kilometres driven flights and distances travelled;
and the average fuel consumption (per type of vehicle) per km; • Two respondents did not report data on this emissions source.
• This source was measured, based on the total fuel consumption by
subcontractors, by 13% of respondents;
• The remaining participants used other forms of estimation, e.g. based
on total subcontractor spend, or made use of a combination of both
estimation and measurement approaches;
International Post Corporation Postal Sector Sustainability Report
21Carbon management
Table 6: Scope 3 carbon emissions in tonnes of CO2 (coverage is 100% unless indicated in brackets)
Original participants Extended group
Indicator
2009 1
2010 1
2011 ♦ 2
2009 2010 2011 ♦
CO2 emissions in tonnes
Outsourced or sub-contracted road transport 3,730,000 (89%) 3,590,000 (89%) 4,330,000 (98%) 3,748,000 (78%) 3,639,000 (78%) 4,515,000 (99%)
Outsourced or sub-contracted air transport 2,704,000 (86%) 2,736,000 (86%) 3,069,000 (97%) 2,704,000 (74%) 2,740,000 (74%) 3,069,000 (82%)
Employee commuting 3,045,000 (58%) 2,008,000 (58%) 2,812,000 (78%) 3,045,000 (50%) 2,008,000 (50%) 2,812,000 (66%)
Business travel3 392,000 (92%) 84,100 (92%) 81,000 392,000 (80%) 84,100 (80%) 92,000 (98%)
TOTAL 9,871,000 8,418,100 10,292,000 9,889,000 8,471,100 10,488,000
Notes: 1Total figures for 2009 and 2010 have been restated from those previously reported, in line with our narrowed focus on the four above categories. 2The rhombus symbol (♦) denotes data on which PwC has
provided limited assurance. 3 The large decrease in the business travel figure for 2009 was due to the revision of an estimated figure by one participant.
Figure 10: Scope 3 carbon
emissions (significant impacts)
1%
27%
42%
30%
utsourced or sub-contracted road
O
transport
Outsourced or sub-contracted air
transport
Employee commuting
Business travel
International Post Corporation Postal Sector Sustainability Report
22Posts’ Best Practice Cases
Broadening the scope
In this report we have emphasised Scope 3 reporting. Our EMMS
participants have already undertaken considerable efforts together
with their subcontractors, suppliers and other partners to improve the
sustainability of their entire value chains. These best-practice cases
illustrate how transport can be optimised in an environmentally
friendly way, how staff commuting can be managed in a more
sustainable way and how collaboration can lead to improved
efficiencies.
International Post Corporation Postal Sector Sustainability Report
23You can also read