Technical note: Emission factors, chemical composition, and morphology of particles emitted from Euro 5 diesel and gasoline light-duty vehicles ...
←
→
Page content transcription
If your browser does not render page correctly, please read the page content below
Atmos. Chem. Phys., 21, 4779–4796, 2021
https://doi.org/10.5194/acp-21-4779-2021
© Author(s) 2021. This work is distributed under
the Creative Commons Attribution 4.0 License.

Technical note: Emission factors, chemical composition, and
morphology of particles emitted from Euro 5 diesel and
gasoline light-duty vehicles during transient cycles
Evangelia Kostenidou1 , Alvaro Martinez-Valiente2 , Badr R’Mili1 , Baptiste Marques1 , Brice Temime-Roussel1 ,
Amandine Durand1 , Michel André3 , Yao Liu3 , Cédric Louis3 , Boris Vansevenant3 , Daniel Ferry4 , Carine Laffon4 ,
Philippe Parent4 , and Barbara D’Anna1
1 Aix-Marseille Univ, CNRS, LCE, Marseille, France
2 IRCELYON,    UMR 5256 CNRS, Université de Lyon, Villeurbanne, France
3 AME-EASE, Univ Gustave Eiffel, IFSTTAR, Univ Lyon, Lyon, France
4 Aix-Marseille Université, CNRS, CINaM, Marseille, France

Correspondence: Evangelia Kostenidou (vkostenidou@gmail.com) and Barbara D’Anna (barbara.danna@univ-amu.fr)

Received: 11 August 2020 – Discussion started: 4 September 2020
Revised: 31 January 2021 – Accepted: 1 February 2021 – Published: 26 March 2021

Abstract. Changes in engine technologies and after-                  During the passive regeneration of the catalysed diesel par-
treatment devices can profoundly alter the chemical compo-        ticulate filter (CDPF) vehicle, we measured particles of di-
sition of the emitted pollutants. To investigate these effects,   ameter around 15 nm mainly composed of ammonium bisul-
we characterized the emitted particles’ chemical composi-         fate. Transmission electron microscopy (TEM) images re-
tion of three diesel and four gasoline Euro 5 light-duty vehi-    vealed the presence of ubiquitous metal inclusions in soot
cles tested at a chassis dynamometer facility. The dominant       particles emitted by the diesel vehicle equipped with a fuel-
emitted species was black carbon (BC) with emission factors       borne-catalyst diesel particulate filter (FBC-DPF). X-ray
(EFs) varying from 0.2 to 7.1 mg km−1 for direct-injection        photoelectron spectroscopy (XPS) analysis of the particles
gasoline (GDI) vehicles, from 0.02 to 0.14 mg km−1 for            emitted by the PFI vehicle showed the presence of metal-
port fuel injection (PFI) vehicles, and 0.003 to 0.9 mg km−1      lic elements and a disordered soot surface with defects that
for diesel vehicles. The organic matter (OM) EFs varied           could have consequences on both chemical reactivity and
from 5 to 103 µg km−1 for GDI gasoline vehicles, from             particle toxicity.
1 to 8 µg km−1 for PFI vehicles, and between 0.15 and                Our findings show that different after-treatment technolo-
65 µg km−1 for the diesel vehicles. The first minutes of cold-    gies have an important effect on the emitted particles’ levels
start cycles contributed the largest PM fraction including BC,    and their chemical composition. In addition, this work high-
OM, and polycyclic aromatic hydrocarbons (PAHs).                  lights the importance of particle filter devices’ condition and
   Using a high-resolution time-of-flight mass spectrometer       performance.
(HR-ToF-AMS), we identified more than 40 PAHs in both
diesel and gasoline exhaust particles including methylated,
nitro, oxygenated, and amino PAHs. Particle-bound PAHs
were 4 times higher for GDI than for PFI vehicles. For            1   Introduction
two of the three diesel vehicles the PAH emissions were
below the detection limit, but for one, which presented an        On-road diesel and gasoline vehicles are an important source
after-treatment device failure, the average PAHs EF was           of urban air pollution, releasing fine particulate matter (PM1 )
2.04 µg km−1 , similar to the GDI vehicle’s values.               and gaseous pollutants into the atmosphere (Dallmann and
                                                                  Harley, 2010; Borbon et al., 2013; Platt et al., 2014; Argy-
                                                                  ropoulos et al., 2016; Hoffman et al., 2016; Gentner et al.,

Published by Copernicus Publications on behalf of the European Geosciences Union.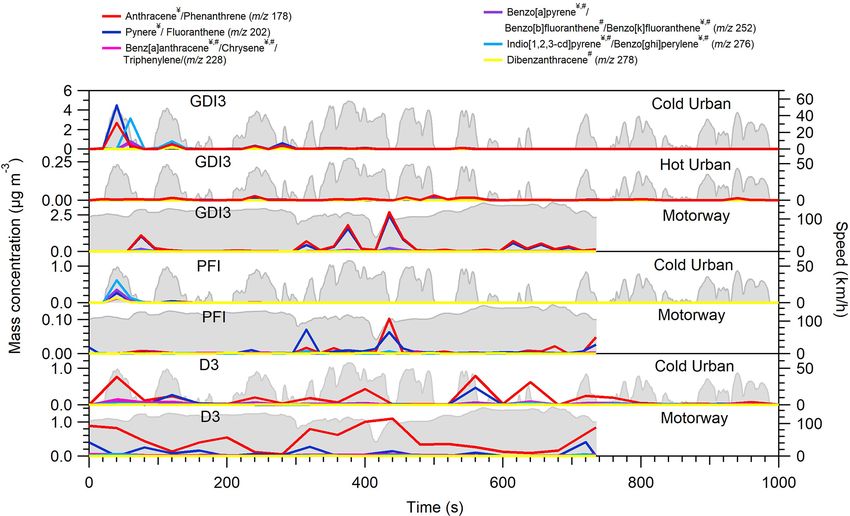
4780                                                E. Kostenidou et al.: Emissions from Euro 5 diesel and gasoline vehicles

2017). Light-duty vehicle pollutants have been associated          tion catalysts (DOCs) and diesel particulate filters (DPFs)
with adverse effects on human health, inducing cardiovascu-        (Tzamkiozis et al., 2010; Gordon et al., 2013; Platt et al.,
lar, respiratory, and cognitive diseases (Hime et al., 2018, and   2017). On the contrary, NOx emissions from diesel still
references therein). Modern vehicles also produce CO2 and          highly exceed those from gasoline vehicles (Wang et al.,
BC, which impact the climate (Lelieveld et al., 2019). In re-      2016; di Rattalma and Perotti, 2017). The market share of
cent years vehicle emissions have received a great deal of at-     gasoline vehicles equipped with GDI systems is steadily in-
tention. Different approaches have been used for their quan-       creasing due to a better fuel efficiency and consequently
tification, including tunnel studies (Grieshop et al., 2006;       lower CO2 emissions than in conventional port fuel injection
Lawrence et al., 2013; Dallmann et al., 2014; Smit et al.,         (PFI) engines (Alkidas, 2007; Myung et al., 2012; Liang et
2017), remote sensing or roadside measurements (Jimenez            al., 2013). In GDI engines, the fuel is injected at higher pres-
et al., 2000; Peitzmeier et al., 2017; Ropkins et al., 2017),      sures and it is mixed less uniformly with the incoming air. As
on-road (chase) measurements (Canagaratna et al., 2004;            a consequence of this inhomogeneous combustion, these ve-
Morawska et al., 2007; Hudda et al., 2013; Karjalainen et          hicles contribute to considerably higher emissions of BC and
al., 2014), on-board measurements (Huo et al., 2012; Chikhi        organic particles with diameters below 100 nm, compared to
et al., 2014), and chassis dynamometer facilities (e.g., An-       those equipped with the PFI system (Karjalainen et al., 2014;
dersson et al., 2014; Collier et al., 2015; Karjalainen et al.,    Chan et al., 2014; Short et al., 2015; Zhu et al., 2016; Zim-
2014; Saliba et al., 2017; Jaworski et al., 2018; R’Mili et al.,   merman et al., 2016; Platt et al., 2017; Saliba et al., 2017; Du
2018).                                                             et al., 2018). Gasoline vehicles also emit NH3 generated by
    Improved information about the chemical composition of         three-way catalysts (TWCs) (e.g., Heeb et al., 2006; Suarez-
PM is essential to understand source contributions, imple-         Bertoa et al., 2014), which might highly enhance new parti-
ment mitigation measures, and assess health protection pro-        cle formation in the environment (e.g., Korhonen et al., 1999;
grammes. PM vehicle emissions are mainly composed of BC            Ortega et al., 2008; Pikridas et al., 2012; Kürten, 2019).
and organic aerosol (OA) due to the incomplete combustion             Despite many studies investigating vehicle emissions in
of fuel and release of lubricating oil droplets. Less abundant     the past, non-regulated pollutants are still not well identi-
components of vehicle exhausts include sulfate and metal           fied and quantified for recent vehicle technologies. Euro-
traces (Maricq, 2007; Cheung et al., 2010). Sulfur and trace       pean databases (such as COPERT 5) are missing information
elements such as Fe, Zn, P, Mg, and Ca are commonly used           on PM chemical composition, preventing a full assessment
as additives in lubricant oils (Maricq, 2007; Rönkkö et al.,       of vehicle emission effects on urban air quality and health.
2014; Liati et al., 2018). The above elements have been cor-       This work provides a detailed description and comparison of
related to the oxidative potential, indicating the toxic nature    PM emissions in terms of chemical composition and emis-
of these emissions (Cheung et al., 2010).                          sion factors from three diesel and four gasoline (both GDI
    PAHs have been measured in both modern diesel and gaso-        and PFI) commercial Euro 5 light-duty vehicles tested at a
line engine exhaust (Zielinska et al., 2004; Cheung et al.,        roll-bench chassis dynamometer facility. The chemical spe-
2010; Alkourdi et al., 2013; Huang et al., 2013; Herring et        ciation of particulate matter included BC, organics, sulfate,
al., 2015; Muñoz et al., 2018) and have been recognized as         ammonium, nitrate, and PAHs and was accomplished us-
carcinogenic for humans (IARC, 2010). Exposure to PAHs             ing real-time and high-resolution instrumentation, providing
is associated with excess risk of lung cancer as well as other     real-time emission profiles and information on the impact of
adverse health effects including bronchitis, asthma, heart dis-    after-treatment devices along the cycle. Particle morphology,
ease, and reproductive toxicity (IARC, 2012, 2013, 2014).          surface structure, and elemental composition were further-
More recently, oxygenated and nitro-polycyclic aromatic hy-        more investigated using offline analysis.
drocarbons (OPAHs and NPAHs) have received increasing
attention due to their cytotoxicity, immunotoxicity, carcino-
genicity, and mutagenicity (Durant et al., 1996; IARC, 2012,       2     Experimental
2013, 2014). Gasoline and diesel PM, and more specifically
the ultrafine particle fraction (with diameter below 100 nm),      2.1    Vehicles and infrastructure
has been associated with an increased toxicity due to their
higher surface area and greater ability to adsorb organic          Four gasoline and three diesel Euro 5 light-duty vehicles
chemicals and metals (Mills et al., 2011; Cassee et al., 2013;     were investigated; their names and specifications are listed
Chen et al., 2016; Tyler et al., 2016).                            in Table 1. The passenger vehicles were either rented from a
    Since 2012 the European market share of diesel light-duty      local car rental company or they were privately owned, and
vehicles has decreased to 35.9 % of new vehicles’ sales in         their mileage ranged from 9500 to 103 000 km. Three GDI
2018, while the demand for gasoline vehicles increased to          and one PFI vehicle, all equipped with three-way-catalysts
56.7 % (ACEA, 2020). This trend continues regardless of            (TWCs), and three diesel vehicles equipped with diesel oxi-
the efficient PM (and BC) reduction achieved by diesel ve-         dation catalysts (DOCs) and diesel particulate filters (DPFs)
hicles, due to the successful combination of diesel oxida-         were tested. Two diesel vehicles had a catalysed DPF (CDPF)

Atmos. Chem. Phys., 21, 4779–4796, 2021                                              https://doi.org/10.5194/acp-21-4779-2021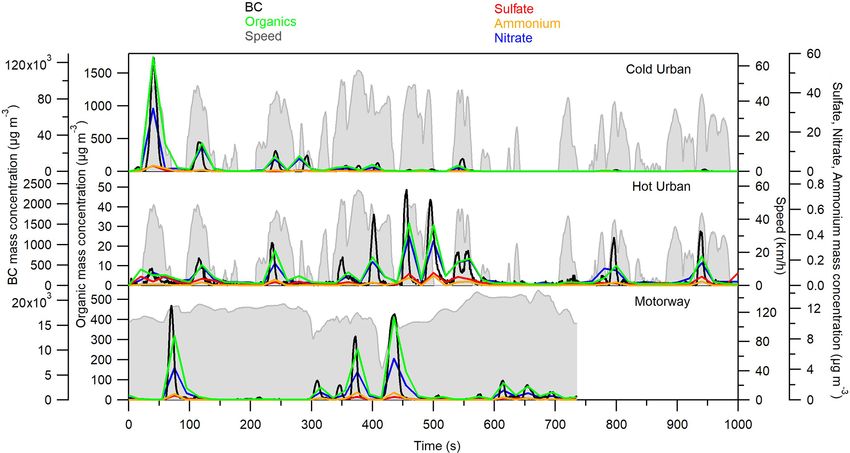
E. Kostenidou et al.: Emissions from Euro 5 diesel and gasoline vehicles                                                   4781

and one had a fuel-borne catalyst (FBC-DPF). Commercial          AMS) (Drewnick et al., 2005) was deployed for the size-
fuel was purchased from the same gas station to minimize         resolved chemical composition analysis of the non-refractory
the influence of fuel composition on emissions. Elemental        species (e.g., organics, sulfate, ammonium, nitrate). The va-
composition of fuels and lubricant oils was analysed using       porizer temperature was set at 600–650 ◦ C, and the tungsten
inductively coupled plasma mass spectrometry (ICP-MS).           filament for electron ionization was run at an accelerating
   The experiments were carried out at the roll-bench chassis    voltage of 70 eV. The sampling time resolution was set be-
dynamometer owned by the Environment, Planning, Safety           tween 20 and 40 s in V-mode.
and Eco-design Laboratory (EASE) of the French Institute
of Science and Technology for Transport, Development and         2.2.2   Aethalometer and MAAP
Networks (IFSTTAR). Three types of dilution systems were
used: (a) a constant volume sampler (CVS) and two VKL 10         An Aethalometer AE 33-7 (Magee Scientific) or a multi-
Palas for vehicles D1 and GDI1, (b) a fine-particle sampler      angle absorption photometer (MAAP 5012, Thermo Fisher
(FPS 4000, Dekati Ltd) with two dilution stages for vehi-        Scientific) was used for black carbon measurements at wave-
cles D2 and GDI2, and (c) an ejector dilution of one stage       lengths of 670 and 880 nm respectively. The time resolution
(with hot air) for vehicles D3, PFI, and GDI3. The dilution      for the Aethalometer was between 1 and 10 s, while for the
ratios for each system were calculated based on CO2 con-         MAAP is was between 2 and 5 min. The MAAP data, when
centrations and are provided in Table 1. Three different di-     characterized by high BC mass concentrations, were cor-
lution systems were used because the data presented in this      rected using the method proposed by Hyvärinen et al. (2013).
study correspond to four different measurement campaigns
                                                                 2.2.3   Offline analysis: GC–MS
conducted in different years with different experimental set-
ups.                                                             Few off-line filters were used for PAH analysis using the
   The emissions of vehicles D2 and GDI2 were tested using       GC–MS technique. The analysis was carried out on a trace
the Worldwide Harmonized Light Vehicles Cycle (WLTC),            GC Ultra (Thermo Scientific) equipped with a TG-5MS cap-
(Tutuianu et al., 2015), which is the official cycle for emis-   illary column (30 m × 0.25 mm i.d., 0.25 µm film thickness,
sions legislation of Euro 6 vehicles, while the D1, D3, GDI1,    Thermo Scientific) coupled to a TSQ Quantum XLS triple-
GDI3, and PFI vehicles were evaluated using the Common           quadrupole mass spectrometer (Thermo Scientific). Helium
Artemis Driving Cycles (CADC hereafter Artemis) (André,          was used as the carrier gas at a constant flow rate of
2004), which allows the separate evaluation of the contribu-     1 mL min−1 . A total of 1 µL of the sample was injected in
tions of urban, rural, and motorway driving conditions.          splitless mode. The GC oven temperature programme was
   A suite of instrumentation was deployed for the characteri-   set to start at 65 ◦ C and ramp to 200 ◦ C at a 6 ◦ C min−1 rate
zation of both particle- and gas-phase emissions. A stainless-   and then to 300 ◦ C at 20 ◦ C min−1 , held for 20 min. Temper-
steel sampling line of 10 mm inner diameter and 5–6 m long       atures of ion source, injector, and transfer line were main-
was used. The line was heated at 80–120 ◦ C in order to re-      tained at 250 ◦ C. The triple-quadrupole mass spectrometer
duce losses of the semi-volatile compounds (SVOCs) which         was operated in a full-scan and single-ion monitoring mode
were analysed by proton-transfer-reaction mass spectrome-        at 70 eV ionization energy. PAH calibration mixture and in-
try (PTR-MS) and gas chromatography–mass spectrometry            dividual standards (EPA 610A, Restek; 9,10-anthraquinone,
(GC–MS) techniques (Marques et al., 2021). The total flow        Chem Service; 1-methylnaphthalene, Sigma-Aldrich) were
was approximately of 60 L min−1 . Before reaching the in-        used for the identification and quantification of the target
struments, the line was split in two parts: one for the PM       compounds.
measurements, kept at room temperature, and a second one
for the gas-phase measurements kept at 80–120 ◦ C. In this       2.2.4   Off-line analysis: TEM-EDX and XPS techniques
work, we focus on the particle phase only.
                                                                 A mini-particle sampler (MPS) was used to collect exhaust
2.2     Instrumentation                                          particles. This technique, based on filtration through TEM-
                                                                 porous grids (Holey carbon films and Quantifoil, AGAR Sci-
Four experimental campaigns were conducted using differ-         entific), enables sampling of particles directly on a specific
ent combinations of measurement systems. Thus, the instru-       support, minimizing additional sample preparation proce-
mentation configuration was not the same for all the vehicles    dure and sampling artefacts (R’Mili et al., 2013). The sam-
tested (Table 1).                                                pling was performed at specific times of the cycle, for exam-
                                                                 ple at the first minutes of the cold start or during a few min-
2.2.1    HR-ToF-AMS and c-ToF-AMS                                utes of the motorway cycle with a flow rate of 0.3 L min−1 .
                                                                 The deposited particles were then investigated by trans-
An Aerodyne high-resolution time-of-flight aerosol mass          mission electron microscopy (TEM), coupled with energy-
spectrometer (HR-ToF-AMS) (DeCarlo et al., 2006) or a            dispersive X-rays (EDX). Grids from the D1 and GDI1 ve-
compact time-of-flight aerosol mass spectrometer (c-ToF-         hicles were analysed using a JEOL 2010F microscope op-

https://doi.org/10.5194/acp-21-4779-2021                                          Atmos. Chem. Phys., 21, 4779–4796, 2021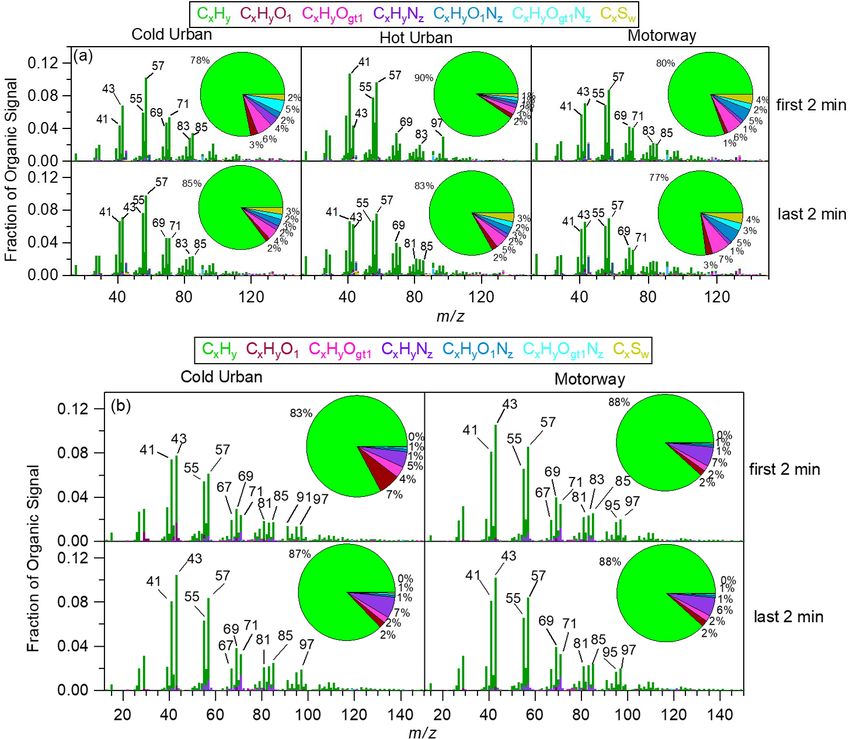
4782                                                    E. Kostenidou et al.: Emissions from Euro 5 diesel and gasoline vehicles

Table 1. Technical characteristics of the tested vehicles, experimental conditions, and particle-phase instrumentation used.

                                                Diesel Euro 5                                     Gasoline Euro 5
         Vehicle name                D1         D2            D3             GDI1          GDI2        PFI            GDI3
         Size class                  1.5 DCI    1.6 TDI       2.0 HDI        1.2 TSI       0.9 TCE     1.0 VVTI       1.2 TCE 16 V
         Engine capacity (cm3 )      1461       1598          1997           1197          900         998            1149
         Weight (kg)                 1090       1262          1515           1320          1055        1030           1100
         Odometer mileage (km)       87 073     78 903        103 000        25 844        9500        27 712         97 089
         Catalyst type               DOC        DOC           DOC            TWC           TWC         TWC            TWC
         Particulate filter type     CDPF       CDPF          FBC-DPF        –             –           –              –
         Driving cycles tested       Artemis    WLTC          Artemis        Artemis       WLTC        Artemis        Artemis
         Dilution system             CVS        FPS-4000      Hot injector   CVS           FPS-4000    Hot injector   Hot injector
         Dilution ratio              8–40       7–12          2.3–15         13–100        20–46       2.3            1.5
         AMS type                    c-ToF      c-ToF         HR-ToF         –             c-ToF       HR-ToF         HR-ToF
         MAAP/AE-33                  MAAP       AE-33         –              MAAP          AE-33       –              AE-33
         CPC                         Yes        Yes           –              Yes           Yes         Yes            Yes
         FMPS/SMPS/SMPS+E            Yes        Yes           –              –             Yes         –              –
         TEM/XPS                     Yes/no     Yes/no        Yes/no         Yes/no        Yes/no      Yes/yes        –

erated at 200 kV, while all the other samples were analysed              in high resolution (HR). Since the majority of the signal at
using a JEOL JEM2010 microscope, fitted with a LaB6 elec-                m/z 44 was practically due to the gaseous CO2 , the signal at
tron gun under a 200 kV accelerating voltage and an edge-to-             m/z 44 was removed from the fragmentation table. In addi-
edge resolution of 0.23 nm at 200 kV. The instrumentation in-            tion, we removed the m/z 73, 147, 207, 221, and 281 as they
cluded also an EDX spectrometer (BRUKER, Quantax) with                   were related to polydimethylsiloxane (SiO(CH3 )2 ) contam-
an XFlash® silicon drift detector, which has a resolution of             inations due to conductive silicone material present in parts
65 and 73 eV for the Kα transition of carbon and fluoride                of the tailpipe (Timko et al., 2009, 2014; Lamma, 2017). For
respectively.                                                            the quantification of the aerosol and the PAH mass concen-
   Particles emitted by the PIF4 vehicle were further analysed           tration, a collection efficiency (CE) of 1 was used following
by XPS recorded under an ultra-high vacuum using a Re-                   previous engine exhaust studies (Canagaratna et al., 2004;
solve 120 hemispherical electron analyser (PSP Vacuum) and               Slowik et al., 2004; Dallmann et al., 2014; Eriksson et al.,
an un-monochromatized X-ray source (Mg Kα at 1253.6 eV,                  2014; Bruns et al., 2015; Herring et al., 2015). The rela-
PSP Vacuum Technology) operated at 100 W at an incidence                 tive ionization efficiency (RIE) of the PAHs was set to 1.4,
angle of 30◦ with respect to the analyser axis. This X-ray               as measurements of four PAHs resulted in an RIE between
excitation energy and detection geometry correspond to an                1.35 and 2.1 (Slowik et al., 2004; Dzepina et al., 2007). PAH
analysed depth of about 1 nm at the C1s and O1s lines. Sur-              analysis was carried out using Herring et al. (2015) method-
vey spectra were collected at a pass energy of 50 eV and an              ology for vehicles D3, PFI, and GDI3 (HR-ToF-AMS data).
energy step of 0.2 eV, while the other lines were collected at           This method is based on laboratory intercomparison of PAHs
20 eV pass energy and a step of 0.1 eV. The XPS lines were               measured by AMS and GC–MS (Dzepina et al., 2007). The
deconvoluted with the CasaXPS programme, after Shirley-                  method has been more recently applied for the identification
type or linear background subtraction. Quantitative estima-              and quantification of functionalized PAHs in wood-burning
tions of the sample composition were done after correction               organic aerosol (Hartikainen et al., 2020). Briefly, each PAH
by the relative sensitivity factors (RSFs) provided in the pro-          compound concentration (Ci ) is estimated using the relative
gramme.                                                                  abundance (i.e., the signal fraction of the major contribut-
                                                                         ing ion [M-H]+ ) (fA,i ) of the PAH molecular ion in the
2.3     Methods                                                          reference mass spectra and its molecular ion concentration
                                                                         (Cion,i ) (measured for single PAH compounds) by Eq. (1):
2.3.1    Organics and PAHs                                                      Cion,i
                                                                         Ci =          .                                             (1)
                                                                                fA,i
The AMS data were analysed with SQUIRREL v1.60A and
PIKA v1.20A with Igor Pro 6.37 (Wave-Metrics). For the or-               Even though for most of the PAHs the fA,i is unknown,
ganic species, we used the fragmentation table of Aiken et               some laboratory-measured PAH spectra using the AMS do
al. (2009). For the vehicles D1, D2, and GDI2 the mass spec-             exist (Alfarra, 2004; Aiken et al., 2007; Dzepina et al.,
tra are provided in unit mass resolution (UMR), while for                2007). These spectra are for pyrene (C16 H10 , m/z 202), flu-
the vehicles D3, PFI, and GDI3 the mass spectra are given                oranthene (C16 H10 , m/z 202), 2,3-benzofluorene (C17 H12 ,

Atmos. Chem. Phys., 21, 4779–4796, 2021                                                      https://doi.org/10.5194/acp-21-4779-2021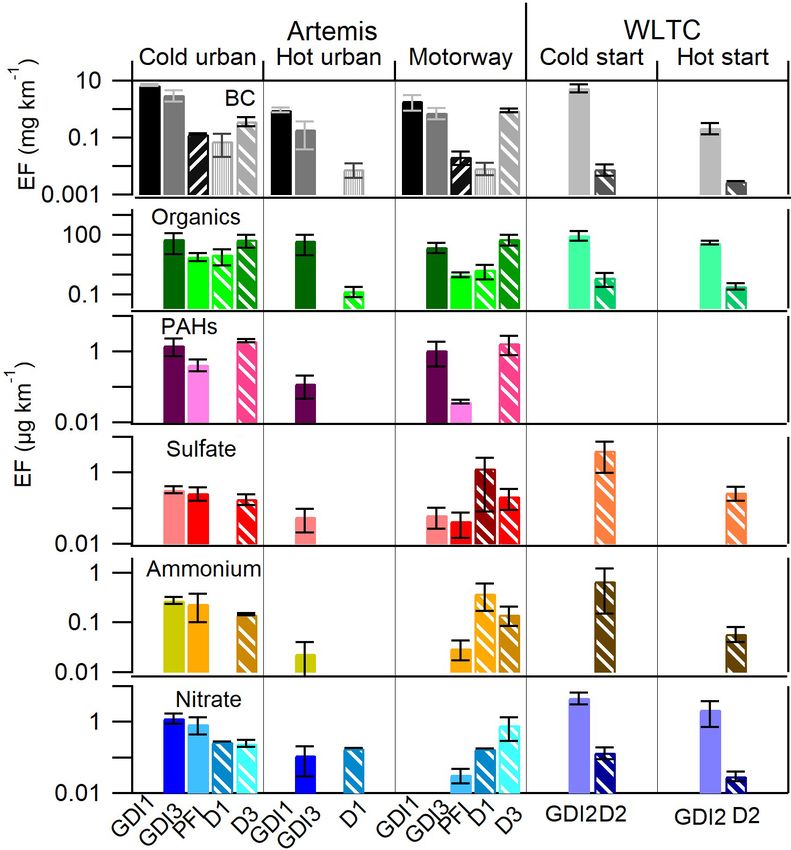
E. Kostenidou et al.: Emissions from Euro 5 diesel and gasoline vehicles 4783
m/z 216), 1-methylpyrene (C17 H12 , m/z 216), triph- 3 Results
enylene (C18 H12 , m/z 228), 10-methylbenz[a]anthracene
(C19 H14 , m/z 242), benzo[e]pyrene (C20 H12 , m/z 252), and 3.1 AMS chemical composition
benzo[ghi]perylene (C22 H12 , m/z 276), and their relative
abundance (fA,i ) is summarized in Herring et al. (2015). 3.1.1 Time series profiles
In this work we used the average relative abundance of the
above-measured compounds, which corresponds to an fA,i Figure 1 shows the particle mass concentration transient pro-
of 26.5 %. Using this assumption we introduce an error of file of BC measured by an Aethalometer and those of or-
±40 % (taking into account the minimum and the maxi- ganics, sulfate, nitrate, and ammonium measured by the HR-
mum fA,i reported for the AMS-measured PAH spectra). ToF-AMS for the GDI3 vehicle during Artemis cold urban,
This value is very close to what was published by Dzepina hot urban, and motorway cycles. The mass concentrations
et al. (2007), who showed that the Q-AMS capability of have been corrected for the dilution. The particle-phase emis-
measuring particulate PAH in ambient air has uncertainty sions were mainly composed of BC (96.8 %–98 %), while
of +35 % and −38 %. An example of the HR mass spectra the organic fraction accounted for 1.9 %–3.1 %; ammonium,
fitting for naphthalene, methyl-naphthalene, anthracene, and sulfate, and nitrate were approximately 0.1 %. The highest
nitro-anthracene is given in Fig. S1 in the Supplement. mass concentrations of BC and organics, 120 mg m−3 and
Additional tests were conducted comparing AMS results 1600 µg m−3 respectively, were observed during the first 1–
with GC–MS analysis (quartz filters) of particle-bound PAHs 2 min of the cycle, due to the cold engine and thus low cat-
emitted from the GDI3 vehicle (see Table S3). The GC– alyst efficiency, which is in agreement with previous studies
MS analysis method of PAHs is derived by previous works (e.g., Weilenmann et al., 2009; Clairotte et al., 2013; Col-
carried out on atmospheric particulate matter samples by El lier et al., 2015; Karjalainen et al., 2016; Louis et al., 2016;
Haddad et al. (2011) and El Haddad (2011). The filter sam- Pieber et al., 2018). GDI2 particulate mass concentrations
ples were spiked with known amounts of the isotope labelled in the exhaust flow were measured during WLTC (Fig. S2):
standard anthracene d10 (Sigma-Aldrich) and they were in- BC contributed 83 %–98 % to the total PM mass, while the
troduced in a 66 mL stainless-steel cell. Accelerated solvent organic fraction ranged from 1.8 % to 14 % of the PM. The
extraction was carried out with a dichloromethane–acetone remaining fraction 0.2 %–3 % was composed of ammonium,
mixture (1 : 1 v/v, high-performance liquid chromatography sulfate, and nitrate. For GDI2 the emitted PM concentrations
(HPLC) grade, Sigma-Aldrich) using an ASE 350 system were comparable to the values measured for the GDI3 vehi-
(Dionex) at 100 ◦ C and 100 bar. The extracts were purged cle during the Artemis cold urban cycle.
from the cell using pressurized nitrogen gas for 100 s. The PM emissions from the PFI vehicle are shown in Fig. S3.
extracts were then concentrated under a gentle nitrogen gas The organic and nitrate mass concentrations were a factor of
stream at 40 ◦ C (TurboVap II, Biotage) down to a volume of 8 and 2 lower with respect to the GDI3 vehicle during the
500 µL in hexane (HPLC grade, Sigma-Aldrich). cold urban cycle. High PM emissions from GDI technology
have been reported in several previous studies (e.g., Zhu et
2.3.2 Emission factors al., 2016; Saliba et al., 2017; Du et al., 2018) and were ex-
plained by the incomplete volatilization and mixing of the
The distance-based emission factor (EF) of each species dur- fuel in the combustion chamber (Fu et al., 2014; Chen et al.,
ing the cycle was calculated using Eq. (2): 2017; Saliba et al., 2017).
DR
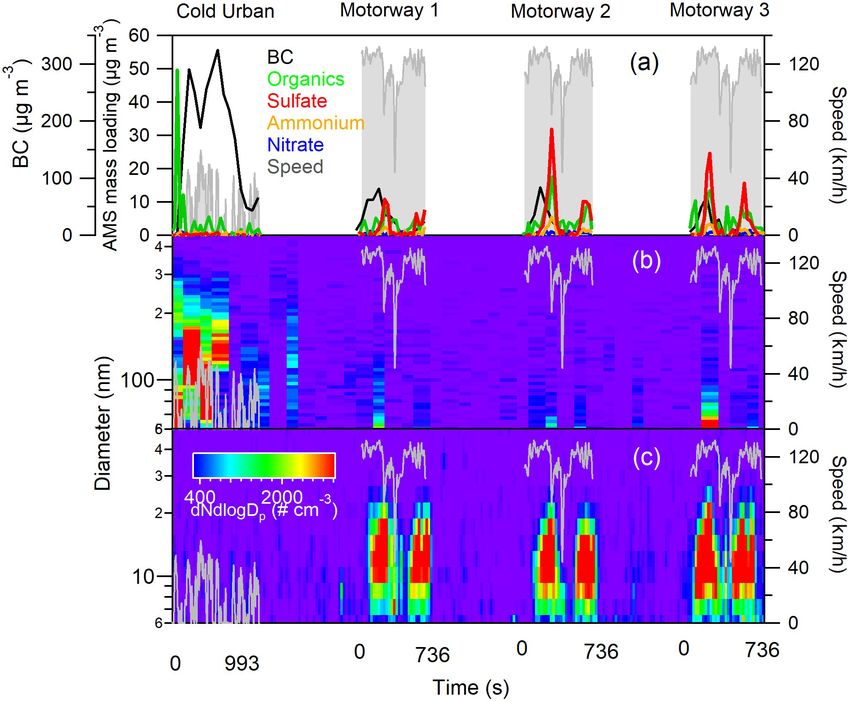
Z Figure 2 shows the PM emissions from the D1 vehicle
EF = C(t)∗Qex (t) · dt, (2) (equipped with a CDPF) in terms of chemical composition
D
(Fig. 2a) and particle size distribution (Fig. 2b and c) dur-
where C(t) is the mass concentration of the pollutant (af- ing a cold urban cycle and three consecutive motorway cy-
ter background corrections), Qex (t) is the exhaust flow rate cles. The cold cycle was characterized by relatively high BC
at the tail pipe measured by the CVS or the FPS, DR is and organic matter emissions, reaching concentrations of 300
the external dilution ratio before the entrance of the instru- and 50 µg m−3 respectively. During the cold urban cycle BC
mentation, and D is the distance of the cycle (4.51 km for accounted for 94 % of the total mass concentration and or-
Artemis urban cycle, 23.8 km for Artemis motorway cycle, ganics only for 4 %; during the motorway cycle the contri-
and 23.25 km for WLTC). bution of BC decreased to 85 %, while ammonium bisulfate
increased to (6 %) and organics to (8 %). The three motorway
cycles showed good repeatability, characterized by a first re-
lease of BC followed by emissions of ammonium bisulfate
and organic nanoparticles (of 15 nm mean diameter). The
identification of ammonium bisulfate was based on the sul-
fate / ammonium mass concentration ratio. These emissions
were interpreted as a passive regeneration of the DPF occur-
https://doi.org/10.5194/acp-21-4779-2021 Atmos. Chem. Phys., 21, 4779–4796, 2021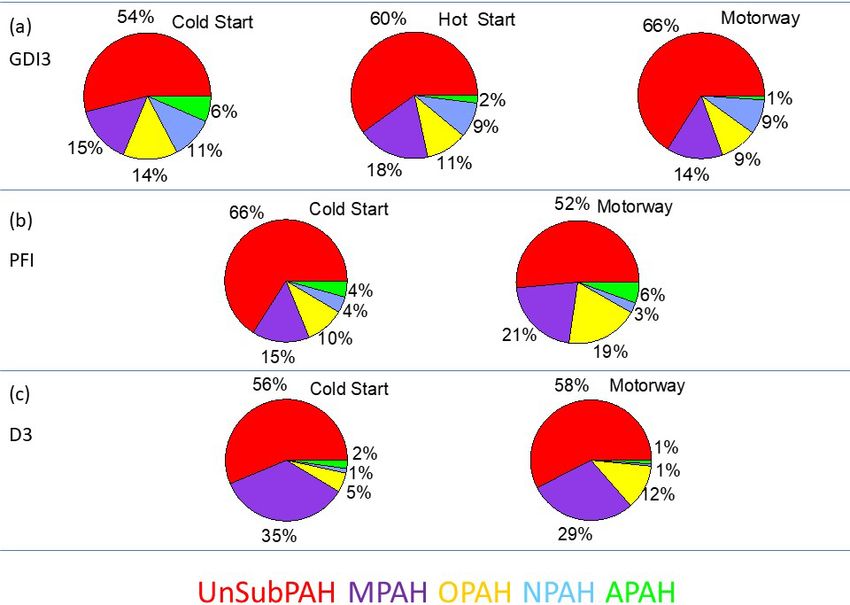
4784                                                   E. Kostenidou et al.: Emissions from Euro 5 diesel and gasoline vehicles

Figure 1. BC, organics, sulfate, nitrate, and ammonium time profiles during a cold urban, a hot urban, and a motorway Artemis cycle for the
GDI3 vehicle.

                                                                        monium bisulfate concentrations reached maximum values
                                                                        of 50 µg m−3 .
                                                                           The emission of sulfate-containing particles from the two
                                                                        CDPF vehicles was explained by the presence of the cat-
                                                                        alyst on the DPF walls. It has been proposed that during
                                                                        acceleration and hot-engine combustion periods sulfur can
                                                                        be released from the DPF and converted into SO3 by the
                                                                        catalyst, forming successively sulfuric acid and/or ultrafine
                                                                        bisulfate/sulfate ammonium particles (e.g., Bikas and Zervas,
                                                                        2007; Bergmann et al., 2009; Arnold et al., 2012; R’Mili et
                                                                        al., 2018).
                                                                           PM emissions from the D3 vehicle equipped with an FBC
                                                                        catalyst (Fig. S5) were relatively high: organic aerosol, ni-
                                                                        trates, and sulfate reached 300, 90, and 40 µg m−3 respec-
                                                                        tively. The high PM concentrations were interpreted as a pos-
                                                                        sible failure in the after-treatment system and will be further
                                                                        discussed in Sect. 3.3. This was supported by the relatively
                                                                        higher emissions of CO2 , CO, NOx , and total hydrocarbons
Figure 2. PM emissions from the D1 vehicle, during a cold urban
                                                                        (THCs) in comparison to the rest of the diesel vehicles (Ta-
cycle and three successive motorway cycles: (a) AMS major chem-
                                                                        ble S1).
ical species and BC (MAAP), (b) size distribution of fine particles
(SMPS), and (c) size distribution of ultrafine particles (SMPS+E).
                                                                        3.1.2   Organic mass spectra

                                                                        Figure 3 shows the HR-AMS mass spectra for the GDI3
ring at the high temperatures reached during the cycle. The             and the D3 vehicles during the first 2 and last 2 min of
same behaviour was previously reported for diesel vehicles              each type of cycle (cold urban, hot urban, and motor-
equipped with CDPF (R’Mili et al., 2018).                               way). The mass spectra were characterized by the ion frag-
   PM emission profiles during WLTC cycles from a second                ments Cn H+ 2n+1 (m/z = 29, 43, 57, 71, 85...) typical of sat-
CDPF vehicle (D2) are shown in Fig. S4. This vehicle was                urated alkyl compounds (n-alkanes and branched alkanes),
characterized by very low emissions, demonstrating the ef-              Cn H+2n−1 (m/z = 27, 41, 55, 69, 83, 97...) typical of un-
ficiency of diesel after treatment devices (DPF). Emissions             saturated aliphatic compounds (cycloalkanes, alkenes), and
were observed during few accelerations; the organic mass                Cn H+2n−3 (m/z = 67, 81, 95, 109...) typical of bicycloalkanes
concentration always remained below 20 µg m−3 , while am-               and alkynes (McLafferty and Turecek, 1993). These spectra

Atmos. Chem. Phys., 21, 4779–4796, 2021                                                    https://doi.org/10.5194/acp-21-4779-2021
E. Kostenidou et al.: Emissions from Euro 5 diesel and gasoline vehicles 4785
were consistent with the signatures found in both gasoline 3.1.3 PAHs
and diesel exhaust emissions (e.g., Canagaratna et al., 2004;
Mohr et al., 2009; Chirico et al., 2011; Platt et al., 2013; Col- In total, 45 PAHs were identified for the GDI3, PFI, and D3
lier et al., 2015; Dallmann et al., 2014; R’Mili et al., 2018) vehicles during Artemis cycles (Table S2). The PAH identi-
and arise from unburned fuel, lubricating oil, and their par- fication and quantitative estimation were based on Herring et
tially oxidized products (Maricq, 2007). al. (2015) and Dzepina et al. (2007) methods. An additional
During some periods of the cycle, the m/z ratios of 43/41, test was carried out comparing AMS results with GC–MS
57/55, and 71/69 were relatively high with values of 1.50, analysis of particles collected on quartz filters for the GDI3
1.72, and 1.19 during the GDI3 cold start (Fig. 3a) and 1.30, vehicle. Table S3 presents the intercomparison of PAH con-
1.32, and 0.85 during the D3 hot-engine regimes (Fig. 3b). centrations between AMS and GC–MS. Three cumulative
Comparing our mass spectra with pure gasoline, diesel fuel, cycles (one hot urban and two motorway) were collected on
and lubricant oil mass spectra analysed with a similar instru- the filter. A considerable overestimation for AMS results is
ment (R’Mili et al., 2018), and knowing that the fuels contain observed for light PAHs, which is reduced for heavier PAHs,
high concentrations of n-alkanes, while lubricating oils tend while a good agreement is found for oxy-PAHs. Filter sam-
to contain mostly cycloalkanes (Tobias et al., 2001; Isaacman pling could be affected by volatilization due to the warm flow
et al., 2012), we concluded that both GDI3 and D3 vehicles (20 L min−1 ) since the line was heated, and only the last few
emitted some oil (see also Sect. 3.2 for TEM images). How- metres were kept at room temperature.
ever, we did not observe any evident correlation between oil The PAH mass concentrations during the cold cycle were
droplet emissions and engine load or cycle speed or acceler- considerably higher for GDI3 and D3 than for PFI, with val-
ation. ues of 1.66, 2.21, and 0.47 µg m−3 , correspondingly. Slightly
Hydrocarbon ion fragments accounted for 77 % to 90 % lower mass concentrations were observed during the hot cy-
of the OA fraction for the GDI3 (Fig. 3a), for 83 %–88 % cles. For the diesel D1 and D2 vehicles, the PAH signal was
for the D3 (Fig. 3b), and for 56 %–87 % for the PFI vehicles close to the detection limit, demonstrating the efficiency of
(Fig. S6). Similar mass spectra were observed for the GDI2 diesel after-treatments devices (DOC and DPF). The remark-
and D1 vehicles (Figs. S7 and S8, UMR mass spectrum). The able difference among the three diesel vehicles suggests that
OA concentration emitted from the D2 vehicle was very low, D3 indeed presented a failure in the after-treatment device.
and thus the corresponding AMS mass spectrum was associ- For the GDI2 vehicle, the identification of individual PAHs
ated with high uncertainty. was not possible since the data were collected with a c-ToF-
For all gasoline vehicles, sulfur-containing organic frag- AMS (UMR mass spectra).
ments at m/z 45 (CHS+ , 44.979), 46 (CH2 S+ , 45.987), and Figure 4 presents the relative contribution of five PAHs
47 (CH3 S+ , 46.995) were detected. They accounted for ap- families for the GDI3, PFI, and D3 vehicles: unsubsti-
proximately 2 %–4 % of the organic mass fraction for the tuted PAHs (UnSubPAHs), methylated PAHs (MPAHs), oxy-
GDI3 (Fig. 3a) and 6 %–7 % of the organic mass for the PFI genated PAHs (OPAHs), nitro-PAHs (NPAHs), and amino
(Fig. S7). For the GDI2 vehicle (Fig. S5), a high m/z 45 PAHs (APAHs). The UnSubPAHs represented the most
contribution was detected at the beginning of the hot-start abundant group, accounting for 52 to 66 % of the total PAHs,
WLTC, but the spectrum was acquired with a c-ToF-AMS, followed by MPAHs (14 %–35 %), then OPAHs (5 %–19 %),
and therefore the signal can be assigned to both oxygenated NPAHs (1 %–11 %), and finally APAHs (1 %–6 %). Table S4
(CHO+ + +
2 and C2 H5 O ) and organosulfur (CHS ) fragments. shows the individual PAH fractions during cold- and hot-start
Sulfur-containing ion fragments were mostly emitted from cycles. Naphthalene emissions dominated, contributing from
hot engines (end of urban cycle and motorway cycle) and 9.6 % to 19.1 % of the total PAHs, which is in agreement with
are tentatively explained by the release of some lubricant oil. previous studies (e.g., de Abrantes et al., 2004; Vouitsis et al.,
Except for the above differences (presence of oil droplets and 2009; Huang et al., 2013; Alves et al., 2015; de Souza and
sulfur-containing fragments), no other significant variability Corrêa 2016; Muñoz et al., 2018; Yang et al., 2018). Among
was observed between the cold- and the hot-start HR mass the three-ring PAH species, acenaphthylene (4.3 %–9.7 %),
spectra. anthracene, and its isomer phenanthrene (4.1 %–15.9 %)
Table 2 presents the correlations between the mass spectra were the most abundant; concerning the four-ring PAHs,
of the tested vehicles and those of previous studies (AMS the major contribution was from pyrene and from the iso-
mass spectra database). A very good correlation was found mers fluoranthene and acephenanthrylene (1.3 %–13.9 %).
between the mass spectra from diesel and gasoline vehicles Among the five-ring PAHs, benzo[a]pyrene and all its iso-
(Canagaratna et al., 2004; Mohr et al., 2009; R’Mili et al., mers (0.4 %–3.8 %) and benzo[ghi]fluoranthene (1 %–3.3 %)
2018) and positive matrix factorization (PMF) factors related were the most significant compounds. Some heavier PAHs
to fresh traffic emissions (Mohr et al., 2012; Kostenidou et such as indio[1,2,3-cd]pyrene, its isomer benzo[ghi]perylene
al., 2015; Kaltsonoudis et al., 2017). The R 2 ranged between (0.4 %–6.6 %), and coronene (0.06 %–5.3 %) were mostly
0.72 and 0.92 (Table 2) for all cases. found in gasoline vehicle emissions. Light PAHs have of-
ten been measured in exhaust particles of light-duty vehicles
https://doi.org/10.5194/acp-21-4779-2021 Atmos. Chem. Phys., 21, 4779–4796, 20214786 E. Kostenidou et al.: Emissions from Euro 5 diesel and gasoline vehicles
Figure 3. HR mass spectra and chemical composition: (a) during the first 2 and the last 2 min of a cold urban (left), hot urban (middle),
and motorway (right) Artemis cycle for the gasoline GDI3 vehicle and (b) during the first 2 and the last 2 min of a cold urban (left) and a
motorway (right) Artemis cycle for the diesel D3 vehicle.
Table 2. Correlations between mass spectra taken during the first 2 min of an Artemis motorway cycle and mass spectra from diesel and
gasoline vehicles, lubricant oil, and PMF factors related to fresh transportation (HOA, hydrocarbon-like OA) from selected studies using
both R 2 and the angle θ (Kostenidou et al., 2009) in parentheses. The angle θ provides a better comparison for small differences in the mass
spectra (when R 2 is less than 0.97), as this method treats the mass spectra as vectors. More details about this method are given in Kostenidou
et al. (2009).
First 2 min of Artemis motorway (R 2 and angle θ in degrees)
D1 D3 GDI2 PFI GDI3
Diesel bus exhaust1 0.80 (24.9) 0.97 (9.1) 0.88 (19.1) 0.88 (19.8) 0.92 (15.1)
Diesel truck2 0.76 (27.4) 0.95 (12.2) 0.84 (21.8) 0.83 (23.1) 0.90 (16.8)
Gasoline car2 0.74 (28.2) 0.96 (11.2) 0.83 (22.9) 0.81 (25.7) 0.91 (16.8)
Diesel vehicle Euro 53 0.82 (23.6) 0.77 (26.9) 0.83 (22.5) 0.72 (29.2) 0.73 (28.9)
Lubricant oil (diesel vehicle)3 0.75 (28.8) 0.96 (12.3) 0.86 (21.5) 0.80 (27.9) 0.89 (19.4)
HOA Athens summer4 0.73 (29.3) 0.95 (12.3) 0.80 (24.8) 0.83 (23.9) 0.91 (16.8)
HOA ICE-HT winter5 0.69 (31.9) 0.94 (12.7) 0.77 (26.8) 0.80 (24.0) 0.91 (16.8)
HOA Barcelona6 0.77 (27.2) 0.96 (10.8) 0.85 (21.6) 0.84 (24.3) 0.92 (16.2)
1 Canagaratna et al. (2004). 2 Mohr et al. (2009). 3 R’Mili et al. (2018). 4 Kostenidou et al. (2015). 5 Kaltsonoudis et al. (2017).
6 Mohr et al. (2012).
Atmos. Chem. Phys., 21, 4779–4796, 2021 https://doi.org/10.5194/acp-21-4779-2021E. Kostenidou et al.: Emissions from Euro 5 diesel and gasoline vehicles 4787
49 % for the GDI3, 29 %–30 % for the PFI, and 29 %–31 %
for the D3 vehicles.
A considerable fraction – up to 31 % of the total PAHs
– was functionalized and included OPAHs, NPAHs, and
APAHs. All technologies emitted an important fraction of
OPAHs (up to 19 %); anthraquinone, indanone, and fluo-
renone were the most abundant in agreement with previ-
ous emission studies (Karavalakis et al., 2011) followed by
dibenzofuran and dibenzopyran.
APAHs accounted for 1 % to 6 % of the total PAH frac-
tion and were mostly emitted by gasoline cars. Major APAHs
were aminopyrene/carbazole and dibenzocarbazole/amino-
benzopyrene; however very little is known about the vehicle
tailpipe emissions of these compounds so far.
Nitro-anthracene and its isomer nitro-phenanthrene con-
Figure 4. Average contribution of the various PAH families during tributed up to 8 % of the total PAHs in the GDI3 emissions,
Artemis cycles for GDI3 (a), PFI (b), and D3 (c) vehicles, using the but only 1 % in PFI and D3 vehicles. Nitro-fluorene, nitro-
method of Herring et al. (2015). pyrene, and nitro-chrysene were found in the vehicle exhaust
of all three vehicles and accounted for less than 1 % of the to-
tal PAH mass fraction. Similar results are reported by Yang
(Ravindra et al., 2008; de Souza and Corrêa, 2016; Muñoz et al. (2018) even though the authors found several nitro-
et al., 2018; Yang et al., 2018), and their presence has been naphthalenes to be the major contributors to NPAH emis-
tentatively explained by incomplete fuel combustion (Lea- sions. Even if present in small amounts, some of these com-
Langton et al., 2008; Ravindra et al., 2008) since these com- pounds, such as 6-nitrochrysene and 1-nitropyrene, are clas-
pounds are present in the fuel composition (Marr et al., 1999; sified as possibly carcinogenic to humans (group 2B) (IARC,
de Souza and Corrêa, 2016). During the gasoline hot cy- 2012; Bandowe and Meusel, 2017). Surprisingly, NPAHs,
cles an increase in the three- and four-ring PAH (anthracene, including nitro-pyrene, were considerably higher in Euro 5
pyrene, paracyclene, and all its isomers) contribution was ob- GDI emissions than in those of diesel vehicles, question-
served. ing the pertinence of using NPAHs such as 1-nitropyrene as
MPAHs accounted for 14 % to 35 % of the total PAHs markers of diesel emissions (Keyte et al., 2016).
and were more abundant for the D3 vehicle; major contribu-
tions arose from methyl- and dimethyl-naphthalene, methyl- 3.2 TEM and XPS analysis
phenanthrene, methyl-fluorene, and ethyl-phenanthrene,
which is in agreement with Muñoz et al. (2018) and Figure 6 presents TEM images of particles emitted by the
Yang et al. (2018). All these compounds have been re- different cars during cold and motorway cycles. Figure 6a–
cently associated with carcinogenic potency (Samburova c and d–f show particles emitted from the GDI1 and GDI2
et al., 2017). BaP and its isomers (benzo[b]fluoranthene, vehicles; the samples were collected during the first 120 s of
benzo[j ]fluoranthene, or benzo[k]fluoranthene) contributed the cycle, and the dilution was around 40–46. Figure 6g–i
only 0.5 % to 7 % of the PAH fraction of gasoline cars (taking show three images of particles emitted by the D1 vehicle; the
into account the AMS and the GC–MS analysis), while the corresponding sample was collected for 300 s, and the dilu-
signal was below the detection limit in the D3 emissions. Yet, tion was around 40. TEM images confirmed the quite higher
recent studies suggest that BaP, as an indicator compound, emissions of soot particles (or BC) for the two GDIs with
may highly underestimate the total carcinogenic potency of respect to the diesel vehicles, which is in agreement with
PAH mixtures (Samburova et al., 2017). BC emissions measured by the MAAP and the Aethalome-
Figure 5 depicts the transient profile of selected PAHs for ter. As usually mentioned in the literature, soot particles are
the GDI3, PFI, and D3 vehicles during Artemis cycles; these observed either as fractal branched chains or as bigger ag-
PAHs have been classified as carcinogenic or/and photomu- glomerates made of primary soot spheres of different sizes
tagenic (compounds that cause mutagenicity after being ex- (Lapuerta et al., 2020). Primary soot particles with a diam-
posed to visible or UV light) according to IARC 2010. Fol- eter of 24.2 ± 4.1 nm were observed for the gasoline vehi-
lowing BC and organic emission trends, PAHs were mostly cles during cold cycles (Fig. 6c and f), while the diameter
emitted in the first few minutes of the cold urban cycle and was significantly smaller (14.5 ± 3.4 nm) during hot cycles
during acceleration periods of the motorway cycle or dur- (Fig. S9c and f). The results are in a good agreement with
ing fuel-rich combustion periods in agreement with previous previous literature, which reported primary diesel soot parti-
studies (Muñoz et al., 2018). The mass fractions of these car- cles with a diameter in the range between 20–25 nm (Barone
cinogenic and/or photomutagenic PAHs accounted for 27 %– et al., 2012) and smaller sizes down to 16 nm (Mathis et al.,
https://doi.org/10.5194/acp-21-4779-2021 Atmos. Chem. Phys., 21, 4779–4796, 20214788 E. Kostenidou et al.: Emissions from Euro 5 diesel and gasoline vehicles Figure 5. Example of PAH time series profiles for GDI3, PFI, and D3 vehicles for Artemis-tested cycles. The time series have been corrected for the injector dilution (1.5) and for a relative abundance fA,i = 0.265. Compounds labelled with have been characterized as photomuta- genic, while compounds labelled with # have been found to be cancerogenic (IARC, 2010). The identification and the quantification of their concentration are based on the approach of Herring et al. (2015). 2004; Gaddam and Vander Wal et al., 2013) for gasoline ex- of the FBC-DPF vehicle (D3), which uses metallic salts or haust particles. A slight decrease in the primary particle size organometallic additives into the engine combustion cham- with increasing temperature was observed, in agreement with ber. Upon combustion, the additive produces metal oxide recent studies (Cadrazco et al., 2019). It has been shown that nanoparticles that are mixed with soot particles and are de- the engine load has no effect on soot morphology (Lapuerta posited on the DPF walls. The role of these metals is to et al., 2020) as many other parameters may favour oppo- reduce the temperature during the DPF regeneration (Ntzi- site trends and compensate for each other. Indeed, a higher achristos et al., 2005; Majewski and Khair, 2006; Song et al., fuel / air ratio would tend to extend primary particle growth, 2006). When the exothermic oxidation of soot takes place, while a higher engine temperature would favour their oxida- DPF filtration efficiency is considerably reduced, allowing, tion and thus lead to smaller particle sizes (Ye et al., 2014). for a few minutes, emission of the ash particles attached to/or Similarly, increasing the injection timing leads to a decrease enclosed in soot particles (Liati et al., 2018). in primary particle size due to an increase in in-cylinder oxi- The GDI2 (Figs. 6d–e, S9d–e) and D1 (Fig. 6i) vehicles dation time (Xu et al., 2014). It is therefore difficult to unam- emitted some droplets. They were observed during both cold biguously attribute the slight decrease in particle size to the and warm cycles, and they had variable sizes and shapes temperature effect only. ranging from 100 nm to almost 1 µm. EDX analysis revealed Figure 6l depicts soot particles from the D3 vehicle; tiny that C and O were the major components, followed by S. Mi- sparse dark spots were ubiquitous within the soot parti- nor components also included calcium, phosphorus, sodium, cles and were interpreted as metal inclusions. Unfortunately, and silica. Only minor traces of zinc, iron, copper, chromium, EDX could not reveal their chemical nature due to the very aluminium, and nickel were observed. Analysis of the lubri- small amount of material in these inclusions as they were cant oils for D1, D2, GDI1, and GDI2 are presented in Table very small (typically less than 0.5 nm), and their spatial den- S5. Sulfur accounted for 0.12 wt % and 0.14 wt % of the lu- sity was low. Nevertheless, we suppose that these inclusions bricant oil. Other components of the lubricant oil were cal- were metallic and resulted from the after-treatment device cium, phosphorus, and zinc, and only traces of iron, silica, Atmos. Chem. Phys., 21, 4779–4796, 2021 https://doi.org/10.5194/acp-21-4779-2021
E. Kostenidou et al.: Emissions from Euro 5 diesel and gasoline vehicles                                                            4789

                                                                           is an artefact coming from the support plate while C, N, Ti,
                                                                           Cl, Ca, Ag, Zn, and a fraction of O originate from exhaust
                                                                           particles. Calcium, phosphorus, sulfur, and zinc might derive
                                                                           from lubricant oil (Table S5), while Ti might originate from
                                                                           the wash coat of the catalytic converter. The weak N1s signal
                                                                           showed the typical energy of amino groups, confirming the
                                                                           presence of APAHs as observed from AMS chemical analy-
                                                                           sis (Table S4).
                                                                              Figure S10b and c depict the deconvolution of C1s
                                                                           (panel b) and O1s spectra (panel c). In the C1s spec-
                                                                           trum the carbon speciation can be derived in terms of
                                                                           graphitic sp2 carbon (at 284.5 eV), aliphatic sp3 carbon
                                                                           (285.4 eV), and oxidized carbon in C–O–C bonds (ethers,
                                                                           alcohols; 286.4 eV), in C=O bonds (carbonyls, quinones,
                                                                           287.5 eV), and acidic O=C*–OH bonds (288.9 eV) (Estrade-
                                                                           Szwarckopf, 2004). The analysis revealed a soot sample
                                                                           dominated by sp2 hybridized carbon, the absence of the
                                                                           usual shakeup line associated with graphitic structures, and
                                                                           a significant “defect” contribution (at 283.5 eV, 12 % of the
                                                                           C1s signal) associated with carbon vacancies (Barinov et al.,
                                                                           2009), which indicates a significant concentration of car-
                                                                           bon radical defects (Levi et al., 2015). All these elements
                                                                           hint to a structurally disordered soot surface, possibly hav-
                                                                           ing chemical toxicity or reactivity due to the presence of
                                                                           surface radicals. In addition, a rather high concentration of
                                                                           sp3 carbons (alkanes, 20 % of the total carbon) was detected
                                                                           on the surface of the particles, in agreement with what was
                                                                           observed by AMS analysis (Fig. S6). From the O1s spec-
Figure 6. TEM images of samples collected during Artemis urban
                                                                           trum, the relative contributions of the C=O carbonyl and car-
cold cycle: (a–c) GDI1 vehicle (dilution ratio 40), the sample was
                                                                           boxylic groups (532.1 eV), the C–O–C group ethers and al-
collected during the first 120 s of the cycle; (d–f) GDI2 vehicle (di-
lution ratio 46), the sample was collected during the first 120 s of the   cohols (533.2 eV), and the OH group acids (534.3 eV) were
cycle; (g–i) D1 vehicle (dilution ratio 40), the sample was collected      derived. A strong contribution of Ti–O* in TiO2 was detected
during the first 300 s of the cycle and during the Artemis motor-          at 530.2 eV coming from ashes. Oxidized calcium and silicon
way cycle; (j–l) D3 sampling the first 45 s of the motorway cycle          also contributed to the O1s spectrum as Si–O* and Ca–O*
(dilution ratio 2), tiny metallic inclusions are observed in panel (l).    lines in the 533–535 eV range (Ni and Ratner, 2008; Yang
                                                                           et al., 2011). Using the C=O contribution at 532.2 eV – the
                                                                           only line not overlapped by the Si, Ca, and Ti oxides – and the
and copper were found. The iron found in the used lubricant                integrated intensity of the C1s line, we evaluated a soot sur-
oil suggests erosion or wear of the engine and exhaust line                face oxidation by the ratio O / (O + C), giving an oxidation
for both D1 and GDI1 vehicles. These findings are in line                  rate of 10.8 %. This is in good agreement with Schuster et
with previous studies that reported emissions of lubricant oil             al. (2011), who found oxidation rates between 5.5 %–11.5 %
particles during transient driving conditions (Karjalainen et              for Euro 4–5 soot particles.
al., 2014; Rönkkö et al., 2014).
   Particles emitted by the PFI vehicle were analysed by                   3.3   Emission factors
XPS. Figure S10a shows the survey spectrum, from which
the averaged elemental composition of the sample was                       Figure 7 shows the emission factors (EFs) for BC, organics,
derived (wt %). We noticed a strong C1s line at 285 eV                     PAHs, sulfate, ammonium, and nitrate for all the cars tested
(53.8 wt %), a strong O1s line at 530 eV (23.9 wt %), and                  in this study. Table S6 summarizes these EFs in µg km−1 .
weaker signals of Ti-2p doublet at 460 eV (8.3 wt %), zinc                 Most of the particles were emitted during the cold-start cy-
Auger lines (265 eV, 3.6 wt %), calcium Ca2p (352 eV,                      cles (both Artemis urban and WLTC) followed by motorway,
2.8 wt %), silicon Si2p (110 eV, 2.5 wt %), and phosphorus                 hot WLTC, and hot urban cycles. GDI vehicles generally
P2p (140 eV, 1.5 wt %). Other trace signals (< 1 wt %) of                  emitted considerably higher BC concentrations than PFI and
chlorine Cl2p (200 eV), nitrogen N1s (400 eV), silver Ag 3d                diesel vehicles.
(374 eV), and sulfur S 2p (168 eV) are also observed. From                    The average BC EFs for the GDI1, GDI3 (during Artemis
previous (unpublished) SEM-EDX analysis we know that Si                    cold urban cycle), and GDI2 (during WLTC cold) vehi-

https://doi.org/10.5194/acp-21-4779-2021                                                    Atmos. Chem. Phys., 21, 4779–4796, 2021
4790 E. Kostenidou et al.: Emissions from Euro 5 diesel and gasoline vehicles
The OA EFs emitted by the GDI3, GDI2, and PFI gasoline
vehicles were 66.3, 103.5, and 8.4 µg km−1 (or 1.1, 2.2, and
0.2 mg kg−1fuel ) respectively during the cold-start cycle. These
values are in agreement with Pieber et al. (2018), who re-
ported EFs between 1 and 10 mg kg−1 fuel for cold-start WLTC.
The corresponding OA EFs of D2, D1, and D3 vehicles were
0.7, 11, and 61 µg km−1 (or 0.02, 0.21, and 0.94 mg kg−1 fuel ) re-
spectively. The high variability observed for diesel vehicles
has been related to the performances of the after-treatment
devices (mainly DOC and DPF). Platt et al. (2017) reported
that the diesel vehicles equipped with DPF emitted very low
amounts of OA (less than 0.01 g km−1 fuel ), while OA EF of D3
is close to the values calculated for GDI vehicles, underlining
how bad DPF conditions may affect PM emissions.
The PAH EFs were measured only for GDI3, PFI, and D3
vehicles. EFs for GDI3 were 1.5 and 1.1 µg km−1 during cold
urban and motorway cycles respectively. These results are
in excellent agreement with EFs of 1.6–1.9 µg km−1 recently
published for two GDI cars (Yang et al., 2018). The PFI ve-
hicle emitted considerably lower PAHs, only 0.4 µg km−1 for
cold urban and 0.04 µg km−1 for motorway cycles. These
values are in relatively good agreement with Cheung et
al. (2010), who reported an EF of 0.67 µg km−1 from a PFI
Figure 7. Emission factors for three diesel (D1, D2, and D3) and gasoline vehicle. The D3 vehicle PAH EFs were 2.0 µg km−1
four gasoline (GDI1, GDI2, PFI, and GDI3) vehicles Euro 5: BC
during the cold urban cycle and 1.7 µg km−1 during the mo-
EFs are expressed in mg km−1 , while for organics, PAHs, sulfate,
ammonium, and nitrate, the values are expressed in µg km−1 . Gaso-
torway cycle. These findings are in good agreement with
line vehicles are shown with solid bars and diesel vehicles with pat- Alves et al. (2015), who reported EFs of 2.3 and 0.6 µg km−1
tern bars. The error bars correspond to ±1σ standard deviation. for cold urban and motorway cycles of a diesel Euro 5 ve-
hicle. When Cheung et al. (2010) added a DPF to a Euro 4
diesel vehicle (converting it into a “Euro 5”) the PAHs were
below the detection limit. Reports from literature emphasize
cles were 7.14, 3.18, and 5.7 mg km−1 respectively, con- the high variability of PAH emissions from different diesel
firming a relatively small variability among the three ve- Euro 5 cars. As already mentioned in the previous sections
hicles equipped with the same injection system and post- both OA and PAH EFs for D3 were surprisingly high for a
treatment devices. These results are in a reasonably good diesel vehicle equipped with a DPF, suggesting a failure in
agreement with previous studies, such as that of Saliba et the after-treatment device, as also supported by TEM images
al. (2017), who reported elemental carbon (EC) EFs between in Fig. 6.
0.08 and 5.8 mg km−1 for GDI light vehicles (models 2012– Sulfate, ammonium, and nitrate EFs were generally low.
2014) during a unified cycle cold start. Taking into account The highest sulfate EFs were observed for the D2 during
the cycle distance, the fuel consumption, and the fuel den- the cold-start WLTC cycle with an EF of 4.2 µg km−1 and
sity (Table S7), we converted BC EFs of GDI1, GDI3, and for the D1 during the Artemis motorway cycle with values
GDI2 to 120, 51, and 101 mg kg−1 fuel respectively. These val- of 1.3 µg km−1 . Both D1 and D2 cars were equipped with
ues are in good agreement with Pieber et al. (2018) and Platt a CDPF, while the D3 was equipped with an FBC-DPF and
et al. (2017), who reported for GDI Euro 5 light-duty ve- had lower sulfate EFs (0.18–0.22 µg km−1 ), underlying the
hicles EFs ranging from 10 and 100 mg kg−1 fuel during cold- determining influence of the DPF technology on PM chemi-
start WLTC and 10–250 mg kg−1 fuel during cold-start New Eu- cal composition. Nitrate was mostly emitted by gasoline cars.
ropean Driving Cycle (NEDC). BC EFs from PFI vehicles The highest EFs were measured for the GDI2 vehicle with
were considerably lower and lay in the range of 0.13 to 2.2 and 4.9 µg km−1 for cold- and hot-start WLTC respec-
0.02 mg km−1 during urban cold-start and motorway cycles tively.
respectively. These values are in the same range of pub-
lished work from Chan et al. (2014) and Short et al. (2015),
who reported (0.4–0.8 mg km−1 ) for PFI vehicles. BC EF 4 Conclusions
for the D1 vehicle during the Artemis cold-start cycle was
0.07 mg km−1 and for the D2 was 0.01 mg km−1 during a We characterized the chemical composition of three diesel
WLTC cold start in agreement with Platt et al. (2017). (two CDPF and one FBC-DPF) and four gasoline (three GDI
Atmos. Chem. Phys., 21, 4779–4796, 2021 https://doi.org/10.5194/acp-21-4779-2021E. Kostenidou et al.: Emissions from Euro 5 diesel and gasoline vehicles 4791
and one PFI equipped with TWC) Euro 5 light-duty vehi- Author contributions. BD’A, MA, and EK designed the research.
cles during transient cycles, and we evaluated their emission EK performed and analysed the measurements of the D3, PFI, and
factors. Most of the particulate matter was emitted at the be- GDI3 cars. AMV performed and analysed the measurements of the
ginning of the cold-start cycle due to the incomplete combus- D2 and GDI2 cars. BR’M performed and analysed the measure-
tion and low catalyst efficiency. BC was always the dominant ments of the D1 and GDI1 cars. BM, BTR, YL, CLo, and BV con-
tributed to the experimental set-up and the experimental procedure.
species, accounting for 83 %–98 % of the total particle mass
YL, CLo, and BV drove the cars. DF, CLa, and PP performed the
concentration, while the corresponding OA fraction ranged TEM and XPS analysis. EK synthesized all the data and wrote the
between 1.8 % and 14 %. paper with contributions from BD’A, DF, and PP. AD performed
The BC, OA, and PAH emissions of the GDI gasoline the GC–MS analysis for the PAHs.
vehicles were 4–50 times higher compared to the gasoline
PFI vehicle emissions. In total 45 PAHs were identified.
Approximately 52 %–66 % of the PAHs were unsubstituted Competing interests. The authors declare that they have no conflict
PAHs, followed by methylated PAHs (14 %–21 % of the of interest.
PAHs), oxygenated PAHs (5 %–19 %), NPAHs (1 %–11 %),
and amino PAHs (1 %–6 %). Unexpectedly, the GDI vehicle
emitted the highest concentrations of nitro-PAHs, question- Acknowledgements. The authors would like to thank Antoinette
ing the validity of using some NPAHs as a marker of diesel Boreave and Laurence Buriel from IRCELYON and Patrick Tassel
emissions. from IFSTTAR for their helpful support.
Oil droplets containing metallic components such as cal- The authors would like to thank the GDR SUIE (GDR CNRS
cium, phosphorus, sulfur, and zinc were observed in PM from 3622) for the financial support to make complementary investiga-
tions on TEM and XPS analysis at the CINaM laboratory.
both gasoline and diesel vehicles. Organosulfur-containing
ion fragments were detected for the first time on particles
emitted from gasoline vehicles, probably from the release of
Financial support. This research has been supported by the
lubricant oil, and accounted for 2 %–7 % of the total organic ADEME CORTEA programme with the project CAPVEREA
mass concentration. Analysis of particles emitted from the (contract no. 1466C0001) and the project MAESTRO (contract
PFI vehicle revealed a highly disordered soot surface, which no. 1766C0001).
could affect both chemical reactivity and PM toxicity.
Nanoparticles of 15 nm diameter, mainly composed of
ammonium bisulfate, were measured during the motor- Review statement. This paper was edited by John Liggio and re-
way cycle, suggesting passive regeneration of the DPF for viewed by two anonymous referees.
CDPF diesel vehicles. This behaviour was not observed for
the FBC-DPF vehicle, indicating that the different after-
treatment strategy highly affects the PM size and composi-
tion.
Diesel cars equipped with well-functioning after-treatment References
devices generally emitted far less pollutants than the gasoline
vehicles, but in the case of a DPF failure, very high levels ACEA: European Automobile Manufacturers Association, Pocket
Guide 2020–2021, available at: https://www.acea.be/uploads/
of PM, similar to those reported for the GDI vehicles, were
publications/ACEA_Pocket_Guide_2020-2021.pdf (last access:
measured. This indicates that the DPF condition is important
12 March 2021), 2020.
and attention should be given to its maintenance during the Aiken, A. C., DeCarlo, P. F., and Jimenez, J. L.: Elemental analysis
lifetime of the vehicle. of organic species with electron ionization high-resolution mass
All the particle characteristics investigated in this work spectrometry, Anal. Chem., 79, 8350–8358, 2007.
should be considered in emission control strategies and in Aiken, A. C., Salcedo, D., Cubison, M. J., Huffman, J. A., DeCarlo,
the assessment of the impact of light-duty particle emissions P. F., Ulbrich, I. M., Docherty, K. S., Sueper, D., Kimmel, J.
on the environment and on human health. R., Worsnop, D. R., Trimborn, A., Northway, M., Stone, E. A.,
Schauer, J. J., Volkamer, R. M., Fortner, E., de Foy, B., Wang,
J., Laskin, A., Shutthanandan, V., Zheng, J., Zhang, R., Gaffney,
Data availability. All data from this study are available from the J., Marley, N. A., Paredes-Miranda, G., Arnott, W. P., Molina,
authors upon request. L. T., Sosa, G., and Jimenez, J. L.: Mexico City aerosol analysis
during MILAGRO using high resolution aerosol mass spectrom-
etry at the urban supersite (T0) – Part 1: Fine particle composi-
tion and organic source apportionment, Atmos. Chem. Phys., 9,
Supplement. The supplement related to this article is available on-
6633–6653, https://doi.org/10.5194/acp-9-6633-2009, 2009.
line at: https://doi.org/10.5194/acp-21-4779-2021-supplement.
Alfarra, M. R.: Insights into atmospheric organic aerosols using an
aerosol mass spectrometer, in: Department of Chemical Engi-
neering, UMIST, Manchester, UK, 2004.
https://doi.org/10.5194/acp-21-4779-2021 Atmos. Chem. Phys., 21, 4779–4796, 2021You can also read