Sensitivity Analysis in the Life-Cycle Assessment of Electric vs. Combustion Engine Cars under Approximate Real-World Conditions - MDPI
←
→
Page content transcription
If your browser does not render page correctly, please read the page content below
sustainability

Article
Sensitivity Analysis in the Life-Cycle Assessment of
Electric vs. Combustion Engine Cars under
Approximate Real-World Conditions
Eckard Helmers *, Johannes Dietz and Martin Weiss
 Department of Environmental Planning and Technology, Environment Campus, University of Applied Sciences
 Trier. PO Box 13 80, 55761 Birkenfeld, Germany; j.dietz@umwelt-campus.de (J.D.); weisstn@mailbox.org (M.W.)
 * Correspondence: e.helmers@umwelt-campus.de

 Received: 16 December 2019; Accepted: 3 February 2020; Published: 9 February 2020

 Abstract: This study compares the environmental impacts of petrol, diesel, natural gas, and
 electric vehicles using a process-based attributional life cycle assessment (LCA) and the ReCiPe
 characterization method that captures 18 impact categories and the single score endpoints. Unlike
 common practice, we derive the cradle-to-grave inventories from an originally combustion engine
 VW Caddy that was disassembled and electrified in our laboratory, and its energy consumption
 was measured on the road. Ecoivent 2.2 and 3.0 emission inventories were contrasted exhibiting
 basically insignificant impact deviations. Ecoinvent 3.0 emission inventory for the diesel car was
 additionally updated with recent real-world close emission values and revealed strong increases over
 four midpoint impact categories, when matched with the standard Ecoinvent 3.0 emission inventory.
 Producing batteries with photovoltaic electricity instead of Chinese coal-based electricity decreases
 climate impacts of battery production by 69%. Break-even mileages for the electric VW Caddy to pass
 the combustion engine models under various conditions in terms of climate change impact ranged
 from 17,000 to 310,000 km. Break-even mileages, when contrasting the VW Caddy and a mini car
 (SMART), which was as well electrified, did not show systematic differences. Also, CO2 -eq emissions
 in terms of passenger kilometers travelled (54–158 g CO2 -eq/PKT) are fairly similar based on 1 person
 travelling in the mini car and 1.57 persons in the mid-sized car (VW Caddy). Additionally, under
 optimized conditions (battery production and use phase utilizing renewable electricity), the two
 electric cars can compete well in terms of CO2 -eq emissions per passenger kilometer with other traffic
 modes (diesel bus, coach, trains) over lifetime. Only electric buses were found to have lower life cycle
 carbon emissions (27–52 g CO2 -eq/PKT) than the two electric passenger cars.

 Keywords: BEV (battery electric vehicle); LCA; life cycle assessment; real-world driving; real-world
 life-cycle inventory; battery production; battery second use; battery size; break-even mileages; vehicle
 size effect; climate change impact; traffic modes; passenger kilometers travelled; diesel; electric bus

1. Introduction
     Transport accounts for 23% of the global energy-related CO2 emissions. Unlike other sectors,
emissions from transport did not decrease but continued to increase annually by 2.5% on average
between 2010 and 2015 [1]. In the European Union (EU), road transport in 2012 represented 82% of
the total transport-related final energy use, with passenger cars contributing 60% to this share [2].
Electrification is seen as an essential element to decrease CO2 emissions and resource use of the
transport sector [1]. Some institutions project “zero emissions” when full electrification is achieved [3].
Zero carbon emissions, however, can only be achieved during the use phase of a vehicle and only
if understood as the absence of direct emissions from a combustion engine. Considering that any

Sustainability 2020, 12, 1241; doi:10.3390/su12031241                     www.mdpi.com/journal/sustainability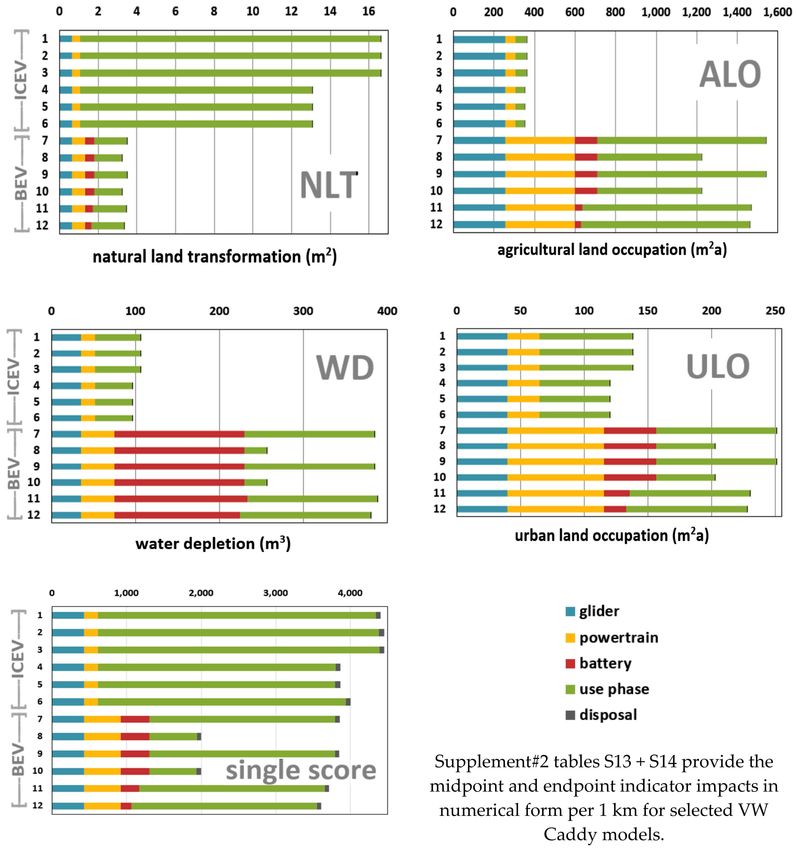
Sustainability 2020, 12, 1241                                                                       2 of 31

electricity source, even a renewable one, will lead to some life cycle carbon emissions, an electric
vehicle can deliver low, but never zero, carbon emissions [4]. However, future transportation modes as
well as new vehicles need to be decarbonized as much as possible. The degree of de-carbonization can
be best evaluated through standardized life-cycle assessment (LCA) in addition to the more common
well-to-wheel analysis (for a comparison, see Moro and Helmers 2017 [5]). Although many LCA studies
solely focus on climate change [6], further impact categories must be considered to avoid unintended
environmental consequences. This is a lesson learned from the European transport emission policy of
the past two decades: the primary focus on saving CO2 led to EU policy boosting diesel cars to the
disadvantage of petrol cars [7,8], which resulted in massive additional NOx emissions and subsequent
health costs [9,10]. In this context, it is important to realize that, so far, during LCA modelling,
real-world NOx emissions are not considered (and integrated in databases); instead, type-approval
data from laboratory measurements are considered, which are lower by approximately one order of
magnitude (e.g., reference [11]). So far, the insights resulting from the so-called “diesel scandal” [12]
have not yet entered the life-cycle modelling of combustion engine vehicles, which may falsify the
comparison of electric and combustion engine vehicles to some extent: While the NOx emissions
of petrol cars were reduced continuously according to the legislative emission thresholds following
Euro 1 to Euro 6 stages in Europe, the NOx emissions of diesel cars in 2012 were even higher than
in 1993. These striking insights first became public due to two long-term remote-sensing campaigns in
Europe collecting hundreds of thousands of measurements (e.g., references [11,13]). Real-world NOx
emissions of diesel cars did not begin to decrease before the year 2015. Corresponding to this, there
has been no significant difference until 2015 in the NOx emissions between Euro 5 and Euro 6 diesel
cars [14].
      In this context, it appears essential to cover not only the climate change impact, but many more
impact categories in LCA of electric vehicles. However, this information is largely missing. From our
counting, only a minority of 23 studies out of 85 peer-reviewed LCA studies on electric cars, published
between 2010 and 2019, cover on average seven impact categories beyond climate change impact (e.g.,
the multi-impact studies from references [15,16]). Our own earlier study on electrifying a SMART [17]
is the only one covering all 18 ReCiPe impact categories so far.
      Although common agreement seems to exist that electric vehicles are the key technology to shift
road traffic into a sustainable future [18,19], there is a discussion with regard to optimizing them.
The electrification of luxury class or sport utility vehicles (SUVs) has been criticized because of huge
batteries needed and corresponding weight increases [20,21]. Ellingsen et al. [22] investigated this size
effect, concluding that smaller electric vehicles (EVs), equipped with smaller batteries, are more quickly
overtaking combustion engine cars with respect to the carbon footprint (also see [23]). The question
arises whether these problems have been adequately addressed in detail by life cycle assessment so
far—almost all LCA reports quantifying the impacts of electric vehicles are based on standardized
inventories and type approval registration data (reviewed in reference [24]). The vast majority of
LCA results published so far is based on virtual (non-existing) vehicles traced back to the inventory
of a VW Golf A4 from the year 2000, and still employed 17 years later (e.g., reference [25]). Also the
fuel/electricity consumption in the use phase has been standardized (e.g., [26]), which, depending on
the carbon footprint of the energy supply, can be the dominating impact throughout the life cycle (e.g.,
references [4,27]). Within the 85 peer-reviewed LCA studies published between 2010 and 2019, we
could not identify another study (next to our own earlier study from 2017) about electrifying a SMART
(Helmers et al. [17]) that captures the impacts of a real vehicle. In the same selection, only four LCA
studies included a documentation of full material cakes of the vehicles [28–31].
      High divergences between type-approval and real-world CO2 -emissions are well known for
conventional passenger cars in the EU reaching above 40% in the year 2015 [32,33]. When it comes
to electric cars, the type-approval to real-world deviations of measured electricity consumption as
quantified in Europe range from +25% in Germany [34] to +34% in Finland under summer conditions,
on top of that +31% when switching from summer temperatures to −20 ◦ C in winter [35]. Concluding,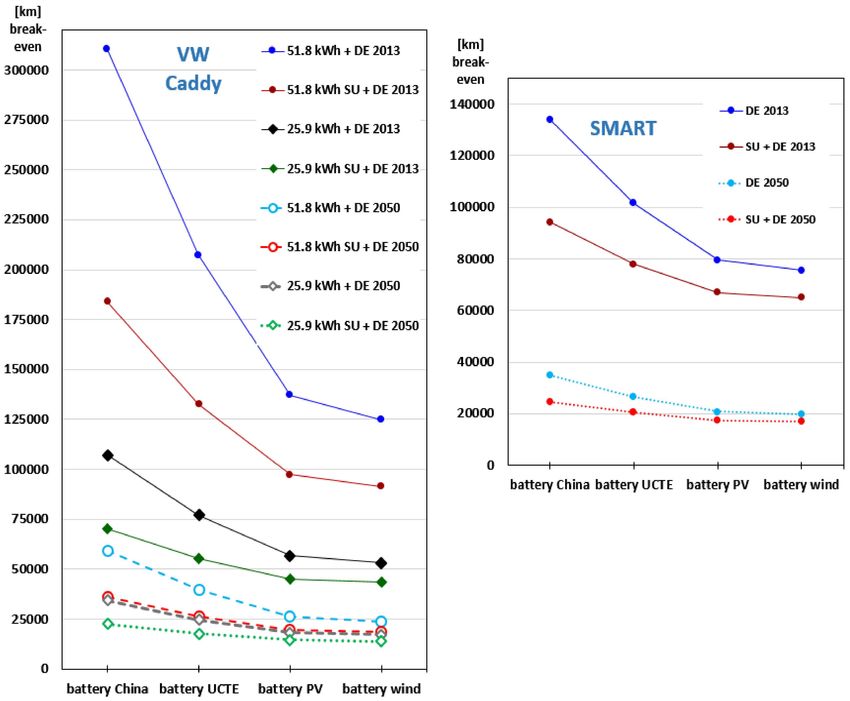
Sustainability 2020, 12, 1241                                                                       3 of 31

the common picture of electric cars’ life cycle impacts should be verified or refined based on real
existing vehicles. As for example, the influence of an EV’s size on its energy consumption and relative
environmental impacts has to be analyzed under real-world conditions.
      Disappointingly, even IPCC reports modelling the climate change impact of the transportation
system only mention infrastructure and production costs but did not quantify or consider them in the
most recent report [36]. Moreover, their modelling seems to be based on vehicle type approval CO2
emissions [36] measured under laboratory conditions and reported by the manufacturers, which still
seems to be common practice when it comes to discussing vehicle emissions in the public, however
misleading it is [37].
      Battery production has been identified as causing the second most important impact in an electric
vehicles’ lifecycle (e.g., references [4,28,38]), next to the use phase. When the life cycle impacts of
the first electric vehicles were modelled, there were doubts whether the battery would survive more
than 100,000 to 150,000 km [39]. Today, batteries can offer > 90% of the original capacity even at
200,000 km [40,41]. Use phase mileages between 150,000 and 200,000 km were most often applied in
scientific reports [26,42].
      In a predecessor project to the present report, the impact of an electric SMART’s Li-ion cells
produced in China was found to dominate throughout the life cycle across five impact categories,
which was traced back to electricity supply dominated by coal fired power plants in China [17]. To
conclude, electricity provision alternatives during battery production are expected to establish an
essential sensitivity parameter when it comes to the question, if and when—at which mileage—an
electric vehicle trumps a combustion vehicle in lifetime impact. We believe such investigations are
essential in the present situation in which massive investments into battery cell production are made
globally. Additionally, a further opportunity to decrease impacts from battery production evolved.
Today, batteries do not have to be recycled after having reached 80% of their initial state-of-health, a
value which is defined as the batteries’ end-of-life criterion in a car [43]. Actually, the battery can be
further moved to a stationary storage for fluctuating renewable electricity [44–46]. The influence of
this battery second use case on the BEV’s life cycle impact must be examined accordingly.

2. Materials and Methods

2.1. General Purpose
     We address the shortcomings described above by compiling our own life-cycle inventory data
obtained from a laboratory project in which a SMART Fortwo and a Volkswagen Caddy were electrified
between 2011 and 2016. In a unique point of view, we can thus compare combustion engine and electric
alternatives based on the same vehicle gliders converted in our laboratory.
     The energy consumption of these vehicles was measured on the road, and the material cakes of
these cars were documented during dismantling and re-assembly for the most part. Thus, this project
seeks to deliver an alternative materials cake for future modelling. Major impact results obtained from
the SMART conversion project were already published [17], and the impact assessment of the VW
Caddy is reported here and compared with that of the smaller SMART vehicle.
     The results contribute new and more accurate life-cycle inventory data, capturing the actual
environmental impacts of electric vehicles under real-world operating conditions on the road.

2.2. Modelling Approaches

Goal, Scope, Software, and Databases
     The goal of this study is to provide a comparative LCA of an electric car vs. combustion engine
counterparts based on conditions which are as close to real-world as possible. The following scope
items have been defined: BEV and ICEV versions are 1:1 comparable because they were (dis-) assembled
in our workshop and tested under real-world conditions. The foreground and background systems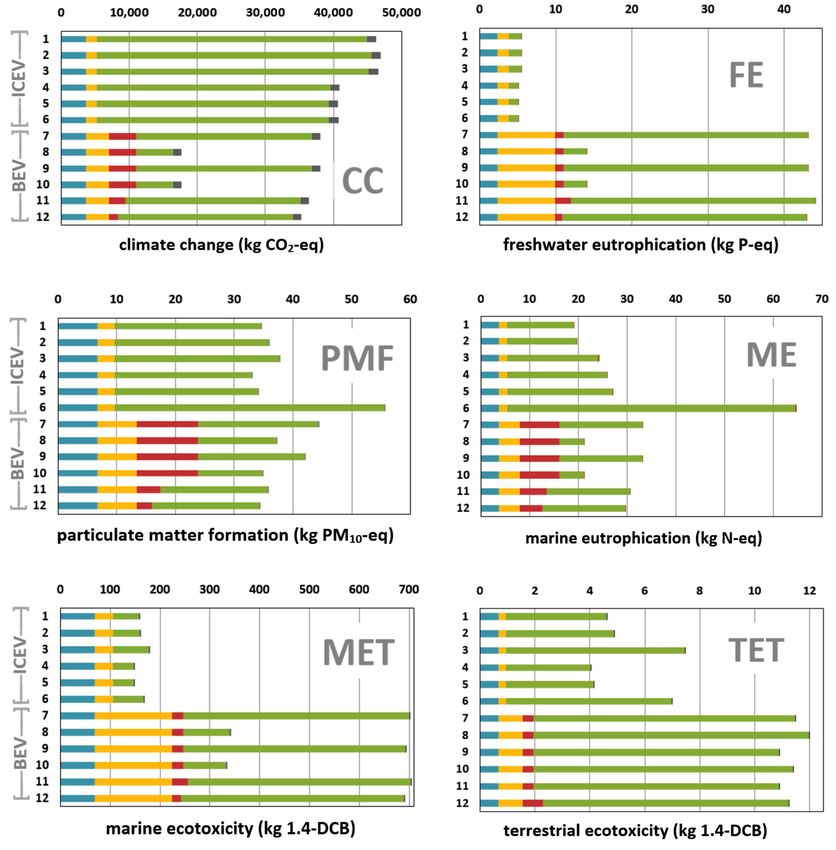
Sustainability 2020, 12, 1241                                                                                4 of 31

and the boundaries are shown in Figure 1 and are similar to those in the previous study [17]. Our
models describing the combustion engine vehicles included 409 input/intermediate/output materials,
emissions, wastes, and amounts of energy (electric VW Caddy: 413). Also, 143 process modules
(transitions) describe the system of the combustion engine vehicles (electric VW Caddy: 262).

      Figure 1. Product system as modelled in this project (modified from Habermacher 2011 [47], which is
      based on Althaus and Gauch, 2010 [48]). ICEV = integrated combustion engine vehicle, BEV = battery
      electric vehicle, UCTE electricity = see Table 3, CNG = compressed natural gas, DE 2013/2050 electricity
      = see Table 1. For metal recovery percentages, see Supplement #1 in Supplementary Materials.

     The use phase is defined here as 150,000 km of mileage. For climate change (CC) impact modelling,
we considered an extended use phase of 200,000 km in addition.
     For quantifying break-even mileages, no limit was put on lifetime mileage. Continuous CC
impacts per mileage driven by both the electric SMART and the electric VW Caddy were calculated
and compared with the ICE versions until the mileages when the BEV undercuts the CC impact of the
respective ICE versions (break-even). At this, the four different battery production scenarios (battery
China, UCTE, PV, wind), the two different electricity mixes in the use phase (DE 2013 and DE 2050) as
well as the battery second use case (with and without) and, additionally for the Caddy, two different
battery sizes (25.9 and 51.8 kWh) were considered.
     Altogether, we quantified the following sensitivity parameters and combined them:

•     Size of the car (small vs. mid-sized, carbon footprint only);
•     Emission profile (laboratory based vs. real-world);
•     Fossil fuel choice (diesel, petrol, natural gas);
•     Electricity choices during battery production and use phase;
•     Battery size and battery second use;
•     Mileage (150,000 and 200,000 km).

     For the impact assessment, the ReCiPe method (2012 version) was applied, and its results
covering all 18 impact categories are reported here. Results have been recalculated in terms of impact
equivalents/km as functional unit, which means the life cycle impact was divided by 150,000 km or
200,000 km, respectively, where useful (results available in Tables S13 and S14 in Supplement #2 in
Supplementary Materials).
     The LCA modelling was performed between 2015 and the end of 2018 with Umberto 5.6 software
connected to the Ecoinvent (Ei) database. The relevant Ei modules are listed in the Table S12 in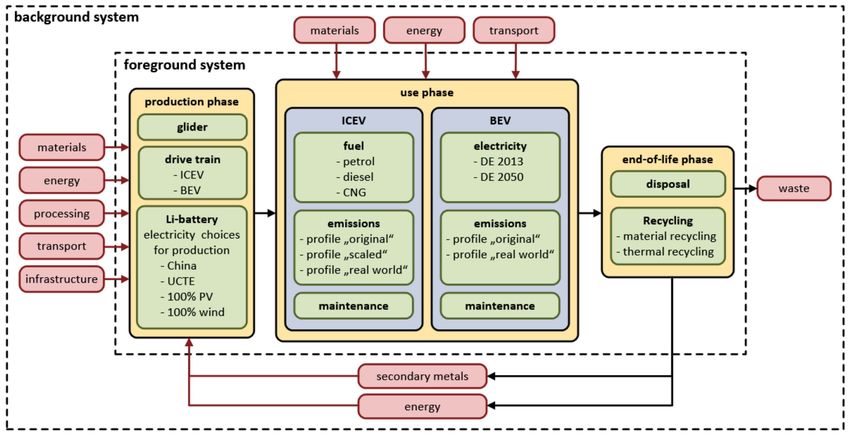
Sustainability 2020, 12, 1241                                                                        5 of 31

Supplement #2 in Supplementary Materials. Ei is presently operating version 3.6 (Ecoinvent 2020) [49],
while version 2.2 is still available for modelling. Continued modelling based on Ei 2.2 data was
essential to maintain comparability with the earlier sister project [17]. Additionally, a majority of
current scientific LCA literature on electric vehicles is based on Ei 2.2 (e.g., [22]). However, to enable
the connection to the Ei version 3 database, inventories used here are updated with emission numbers
specified under Ei 3 as an additional sensitivity (see below); Section 3.1 provides a comparison of
impacts from both inventories.
     Sensitivity combinations: guide to the principal modelling approaches (VW Caddy)
(A) ICEV (Vehicle #1–6, Table 1)
     The three combustion engine choices are based on the petrol version, while the diesel and natural
gas vehicle just deviates in the use phase inventory. When it comes to modelling the use phase of
the combustion engine vehicles (#1–6, Table 1) they are based on the Ecoinvent modules “operation,
passenger car, petrol, EURO 5” and “operation, passenger car, diesel, EURO 5,” respectively. Modelling
the ICEV use phase is split into three alternatives considering the fuel consumption, combustion engine
and abrasion emissions:
     (1) “Euro 5 original” indicates that the original Ei emission module is kept, but on input side
the fuel consumption and on the output side the corresponding CO2 emissions were adjusted to
the respective numbers measured. This corresponds to the standard (recommended) modelling
attempt, but the approximation to the reality is limited—although many emissions vary relative to fuel
consumption, they are kept constant here.
     (2) “Euro 5 scaled” (Table 1), on the other hand, indicates that all combustion engine emissions
are linearly corrected relative to the fuel consumption. This is performed by quantifying a
mileage to run the model corresponding to the individual fuel consumption specified vs. the
standardized fuel consumption fixed by the module. Both modelling cases due to (1) and (2) represent
simplifications—neither are emissions always constant, nor are they fully to scale with respect to the
fuel consumption.
     (3) The third modelling alternative of the combustion engine vehicle (“Euro 5 real-world”) is
based on “Euro 5 original” but includes two deviations. On the one hand, a high number of additional
chemical species were manually added to the modules “operation, passenger car, petrol, EURO 5”
and “operation, passenger car, diesel, EURO 5,” respectively. The respective emission numbers are
based on the Ei 3 amendments as published by Simons (2013) [50]. On the other hand, and specifically
for the diesel car (#6, Table 1), the emissions of a few species were updated to better describing
real-world emissions as documented in recent scientific publications (see more detailed explanations
in Section 2.3.6).
(B) BEV (vehicle #7–13, Table 1).
      Quantifying the abrasion emissions of the electrified VW Caddy is based on two alternatives only.
First, the use phase emission modelling is based on the Ei module “operation, passenger car, electric,
LiMn2 O4 .” Generally, we modified this Ei module by updating the weight of the vehicle (which is
1632 kg in the original module) thus scaling all use phase emissions of the electric vehicle, resulting
in the emission profile “abrasion original” (Table 1). In a second step multiple additional chemical
species taken from Ei 3 (provided in Simons 2013) [50] were added, this way building an emission
profile called “abrasion real-world” (Table 1, see more detailed explanations in Section 2.3.6).
      Finally, the EV is modelled based on two alternative electricity choices depicting the use phase: (1)
Average net electricity from 2013 in Germany, which, regarding its power plant mix and climate change
(CC) impact, is close to the European average mix [5]. (2) A realistic German renewable electricity mix
of the future, called DE 2050 (Table 1). Additionally, the modelling of the electric vehicles distinguishes
four different types of electricity provision during battery production (Table 1). For explanations see
Section 2.3.3.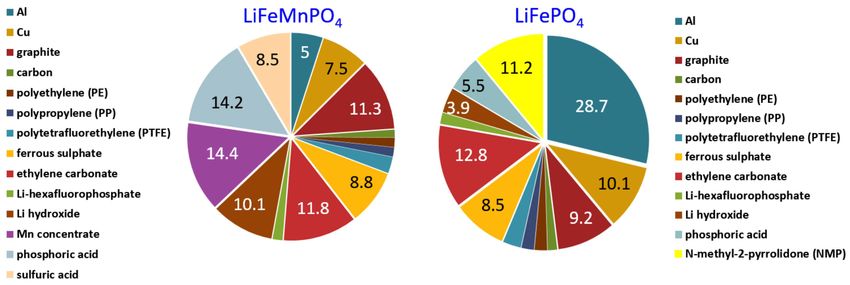
Sustainability 2020, 12, 1241                                                                                            6 of 31

                                Table 1. Directory of main models quantified (VW Caddy).

                                                Main Sensitivity Parameters (1–3)
      VW Caddy                                                                                                   Vehicle
                                1: Electricity Choice During                                 3: Use Phase
   Propulsion (Fuel)                                                                                            Number #
                                Battery Production (See also       2: Emission Profile        Electricity
                                           Table 3)                                             Choice
                                                                      Euro 5 original                                1
          Petrol                                                       Euro 5 scaled                                 2
                                                                    Euro 5 real-world                                3
  Natural gas (CNG)                                                 Euro 5 real-world                               3a
                                                                      Euro 5 original                                4
         Diesel                                                        Euro 5 scaled                                 5
                                                                    Euro 5 real-world                                6
                                                                                               DE 2013 *             7
                                                                     abrasion original
                                           China                                              DE 2050 **             8
         Electric                                                                              DE 2013 *             9
                                                                   abrasion real-world
                                                                                              DE 2050 **          10/10a
                                     European average              abrasion real-world         DE 2013 *            11
                                         100% PV                   abrasion real-world         DE 2013 *            12
                                        100% wind                  abrasion real-world         DE 2013 *            13
      (*) DE 2013 = German grid electricity of 2013, 707.4 g CO2 -eq/kWh (Note: this includes self-consumption of power
      plants and all losses along the grid); (**) DE 2050 = future renewable grid electricity mix proposed for Germany,
      130.6 g CO2 -eq/kWh (for details and justification see Helmers et al. 2017 [17]). For electricity carbon footprints
      during battery production see Table 3. Model 3a extrapolated to CNG (compressed natural gas) use based on Model
      3. Model 10a: battery capacity doubled. All models based on materials substitution as EOL modelling choice.

2.3. Inventory Development

2.3.1. Vehicle Composition, Assembly, and Use
     The material cakes were developed from the ground up which starts at material composition
data provided by manufacturers. Such data are usually restricted or rudimentary and need to be
supplemented by own measurements and literature information. This is the case for the VW Caddy
in total (Table 2): Volkswagen published a shortened composition specifying the percentages of nine
groups of materials—steel and ferrous metals, light metals, non-ferrous metals, special metals, polymer
materials, process polymers, further materials, electronics and electrics, operating materials, and
accessories (source B in Table 2). These data were taken as a frame to develop a more detailed material
cake (Tables S1–S5 in Supplement #2 in Supplementary Materials), particularly by utilizing detailed
composition data provided by Habermacher (2011) [47], who also worked on the VW Golf (a sister
model of the VW Caddy investigated here). Propellants were removed because the material balance
refers to an empty vehicle. Generally, percentages of materials compiled this way were related to the
measured mass of the particular car electrified in the laboratory and to its dismantled components
individually weighed. Additionally, the materials composition of the engine, the gearbox, and other
parts of the vehicle have been quantified separately and then related to the overall composition data.
The combustion engine and the original gearbox of the VW Caddy were not disassembled but were
instead sold and re-used. The materials composition of the petrol engine was obtained from a Renault
publication because the combustion engine specified was very similar in replacement, weight and
power (Table 2 and Supplement #1 in Supplementary Materials).
     In the next step, the materials quantified were allocated to Ei modules (see Supplements #1 and #2
in Supplementary Materials). The amount of energy necessary for glider production was taken from
Habermacher (2011) [47] and rescaled. Missing data (e.g., process loss of materials, manufacturing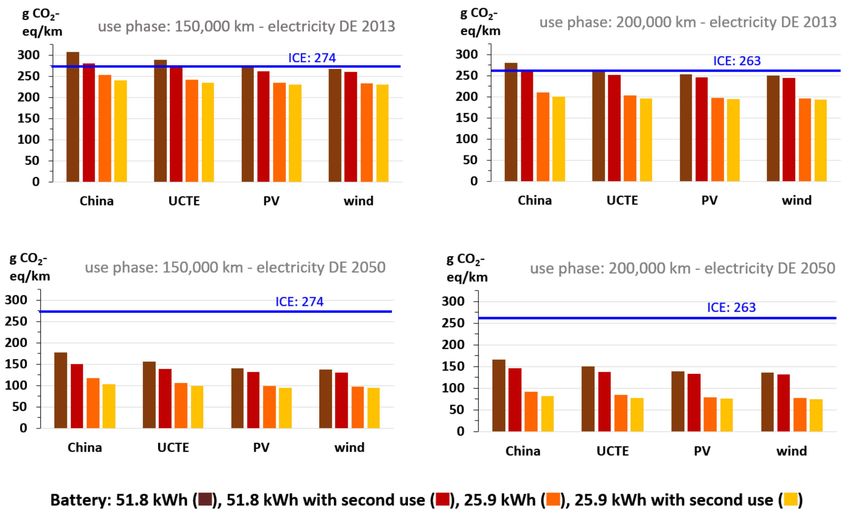
Sustainability 2020, 12, 1241                                                                                                7 of 31

processes) were taken from Notter et al. (2010) [51]. Expenditures due to transportation of all parts
from the respective factories to the Volkswagen plant in Poland (original fabrication of the Caddy) and,
later, to the workshop for electric conversion were considered in the inventory (Table 2).
      All VW Caddy ICEV versions are modelled based on the same material cakes of the petrol
version, as displayed in Table 2. The material cake of the SMART electrified earlier in our laboratory
is first published here and contrasted with that of the VW Caddy (see Supplementary Materials).
Electrification procedures and technologies were similar in both cases. The only technical difference
between the two vehicles was that the SMART kept the original gearbox (in which one gear was
fixed), while a specialized one-speed gearbox was mounted during the electrification of the VW Caddy
(Table 2).

      Table 2. VW Caddy* production inventory guide (based on a petrol engine vehicle which was
      subsequently electrified in the author’s laboratory). For more detailed inventory data, particularly of
      the electrified vehicle, see the Supplements #1 and #2 in Supplementary Materials.

                                                      Location of      Determination of
                             Component
      Category                                        Production         Weight and        Composition Details (Total Weight)
                            (Specification)
                                                      (Distances)       Composition
                                                   200 km away from                         see Tables S1 and S2 in Supplement
        Glider                                                              A, B, C
                                                    Poznań, Poland                           #2 in Supplementary Materials
                          Motor (1.6L-petrol                                                 (157 kg) 70.2% conventional steel,
  ICEV powertrain       engine, 75 kW, 148 Nm,         Salzgitter,                         17.3% Al, 6.5% plastics, 2.3% stainless
                                                                            A, D, E
    (for complete       manufacturer ID: BGU           Germany                                steel, 1.1% rubber, 0.5% Cu, 1.5%
   composition see              196175)                                                       polyamide, 0.6% polypropylene
   Tables S3–S8 in                                                                         (38.5 kg) 30.9% Al, 69.1% high-tensile
                                gearbox            Kassel, Germany           A, E
  Supplement #2 in                                                                                         steel
   Supplementary
                                                                                            (16.7 kg) 68.3% Pb, 14% H2 O, 8%
      Materials)                                       Hannover,
                           Pb battery (61 Ah)                                A, F          H2 SO4 , 4.1% PP, 2% fiber glass, 1.9%
                                                       Germany
                                                                                              PE, 1% Cu, 0.7% Sb, 0.03% As
                         remaining parts (e.g.,
                                                                                           (102.6 kg) see Table S5 in Supplement
                        starter, exhaust system,    400 km average            A
                                                                                              #2 in Supplementary Materials
                              fuel pump)
                         Motor (FIMEA type N                                               (128 kg) 34.4% Al, 52.3% high-tensile
                                                     Liscate (Italy)   manufacturer data
                          80, 65 kW, 500 Nm)                                                    steel, 10.95% Cu, 2.35% PE
   BEV powertrain
    (for complete       Gearbox (Novatec AXLE       Palazzuolo sul                          (27 kg) 30.9% Al, 69.1% high-tensile
                                                                             A, E
   composition see        ZG0302 TG050200)           Senio (Italy)                                         steel
   Supplementary           Pb battery 26 Ah
    Tables S6–S8)                                                                          (8.8 kg) composition equally to ICEV
                          (RPTechnik, type         Rodgau (Germany)          A, F
                                                                                                        Pb battery
                         RPower OGiV 12260)
                           powerpac (voltage
                                                                                                (23 kg) composition due to
                           converter, inverter,      Ranica (Italy)           A
                                                                                                 Habermacher (2011) [47]
                             control device)
                          charger (TC Charger                                                   (20 kg) composition due to
                                                   Hangzhou (China)          A, C
                        type TCCH-H192V-36A)                                                     Habermacher (2011) [47]
                           BMS (LIGOO type                                                  (7.3 kg) 50% Cu, 40% stainless steel,
                                                     Hefei (China)           A, G
                              EK-FT-12)                                                            10% integrated circuits
                          remaining parts (e.g.                                                          (138.3 kg)
                         cables, holders, water     400 km average            A              see Table S8 in Supplement #2 in
                         pump, vacuum pump                                                       Supplementary Materials
              Final assembly (ICEV)                 Poznań (Poland)          A            detailed weight information provided
                                                                                             in the Supplements #1 and #2 in
                                                      Birkenfeld
    Final assembly (BEV), electric conversion                                 A                  Supplementary Materials
                                                      (Germany)
      (*) VW Caddy Life, Type 2K, first registration 2005, electric conversion 2013–2015 at mileage 45,000 km. Detailed
      composition data in Tables S1–S10 in Supplement #2 in Supplementary Materials. (A) own measurements. (B) VW
      (2008) [52]. (C) Habermacher (2011) [47]. (D) Renault (2011) [53]. (E) Notter et al. (2010) [51]. (F) Hawkins et al.
      2013 [15] (G) Majeau-Bettez et al. (2011) [54]. PE = Polyethylene, PP = Polypropylene.

2.3.2. Use Phase Energy Consumption
    For the VW Caddy, we quantified a consumption of 8.89 L petrol/100 km before the electric
conversion and 23.57 kWh/100 km afterward (averaging operation in city, rural, autobahn equally,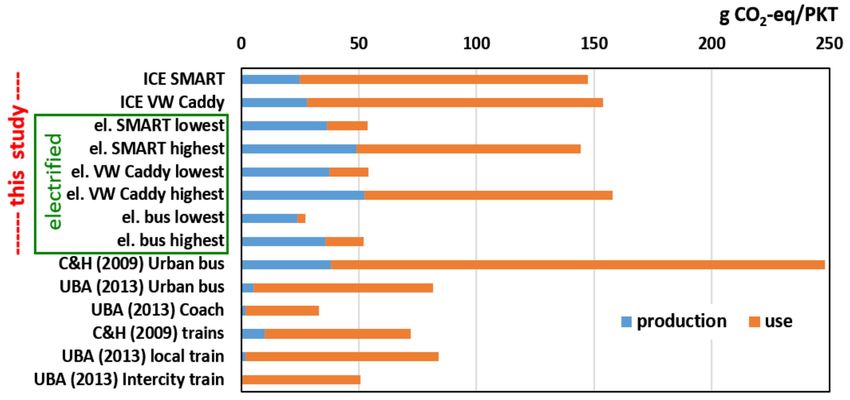
Sustainability 2020, 12, 1241                                                                                          8 of 31

including 8% of charging losses as measured for the EV). The same route of 94 km length was driven
with the vehicle before and after electrification to quantify the energy consumption. We modelled
with a consumption of 7.02 L/100 km for the analogous 77 kW-diesel model based on 77 vehicles by
www.Spritmonitor.de at the time of database access (2015) [55].
     As for the CNG consumption of the natural gas model, this is based on an 80 kW Caddy version
produced by Volkswagen AG since many years. The German internet platform Spritmonitor.de
(2018) [56] revealed a CNG consumption of 5.99 kg CNG/100 km on average, based on measurements
from 456 cars on the streets. The analogous data of the mini car SMART Fortwo are 5.3 L petrol/100 km
before, and 13.4 kWh/100 km after electric conversion, respectively [17]. Consumption data taken
from internet platforms like Spritmonitor.de (2018) allow to approximate a representative energy
consumption, which is much more real-world close than the fuel consumption specified due to type
approval of a vehicle (e.g., references [33,57]).

2.3.3. Electricity for Battery Cell Production
      A major impact during battery production stems from the high amount of electricity spent in
the Li-Ion cell making. We base the electricity consumption during cell production on Majeau-Bettez
et al. [54,58]. Interestingly, Majeau-Bettez et al. [58] assume the same electricity demand in the cell
production (27 MJ/kg) for both LiFePO4 and Li-ion cells based on a NiCoMnO2 -Chemistry (the latter
preferred by OEM carmakers).
      Whereas electric vehicles can charge electricity from diverse sources and at varying locations,
battery cell production takes place in specific factories. Such production plants may locally be provided
by 100% renewable electricity, which is why we considered 100% PV and 100% wind electricity,
respectively, as modelling choices (Table 3). A battery cell production under provision of 100%
PV electricity has been promised by Tesla, Inc. (“gigafactory”; see Tesla, 2018) [59]. A battery cell
production under provision of 100% wind electricity is still missing, to the best of our knowledge, but
might be a future option in Europe.

                 Table 3. Electricity provision alternatives assumed during battery cell production.

                                                              European Average (UCTE b
                  Label                        China              2004, as Utilized by
                                                                 Ecoinvent until 2014)                PV           Wind
   Fossil Electricity                          78.5   a                    26.7   c
                       Coal Fossil
    Production at          (All)                      a
                                               81.7                        51.1 a
   Power Plant (%)
           g CO2 -eq/kWh d                      1180                        531                      92.5           15.8
                                                                                                    “medium voltage, at
                                            “medium
   Description/ Ecoinvent modules                               “medium voltage, at grid,          grid [DE]” (Ecoinvent
                                            voltage, at
               applied                                                UCTE b “                     2.2), adapted to 100%
                                           grid”, China
                                                                                                      renewable each
      (a) Frischknecht et al. 2007 [60]; (b) UCTE = Union for the Coordination of the Transmission of Electricity, now
      ENTSO-E, see www.entsoe.eu. (c) EU (28) in 2013, taken from taken from Fehrenbach et al. 2016 [61]. (d) quantified
      using independent LCI (Life Cycle impact) models based on one kWh of each electricity choice. PV = photovoltaic.

      The Li-ion cells for the VW Caddy were in fact produced in China with carbon-intensive electricity
of 1180 g CO2 -eq/kWh (Table 3). We call this “Chinese electricity” in the following, while acknowledging
that there is a strong variability in the carbon footprint of electricity production throughout China [62].
However, most of the Chinese battery production is located in the coastal provinces of Guangdong
and Jiangsu [63], whose reported electricity mix and resulting carbon footprint closely resembles the
Chinese electricity footprint utilized in this work, even if losses in the grid are considered [62]. As a
comparison, we also ran a model that assumed battery production using UCTE electricity (Table 3)
from the year 2004, the basic European electricity mix provided under the Ei database in 2014 [17]. This
electricity mix has a carbon footprint of 531 g CO2 -eq/kWh, close to the average European electricity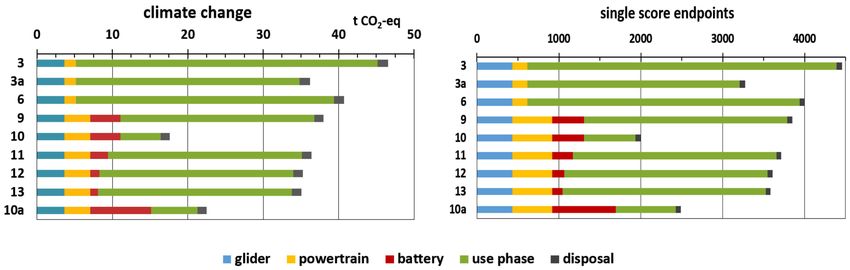
Sustainability 2020, 12, 1241                                                                              9 of 31

production impact recently reported [5] and similar to the European electricity mixes applied for
battery production by Majeau-Bettez et al. [54] and Ellingsen et al. [64], allowing the connection of our
results to these data published. Until today, the carbon footprint of the European electricity production
has remained almost unchanged when compared to UCTE 2004. In 2018, it amounted to 521.74 g
CO2 -eq/kWh quantified by LCA (AIB 2019) [65].
     Two further energy options editing the Ei module “electricity, medium voltage, at grid [DE]”
are considered in additional models, namely 100% PV and 100% wind electricity (see Table 3). A
number of European countries base their renewable electricity production mainly on wind energy, and
there are regions in central/northern Europe with a surplus in wind energy production [66], such as
northern Germany.

2.3.4. Battery Chemistry Alternatives
     The battery impact covers the Li-ion cells only (as equally handled by Majeau-Bettez et al. [58]
2011b), while the cell container is allocated to the powertrain in our inventories. LiFePO4 -cells of the
type SE180AHA from CALB (China) were utilized during electrification of the VW Caddy achieving
25.9 kWh of capacity compared to 14 kWh of capacity installed in the earlier project when electrifying
the Smart [17]. As an alternative available at the time of vehicle electrification, Zhejiang GBS (China)
produced LiFeMnPO4 -cells (type GBS-LFMP200AH). Prior to deciding for one of these cells, their
respective battery chemistry impacts were modelled and compared.
     The chemical inventories of the Li-Ion cells were generated starting with simplified chemical
compositions provided by the battery producers when delivering the cells. CALB, for example,
specified mass percentages each for the elements Fe, P, Li, Cu, Al, F, C, Mn, Ca, and Na and for the
compounds polyethylene and graphite. Zheijang GBS specified mass percentages for Al, Cu, graphite,
LiFeMnPO4 , lithiumhexafluoro-phosphate, and polypropylene. Although both compositions provided
by the battery makers were certified to specify 100% of composition, essential components were missing
as information on the chemical species. We kept the elemental composition as it was specified by the
battery companies, but filled in the gaps in battery chemistry based on data by Majeau-Bettez et al. [54]
and Yang et al. [67], respectively.
     Both battery types contain the same inorganic materials with the exception of manganese (Mn
concentrate, Figure 2), of which 14% is contained only in the LiFeMnPO4 battery; however, the
proportions of materials composing the Li-ion cells vary greatly between the battery types. (Figure 2).
LiFePO4 -cells, on the other hand, contain much more Al (Figure 2). Detailed composition data are
provided in Tables S9 and S10 in Supplement #2 in Supplementary Materials). We decided for the
LiFePO4 -cells due to the reasons discussed below.

      Figure 2. Material cakes of two Li-ion cells examined prior to the electric conversion of the VW Caddy
      (mass percentages displayed). For detailed composition see Tables S9 and S10 in Supplement #2 in
      Supplementary Materials.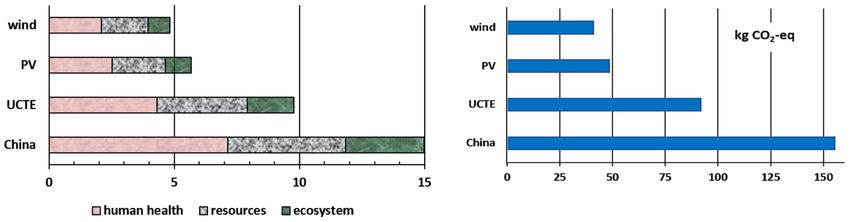
Sustainability 2020, 12, 1241                                                                         10 of 31

      Prior to the electrification of the VW Caddy in the university’s workshop, the composition of
the two Li-Ion-cells was modelled in order to identify possible impacts on the vehicle’s life-cycle
performance (the LiFePO4 -cells from CALB were earlier also taken electrifying the SMART, see Helmers
et al. [17]). The impact comparison of LiFePO4 - and LiFeMnPO4 battery cells exhibited the biggest
differences in the midpoint category of mineral resource depletion (MRD), varying over several orders
of magnitude. At first glance, this indicates that the choice of minerals/metals should have a strong
influence in this category. Battery cell materials like Al, carbon, graphite, ferrous sulphate, and
phosphoric and sulphuric acid look non-critical (0.00145–0.29 kg Fe-eq/kg), while there are higher
MRD impacts from Li-hexafluorophosphate (2.38 kg Fe-eq/kg) and Cu (6.46 kg Fe-eq/kg), respectively.
Mn, however, scores the highest result with 76.6 kg Fe-eq/kg, being responsible for 88% of the overall
MRD impact based on LiFeMnPO4 -cells. However, this high MRD impact of Mn as indicated by the
ReCiPe database is to be questioned. Mn is among the most abundant elements in the Earth’s crust [68].
We conclude that the MRD differences identified here are not specific enough to lead a decision for
or against one of the two chemical battery compositions. The CC relevant production impacts of the
respective minerals are relatively similar (1–8.3 kg CO2 -eq/kg), within one order of magnitude. We
conclude, on the basis of both CC and MRD impacts, that there is no urgent need to keep away from
any one of the minerals listed here for battery production.
      We also checked the list of critical raw materials provided by the EU (2017) [69]. Among
battery-relevant materials, only cobalt and phosphorus are specified as critical raw materials (EU
2017). Cobalt is an essential component of prevailing commercial Li-ion cells based on NiCoMnO2
chemistry as commonly used in automotive applications. Co is under criticism as a battery component
because about 50% of cobalt on the world market stems from the Democratic republic of Congo, where
mines commonly use child labor [70]. Cobalt is the only metal mentioned here on which data about
availability and supply risks are extensively available due to an advanced LCA attempt [71]. However,
both the LiFe(Mn)PO4 and LiFePO4 cells examined here for possible EV application do not contain
Cobalt. The LiFePO4 cells we finally decided for do not contain Mn, and less phosphorus than the
LiFe(Mn)PO4 cells available for a comparable price.

2.3.5. Battery Second Use
      After use in electric vehicles, and prior to recycling, batteries may be transferred to stationary
applications as a storage buffer for fluctuating renewable electricity. According to Casals et al. [72], this
“second use” can decrease the vehicle’s carbon footprint caused by the battery by 50%. Although not
focusing specifically on the vehicle-related battery production impact, Ahmadi et al. [73] and Richa
et al. [74] confirmed this finding qualitatively. In a meta study, the reduction of the battery GHG
emissions attributable to the vehicle on a per-km basis was quantified to be 42% in case of a second
use (ICCT 2018) [75], based on data from Neubauer et al. [76]. Recently May et al. [77] estimated the
impact saving potential of a subsequent stationary use of the batteries at around even 50% of the
production impact of the vehicle in total. Bobba et al. [78] also identified such savings, but, as in all
other studies, very much depending on their specific scenario. We apply the second battery use here
as an extrapolation case, based conservatively on the assumption of 50% savings in GHG emissions
from battery production adjusted to the electric vehicle in case the battery is transferred to a later
stationary use.

2.3.6. Emission Profiles Development
     Ei has extensively revised the emission profiles when switching from Ei2.2 to version 3. Many new
parameters were added (Table 4), and the data of some parameters were changed. This is documented
in detail by Simons [50], from whom we have taken additional emission species and manually added
them to the respective Ei2.2 modules to build the “real-world” emission profiles of the electric and
conventional vehicles. Also, we evaluated the emission species for correctness, plausible magnitude
and, in a few cases, replaced them by more real-world-oriented numbers (Table 5). By modelling these
Sustainability 2020, 12, 1241 11 of 31
emission inventory alternatives, we can use them as sensitivity parameters and search for possible
effects changes.
Table 4. Details of emission profiles advancement as modelled in this work.
Emission Applied to Vehicle Number of Species
Propulsion Comment/Origin
Profile/Sensitivity #, see Table 1 Included
Euro 5 original, emissions to air: 25, to
1; 2; 4; 5 according to Ecoinvent 2.2
Euro 5 scaled water: 6, to soil: 6
ICEV emission species added
emissions to air: 63, to according to Ecoinvent 3,
Euro 5 real-world 3; 6
water: 31, to soil: 31 four diesel emission species
corrected (see Table 5)
emissions to air: 10, to
abrasion original 7; 8 according to Ecoinvent 2.2
water: 6, to soil: 6
BEV non-exhaust emission
emissions to air: 36, to
abrasion real-world 9–13 species added/adapted
water: 31, to soil: 31
according to Ecoinvent 3
Table 5. Corrections made to diesel exhaust emissions as taken from Ecoinvent 3*. (Added to the
emission profile “Euro 5 real-world,” diesel vehicle model #6, see Table 1.)
Ecoinvent 2.2
Ecoinvent 3 Corrected (Diesel
(Diesel Euro 5),
Species (Diesel Euro 5, Euro 5, Applied
and Applied for Comments, Sources
Emitted Simons 2013) [50], for Vehicle #6)
Vehicles #4+5
kg/km kg/km
kg/km
corrected value from sulphur
SO2 1.07 × 10⁻⁶ 1.06 × 10⁻⁶ 3.19 × 10⁻⁶ content in fuel plus lubrication oil
combustion (Helmers 2010) [79]
perhaps a data error in Simons
(2013) [50]. The corrected value is
CO (fossil) 5.09 × 10⁻⁴ 6.07 × 10⁻⁵ 2.55 × 10⁻⁴ calculated from the Ecoinvent 2.2
emission which should have been
halved due to Simons (2013) [50]
updated according to data from
NOx 2.00 × 10⁻⁴ 9.38 × 10⁻⁵ 8.63 × 10⁻⁴ remote-sensing campaigns
(Tate 2013) [80]
originally abrasion considered
only. We updated this emission
Particu-lates
7.82 × 10⁻⁵ 1.19 × 10⁻⁵ 3.84 × 10⁻³ according to data from
> 10 µm
remote-sensing campaigns
(Tate 2013) [80]
* Simons (2013) [50].
Simons (2013) [50] reported emission data of 40 species due to non-exhaust emission factors, as
employed by the new Ei3 database, divided according to the three sources tires, brakes, and road. We
have taken these abrasion emission numbers, kept those for tires and road, and added them manually
to the Ei2.2 BEV emission profile, building a new profile “abrasion real-world” (Table 4). An electric
vehicle causes the same resuspension of particles from the street, as well as tire and road wear abrasion,
compared to a combustion engine vehicle. Abrasion from brakes, however, can approach almost
zero in case the EV uses a strong regenerative braking (GreenCarCongress 2016 [81]). On the other
hand, recuperation may also be turned off in some EVs, which is why we still considered half of the
brakes-related emissions of ICEV within our EV emission profile, now called “abrasion real-world”
(Table 4).Sustainability 2020, 12, 1241 12 of 31
Eighteen of the 22 species emitted by EVs due to Ei2.2 are metals (abrasion); particulates (three
species) and heat are added as non-metal species. Still, in Ei3 all “non-exhaust” emission species are
metals/inorganic species/elements except for particulates and heat.
Species emitted by petrol cars according to Ei3 were manually added to the Ei2.2 module, building
the new “Euro 5-real world” emissions inventory (model #3, Table 1). However, when it comes to
the emission inventory of the diesel car (model #6, Table 1), additional corrections were made to
four emission species employed by Ei3 [50] due to significant real-world deviations noticed. These
corrections are partly changing the magnitude of the species’ emission and are displayed in Table 5.
Slight corrections were made to SO2 and CO: CO emissions increased by a factor of 4 (for explanation,
see Table 5). We base further corrections on new insights derived from long-term remote sensing
campaigns. However, vehicle emission remote sensing along streets covered only a few species so
far—CO, HC, NOx , NO2 , and PM10 (e.g., Tate 2013) [80]—while just the NOx and PM10 values reported
were usable. NOx , however, increased by a factor of 9 (Table 5). This is in accordance with multiple
scientific findings (e.g., references [11,13,82,83]).
The most substantial adjustment was made according to real-world PM10 —the number employed
here for the corrected inventory is 323 times higher than the original number (Table 5), which considers
particles from abrasion only. Particulate emissions in the sizes classes < 2.5 µm and 2.5–10 µm, however,
remained unchanged in the adjusted emissions inventory. We also kept the acetaldehyde emissions
from Ei2.2, a species missing in Simons [50]. Two important species are generally missing so far in
the Ei3 database [50] and are also missing in our updated inventory, namely PN (particle number)
and BC (black carbon), although emission data are available (e.g., [84]). PN and BC inhalation poses
a considerable health risk to humans (e.g., reference [85]). In conclusion, even with our updated
real-world-oriented emission profile it is not possible to fully account for all adverse health impacts of
diesel car emissions by LCA.
3. Results and Discussion
3.1. Impact Differences Due to Variations in Emission Profiles
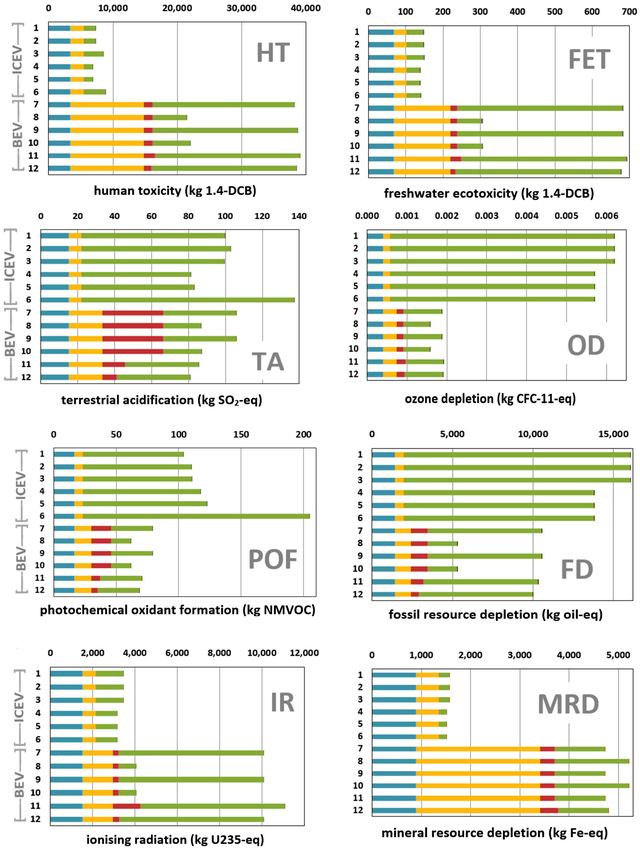
For better clarity, we removed models 3a and 13 from the following impact overview (Figure 3).
Model #3a is just an expansion of model #3 based on CNG consumption (Table 1). Model #13 considers
wind power instead of PV electricity for battery production, which results in slight impact variations
only in comparison to model #12 (see Table S11 in Supplement #2 in Supplementary Materials). Both
cases are separately discussed below.
First, the results reveal that in a minority of five of 18 impact categories the electric VW Caddy is
having clear advantages over the combustion engine models (climate change, photochemical oxidant
formation, fossil resource depletion, natural land transformation, and ozone depletion), while in 10
of 18 impact categories, a vice versa picture appears. The disadvantages for electric vehicles are not
reflected in the single score endpoints, which almost mirror the climate change impacts (Figure 3).
This goes back to the fact that the ReCiPe endpoint evaluation scheme is very much dominated by the
climate change effect [86].
In the impact categories of terrestrial acidification, particulate matter formation, and marine
eutrophication, the lowest impacts of both technologies are comparable (Figure 3). This resembles
the picture found during life cycle modelling the electric and the combustion engine SMART with
the exception that the LCIs in the category of marine eutrophication (ME) of both technologies are
balanced at the VW Caddy, while the electric SMART exhibited larger impacts in this category [17].
For the first time, the results depicted in Figure 3 enable a comparison of the different use phase
emission inventories. Comparing the impacts of vehicle models #1 and #2 (petrol “Euro 5 original” and
“Euro 5 scaled” inventories), there are only small differences (Figure 3): midpoint impacts of climate
change (CC), terrestrial acidification (TA), terrestrial ecotoxicity (TET), particulate matter formation
(PMF), photochemical oxidant formation (POF), ME and the single score of model 2 (“Euro 5 scaled”)Sustainability 2020, 12, 1241 13 of 31
are slightly higher (Figure 3). This is also the case when comparing midpoint impacts of the models #4
and #5 (diesel “Euro 5 original” and “Euro 5 scaled” inventories, see Table 1). Model #5 (Euro 5 scaled)
shows slightly larger impacts in the midpoint categories of terrestrial acidification (TA), terrestrial
ecotoxicity (TET), particulate matter formation (PMF), photochemical oxidant formation (POF), and
marine eutrophication (ME). Concluding, adapting LCA inventory modelling to individual mileages
did not result in significantly different impacts, as shown when comparing the respective modelling
results (“Euro 5 original” vs. “Euro 5 scaled”).
Figure 3. Cont.Sustainability 2020, 12, 1241 14 of 31
Figure 3. Cont.Sustainability 2020, 12, 1241 15 of 31
Figure 3. Ecoinvent (Ei) midpoint impacts and single score endpoints of VW Caddy production, use,
and disposal. Impacts calculated for models #1–12 (for details, see Table 1). Impacts per 150,000 km of
use phase.
Due to Ei3 emission species amendments [50] to the petrol VW Caddy a few midpoint categories
scored slightly higher impacts of model #3 (particulate matter formation, PMF; marine ecotoxicity,
MET; marine eutrophication, ME), compared to vehicle models 1 and 2 (Figure 3). Adding the new
group of emissions (Ei3) to the petrol car model, however, has a significant impact on the terrestrial
ecotoxicity (TET, Figure 3): Vehicle model 3 scores 57% higher in terrestrial ecotoxicity (TET)-LCI
(Life cycle impact), when compared with petrol models 1 and 2 (averaged). The process module
composition of the impact category terrestrial ecotoxicity (TET) of vehicle #3 exhibits that 53% of the
LCI of terrestrial ecotoxicity (TET) can be traced back to the impact of the updated Ei modul “operation,
passenger car, petrol EURO 5,” while another 33% of the LCI of terrestrial ecotoxicity (TET) is due to
impacts caused by the Ei module “petrol, low sulphur, at regional storage [CH].” Consequently, the
newly added emission species (Ei3) may have resulted this additional impact. This is also the case for
the LCI in human toxicity (Figure 3): The LCI in the impact category human toxicity (HT) of vehicle #3
increased by 17%, compared to the average of vehicles models #1 and #2 (both petrol).Sustainability 2020, 12, 1241 16 of 31
Correcting the emissions of four species (Table 5) for diesel vehicle models (#6, Figure 3) led
to more complex changes than in the impacts of the petrol vehicles. First, and analogous to petrol
model #3, diesel model #6 exhibits an increase of impact in terrestrial ecotoxicity (TET) and human
toxicity (HT, Figure 3), compared to the averaged LCIs from diesel vehicle models #4 and #5 (Figure 3).
Despite this terrestrial ecotoxicity (TET) impact variations it can be concluded that in case of an
unchanged adoption of the Ei3 emission numbers there would be no significant impact alterations,
neither between the two attempts of mileage implementation (original vs. scaled), nor between the
database advancement from Ei2.2 to Ei3.
Second, updating the emissions of four species in the inventory of diesel model #6 leads to
noticeable deviations in the four midpoint categories of marine eutrophication (ME), terrestrial
acidification (TA), particulate matter formation (PMF), and photochemical oxidant formation (POF)
(Figure 3, see model #6 each), by 143%, 67%, 65%, and 70%, respectively, in comparison to the averaged
LCIs of vehicle models #4 and #5.
This is based on the assumption that without adapting the respective emission numbers relative
to real-world emissions (Table 5), the impact increases of diesel vehicle #6, compared to vehicle #4
and #5, would have been small or insignificant as it was observed comparing the petrol vehicle #3
with petrol vehicles #1 and #2 (see above). The corresponding original Ei3 emissions are all lower than
those of Ei2 (Table 5).
The elevated impacts observed here are due to excess use phase emissions, clearly caused by
the corrections applied (Table 5): As it can be calculated from the process modules composition of
all four impact categories of marine eutrophication (ME), terrestrial acidification (TA), particulate
matter formation (PMF), and photochemical oxidant formation (POF), respectively, the LCI in each is
dominated by “operation, passenger car, diesel EURO 5” (to 78%, 53%, 59%, and 67%, respectively). In
all these four impact categories, the second largest factor in the respective process modules compositions
is “diesel, low sulphur, at regional storage [CH]” (to 12%, 28%, 21%, and 20%, respectively). This results
in predominant use phase impacts over lifetime in the respective four impact categories (Figure 3).
To the best of our knowledge, such increased impacts as a result of an updated diesel vehicle
emissions inventory was first presented by Bauer (2017) [87] but has not been documented further
on in detail. Bauer (2017) [87] pointed to a 35% increase of lifecycle particulate matter formation
(PMF) impact as well as to a 64% increase of lifecycle photochemical oxidant formation (POF) impact,
when updating the diesel car emission inventory to be closer to real-world results, but did not go into
further detail.
We found bigger LCI increases than Bauer (2017) [87] when applying real-world emissions, and
detected increased impacts in two more impact categories. However, Bauer (2017) [87] used NOx
emissions elevated by a factor of 6, while our updated NOx emissions increased by a factor of 9.2,
relative to Ei3 (Table 5).
These excess LC impacts of diesel vehicle model #6 are hardly visible in the single score result that
is just 4% higher than the single score indicator of models #4 and #5 (averaged). When averaging the
elevated LCIs of diesel vehicle model #6 identified in the impact categories of marine eutrophication
(ME), terrestrial acidification (TA), particulate matter formation (PMF), terrestrial ecotoxicity (TET),
and photochemical oxidant formation (POF) for the 18 impact categories, it should result in an elevated
single score LC impact of +18% of model #6. The dominance of the CC impact in the ReCiPe evaluation
scheme [86] is blurring this effect (Figure 3).
In conclusion, switching from Ei2.2 to Ei3 emissions does not significantly change the
environmental impacts of petrol and diesel cars, despite of the slightly increased impacts in terrestrial
ecotoxicity and human toxicity, respectively. The high number of added chemical emission species in
Ei3 does not cause significant increases in LCIs despite of the impact categories of terrestrial ecotoxicity
(TET) and human toxicity (HT) (Figure 3). However, the real-world close update of a few species,
emitted by diesel cars, changes the picture.Sustainability 2020, 12, 1241 17 of 31
Interestingly the switch from Ei2.2 to Ei3 also has very small and negligible effects on the use
phase impact in any impact category of the electric BEV (comparing models #7 and #9, Figure 3),
although the number of emissions increased from 22 to 98 (Table 4).
3.2. Climate Change Impact Comparison of Diesel and Petrol Cars
Figure 3 displays the main vehicle types (VW Caddy) in order to identify the choices to optimize
the climate change impact. The Caddy with the diesel engine, #6, scores 13% lower compared to the
petrol propelled Caddy (Figure 3). We do not think this difference can be generalized, because our VW
Caddy was not equipped with a particularly modern charged and downsized petrol engine as they are
technical standard to date. Statistically, the use phase CO2 emission of an average gasoline car is only
4% higher compared to a diesel car (T&E 2018 [88]). However, increased emissions of aged cars as
they have been measured (e.g., reference [89]) are not considered in any LCA or well-to-wheel (WTW)
report. Preliminary calculations on this issue revealed that aged diesel cars without (properly working)
particulate filters may statistically add 8 g CO2 -equivalents/km on top of the direct CO2 emissions on
average over lifetime by black carbon emissions (Helmers et al. 2018 [90]). In conclusion, as in the
majority of LCA reports, diesel cars also here seem to be favourable over petrol cars, but we believe
this is misleading. The lack of representative emission data for aged cars is preventing a refinement of
modelling so far. Consequently, we prefer to work with averages calculated from the petrol and diesel
vehicle when comparing them to the electrification alternative.
3.3. Effects of Electricity Supply Choices on Battery Production Impacts
Results depicted in Figure 4 highlight the advantages of battery cells made under provision
of renewable electricity. Particularly, human health and ecosystem related impacts decrease when
substituting coal-based electricity (Figure 4). Human health–related endpoints for the Chinese
electricity provision scenario are 3.4 times higher than those of the scenario assuming wind electricity
only (Figure 4). The analogue difference in ecosystem related endpoints is a factor of 3.5 (Figure 4).
This is reflected in individual midpoint deviations: Coal dominated electricity has particularly high
impacts in photochemical oxidant formation (POF), particulate matter formation (PMF), agricultural
and land occupation (ALO), terrestrial acidification (TA), fossil resource depletion (FD), and marine
eutrophication (ME). UCTE electricity, on the other hand, exhibits larger impacts than the other
scenarios regarding human toxicity (HT), ozone depletion (OD), water depletion (WD), and ionizing
radiation (IR, the latter due to the nuclear power plants still available in Europe). Individual midpoints
are reported as per 1 kWh electricity in Table S11 in Supplement #2 in Supplementary Materials. When
switching from Chinese electricity toward 100% PV, the impacts in 14 categories decrease, on average
by 43% per impact category (Table S11). On the other hand, there are slight increases in the impacts
of the midpoint categories of ionizing radiation, ozone depletion, terrestrial ecotoxicity, and mineral
resource depletion, respectively (Table S11). When using 100% wind electricity, on the other hand,
even these impacts are lower than those under provision of Chinese electricity, despite of the impact in
mineral resource depletion (Table S11).
Battery cells produced with coal-dominated electricity have a 3.8 times higher carbon footprint
(156 kg CO2 -eq/kWh) than cells made with 100% wind electricity (41 kg CO2 -eq/kWh) (Figure 4,
Table S11). Compared to 100% PV electricity, 100% wind electricity’s carbon footprint is still an
additional 16% lower. These findings coincide in principle with the 61–106 kg CO2 -eq/kWh reported
in a recent review [91], decreasing from the 150–200 kg CO2 -eq/kWh reported earlier [92]. As other
reports, also Romare and Dahllöf [92] conclude that the magnitude of battery carbon footprint is
“nearly independent of the cell chemistry.”Sustainability 2020, 12, 1241 18 of 31
Figure 4. Battery production impacts as per 1 kWh of battery capacity. Left: endpoints. Right: climate
change midpoints. Characteristics of the four kinds of electricity production are described in Table 3.
(UCTE = European Union for the Coordination of the Transmission of Electricity, now ENTSO-E, see
www.entsoe.eu). Numerical impacts for all categories provided in Table S11 in Supplement #2 in
Supplementary Materials. PV = Photovoltaics.
Based on UCTE (2004) electricity, the CC impact due to direct electricity consumption during
battery production accounts for 57% of the CO2 equivalent emissions relative to the entire CC impact
of Li-Ion cell production, as derived from the process modules composition (the remaining 43% are
caused by the provision of the cell components). Ellingsen et al. (2013) [64] reported an average of 78%
CO2 -eq emissions, due to direct electricity use during cell production under a comparable electricity
mix. Under provision of Chinese electricity as shown in our modelling, direct electricity consumption
accounts for 75% of CO2 -eq emissions during cell production, under 100% PV electricity this goes
down to 18%, respectively. Under provision of wind electricity, the contribution of direct electricity
consumption to the climate impacts of battery cell production is 0.4%, which is negligible. The
carbon footprint of battery production under wind electricity consumption is thus almost completely
dominated by the provision of the chemical/mineral battery components.
These findings suggest an enormous potential to mitigate greenhouse gas emissions by producing
Li-ion battery cells with renewable electricity (Table 3). A battery cell production in a European country
with a high proportion of coal-derived energy like Poland (88% coal, 92% fossil in total, according to
Frischknecht et al. [60]) would even worsen the production backpack of the battery, while a European
production with renewable electricity can deliver the savings quantified here.
Apart from the climate change impacts, the following impact categories particularly benefit from
switching to renewable electricity during battery production—terrestrial acidification, particulate matter
formation, photochemical oxidant formation, agricultural land occupation, urban land occupation,
and marine eutrophication (Figure 3). The high impacts from electric powertrain production (Figure 3)
are caused during the production of printed circuits. Details on this analysis can be found in Helmers
et al. (2017) [17].
3.4. The Natural Gas Alternative and Effects of Electricity Supply Choices During Battery Production on the
Lifetime Impacts
CNG vehicles tend to have lower pollutant emissions (e.g., Khan et al. [93]) than petrol vehicles.
They are based on almost the same engine technology. Our approach (modelling the same chemical
emissions of the petrol version) thus results in a slight impact overestimation of vehicle 3a, propelled
with CNG, in impact categories like photochemical oxidant and particulate matter formation (compare
Figure 3), which affects single score impact (Figure 5). The climate change impact of natural gas
combustion was as at first glance quantified with an independent LCI model based on the Ei module
“natural gas, burned in gas motor, for storage [DE].” This module revealed 214 g CO2 /kWh CNG, which
was converted to 2.92 kg CO2 /kg CNG. We regard this as being unrealistically low because this would
include only a 6% additional impact along the fuel supply chain. Well-to-tank efficiency, however, is
80.25% on average in CNG provision (reviewed in [39] Helmers & Marx 2012). We accordingly add
19.75% due to fuel chain expenses on top of the 5.99 kg CNG/100 km as measured for the VW Caddy,
arriving at 198 g CO2 /km (well-to-wheel) for modelling the use phase.You can also read