Natural cork bottle stoppers: a stopper on CO2 emissions? - CE Delft
←
→
Page content transcription
If your browser does not render page correctly, please read the page content below
Natural cork bottle stoppers:
a stopper on CO2 emissions?

Report
Delft, May 2013

Author(s):
Harry Croezen
Marijn Bijleveld
Maartje Sevenster
Publication Data
               Bibliographical data:
               Harry Croezen, Marijn Bijleveld, Maartje Sevenster
               Natural cork bottle stoppers: a stopper on CO2 emissions?
               Delft, CE Delft, May 2013

               Publication code: 13.27925.35

               CE publications are available from www.cedelft.eu

               Commissioned by: Nomacorc.
               Further information on this study can be obtained from the contact person, Harry Croezen.

               © copyright, CE Delft, Delft

                 CE Delft
                 Committed to the Environment

                 CE Delft is an independent research and consultancy organisation specialised in
                 developing structural and innovative solutions to environmental problems.
                 CE Delft’s solutions are characterised in being politically feasible, technologically
                 sound, economically prudent and socially equitable.

2   May 2013   2.792.5 – Natural cork bottle stoppers: a stopper on CO2 emissions?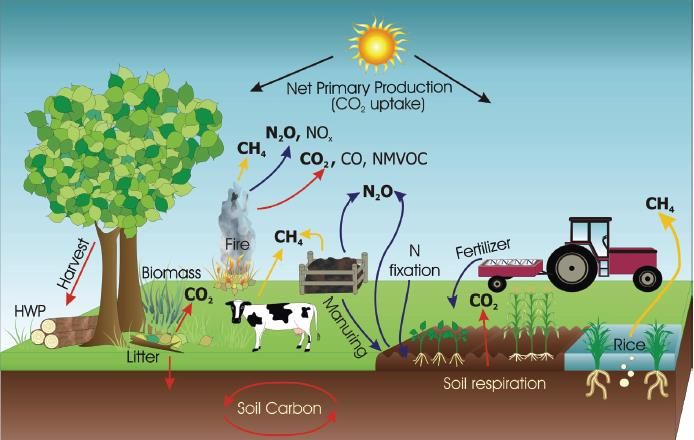
Contents
               Terms and definitions                                                  5

               Summary: natural cork bottle stoppers: a stopper on
               CO2 emissions?                                                         7

        1      Introduction                                                           13
        1.1    Purpose of this discussion paper                                       13
        1.2    Approach                                                               14
        1.3    Hierarchy and structure of the report                                  15

        2      Key figures on cork oak cultivation                                    17
        2.1    Cork oak areas                                                         17
        2.2    Raw cork to cork products                                              19
        2.3    Life cycle assessment of cork stoppers                                 19

        3      Calculating carbon sequestration                                       23
        3.1    What is meant with sequestration?                                      23
        3.2    Carbon sequestration calculation in (UAB, 2011)                        25
        3.3    Land use and cork oak systems throughout the ages, is there actually
               a net-sequestration?                                                   26
        3.4    Carbon-sequestration during tree growth: different age - different
               regions – different seasons - different amounts – different averse
               conditions                                                             28
        3.5    A more appropriate sequestration figure?                               32
        3.6    Overall conclusions                                                    33

        4      Carbon sequestration and LCA                                           35
        4.1    Introduction                                                           35
        4.2    Standardization methods on carbon sequestration                        35
        4.3    Interpretation of the cork cultivation system within PAS 2050          36

        5      Allocation                                                             39
        5.1    Introduction                                                           39
        5.2    Which allocation method?                                               39
        5.3    One hectare, many outputs                                              42
        5.4    Support schemes: an additional aspect to consider in allocation?       44
        5.5    Raw cork converted into many cork products                             46
        5.6    Summary                                                                49

        6      Carbon credits and forestry, claim of sequestered CO2                  51
        6.1    National carbon accounting under Kyoto Protocol                        51
        6.2    EU ETS                                                                 55
        6.3    Voluntary markets                                                      55
        6.4    Implications for carbon foot printing                                  55
        6.5    Conclusion                                                             58

3   May 2013   2.792.5 – Natural cork bottle stoppers: a stopper on CO2 emissions?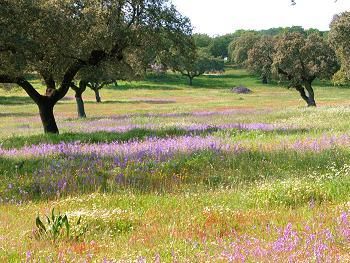
7      Other LCA issues                                                      59
        7.1    Comparison of results of cork stoppers                                59
        7.2    Loss rates and carbon footprint                                       60
        7.3    End of life of cork product                                           60

        8      Conclusions                                                           63

               Literature                                                            65

4   May 2013   2.792.5 – Natural cork bottle stoppers: a stopper on CO2 emissions?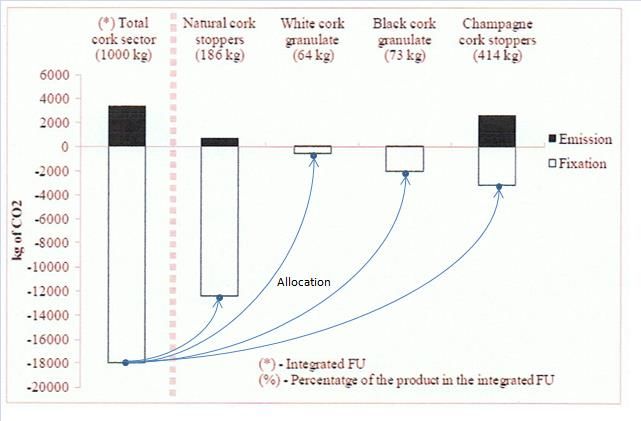
Terms and definitions
               Allocation
               Partitioning the input or output flows of a process or a product system
               between the product system under study and one or more other product
               systems (source: ILCD Handbook, ISO 14044:2006).

               Carbon sequestration (C-sequestration)
               The process of capture and long-term storage of CO2. In this report: the
               storage of CO2 in standing biomass (cork oaks) and soil.

               CO2 fixation
               Synonym to carbon sequestration.

               Co-product
               Any of two or more products coming from the same unit process or system
               (source: ILCD Handbook, ISO 14044:2006).

               Functional unit
               The subject of the study: the specified quantity of the product under study.
               For instance: 1 kg of finished natural cork stoppers, at production facility.

               Greenhouse gas (GHG)
               Concerns a gas in the Earth’s atmosphere that absorbs infra red radiation and
               sends it back to the Earth’s surface, thereby contributing to the heating up of
               it’s surface.

               ILCD Handbook
               Provides technical guidance for detailed LCA studies, it builds on the
               ISO specifications for LCA.

               ISO 14000
               Series of standardization documents, issued by the International Organization
               for Standardization. The ISO 14000 family addresses various aspects of
               environmental management, among which:
               ISO 14040 Environmental management - Life cycle assessment - Principles and
                           framework
               ISO 14044 Environmental management - Life cycle assessment - Requirements
                           and guidelines
               ISO 14064 Specification with guidance at the organization level for
                           quantification and reporting of greenhouse gas emissions and
                           removal

               Land use, land use change, and forestry (LULUCF)
               A greenhouse gas inventory sector that covers emissions and removals of
               greenhouse gases resulting from direct human-induced land use, land use
               change and forestry activities (source: unfccc.int).

               Life cycle assessment (LCA)
               Compilation and evaluation of the inputs, outputs and the potential
               environmental impacts of a product system throughout its life cycle
               (source: ISO 14040: 2006).

5   May 2013   2.792.5 – Natural cork bottle stoppers: a stopper on CO2 emissions?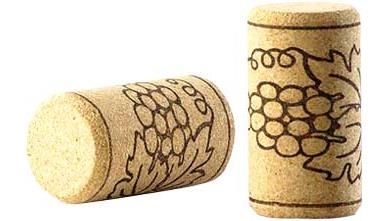
Life cycle inventory (LCI)
               Life cycle inventory, LCI in short, is the data collection portion of LCA.
               LCI is the straight-forward accounting of everything involved in the ‘system’ of
               interest. It consists of detailed tracking of all the flows in and out of the
               product system, including raw resources or materials, energy by type, water,
               and emissions to air, water and land by specific substance.

               PAS 2050
               Documents in the PAS 2050 series (Publically Available Specifications), issued
               by the British BSI, contain specifications for quantifying greenhouse gas
               emissions throughout the life cycle of goods and services. It builds on the
               ISO specifications on Life Cycle Assessment and is focussed solely on
               GHG assessments.

6   May 2013   2.792.5 – Natural cork bottle stoppers: a stopper on CO2 emissions?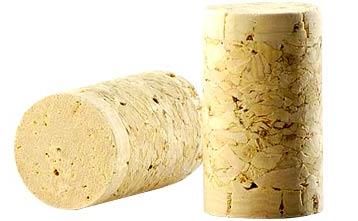
Summary Natural cork bottle stoppers:
        a stopper on CO2 emissions?
            1     Introduction and purpose of this report

                  This report is a discussion paper about the carbon
                  footprint of natural cork stoppers for wine bottles.

                  More specifically, it discusses one particular aspect of the carbon footprint of
                  cork: the CO2 that is sequestered in the cork oak forest. Should this CO2 be
                  taken into account in the carbon footprint analysis, and if yes: how?

       Figure 1   Cork oak landscapes are most often partly open landscapes or savannah’s

                  Picture courtesy of azenhadoramalho.com, cork oak forest landscape.

                  Let’s explain.

                    Carbon footprint and carbon sequestration

                    The carbon footprint of a product is the total amount of CO2 and other greenhouse gases
                    (= climate changing) that are released into the air or by the production, use and disposal of
                    the product:
                    1. Production of raw materials.
                    2. The production of the product.
                    3. Transportations.
                    4. Use of the product.
                    5. Disposal after use.

                    The production of wood represents a temporal CO2 sink, a temporary decrease of CO2 in the
                    air. Trees take up CO2 from the air and fixate or sequestrate it as carbon in the wood (stem,
                    bark, branches, roots) and soil. When the tree is cut down, the sequestered CO 2 is released
                    again as the wood decays.

7    May 2013     2.792.5 – Natural cork bottle stoppers: a stopper on CO2 emissions?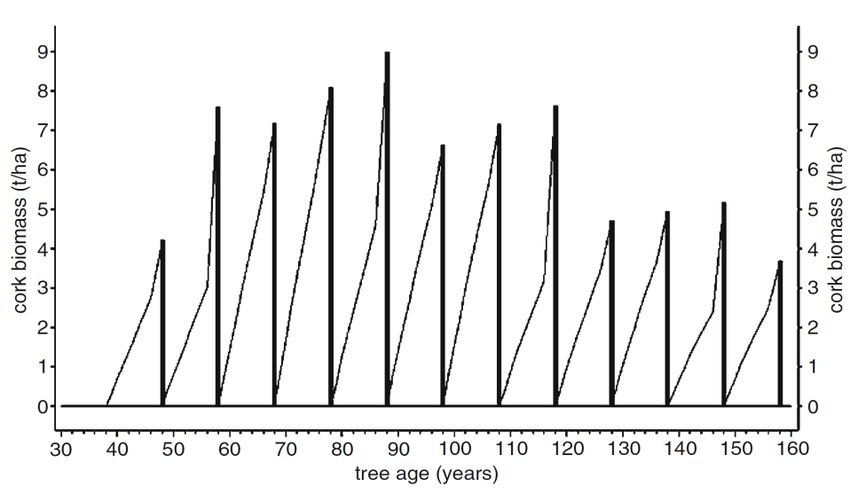
Carbon sequestration: a negative carbon footprint for cork products?
The well known natural cork bottle stopper often applied as a seal in wine
bottles is produced from the bark of the cork oak, a species of oak tree
growing in the region around the Mediterranean Sea. After the cork oak has
grown big enough and the bark has become thick enough (after 25–40 years)
the bark is peeled of every 9–12 years and grows back again in the
intermediate period. As the cork oak tree is not cut down for cork harvesting,
the CO2 fixated in the wood of the cork oak remains sequestered.
According to two recent studies (UAB, 2011 and PWC, 2008) the CO2 fixated in
the wood of the cork oak can be attributed to the natural cork bottle stoppers
(and other cork products) produced from its bark. According to both studies,
the amount of CO2 that can be attributed per bottle stopper is very large:
The amount of CO2 sequestered in the cork oak, as calculated in
(UAB, 2011) (see Figure 2) is 30–40 times larger than the amount of CO2
emitted during harvesting of cork, processing the peeled cork in the cork
factory and the disposal of the stopper.
The amount of CO2 fixated in the cork oak per individual bottle stopper
comparable to as much as 20-40% of all CO2-emissions related to the bottle
of wine it closes. This would mean that the use of a natural cork on a wine
bottle decreases the carbon footprint of the bottle of wine by 20-40%
(according to UAB, 2011).
This conclusion has been used as marketing instrument by the cork products
industry to promote cork products.
But to what extent may the CO2 that is sequestered in the forest become part
of the carbon footprint of natural cork products? Is it justified to attribute this
CO2 to the natural cork?
Figure 2 Carbon footprint of one natural cork stopper, according to UAB, 2011
Carbon footprint of 1 natural cork
stopper, according to UAB, 2011
50
Is this
Impac t on c limate change (g CO2-eq.)
0 justifiable?
-50
-100 CO2 fixation
(sequestration)
-150 CO2 emission
-200
Net CO2
footprint
-250
-300
8 May 2013 2.792.5 – Natural cork bottle stoppers: a stopper on CO2 emissions?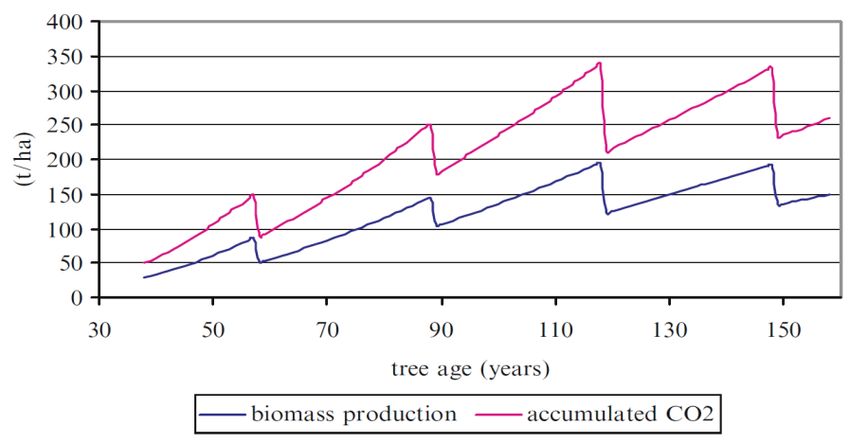
Approach
Nomacorc has asked CE Delft to check the UAB (2011) and in particular
investigate the claim of the negative carbon footprint.
The purpose of this discussion paper is to address several aspects of how to
assign CO2 sequestered in cork oak forests to natural cork products, cork
stoppers in particular:
1. The amount of CO2 that is sequestered in cork oak forests
Is the amount of CO2 fixated in cork oaks calculated correctly?
When considering the big picture of forest growth and use, over
decades and ages, is there carbon sequestration at all?
2. The methodology: how to assign sequestered CO2 to cork products.
If there is carbon sequestration in natural cork, how should it be
divided among all the different natural cork products (stoppers,
flooring, shoe soles, etc.)?
Methods for standardization of CO2 foot print calculation exist, such as
the PAS 2050 and ISO standards. What do they say about carbon
sequestration and how to take it into account in a carbon footprint?
There are protocols for CO2 that surpass CO2 standardization on
LCA level. On country level, the emission trading system (ETS) also has
rules for accounting for CO2 sequestered in forests. Are the ‘CO2 rights’
still free to claim for LCA?
Finally, CE Delft shortly reflects on LCA aspects other than CO2 sequestration
in cork oak forests.
2 Subject 1: sequestered carbon in cork oak forests: amounts and
characteristics
1a. The amount of sequestered carbon
The amount of CO2 fixated in cork oaks according to UAB (2011) is an overestimation. Scientific
studies on cork oak growth suggest that the total carbon that is fixated in cork oaks is 4 to 5
times lower than mentioned in UAB (2011).
Based on a plurality of scientific studies on cork oak growth, we conclude that
on average 0.95–1.25 tonne C/tonne cork is sequestered in cork oaks. This is
4 to 5 times less than reported by UAB (2011).
1b. Change in sequestered carbon: net value
In UAB (2011), the gross fixed amount of carbon is calculated. No indication is given of the
actual net fixed amount of CO2.
In the UAB (2011) study - but also in the PWC (2008) study - only the
productive life of the cork oak as supplier of bark and the amount of
CO2 fixated in that period are considered. By taking this scope, both studies
implicate that there was no vegetation – and no CO2 fixation - before the cork
oak germinated and that the cork oak remains in place for ever after, keeping
the CO2 it fixated during its productive life sequestered for all eternity.
9 May 2013 2.792.5 – Natural cork bottle stoppers: a stopper on CO2 emissions?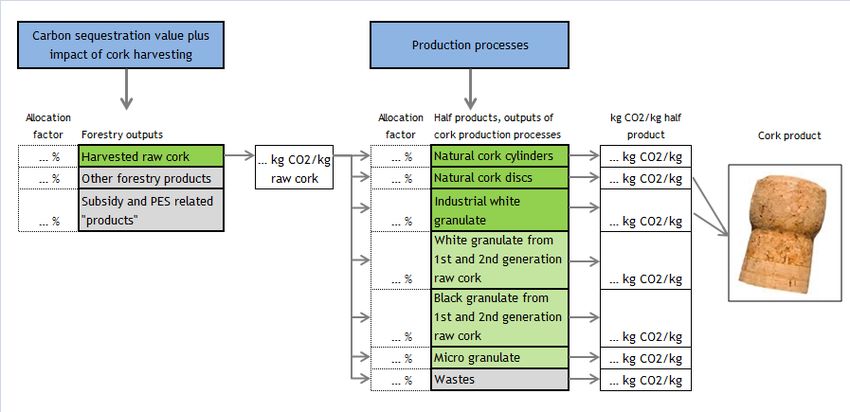
In fact, cork oak savannah landscapes seem to have been partly developed by
removing other trees.
Also, part of the cork oaks, which reached the end of their economic life are
removed and not replaced by new trees. Sometimes the cork oak area is
replaced by intensively cultivated arable land. In this case the CO2 fixated in
the cork oak is released again.
So overall both studies give a gross and not a net value for CO2 sequestration.
The net value is very likely smaller than the gross value.
3 Subject 2: Methodology: how to assign sequestered carbon to cork
products.
2a. Allocation: dividing the CO2 over various cork products
The allocation as applied in UAB (2011) is not complete and not according to standardized
methods. The chose allocation in UAB (2011) is not complete and not according to
standardized methods. The chose allocation in UAB (2011) is arbitrary and assigns more impact
(or CO2 benefit, in the case of carbon sequestration) to the cork stoppers compared to other
cork products.
‘Allocation’ means: to assign the environmental impact over multiple
products. An example: a cow has an impact, because of raising and feeding the
cow. The cow provides multiple products: milk, meat, gelatin and more.
The impact of these products is a part of the impact of the cow. All products
are allocated part of the impact of the cow.
This allocation is necessary at two points in the lifecycle of natural cork
stoppers:
First, cork oak landscapes – and especially cork oak savannahs - represent
an integral system that produces other products next to natural cork, like
firewood, pork, wool and mushrooms. The incomes of these products help
to keep these landscapes economically viable and may represent 20-60% of
total economic returns of the area. Subsidies for specific services and
private payments for ecological services are also ignored.
Next, at the factory, the bark of the cork oak is used to create a number of
(half)products, like cylinders (which are practically stoppers), cork discs
and cork granulates in various qualities.
In UAB (2011), the first allocation is ignored: the cork bark gets assigned 100%
of the emissions for maintenance and CO2 credits. The second allocation is
done in an arbitrary way, which assigns disproportionally more impact to the
cork stoppers compared to other cork products. This means that natural cork
also gets too much credit for the carbon sequestration benefit in UAB (2011).
CE Delft suggests applying economic allocation for the multiple output system.
This is the preferred method by the standardization methods ISO and PAS.
Also, CE Delft offers a suggestion for how to deal with the various
intermediate products at the cork factory. The suggested approach by CE Delft
yields clear environmental impact values for all intermediate products. It has
as a benefit that the results can readily be used by any cork using company,
such as wineries or shoe makers, to construct the (impact of) their specific
own cork product.
10 May 2013 2.792.5 – Natural cork bottle stoppers: a stopper on CO2 emissions?2b. Preferred procedure by standardization methods
At this moment, standardization methods for carbon footprinting declare that sequestered
carbon should not be taken into account in carbon footprint assessments.
Carbon footprint standardization is a developing field. At the moment there
are no specific rules for cork, but there are rules for forestry products.
Standardized methods such as ISO 14000, the ILCD Handbook and PAS 2050 and
its supplement for horticultural products all seem to exclude carbon stocks
(carbon sequestered in wood and soil).
The standardized methods all include changes in carbon stocks due to land use
change. However, managed cork oak landscapes and other forms of managed
forest do not fit within that definition. The PAS 2050 standardization gives a
clear advice: “While forest management activities might result in additional
carbon storage in managed forests through the retention of forest biomass,
this potential source of storage is not included in the scope of this PAS.”
Exclusion in standardized methods means that sequestration cannot even be
claimed as an environmental benefit for natural cork bottle stoppers.
2c. Restrictions by other CO2 emission protocols?
The EU emission trading system (ETS) also deals in carbon credits, but this system turns out
not to be a limiting factor.
On a national level, countries determine their carbon footprint. Under the
Kyoto Protocol, countries report on their CO2 emissions and sinks. Changes in
carbon fixated in forests play an important role in climate policy. CE Delft
explored whether this has any consequences for the right to include carbon
uptake in carbon footprints of forestry products. This is done because it is
important to check that no double counting of CO2 credits occurs.
CE Delft concludes that the Kyoto Protocol and ETS in themselves only
limitedly allow for discounting CO2 sequestration. Double counting of carbon
credits by land owners and national states is unlikely to occur.
4 Other LCA issues
So far, we have discussed two specific aspects of UAB (2011):
the carbon sequestration result;
the allocation method.
CE Delft wishes to emphasize that we don’t criticize the entire study of
UAB (2011). The study offers a thorough assessment of both cork oak forest
management, the harvesting of raw cork and of the production processes by
the cork industry in Catalonia. The study offers a good overview of the cork
production chain and as far as we can tell from reading the report, there is no
reason to question inventory of these life cycle phases.
11 May 2013 2.792.5 – Natural cork bottle stoppers: a stopper on CO2 emissions?There are, however, some aspects in the life cycle of natural cork stoppers
that are not or marginally taken into account:
End of life of natural cork bottle stoppers: only landfilling of stoppers is
included, not waste incineration, the dominant treatment process for
domestic waste in Northern and Western EU member states.
Wrappers enveloping the natural cork bottle stoppers are not taken into
account.
The use phase of the cork product is not taken into account. Natural cork
is known to cause more loss of wine (due to cork taint), compared with
other stoppers.
Taking these aspects into account could significantly influence the total
carbon footprint of the bottle stoppers.
To be able to compare the LCA results of natural cork stoppers with other stopper types, the
use phase should be included as well as additional materials that are needed for closing the
wine bottle.
5 Overall conclusions
CE Delft concludes:
The negative carbon footprint as calculated by UAB (2011) is not correct.
It is much too high, because:
the calculation is not correct;
reference land use is not taken into account;
the method of assigning the result to the natural cork is not correct.
Standardization methods for carbon footprints indicate that sequestered
carbon in forests should not be taken into account in carbon footprints of
forestry products (such as cork). This goes for all carbon footprint studies
of cork.
This means that claims concerning carbon footprint benefits for natural cork
bottle stoppers cannot be maintained.
Cork oak landscapes are very valuable from the perspective of biodiversity,
hydrology and maintaining soil quality. Our suggestion would be that efforts to
quantify the value of these landscapes would be related more to these aspects
and less to carbon footprints of products generated by these landscapes.
12 May 2013 2.792.5 – Natural cork bottle stoppers: a stopper on CO2 emissions?1 Introduction
In 2011, the Universitat Autonoma de Barcelona published a doctoral thesis -
UAB (2011) ‘Environmental evaluation of the cork sector in Southern Europe
(Catalonia)’. This study assesses the impact of raw cork extraction in Catalonia
and cork product manufacturing in Catalonia by means of life cycle assessment
(LCA).
An important part of the LCA is the carbon footprint analysis. The results of
which are largely determined by the way in which temporary sequestration of
CO2 in cork oak trees is taken into account. Carbon sequestration, or
CO2 fixation, is the uptake CO2 by trees during growth. The UAB thesis
(UAB, 2011) reports a net sequestration of 18 kg CO2 per kg raw cork or
234 g CO2 per natural cork stopper. This uptake of CO2 leads to a negative
carbon footprint of cork products. Based on this outcome the report suggests
that using a natural cork stopper in wine bottles is a practical means to green
the packed product and to reduce the greenhouse gas footprint of a bottle of
wine with as much as 20-40%.
As is understandable, the International Organisation of Vine and Wine and wine
producing companies (Rotllan Torra) have adopted the figures and report in
the media that the use of a cork stopper reduces the carbon footprint of wine
and use the negative carbon footprint for comparison with other stopper
types.
It has been observed that companies that sell cork products other than cork
stoppers also claim a CO2 benefit of for their products (websites by Wicanders
and Amorin).
1.1 Purpose of this discussion paper
The highly negative carbon footprint of the UAB thesis (UAB, 2011) and the
resulting public CO2 claims for cork products caught the attention of
Nomacorc. Nomacorc wished to know whether the carbon sequestration of
18 ton CO2 per ton of raw cork published in the UAB thesis (UAB, 2011) is
correct and whether it is legitimate to use this figure for cork products.
This report attends to all these questions. We mean to provide insight and
present our view. The purpose of the paper is to stimulate discussion about
the carbon footprint of cork products, including the carbon credits due to
carbon sequestration in cork oak forests. We hope that this discussion will lead
to consensus throughout the involved sectors: the cork production sector, the
wine sector and producers of stopper out of other materials.
Nomacorc explicitly has asked to deal with this question in a more general way
so that the discussion exceeds cork products and is relevant to other
agricultural and horticultural products or forestry in general.
13 May 2013 2.792.5 – Natural cork bottle stoppers: a stopper on CO2 emissions?Impact on climate change
Figure 3 Impact on climate change as reported in UAB (2011)
as reported in [UAB 2011]
186 kg of 414 kg of
Total cork
natural champagne
sector: 1000 kg
cork cork
stoppers stoppers
Impact on climate change (kg CO2-eq.)
5000
CO2 emission
0
-5000
CO2 benefit due to
C-sequestration
-10000
-15000
-20000
1.2 Approach
CE Delft has looked into the matter and has explored the subject of carbon
sequestration in LCA, specific for cork products, which is a broad subject.
We have sought answers to the following questions:
How Is the sequestration of 18 ton CO2 per ton raw cork calculated?
To what extend is this value representative for all cork, from all cork
production regions?
Should a carbon sequestration figure be taken into account in LCA
according to standardization carbon footprinting methods (e.g. PAS 2050),
and if yes: how?
How should the environmental impact or benefit for raw cork be
distributed over the various cork products?
Are the results for cork stoppers as calculated by the UAB thesis
(UAB, 2011) suited for comparison with other stopper types?
Apart from the questions asked on the calculation of the footprint of the
product we see a tension between claims made by national governments on
CO2 reduction and individual producers. This is not only the case with cork.
Nevertheless, if a discussion is held on the way in which should be dealt with
products like cork, we also might look at this on a macro-level. The question
we have at the macro level is:
How should LCA practitioners deal with carbon rights trading by
governments? Are the carbon credits from cork oak forests available for
cork products, or are they already used by the national government?
14 May 2013 2.792.5 – Natural cork bottle stoppers: a stopper on CO2 emissions?1.3 Hierarchy and structure of the report
The topics mentioned in the previous paragraph - those which relate to carbon
sequestration - can be structured hierarchically, as shown in Figure 4.
The report is structured according to these topics, from ‘inside’ to ‘outside’;
each has its own chapter. The final chapter treats topics that are not related
to carbon sequestration, but to LCA for cork stoppers in general.
Figure 4 Hierarchy of the topics
The chapters contain several sub-questions or issues - paragraphs - that
together give insight into the main topic. The paragraphs have a similar
structure:
1. Posing the question/dilemma: what issue do we observe?
2. Discussion: the issue is explored and illustrated by examples.
3. Conclusion: CE Delft’s suggestion on how to deal with the issue.
This shows the nature of the paper: a discussion paper. We provide
information and our conclusion, which is open for debate.
15 May 2013 2.792.5 – Natural cork bottle stoppers: a stopper on CO2 emissions?16 May 2013 2.792.5 – Natural cork bottle stoppers: a stopper on CO2 emissions?
2         Key figures on cork oak
                  cultivation
         2.1      Cork oak areas

                  The cork oak is an evergreen broad-leaved tree, the natural range of which
                  includes the coastal regions of the western Mediterranean Basin (see Figure 5
                  and Table 1). Cork oak grows mainly on poor sandy and lightly structured soils
                  and is found under a wide range of annual rainfall, ranging from 500 mm in
                  Mamora (Morocco) to 2,400 mm in some north-western areas of Portugal and
                  southern Spain. The species is long lived (200–250 years), commonly growing to
                  a height of 15–20 m but it can reach 25 m under ideal conditions.

                  Portugal and Spain produce over 80% of the raw cork, while representing 54%
                  of the total cork oak area. In other countries, primarily Morocco, Algeria and
                  Tunisia (Table 1), the cork oak is less intensively cultivated.

       Figure 5   Distribution of cork oak

                  Source: EUFORGEN, 2008.

                  Cork oak is mostly grown in agroforestry systems, known as Montado in
                  Portugal and Dehesa in Spain, open managed savannahs with low tree density
                  20–100 trees per hectare (Landscape Europe/KNNV) in the south-western part
                  of the Iberian Peninsula. These landscapes possess a very high biodiversity.

17   May 2013     2.792.5 – Natural cork bottle stoppers: a stopper on CO2 emissions?
Table 1 Cork forest area in cork production data
Country Area (hectares) Percentage Annual Percentage
production of
cork (tons)
Portugal 715,992 33.8% 100,000 49.6%
Spain 574,248 27.1% 61,504 30.5%
Morocco 383,120 18.1% 11,686 5.8%
Algeria 230,000 10.9% 9,915 4.9%
Tunisia 85,771 4.0% 6,962 3.5%
France 65,228 3.1% 6,161 3.1%
Italy 64,800 3.1% 5,200 2.6%
Total 2,119,089 100.0% 201,428 100.0%
Source: Apcor, 2008.
In traditional Montado’s and Dehesa’s forage crops (grasses, to a lesser extent
cereals) are commonly grown under the trees and extensively grazed by cattle,
sheep or goats, providing meat, wool, skin and milk. Acorns are used for pig
rearing for production of pata negra. Other outputs are honey, wild, and
mushrooms.
Figure 6 Cattle grazing under cork oaks
Source: Wikipedia – Dehesas: http://en.wikipedia.org/wiki/Dehesa_%28pastoral_management%29.
Trees are pruned for optimum crown development and old trees are removed
being replaced by replanted species. Wood from pruning and removed trees is
utilized as fire wood or charcoal.
The whole system is aimed at optimization of the economic value of the
mixture of different products, of which cork is in general the highest
contributor.
18 May 2013 2.792.5 – Natural cork bottle stoppers: a stopper on CO2 emissions?According to the UAB thesis in Catalonia and France a different exploitation
system, the forest system, is applied. In this system cork oaks are grown in
managed forests with several hundreds of trees per hectare of which
approximately 400 trees per hectare produce cork; the other trees are
intended for natural regeneration (UAB, 2011). The cork oak forests need
intensive care in order to be productive, and it is necessary to remove
competing vegetation. Unproductive oaks, oaks yielding cork of insufficient
quality and trees in stands with a too high density are also felled. The wood is
sold as fire wood.
As quoted in the UAB thesis (UAB, 2011) half of Catalan cork oak forests are no
longer managed. This probably is the result of a shift of cultivation from
traditional cultivation areas in Catalonia and France to more productive cork
oak woodlands in the south-west of the Iberian Peninsula or the north of
Africa1.
2.2 Raw cork to cork products
The cork of the oak is the primary economic income from cork oak landscapes,
forming e.g. 80% of total revenues from Dehesa’s (WWF, 2006)2. Cork is
obtained by peeling the bark away from the trunk as slabs. Depending on the
management system and region the first harvest (virgin cork) is made when
the tree is approximately 25–40 years old. Subsequent harvests can be made
every 8-14 years. Third and subsequent harvests can be used for high quality
products (natural stoppers, champagne stoppers), the first two harvests only
for lower quality products.
The harvested cork is pre-treated by a process of subsequent slabs boiling,
cutting slabs into strips, strips boiling, punching out the cylindrical natural
cork stoppers and finally applying a surface layer of paraffins and/or silicons.
Natural cork stopper production uses about 20% of the cork while generating
more than 80% of the added value (EUFORGEN, 2008).
The remainder is processed into champagne cork stoppers, agglomerated
stoppers, and other agglomerated products3.
2.3 Life cycle assessment of cork stoppers
Life cycle assessment (LCA) is an environmental impact study of a product.
The results of an LCA are impact scores for environmental effects, such as
impact on climate change. It is called life cycle assessment because it
examines all phases of the life cycle of a product: from material use,
production processes, transportation, use and disposal. In an LCA all aspects
that lead to emissions are inventoried, for instance the use of energy for
production processes, the use of fuel for transport and use of materials (such
as glue for making agglomerated cork products).
1
See: www20.gencat.cat/portal/site/culturacatalana/menuitem.be2bc4cc4c5
aec88f94a9710b0c0e1a0/?vgnextoid=b9825c43da896210VgnVCM1000000b0c1e0aRCRD&vgnext
channel=b9825c43da896210VgnVCM1000000b0c1e0aRCRD&vgnextfmt=detall2&contentid=2ba1
352101fd7210VgnVCM1000008d0c1e0aRCRD&newLang=en_GB.
2
This percentage is based on 2006 prices. Cork prices have since then dropped.
3
These include: including insulation panels, floor and wall tiles and sound-proofing in the car
industry, as well as for handicrafts and artistic uses.
19 May 2013 2.792.5 – Natural cork bottle stoppers: a stopper on CO2 emissions?Figure 7 shows the production chain as defined in UAB (2011), it shows the
various steps that lead to the production of cork stoppers. It shows which
phases are included and excluded: the system boundary of the study.
The dotted lined textboxes show the aspects that affect emissions.
Figure 7 System boundaries as applied in UAB (2011)
Source: CE Delft.
The UAB thesis (UAB, 2011) first calculates the environmental impacts
associated with 1 ton of raw cork material, next the ton raw cork is converted
into the most representative products. On the left corner, it can be seen that
one of these inputs is ‘atmospheric CO2’: this is the carbon sequestered in the
cork oak and soil.
As can be seen the raw cork is processed, via various half-products into end-
products. There are many links between the various production processes and
products. The cork from the first and second harvest, which is of lesser quality
is used as granulates instead of discs or natural stoppers. Reproduction cork
also generates granulates, called white granulate, after production of discs
and natural cork stoppers.
20 May 2013 2.792.5 – Natural cork bottle stoppers: a stopper on CO2 emissions?Some products are partly made of natural cork from reproduction cork and
partly out of granulates. This figure does not show other cork end-products
than natural cork stoppers and champagne cork stoppers, the UAB thesis
(UAB, 2011) does not take them into account, but there are many.
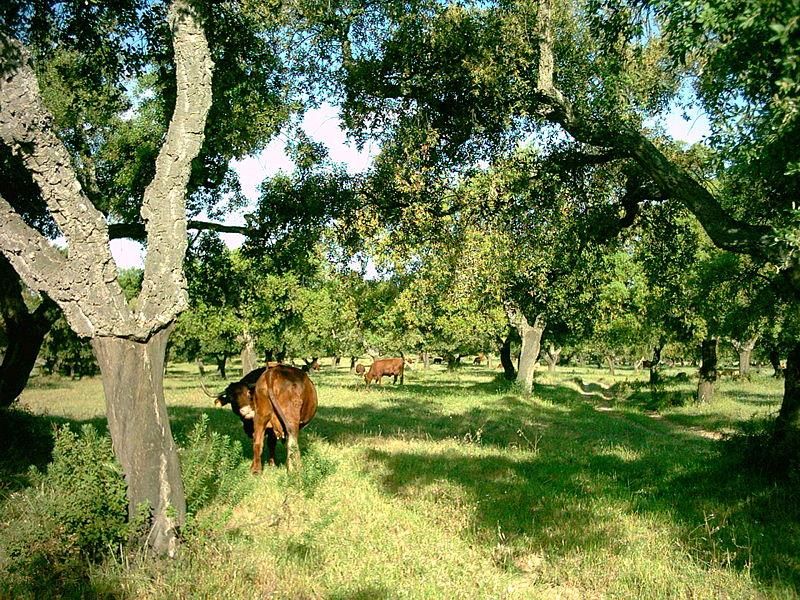
Figure 8 Other cork products: various agglomerated products; technical cork stopper 1+1;
agglomerated cork stopper
Sources: corklink.com; advancecork.com.
21 May 2013 2.792.5 – Natural cork bottle stoppers: a stopper on CO2 emissions?22 May 2013 2.792.5 – Natural cork bottle stoppers: a stopper on CO2 emissions?
3 Calculating carbon sequestration
As indicated in the previous chapter, natural cork bottle stoppers are claimed
in several LCA studies to have a very favorable carbon footprint as a result of
the carbon sequestered in the cork oak.
After introducing and explanation of the phenomena ‘sequestration’ in relation
to vegetation in general in Paragraph 3.1, this chapter focuses on cork oak
vegetation and the issue of how much CO2 is actually ‘stored’ in cork oaks.
3.1 What is meant with sequestration?
The sequestration of carbon in cork oaks as taken into account in LCA’s of
natural cork bottle stoppers refers to the general principle of tree growth and
growth of plants in general.
Trees and other kinds of plants take up CO2 from the atmosphere and water
from soils and – with the help of sunlight as energy source - convert these into
biomass for their growth, thus fixating atmospheric carbon. That is, as long as
the tree lives:
Already during its live the tree will produce several parts or products –
such as leafs, twigs, fruits, fine roots – that have a shorter live than the
tree itself. When these components fall of and die off as litter, the carbon
sequestered in them is partly released again as CO2 and is partly converted
into soil organic carbon – such as humus and microbiological biomass in the
soil.
Eventually the tree itself will die off and the wood of stem and branches
will undergo the same fate as the shorter living fractions of the tree.
The soil organic carbon is also degradable (soil respiration) and will slowly
disappear if there is no continuous supply of litter or dead trees.
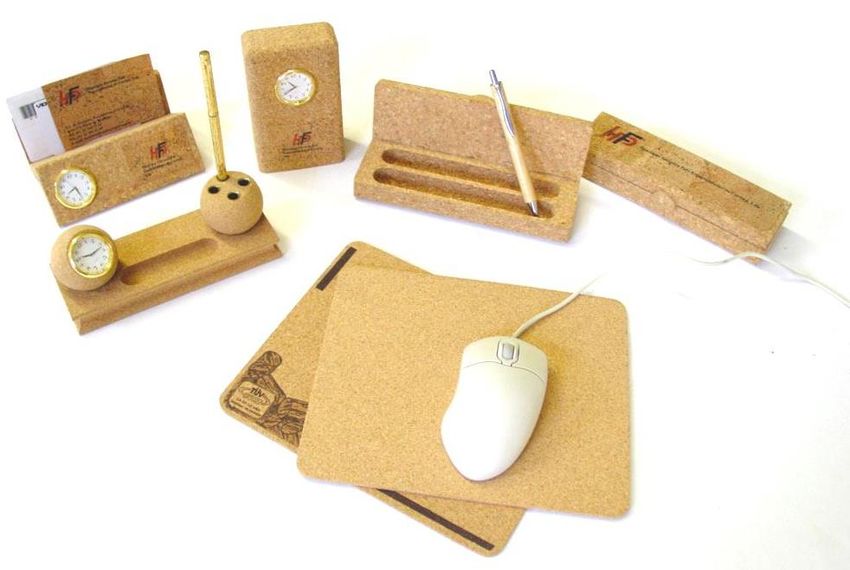
Figure 9 The main greenhouse gas emission sources/removals and processes in managed ecosystems
Source: IPCC, 2006.
23 May 2013 2.792.5 – Natural cork bottle stoppers: a stopper on CO2 emissions?There is only net additional sequestration if following preconditions are met:
1. There is a net increase in biomass and/or soil organic carbon per hectare
compared with the reference land use situation.
2. The increased amount of biomass and/or soil organic carbon remains
constant hereafter.
In a natural system such as a pristine natural forest the flows and carbon
stocks are balanced (see Figure 10) and no net increase or decline occurs.
Human activities such as:
afforestation, reforestation or deforestation;
changes in forestry management resulting in higher average biomass stocks
(see Figure 11).
may influence these flows and stocks and the carbon balance of the system or
the considered area may change.
Figure 10 Carbon cycle: emissions and uptake
Source: http://www.eia.doe.gov/oiaf/1605/ggccebro/chapter1.html.
In the case of cork production this would mean that there is a net incremental
increase in the amount of sequestered carbon if:
a new cork oak savannah or forest is realized on a previously barren area
or area with less carbon in vegetation and soil as in a cork oak savannah or
forest;
changes in management of a cork oak savannah or forest result in an
increase in the amount of carbon sequestered in vegetation and/or soil.
For practical reasons often only a period of 20 years for changes in carbon
stocks is considered, but longer periods may be considered in more detailed
analyses4.
4
www.ipcc-nggip.iges.or.jp/public/2006gl/pdf/4_Volume4/V4_02_Ch2_Generic.pdf.
24 May 2013 2.792.5 – Natural cork bottle stoppers: a stopper on CO2 emissions?Figure 11 Example of two forest plantation projects with different average biomass stocks
Source: IPCC, 20005.
Elucidation: Both horizontal lines indicate the time averaged amount of carbon stored in the
plantation trees. In Project 2 the time-averaged biomass stock is higher as the tree
grows faster as indicated by the steeper shape of the first part of the saw-tooth.
3.2 Carbon sequestration calculation in (UAB, 2011)
In the UAB thesis (UAB, 2011) a constant annual sequestration rate of 0.78 ton
C/ha/year or 2.9 metric ton of CO2 mentioned in Gràcia (2012) for cork oak
forests in Catalonia is used as the basis for the GHG footprint calculation.
The sequestration rate is assumed to be constant throughout the life of the
tree, average life of Catalonian cork oak assumed to be 200 years.
As the sequestered CO2 is partly used for producing cork, the annual average
cork yield over the life of the tree – assumed to be 0.15 ton/ha/year - is
subtracted from the sequestered amount of CO2. No relation with the chemical
composition of the cork and its carbon content is taken into account.
Assuming these constant annual fixation rate for CO2 and cork yield, the
amount of CO2 effectively sequestered per unit of cork is calculated in the
thesis as being (2.9 – 0.15) ÷ 0.15 = 18.3 ton of CO2/ton of cork.
The footprint calculation ignores reference land use and possible removal of
cork oak after they reached the end of their economic useful life.
It is this value of 18 ton CO2/ton cork, as well as the allocated values as shown
in Figure 12, that are presented in the media6 by the natural cork industry for
promoting cork for bottle closure and as a way of reducing the greenhouse gas
footprint of wine, according to the UAB thesis (UAB, 2011) with as much as
20-40%.
5
See: http://www.ipcc.ch/ipccreports/sres/land_use/index.php?idp=274.
6
See e.g.: Rotllan Torra: www.rotllantorra.com/pages/pdf/N%C2%BA41-
2012/RT%20NEWS%20Publ%20No%2041%202012.pdf.
OIV: www.corkfacts.com/publications/2011dec29pge03.htm.
25 May 2013 2.792.5 – Natural cork bottle stoppers: a stopper on CO2 emissions?Figure 12 CO2 balance for the cork sector in Catalonia, as calculated in UAB (2011), figures per 1,000 kg
harvested cork
Source: UAB, 2011.
Elucidation: The left bar gives the total emission (black part) of greenhouse gases and the total
amount of CO2 sequestered in cork oaks. The four bars at the right side of the graph
give the division over the four products.
It is noted that this footprint calculation ignores reference land use and
possible removal of cork oak after they reached the end of their economic
useful life.
In following paragraphs we explore the different aspects related to gross and
net carbon sequestration in cork oak landscapes.
3.3 Land use and cork oak systems throughout the ages, is there actually
a net-sequestration?
As indicated in Paragraph 3.1 there is only a claimable carbon sequestration in
vegetation and/or soil organic matter when:
1. There is a net increase in biomass and/or soil organic carbon per hectare
compared with the reference land use situation.
2. The increased amount of biomass and/or soil organic carbon remains
constant hereafter.
Both aspects are discussed in this paragraph.
Reference land use
It is for certain that the land area on which a cork oak agro-forestry system is
applied has had a prior ‘use’ - either economic or natural - and that there was
vegetation before the cork oak system was realized.
A study by Plieninger (2007) for example shows on the basis of
cartographic, written and oral historical evidence that Dehesas in
Andalusia – the main cork region in Spain - have been established primarily
by thinning of more dense woodlands and shrub lands.
A study by Jones et al. (2011) also clearly indicates that in Portugal too
most Montado cork oak systems have been realized by conversion of
‘uncultivated land’, mainly referring to ‘macchia’ and the ‘garrigue’ shrub
lands.
26 May 2013 2.792.5 – Natural cork bottle stoppers: a stopper on CO2 emissions?This means that cork oak agro-forestry systems supplying cork for still wine
closures have probably been established by removal of vegetation. The amount
of carbon additionally sequestered in cork oak landscapes (including soils and
undergrowth) will be lower than the total amount of carbon present in
vegetation and soil and may even be negative, if the original vegetation
contained more carbon than the managed cork oaks.
End of life of cork oak and cork oak regeneration
There is only a net carbon sequestration if the cork oak agro-forestry system is
maintained. However socio-economic drivers such as pressure due to factors as
the exodus of rural populations and the unprofitability of the ‘traditional’
Montado and Dehesa systems have resulted on one hand in the abandonment
of these systems or of understory mismanagement in these systems.
But on the other hand these drivers also resulted in conversion of these
systems into intensively used arable land (Regato-Pajares et al., 2004).
In other words in the removal of the cork oaks. This is in contrast with the UAB
thesis (UAB, 2011) and similar LCA’s, in which the assumption is made that the
tree will remain in place forever.
Figure 13 Land use change in Portugal (1875-1980)
Source: Jones, 2011.
Subsidies have also proven to be a threat to traditional cork oak woodlands.
As stated by WWF: ‘Subsidies have Plantations of exotic forest species have
replaced the traditional cork oak forest landscape in many areas, whilst in
others, valuable scrub areas have been converted to cork oak plantations.
These plantations typically have low biodiversity values. Often driven by
agricultural and forestry subsidies, this combination of conversion,
intensification, and changed land use has contributed to an increase in the
incidence of fires and a reduction in the health of the cork woodlands 7’.
7
http://awsassets.panda.org/downloads/beyond_cork_publication.pdf.
27 May 2013 2.792.5 – Natural cork bottle stoppers: a stopper on CO2 emissions?Conclusion
There is a probability that preconditions under which carbon sequestration in
cork oaks could be claimed are not met as cork oak landscapes have at least
partially been created by removing original vegetation and as part of the cork
oak landscapes has been converted into arable land.
3.4 Carbon sequestration during tree growth: different age - different
regions – different seasons - different amounts – different averse
conditions
But even if both preconditions mentioned in Paragraph 3.1 are met and
1) there is a net increase in biomass per hectare compared with the reference
land use that; 2) next remains constant in time, the question remains how
much carbon cork oak agro-forestry systems can actually sequester.
Growth and carbon sequestration in managed cork oaks
How much a cork oak will eventually grow and how much wood and cork it will
contain and produce depends on the natural conditions (climate, soil) and on
tree management.
A managed cork oak has different growth rates during its life time. Carbon
stock build up is rapid in the beginning and slows down to practically zero
when the tree is getting older en cork oak is being harvested and pruned
regularly. In combination with tree thinning practices, this has a detrimental
effect on the amount of biomass accumulation per ha. According to
(Canellas 2008), this biomass is rapidly increasing until the tree age of 30 years
and then remains pretty constant through the remainder of its life span
(see Figure 14).
Figure 14 Cork oak forest biomass growth rates per ha as function of time for above ground (Wa) and
below ground (Wr) carbon mass
Source: Canellas, 2008.
28 May 2013 2.792.5 – Natural cork bottle stoppers: a stopper on CO2 emissions?Regional differences in growth and cork yield
Since natural conditions in the different regions in Spain, Portugal and
northern Africa vary, the growth rate as indicated by the increase of height,
also differs between the different regions:
Cork oaks in Spain – both south Spain and Catalonia - and in Tunisia general
reach a height of 8-12 metres after 80 years (see Figure 15).
Cork oaks in Portugal on average reach a height of 10-14 metres after
80 years. At optimum locations a height of 16-18 metres may be reached,
see Figure 16.
Figure 15 Height growth curves for cork oaks in Spain (Catalonia and Andalusia)
Source: Sánchez-González et al. (2005); Sánchez-González et al. (2010).
In the same region, the growth rate can vary due to year-to-year
climatological differences. A nice example was reported by Pereira (2007)
which shows that carbon stock growth in four consecutive years can be very
different and can range from 0.28 ton C/ha/yr to 1.40 ton C/ha/yr. In this
case, the amount and timing of the rainfall was very important to regulate the
growth potential of the oak tree.
Figure 16 Height growth curves for cork oaks in Portugal
Source: Coelho, 2012.
29 May 2013 2.792.5 – Natural cork bottle stoppers: a stopper on CO2 emissions?The effect of the different management systems in which frequent thinning of
the standing stock to optimize production of cork (and acorns – Paragraph 2.1)
results in flattening of the increase of biomass in standing stock to:
approximately 150 metric tons dry wood/hectare or 70 metric tons of
C8 per hectare (rounded, including roots) on average for cork oaks in
southern Spain and Portugal (Canellas, 2008) and produce approximately
73 metric ton of raw cork (dry matter) during their productive life
(see Canellas, 2008);
approximately 250 metric tons dry wood/hectare or 120 metric tons of
C6 per hectare (rounded, including roots) for stands in Portugal on
favorable locations (dominant height after 80 years of 15 meters)
(see Coelho,2012).
An indication of the development of the amount of cork in time is illustrated in
Figure 17.
Figure 17 Cork biomass production during average cork oak life in Spain
Source: Canellas, 2008.
Figure 18 Biomass production and accumulated CO2 for wood in cork oak forests in Spain
Source: Canellas, 2008.
8
The amount of carbon sequestered in this biomass can be estimated assuming a carbon
content in cork oak wood of 47% (Canellas, 2008).
30 May 2013 2.792.5 – Natural cork bottle stoppers: a stopper on CO2 emissions?Table 2 Some specifications of cork oaks on the Iberian Peninsula
Region Yield Cycle Tree life No. of Dominant Climax Simulation
(kg/tree/ ton ton ton d.m. duration (years) Trees height carbon or field
cycle) d.m./ d.m./ during (years) (no/ha) after 80 sequestered measurement
ha/cycle ha/year total years in tree (ton)
tree (meters)
life
WWF, 2006
Young tree 25
Mature tree 60
Canellas, 2008 Spain, average sim.
Maximum (Quality II location) 60 9.0 0.90 10 150
Minimum, 8 4.2 0.42 10 500
first harvest
Average 6.1 0.61 73 10 160 12 70
Costa, 2004 South-western 0.90 9 67 field
Portugal
Caparros, 2010 Los Alcornocales, 0.49 70 20 144 sim./field
Spain
Coelho, 2012 Portugal 0.69 96 9 140 270-40 15 120 sim.
Canellas, 2002 Extremadura 10 field
Maximum 75
Minimum 35
31 May 2013 2.792.5 – Natural cork bottle stoppers: a stopper on CO2 emissions?More information is summarized in Table 2. The data in the table is compared
with practical yields as reported in literature for verification.
In practice carbon stocks in vegetation may be smaller as indicted in the table,
due to loss of trees or parts of trees due in wild fires.
On the Iberian Peninsula, wild fires are commonly occurring. The cork oak tree
has a large chance of surviving these fires but still during the blast CO 2 is
emitted and lead to a lowering of the carbon stand.
Catalonian cork oak forests
Studies by Sánchez-González et al. indicate that cork oaks in Catalonia and
Southern Spain reach comparable heights after 80 years. Based on this
information, we assume that the amount of carbon sequestered in cork oak on
average in Spain is also representative for cork oaks in Catalonia.
According to the Catalonian 2012 greenhouse gas emission inventory (see
Llebot, 2012; Gràcia, 2012)9 current standing stock of cork oaks amounts to
approximately 32 metric tons of carbon per hectare (Figure 19) and annual
sequestration amounts to 0.78 ton C/ha/year.
These figures indicate that Catalonian cork oak forests are probably relatively
young as the accumulated amount of carbon is rather low and as annual
sequestration is rather high.
Figure 19 Accumulated carbon per forest area unit in Catalonia of different tree species
Source: see Llebot, 201210.
3.5 A more appropriate sequestration figure?
As can be seen from Table 2, there are many different reports and values for
carbon stock growth rates of cork oak forests. Looking at the number used by
UAB (2011) it is on the high side of the spectrum, which would mean that the
total amount of CO2 sequestered per ton raw cork extracted is on the high side
too.
9
See: www15.gencat.cat/cads/AppPHP/images/stories/publicacions/informesespecials/
2010/sicccat/informe_per_captols/05_embornals.pdf.
10
www15.gencat.cat/cads/AppPHP/images/stories/geccc/sicc_resum.pdf.
32 May 2013 2.792.5 – Natural cork bottle stoppers: a stopper on CO2 emissions?Since there are so many variables which come into play for determining the
carbon stand growth rate, it will be difficult to have one representative
number which can be used to calculate the amount of CO2 sequestered per ton
raw cork extracted from the forest. It would be better to provide a range
(min, max) per region of origin which would describe the situation and takes
forest age, climate change, soil conditions, etc. into account.
Another thing to consider is that cork oak forest are not always pure and are in
many cases mixed forests. Since many other trees have higher carbon stock
growth rates than cork oak (see Llebot, 2012) it will create a higher per ha
carbon growth rate than when this would be a pure cork oak forest.
For the time being, CE Delft would recommend to use modeling data to come
to an accepted and representative carbon stock growth rate. Based on
literature we would suggest using a range from 0.95 to 1.25 C/ton cork
(see Table 2 and Paragraph 3.4):
On average Spanish locations:
a cork tree sequesters 145 tons of biomass or 70 tons of carbon per ha
during its life span;
likewise, during its life span it delivers 73 tons of raw cork per ha;
so the amount of carbon sequestered per ton of raw cork is
70 ÷ 73 = 0.95 ton C/ton cork;
this would correspond to 3.5 ton CO2 per ton of raw cork which is
5 times less than reported by UAB (2011).
On favorable locations in Portugal:
a cork tree sequesters 250 metric tons dry wood/hectare or 120 metric
tons of C per hectare during its life span;
likewise, during its life span it delivers 96 tons of raw cork per ha;
so the amount of carbon sequestered per ton of raw cork is
120 ÷ 9,673 = 1.25 ton C/ton cork;
This would correspond to 4.5 ton CO2 per ton of raw cork which is
4 times less than reported by UAB (2011).
3.6 Overall conclusions
There is a probability that preconditions under which carbon sequestration in
cork oaks could be claimed are not met as cork oak landscapes have at least
partially been created by removing original vegetation and as part of the cork
oak landscapes has been converted into arable land.
Next to this the carbon sequestration rate assumed in UAB (2011) is in itself at
the high end of the range found for cork oaks and is more representative for
the early development of the tree in its first decades of growth – before cork
of sufficient quality for wine bottle stoppers can be harvested. For the time
being, CE Delft would suggest using a range from 0.95 to 1.25 C/ton cork.
A more representative and region or location specific sequestration rate may
be determined via modeling studies with models such as CORKFIT and SUBER.
33 May 2013 2.792.5 – Natural cork bottle stoppers: a stopper on CO2 emissions?34 May 2013 2.792.5 – Natural cork bottle stoppers: a stopper on CO2 emissions?
4 Carbon sequestration and LCA
4.1 Introduction
In previous chapter we discussed the value of carbon sequestration. Or more
exact: the change in carbon sequestration over the years. It is investigated
how much carbon is extra sequestered in cork oak forests, in respect with the
reference land use situation. In Chapter 3, we also showed the variability of
carbon sequestered in biomass and soil per region.
The next questions are: may we actually take this change in carbon into
account in LCA? And if yes: how?
In this chapter we look into this matter. Is there a standardized method?
Does it apply to cork as well? Secondly, the issue of dealing with different
regions is discussed.
4.2 Standardization methods on carbon sequestration
4.2.1 Carbon credits in LCA
Question should the carbon sequestration be taken into account in LCA?
A number of documents offer guidelines for performing life cycle assessment:
ISO standards within the 14,000 range11 offer directions for good
LCA practice and greenhouse gas inventories on a macro level.
The ILCD12 Handbook, elaborates on the ISO standards on LCA. It is
developed by the joint research centre (JRC) for providing more detailed
guidance. Both a general guide for LCA and a specific guide for LCI 13 exist.
The British PAS 2050 specification (PAS 2050:2011) builds on the
ISO standards on LCA and provides hands on approach for CO2 footprint
studies of goods and services. In 2012, a supplementary PAS 2050
document was issued (PAS 2050-1:2012), specific for GHG emissions of
horticultural products.
There is consensus that effects due to land use change should be taken into
account: both the ISO standard, the ILCD Handbook by JRC and PAS 2050
mention this. This means that when cultivation leads to either a carbon uptake
or to a carbon loss, the net results should be incorporated in the LCA study.
The time horizon for GHG accounting due to land use change is 20 years: only
GHG emissions or uptake that occurred during the previous 20 years should be
taken into account in carbon footprint studies.
11
ISO 14040 Environmental management - LCA - principles and framework.
ISO 14044 Environmental management, Life cycle assessment, Requirements and guidelines.
ISO 14064 Greenhouse gases (Part 1, 2 and 3).
12
International Reference Life Cycle Data System.
13
LCI is short for Life Cycle Inventory (see terms and definitions).
35 May 2013 2.792.5 – Natural cork bottle stoppers: a stopper on CO2 emissions?ISO and ILCD don’t supply specific guidelines; the PAS documents do. But, we
will see that it depends on how we define the cork oak cultivation system,
whether or not we should take carbon sequestration into account. This is
illustrated by a number of statements of the PAS documents.
On the issue of carbon sequestration in forests, PAS 2050:2011 states:
‘While forest management activities might result in additional carbon storage
in managed forests through the retention of forest biomass, this potential
source of storage is not included in the scope of this PAS.’
So (Statement 1): NO.
But on soil carbon:
‘When not arising from land use change, changes in the carbon content of
soils, including both emissions and removals, shall be excluded from the
assessment of GHG emissions (…)’.
So (Statement 2): NO, unless it is due to land use change.
And on products from trees:
‘Carbon incorporated in plants or trees with a life of 20 years or more
(e.g. fruit trees) that are not products themselves but are part of a product
system should be treated in the same way as soil carbon, unless plants and
trees are resulting from a direct land use change occurring within the
previous 20 years’.
So (Statement 3): NO, unless it is due to land use change that occurred
within the previous 20 years.
But then, the most recent supplement for horticultural products, PAS 2050-
1:2012, states:
‘Cradle-to-gate assessment of horticultural products shall include GHG
emissions and removals arising from all processes, inputs and outputs (…)
including: emissions and removals of biogenic carbon (…) where that biogenic
carbon does not become part of the horticultural product.’
So (Statement 4): YES.
Conclusion: whether or not to take net carbon sequestration into account in
LCA depends how raw cork is defined and whether the carbon sequestration is
due to land use change. At least: when PAS 2050 is followed. This issue will be
discussed in the next paragraph.
4.3 Interpretation of the cork cultivation system within PAS 2050
So how should the cork cultivation system be interpreted, to know whether or
not the net carbon sequestration should be taken into account in LCA?
And what are the consequences?
The carbons sequestration in cork oak forests is, however, not specifically due
to land use change, it occurs naturally while the forest matures.
Cork is not a horticultural product, it is a product from agroforestry, but it is
similar to horticultural products - such as apples, berries and grapes - in the
sense that a part of the tree or plant is harvested. A forest area by definition
is at least 30% covered by the crowns of the trees and is at least 5 meters in
height (see e.g. REDD). The Dehesas and Montados comply with this definition
and are called forests. Products from horticulture do not match the criteria -
most orchards are less than 5 meters high.
36 May 2013 2.792.5 – Natural cork bottle stoppers: a stopper on CO2 emissions?You can also read