Fiji Terrestrial Report 2019 - Operation Wallacea
←
→
Page content transcription
If your browser does not render page correctly, please read the page content below
Fiji Terrestrial Report 2019

                     Edited by Dr. Jane Hardwick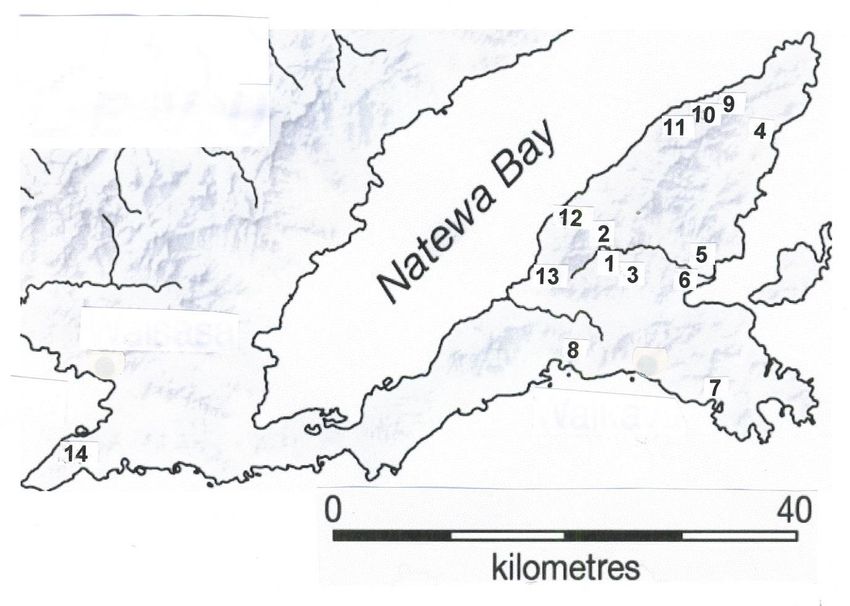
Contents
Research Team and Forest Guides ............................................................................................. 2
General Introduction .................................................................................................................. 3
Research Objectives ................................................................................................................... 4
Maps ........................................................................................................................................... 5
Habitat and Carbon Report ........................................................................................................ 6
   Introduction ............................................................................................................................ 6
   Methods .................................................................................................................................. 7
   Results .................................................................................................................................... 7
   Discussion and Future Recommendations ........................................................................... 10
Ornithological Report .............................................................................................................. 11
   Introduction .......................................................................................................................... 11
   Methods ................................................................................................................................ 11
   Results .................................................................................................................................. 12
   Discussion ............................................................................................................................ 17
   Future Recommendations..................................................................................................... 20
Arachnid Report ....................................................................................................................... 22
   Introduction .......................................................................................................................... 22
   Methods ................................................................................................................................ 22
   Results .................................................................................................................................. 23
   Discussion and Future Recommendations ........................................................................... 26
Lepidoptera Report .................................................................................................................. 27
   Methods ................................................................................................................................ 28
   Results .................................................................................................................................. 29
   Discussion and Future Recommendations ........................................................................... 32
Acknowledgements .................................................................................................................. 33
References ................................................................................................................................ 34
Supplementary Material ........................................................................................................... 38

                                                                        1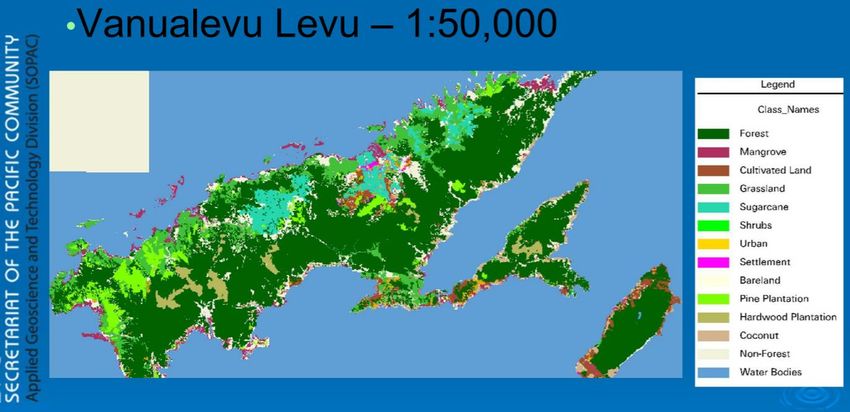
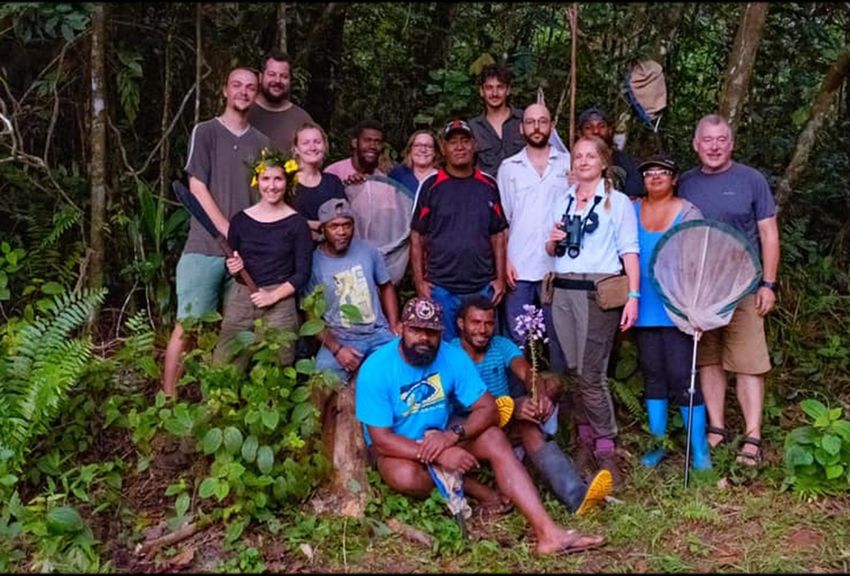
Research Team and Forest Guides

Research Team
Jane Hardwick (Senior Scientist and Entomologist) 2nd June – 29th July (full season)
Joe England (Ornithologist) 3rd June – 29th July (full season)
Rachael Thomson (Carbon/Habitat Surveyor) 4th June – 29th July (full season)
Clive Huggins (Lepidopterist and Representative Swallowtail and Birdwing Butterfly Trust
(SBBT)) 8th June – 14th July (5 weeks)
Rachel Hufton (Ornithologist) 24th June – 20th July (4 weeks)
Filippo Castellucci (Arachnologist) 24th June – 20th July (4 weeks)
Kieran Marshall (Carbon/Habitat Surveyor) 24th June – 20th July (4 weeks)
Joe Salmona (Carbon/Habitat Surveyor) 24th June – 20th July (4 weeks)
Visheshni Chandra (Lepidopterist from USP) 7th July – 29th July (3 weeks)

Fijian Survey Guides
David – Head Guide and Carbon/Habitat Guide (left picture)
Tui – Carbon/Habitat Guide
Tui (King) – Arachnid/Invertebrate Guide
Vosa – Arachnid/Invertebrate Guide
Maika – Butterfly Guide (right picture)
Bill – Bird Guide (middle picture)

                                               2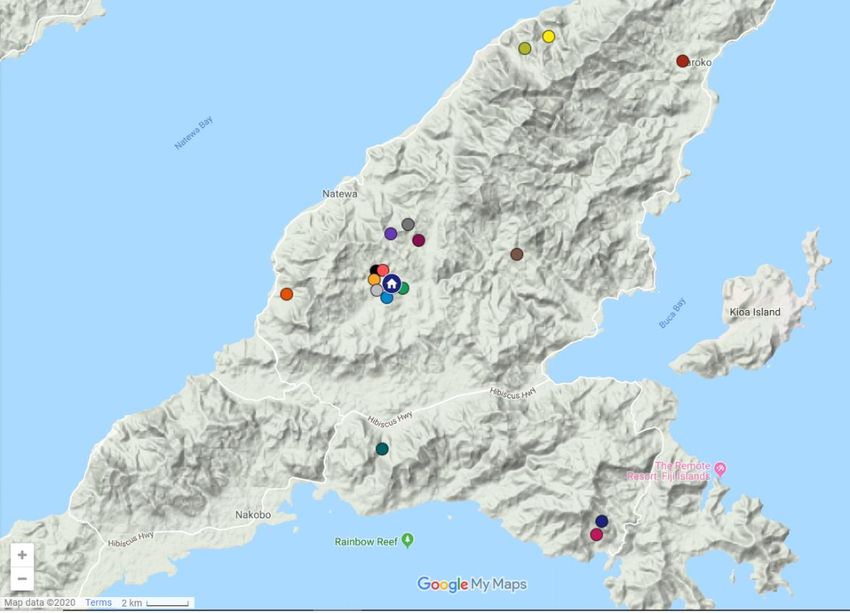
General Introduction

Island habitats are particularly vulnerable to environmental changes; at least 75% of all
known extinctions since 1600 AD have occurred on oceanic islands, in particular this has
affected birds and amphibians. One of the main causes of these extinctions is the introduction
of non-native invasive species (Groombride et al. 2002). It is well documented that the
introduction of invasive species (including rats, cats, pigs, mongoose and cane toads) to Fiji
has caused huge losses to native biodiversity (Morley 2004; Morrison et al. 2004). In
particular, the mongoose (Herpestes javanicus) are opportunistic feeders feeding on a variety
of food types including lizards, frogs, toads, birds, invertebrates and plants (Gorman 1975). It
is thought that they are one of the key drivers of the decline in many herpetofauna and bird
species in Fiji, in particular, the banded iguana (Brachylophus spp.) and Fiji’s only endemic
amphibians – the Fiji ground frog (Platymantis vitianus) and the Fiji tree frog (Platymantis
vitienus) (Morrison et al. 2004). The issue of the mongoose, coupled with extensive
deforestation and land-use change have caused rapid biodiversity loss to Vanua Levu and
many of the other Fijian islands (Olsen et al. 2006).

The Fijian archipelago consists of approximately 320 islands, of which Viti Levu and Vanua
Levu are the two largest. The Fiji Islands are volcanic and have a unique flora and fauna
including an entire family of plants (Degeneriaceae), two species of iguana and an endemic
snake genus (Ogmodon). The proportion of endemic plants, however, is debated due to
controversies in the number of endemic plants but between 25-63% of vascular plants are
endemic (Ash 1992; Smith 1996). Furthermore, 40 % of herpetofauna species are endemic
and another 40% are considered native (Morrison 2004). There are also 31 endemic species
of bird (Lepage 2020). The Natewa Peninsula is 60km long and makes up the south-eastern
section of Vanua Levu. The landscape across the peninsula is rugged, with steep forested
hills. Extensive logging was carried out across the lowland areas of the peninsula from 1969
to 2000 (Masibalavu and Dutson 2006; Powling 2018). There is only one protected area on
Vanua Levu, a 120ha area called Waisali Forest park, but it is proposed that the Natewa
Peninsula should be designated as a National Park, to prevent further damage to this unique
environment (Powling 2018). Taveuni Island, which lies only 6.5km to the east of the
peninsula and is of similar size and boosts three large protected areas totalling 16,685ha.
Taveuni’s native wildlife has also been protected from the invasive mongoose, which do not
yet occur there (Morley 2004). In the future, it is hoped that Operation Wallacea survey
teams can collect data in Taveuni to make biodiversity comparisons to the Natewa Peninsula.

                                               3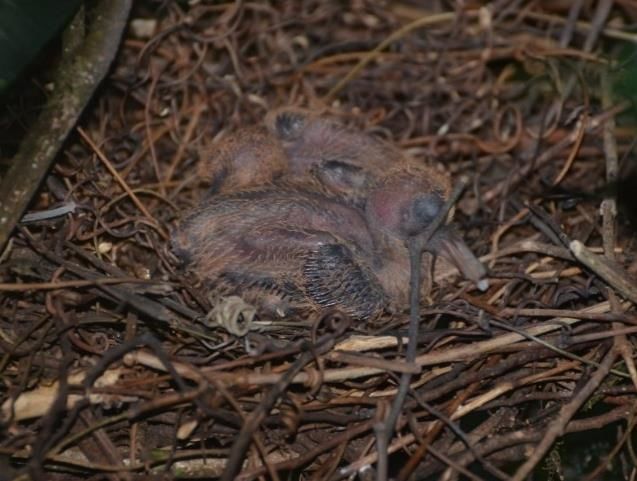
Research Objectives
For Operation Wallacea’s third season of surveys in Vanua Levu Fiji, a combination of
biodiversity and carbon data were collected across the Natewa Peninsula throughout the
months of June and July 2019. This report summarises the data gathered by the scientists and
students who assisted with field surveys. Operation Wallacea’s Fiji forest base camp is
comprised of a tented camp alongside an abandoned Forestry Cabin in the centre of the
Natewa Peninsula. The surveys carried out provide biodiversity data which can be used as a
guide to determine the biological value of the Natewa Peninsula, with the primary goal being
able to prove the peninsula is an area of great conservation importance and implementing a
“National Park” level status to protect the land from land-use change amongst other threats
(Powling 2018).

This report will detail the findings from the 2019 data collection and show comparisons to
previous years where possible. However, comparisons must be taken with caution due to
factors such as changes to climate or different surveyors using slightly different techniques.
Furthermore, as there are only three seasons worth of data for Fiji so far, it is too early to
make any reliable temporal conclusions. However, these data can be used to compile species
records and for spatial analyses across the landscape.
The overarching aim of the research carried out across the Natewa Peninsula is to provide a
biological value of the peninsula by estimating the amount of carbon stored in the forests and
by identifying the biodiversity, and, in particular, gaining a better understanding of the
ecology of species that are endemic to the peninsula area. More specific aims for this year’s
fieldwork were:

   -   To collect carbon measurements for approximately one hundred 20 x 20m forest plots
       across the peninsula and classify forest types where surveys are carried out

   -   To resurvey all bird transects from previous years, and to add new bird survey sites so
       that bird biodiversity can be measured across the peninsula and monitored yearly

   -   To assess the distribution and ecology of the Natewa silktail (Lamprolia klinesmithi)
       (endemic to the peninsula), the orange dove (Ptilinopus victor) and the maroon
       shining parrot (Prosopeia tabuensis)(both endemic to Vanua Levu and offshore
       islands).

   -   To investigate Arachnids communities at each bird survey site across the peninsula

   -   To measure 20 x 20m habitat plots at each bird and invertebrate site, to understand the
       main factors that are driving their biodiversity

   -   To survey the butterfly communities across the peninsula and to update the species
       record list

   -   To increase knowledge about the ecology and behaviours of the Natewa swallowtail
       (Papilio natewa) (a new species of butterfly discovered by Opwall teams in 2018)

                                               4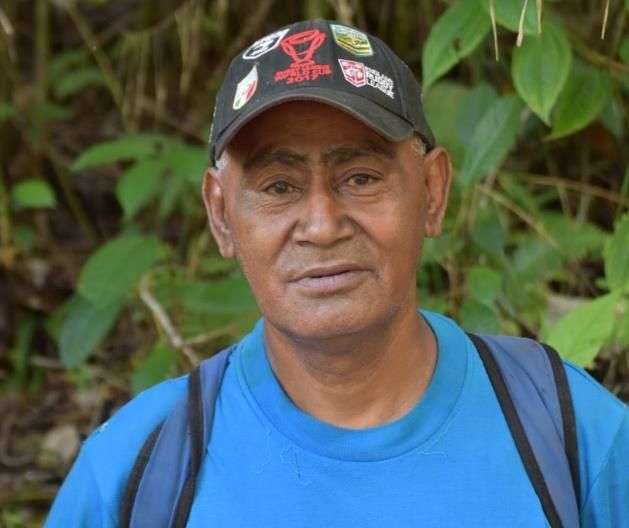
Maps

 Figure 1. Map of Fiji Islands (not all shown) and location of the Natewa Peninsula
                            (shaded area) on Vanua Levu.

Figure 2. Map of survey sites on Vanua Levu. Each coloured dot represents six survey
                                       sites.

                                         5
Habitat and Carbon Report
by Joe Salmona, Rachael Thomson and Jane Hardwick
Introduction
Since the development of modern agriculture, humans have had a complex relationship with
the world’s forests. Between the seventeenth and nineteenth centuries, temperate forests in
the Americas and Australasia were logged heavily as a result of European expansion,
resulting in the depletion of tropical forests (Smith and Borocz 1995). Tropical forest
destruction not only has local consequences but can also have global consequences. On a
local level, deforestation and forest degradation can cause changes in climate, physical and
chemical soil properties, and hydrological disturbances (Cramer et al. 2004). Deforestation
on a great scale can change albedo and atmospheric water balance could affect regional
weather patterns (Lawton et al. 2001). There are concerns that deforestation can contribute to
atmospheric warming from the addition of carbon dioxide into the world’s atmosphere from
biomass burning or decomposition (Fearnside 1996). Arguably, the greatest problem that
results from destroying tropical forests is the unprecedented loss of biological diversity
within tropical forests (Gibson et al. 2011). Our understanding of numbers, distribution and
status of tropical ecology is extremely limited. To combat the large knowledge gap, further
research is required and a conservation solution is to preserve much of the remaining forests.

The Pacific has high terrestrial biodiversity and endemism including more than 30,000 plants
and 3,000 vertebrates (Mittermeier et al. 2004). Much of this unique biodiversity is poorly
understood and has little protection. Pacific nations have relatively little funding from the
government or environmental organisations. This has led to habitat loss and degradation
being leading causes of tropical forest loss in the Pacific. To help resolve the
biodiversity loss, developed countries have funded and implemented local conservation
initiatives with non-governmental organisations (NGO’s). Despite these efforts most
conservation programmes have been unsuccessful in reducing biodiversity loss and
environmental degradation has continued at a steady rate in some Pacific countries with
0.15% of total land area and less than 20% of discovered ecosystems are in designated
protected areas (Chape et al. 2003). Ma et al. 2013 suggests the poor conservation outcomes
are attributed to differences in land ownership, cultural, economic and social differences.
They suggested that increased landowner involvement, alternative income generating
activities, stakeholder understanding/collaboration, improved conservation funding
management would greatly improve conservation efforts in the region.

To address the current conservation issues in Fiji, Operation Wallacea established a project in
2017 within the Natewa Peninsula on the second largest Fijian Island (Vanua Levu). One of
the main aims of the project is to categorise different forest types in the area and record the
amount of forest carbon to collaborate with the REDD+ scheme in Fiji (The REDD Desk
2020). By working with local Mataqali landowners, stakeholders and prioritising the
integration of the local people and the local economy Operation Wallacea wishes to establish
a National Park designation in the area. The designation of the National Park will ensure that
the protection of Fiji’s endemic birds, plants, herpetofauna, invertebrates and marine life will
have the necessary protection. Additionally, by surveying forest habitat and carbon plots
throughout the peninsula and involving REDD+ scheme funding, the protection of the forest
and the local economies with be ensured. Following on from previous years the aims
included bringing the total number of carbon plots to approximately 100 (29 were completed
previously) across a range of habitats to make a more accurate estimate of carbon in stored in

                                               6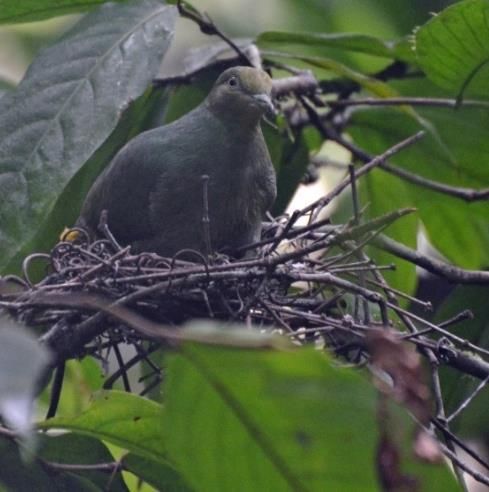
different forest types. Additionally, habitat data were collected to use alongside the
biodiversity surveys to determine which factors were important for different species.

Methods
The study was conducted on the second largest island of the Fijian archipelago (Vanua Levu)
on the Natewa Peninsula which covers an expanse of 55,000 ha (Figure 1). The area is
covered by craggy lowland and hill forest extending from 800m to sea level. Land across the
peninsula is owned by at least 30 landowning units (Mataqali) across more than 16 villages
(Ravuso, 2013).

Habitat and carbon plots were surveyed over an eight-week period in June and July 2019. At
each site shown on Figure 2, six sample plots (20mx20m) were surveyed along a 1km
transect 200m apart. In order to obtain a representation of forest across the peninsula, survey
sites were selected based on the level of forest disturbance, degree of slope and distance from
human habitation. Within the quadrats, circumference at breast height (CBH) was measured
for trees, poles and saplings. Trees were measured at a cbh>47cm, poles 16cm
and saplings 47cm) observed in each plot, a MS Excel spreadsheet was used to convert CBH into
diameter at breast height and then feed into our allometric model for tropical lowland forest
to give a total carbon value in kg for each the plot.

Results
Following on from a successful 2018 season, the fieldwork program was expanded to new
forests in new parts of the Peninsula in 2019. A total of 83 and 84 sites were surveyed for
habitat and carbon stocks, respectively, in 2019. This brought the total number of plots across
the peninsula to 113 (carbon plots) and 112 (habitat plots), which surpassed our goal of
reaching 100 plots. With the assistance of two local guides, David and Tui, both in their 3rd
season with Operation Wallacea, we have a high degree of confidence in the identification
and translation of local tree species. The majority of sites surveyed in 2019 were categorised
as either undisturbed primary forest (32%) or disturbed (logged, 35%), with the remainder
being categorised as edge plots (9%), plantation (9%) or road (15%).

As can be seen in Figure 3, the majority of plots measured had a carbon stock of between
5,000kg and 25,000kg. At the individual plot level, we found that the average carbon stock
was 14,470kg (median=9,867kg, std error=2,223kg, n=84) with a high degree of variability
due to outliers. There was one plot that had no carbon according to our model as no trees
were recorded -Transect D Point 1 on an old logging road. The site with the second lowest
carbon was Transect D Point 2, also on an old logging road, with 536kg of carbon. However,
we increased our largest value for carbon stock in a single plot from 60,389kg in 2018 to
143,960kg in 2019. This was recorded at Dakuniba Transect A Point 3. The second largest
value for carbon, 123,601kg (Nabu Point 4) was recorded in close proximity to the marine

                                               7
site.
Number of plots

                  Figure 3. Average carbon recorded per plot across the Natewa Peninsula.

 At the transect level, the transect that recorded the highest average carbon value was Nabu
 (38426.8kg per site) closely followed by Dakuniba Transect 1 and Bagasau. These sites also
 had high relative standard error due to outliers. The sites closest to Base Camp, which
 previously served as a logging camp, had the lower average carbon values than transects in
 more remote locations (Figure 4). These values tended to be consistently lower as shown by
 their smaller standard error. As observed by students and scientists alike, the transects around
 Base Camp were heavily disturbed and at times during the season we interacted with heavy
 machinery and farmers during surveys. The more remote sites that were difficult to access for
 research are typically more difficult to reach with heavy machinery and are less likely to be
 disturbed.

                                                    8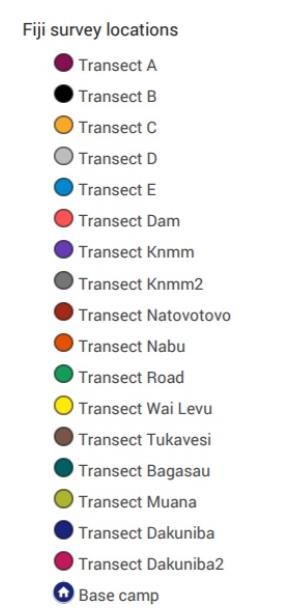
Carbon (kg/plot)

                    Figure 4. Average carbon recorded per six-plot transect across the Natewa Peninsula.

                   When testing for correlations between amount of carbon (per plot) and other habitat variables
                   (using Pearson’s test if data were normal and Kendall’s tau for non-normal variables), carbon
                   was negatively correlated to canopy scope readings and the amount of disturbance to plots
                   and positively correlated to total saplings and total trees (Table 1 and Figure 5 A- D). No
                   correlation was found between total number of poles per plot and amount of carbon recorded.
                   Outliers were removed from data for these tests.

                    Table 1. Habitat variables tested for correlation with total carbon (kg/plot), test used
                             (based on whether data were normal or not normal) and p-values.

                    Variables                            Test                     P-value
                    Total carbon and canopy scope        Kendall’s tau            0.002*
                    Total carbon and total saplings      Pearson’s correlation    0.02*
                    Total carbon and total poles         Pearson’s correlation    0.7
                    Total carbon and elevation           Kendall’s tau            0.4
                    Total carbon and disturbance level   Kendall’s tau
Figure 5. Significant relationships shown on scatter plots between total carbon (kgs per
plot) and A) mean canopy scope ‘light’ reading, B) disturbance level (on a scale of 1 to
4, where 1 is least disturbed and 4 is very disturbed), C) total number of tree, and D)
total number of saplings.
Discussion and Future Recommendations
The 2019 field season was successful as it successfully built on the data collected in previous
years. The Forest Team were able to leverage improved relationships with Mataqali
landowners to survey new areas of the peninsula and build a greater picture of the health of
the forest. The results show that we were able to find some trends between habitat variables,
showing that the more disturbed habitats (that would have greater canopy scope ‘light’
readings and less trees) were indeed the plots with the least carbon. However, more plots in a
greater variety of habitat types are needed to improve our understanding of habitat and carbon
storage in Natewa. Accessing more remote and isolated forests which are less likely to have
been disturbed is vital in determining the true carbon storage of the Peninsula and will be
hold key habitat data that can be used by our other science teams. Moving forward we hope
to use remote sensing to classify the forest types across the peninsula and try to build an
accurate picture of the state of the forests and how much carbon is sequestered in the
forest. As noted in previous years, one of the major reasons for habitat loss across the
peninsula is for that of kava farming. Although small scale, farmers are gradually moving
deeper into the forests to clear patches of land to grow kava. It is the most profitable legal
crop for landowners but sadly is accompanied with unsustainable land clearance with
excessive use of agrochemicals (IBP USA, 2010). Therefore, effort is required to educate
communities on the detrimental effect of land degradation, particular slash-and-burn
agriculture across the peninsula, particularly in locations of important biological significance.
10Ornithological Report
by Joe England
Introduction
The Natewa Peninsula is hugely important in terms of its bird life, as it is with many other
taxonomic groups. Geographically, the peninsula is a near island and is host to many endemic
species which have adapted and evolved as part of a unique ecosystem. Almost half of the
country’s terrestrial birds are only found in Fiji, making it a country with one of the highest
rates of endemism in the world. One such endemic species, the Natewa silktail (Lamprolia
klinesmithi), exists only on the peninsula and remains an enigma in terms of its ecology
(England 2019). The area is also a significant stronghold for other endemics such as the
orange dove (Chrysoena victor) and maroon shining parrot (Prosopeia tabuensis). Despite
the presence of these highly specialised species, there is a distinct lack of data on the ecology,
population dynamics and morphology of the peninsula’s avifauna. An Important Bird Area
(IBA) was setup in recognition of the areas importance but this only exists as a line on a map
and does not present any legal protection. Although community agreements on land-use were
initially made, small-scale farming persists and is increasingly encroaching inland, degrading
mature forest and its associated biodiversity. The Operation Wallacea project is tackling each
of these issues by involving local communities in the expedition and presenting scientific
research as part of a proposal for a national park. This report aims to summarise the findings
from 6 months of ornithological fieldwork across 2017, 2018 and 2019, increasing our
understanding of the areas avifauna and informing practical conservation.
Methods
There are two main elements to the bird survey work; point counts and mist netting. Point
counts were the main form of survey, to gain a good understanding of species presence,
abundance and relationship with habitat. The methodology for point counts was refined in the
second year and so the data in this report only compares the findings from 2018 and 2019.
Every morning a transect would be conducted (see Figure 2 for transect locations) as long as
it was not raining heavily, or the wind was not too high. Generally, point one of a transect
was on the road or logging road (mud track) and would work its way into the forest. Each
transect consisted of six points, 200 metres apart. The first point would be surveyed as close
to dawn as possible (06:00am), with the transects being done in reverse occasionally to
remove any time bias along the disturbance gradient. At each point all bird species seen or
heard were recorded for ten minutes, the maximum number heard or seen at one time and the
distance from observer estimated (0-25, 25-50, 50-100 and 100+ metre bands). There was no
settling down period before the count was started. Detailed 20x20 metre forest structure and
carbon plots were also carried out at each of these points to accurately determine and
categorise habitats, this data is not used directly in this section of the report but will be
utilised in future research papers. Instead, an overall disturbance level was assigned to each
point, by the senior scientist (JH) and myself (JE) based on our first-hand observations.
Mist netting was carried out at eight sites, four of which were repeated each year to maximise
the recapture rate. Sites were netted for one or two weeks with the maximum number of
available nets, usually six 10x3 metre nets. Nets were checked every 30 minutes and any
birds caught were extracted, bagged and taken back to a temporary ringing station. Every bird
caught was ringed using New Zealand rings, with the species, age, sex and any moult being
11identified if possible. The weight, wing, head-bill, tarsus and tail lengths were measured
before releasing the bird. In 2019, any Silktails caught were also ringed with a combination
of two colour rings on the alternate leg to the metal ring.
Results
Bird species abundance and diversity
A total of 51 species have been recorded on the peninsula across the three years, 17 of which
are endemic to Fiji. A full species list is included as Supp. Mat. Table S2. A total of 31
species were observed on point counts, which included 29 species from 18 surveys in 2018
and 30 species from 20 surveys in 2019. Average abundance per point was calculated for
each of these species for each year, see Figure 6. The most common species was barking
pigeon (Ducula latrans) followed by Fiji whistler (Pachycephala vitiensis) and then maroon
shining parrot (Prosopeia tabuensis), Fiji bush warbler (Horornis ruficapilla) and sulphur-
breasted myzomela (Myzomela jugularis). Eight of the ten most common species are endemic
to Fiji. The abundance for most species was very similar between 2018 and 2019, as was the
average number of birds recorded per point (15.56 in 2018 and 15.12 in 2019).
Using the Shannon Wiener Index (H), the diversity at each point across the two years was
calculated and then compared with the disturbance level (mature forest = 1, regenerated forest
= 2, disturbed forest = 3 and road = 4), see Figure 7. This showed the least disturbed forest
held the highest average diversity (2.16) and the most disturbed habitat held the lowest
average diversity (1.95), the intermediate forest types did not fit the trend (regenerated forest
2.01, and disturbed forest 2.11).
Species accumulation
Netting hours were fairly comparable across all years, as was the number of species caught
(2017; 334 hours and 11 species, 2018; 298 hours and 10 species, 2019; 299 hours and 12
species). The species accumulation curve was also very similar year to year, all having a
similar gradient throughout and reaching a near asymptote at the same stage of netting effort
(Figure 8). Despite similar curves and netting effort, in 2019 less than half the number of
birds were caught than in the previous two years.
Key species and disturbance level
This analysis only assessed birds recorded within 50m of the observer to improve the
accuracy of comparisons between species and habitat and it focuses on the three species
endemic to Vanua Levu and its offshore islands. The average abundance of Natewa silktail
was negatively correlated with disturbance level, density was greatest in mature forest and
lowest on the road and disturbed forest (Figure 9). Maroon shining parrot and orange dove
were both most abundant in regenerated forest, the maroon shining parrot thereafter showing
a preference for disturbed forest and the orange dove for mature forest (Figure 9). Rough
population estimates calculated the number of Natewa silktail on the peninsula at 3895,
orange dove at 15,791 and maroon shining parrot at 11, 671 (Table 2).
1213
Figure 6. Mean bird species abundance per point count for years 2018 and 2019.14
Figure 7. Diversity (H) of each transect point surveyed, with the disturbance level of each point displayed by colour. Dark
green = Mature forest, Light green = Regenerated forest, Dark yellow = Disturbed forest, Red = Road.15
Figure 8. The number of species caught each year with increased netting effort. Species accumulation curve for each year
plotted using a logarithmic curve.16
Figure 9. The average abundance across different levels of disturbance for three key species; maroon shining parrot
(Prosopeia tabuensis), Natewa silktail (Lamprolia klinesmithi) and orange dove (Chrysoena victor).
Species Total seen Surveys No. of points Points present Points present (%)Avg. per pointPoint area (m2) Distribution (m2)No. of points across distributionPopulation est. Natewa Population est.
Natewa Silktail 36 306 102 24 23.53 0.12 7853.98 260000000 33104.24 3894.62 3894.62
Orange Dove 69 306 102 37 36.27 0.23 7853.98 13200000000 1680676.55 378976.08 15790.67
Maroon Shining Parrot 51 306 102 30 29.41 0.17 7853.98 24000000000 3055775.54 509295.92 11671.36
Table 2. Workings to estimate the population size of the three key species.Discussion
Species abundance and diversity
Despite the relatively low bird species richness, the finding that eight of the ten most
common species are endemic suggests the peninsula is an incredibly unique and valuable
ecosystem. The five most common species represent a cross-section of the feeding guilds you
would expect to find in a tropical forest system. Outside the more common species however,
abundance of rarer species is incredibly low. Given that the peninsula is a near-island, it is
appropriate to apply island biogeography theories to explain the overall low avian diversity
(Wilson & MacArthur, 1967). The similarity in the overall abundance of birds and each
species detected from 2018 to 2019 shows no significant annual trend. If a trend is present,
however, it is more likely to be identified after a third year of surveying and improve with
each consequent year. By collecting a longer term dataset, the overall health of the ecosystem
and on individual species population trends can be better understood.
Disturbance level predicted bird diversity at the two extremes of the scale, but not at the two
habitats with mid-level disturbance which showed the reverse of what would initially be
expected. The first point to make is that small scale disturbance can have a positive impact on
diversity, particularly species associated with forest edge and dense secondary growth
(Forsman, et al., 2010). Disturbance also catalyses the introduction and effects of invasive
species which may outcompete important native species (Murphy & Romanuk, 2014). A
good example of this, is to look at the effects of disturbance on the Natewa silktail (Figure 9),
which shows an obvious preference towards the least disturbed forest.
Secondly, the habitat categorisation at this stage has been very roughly ascertained. This is
made more difficult by the varied past land-uses across the peninsula. The traditional
agricultural system involves a new small plot of land being distributed to families every four
years to be cleared and cultivated (Cegumalua in pers. comm., 2019). Add to this, logging
activity, pine and mahogany plantations (Masibalavu & Dutson, 2006) and you are left with a
complete mosaic of habitats at various stages of regeneration. The small remaining fragments
of seemingly primary forest are limited to higher altitudes and along protected water courses.
Once analysis has been conducted on the forest structure and carbon data, better
categorisation and delineation between forest types can be ascertained and provide more of
an insight on the relationship between diversity and disturbance.
Species accumulation
The similarity of all three species accumulation curves suggests again no significant
difference in species richness year to year at the mist-netting sites. Near-asymptotes after 250
hours show the mist-netting is capturing a representative and almost-complete picture of the
species that are occupying the lower stories of the forest. Mist-netting is not going to detect
many of the species occupying the canopy and upper story of the forest (Martin, et al., 2017)
and our results show that this method only captured 51% of the species recorded on our point
counts. This indicates that increased net-hours would not glean many additional species. The
low species richness and the lack therefore of many cryptic, understory species makes the
mist-netting a fairly ineffective method when it comes to monitoring biodiversity on the
17Natewa peninsula. Instead mist-netting should be focused on maximising recaptures, learning
more about species life history, morphometrics and local movements.
Key species
The strong correlation between Natewa silktail abundance and habitat disturbance follows
what is known about the ecology of this enigmatic species (BirdLife International, 2017;
England 2019). Although it was recorded in disturbed habitats and mahogany plantations,
these points were always in close proximity to mature forest and it seems the species is
heavily reliant on this undisturbed habitat. These patches of mature forest are vital to the
breeding ecology (England 2019) and therefore essential for the survival of the species. The
population estimate reported here is a significant and worrying reduction on the previous
estimate of 6,000-12,000 individuals (BirdLife International, 2017), which is based on very
little available evidence and 20 years out of date. Despite the implementation of the IBA and
community initiatives, mature forest continues to be degraded through agricultural and
logging practices (BirdLife International, 2017). The combined factors and threats
highlighted here should spur on increased monitoring of the species and formal protection of
remaining tracts of mature forest.
The orange dove showed a preference for less disturbed habitats but favoured regenerated
over mature forest. It was previously thought this species was not present in disturbed
landscapes (BirdLife International, 2016) and so this information sheds new light on the
distribution and tolerance levels of this endemic bird. The maroon shining parrots broad
habitat utilisation is fairly well documented (BirdLife International, 2018), however it is
surprising to see it favoured all disturbed habitats over mature forest. Often frugivorous
species are abundant in partially disturbed habitats as these areas have an increased density of
fruiting trees (Marsden & Pilgrim, 2003). The maroon shining parrot in particular is known to
feed on a wide range of fruiting tree, including non-native species (Collar & Boesman, 2020)
which are more likely in anthropogenically altered landscapes. This evidence shows that
forest clearance, if regeneration is allowed, can increase the food availability for frugivorous
species. Other life history traits of these species may require mature forest, nest-site
availability for example is generally greater in old growth forest (Marsden & Pilgrim, 2003),
and so care should be taken to encompass all ecological aspects when applying practical
conservation measures.
No population estimates exist for either the orange dove or maroon shining parrot, so the
estimates made here are the first indication of the species overall condition. The Natewa
peninsula, given its comparitive healthy ecosystem, is thought to be a stronghold for the
orange dove and maroon shining parrot (Kerr, 2018), yet they occur across Vanua Levu and
some of its nearby offshore islands. The population estimate for the Natewa peninsula is
likely to be more accurate than the total estimate, as the estimates are based on extent of
occurrence rather than area of occupancy. A species is unlikely to occur throughout the extent
of occurrence, which may contain unoccupied or unsuitable habitat. Nevertheless, these
estimates are a good starting point and are a promising indicator for the health of both
species.
18Silktail captures
The fact that 80% of adult birds showed signs of breeding shows that June and July are
certainly peak breeding season, the predominance of males would also corroborate this as the
females would be sitting on the nest. It is interesting that all recaptures were adult males,
suggesting it is the males that hold down the same territory year on year (Supp. Mat. Table
S1). The colour rings will now allow a better understanding of movement, breeding and
behaviour of the different sexes and individuals. A generation length of 4.2 years has been
estimated but is not based on any evidence (BirdLife International, 2017), making the bird
recaptured in 2019 the longest known living Natewa silktail, at three years plus. A better
longevity record will hopefully be recorded in subsequent years. The normal distribution of
weight, head bill and wing all confirm that these features are not sexually dimorphic. The
variation seen in tarsus length could be due to some split in the population, as could the range
in tail length measurements (Supp. Mat. Figure S1). However, this variability could be down
to measurement error both within and among observers across years (Goodenough, et al.,
2010).
Other significant findings
Yellow-billed honeyeater
Rachel Hufton observed a population of this species on the south-eastern limb of the Natewa
peninsula, around Dakuniba (Figure 2), although no photographic evidence was recorded.
The previously thought absence of both this species and the chestnut-throated flycatcher
(Myiagra castaneigularis) (previously considered conspecific with Myiagra azureocapilla on
Taveuni) from the peninsula has long mystified naturalists. Both occur on the rest of Vanua
Levu and Taveuni and set Natewa apart in yet another ecological way. The discovery of
yellow-billed honeyeater at Dakuniba would be an interesting range extension and add to the
intrigue surrounding the small-scale differences in bird communities and niche occupation in
the area.
Friendly ground dove nests
Two nests of this vulnerable species were found at Nabu, in some of the last remaining
mature coastal forest on the peninsula. The first nest was around 2m high with two young
chicks which looked to be only a couple of weeks old. The second was at a similar height but
with one white egg in the nest.
Two friendly ground dove chicks in the first of The female orange dove on her nest.
two nests discovered at Nabu.
19Orange dove nest
A nest of this species was found, with the female seen incubating a single white egg on a
flimsy bare platform of twigs about 4m off the ground in a Makita tree. This nest was in the
same area as the Natewa silktail nests found in 2018, adding to the idea that the habitat in that
area is optimal for some of the key endemic species on the peninsula. Unfortunately, the nest
was found to be inactive after a week or so with the egg no longer in the nest, likely predated.
White-faced heron
There are currently no published records of the White-faced heron (Egretta novaehollandiae)
on Vanua Levu at all, however we have made multiple records of it around the Savusavu area
where it seems fairly common. It was most regularly seen on the airfield but has been seen on
the coast and in wet pasture. Individuals were seen in multiple areas of the Natewa peninsula
itself rather than just around Savusavu and three records were made from Taveuni. Records
are being compiled and a paper being put together.
Natewa silktail nesting
In 2018, we found and made observations of four active nests of the Natewa silktail. There
had only been one nest described from the Natewa peninsula before and so much of the
information we found was new to science, see England (2019).
Future Recommendations
The last three years have been vital in establishing a solid methodology that we can take
forward and use in future years, in order to maintain a long-term dataset. Whilst much of the
time has been dedicated to doing this and carrying out the set surveys, many of the most
important findings have been chance encounters. Now that methodologies and transects have
been set, more effort can be made to explore and monitor currently un-surveyed parts of the
peninsula. This effort should be focused particularly around high elevations where forest is
least disturbed and along the periphery of the known Natewa silktail distribution. This would
allow us to better understand the natural primary habitat of the peninsula, whilst also finding
the limits for the Natewa silktail both geographically and ecologically. The same is the case
for the yellow-billed honeyeater (which we need to prove exists on the peninsula) and any
other species previously thought to be absent. Unfortunately, the Operation Wallacea season
only runs for two months of the year and to get a true picture of what is going on in an
ecosystem it needs to be monitored year-round, however this problem is difficult to
overcome.
Particular attention should be given to maximising the number of recaptures of all species and
especially captures of Natewa silktail, ringing and measuring as many as possible to get more
reliable data on their morphometrics and ecology. Should more nests be found, priority
should be given to the observation of these. Small behavioural studies could be setup to
quantify feeding, intra and interspecific interactions. The forest structure and carbon data
collected in 2018 and 2019, once analysed will shed more light on the habitats present on the
peninsula and will also allow us to identify correlations between species, their habitat and
tolerance to disturbance. Given the peninsulas high endemism, a top priority should be to find
20out what the underlying cause for such specialisation is. Undoubtedly this is partly due to the
near island situation of Natewa, but will also be due to localised weather, geography,
topography and the way these manifest themselves at the basic vegetation level.
A better understanding of the impacts of invasive species on the peninsula is needed, in
particular the effects of the small Indian mongoose (Herpestes auropunctatus) on the avian
community. Dietary analysis and experiments to determine the species’ climbing ability are
necessary to truly know whether it is having a negative impact on not just ground-nesting but
cavity or tree-nesting birds as well.
Finally, it would beneficial from a conservation standpoint to spend more efforts engaging
and educating local communities about the importance of their forest. Formal training to
interested parties in surveying, guiding, first aid and navigation could be given, which in turn
would allow tourists and visitors outside the Operation Wallacea season to contribute to the
local economy. Basic equipment could also be provided, through some sort of donation or
funding. These ideas are already in the pipeline, but I do feel this is vitally important to the
ongoing success of the project. The communities who own the land need to see not only
biological worth, but economical worth in protecting their forests.
21Arachnid Report
By Filippo Castellucci and Jane Hardwick
Introduction
Spiders represent a megadiverse group of animals, with more than 48,000 described species
distributed in 120 families (World Spider Catalog “WSC” 2020). They are present in almost
all terrestrial ecosystems (Foelix 2011), where they hold the role of key predators among the
invertebrate communities (Nyfferler and Birkhofer 2017), and this makes them an interesting
target taxon for trying to understand the biodiversity of a chosen area. Despite their ubiquity
and abundance, they remain strongly understudied due to a lack of specialists focusing on their
taxonomy, ecology, ethology or evolution, and for this reason arachnological surveys in
tropical ecosystems are likely to lead to interesting findings.
To date, no arachnological survey was ever conducted in the Natewa Pensinsula and in general
little research has been carried out at all in Fiji regarding this group of animals. The WSC
(2020) currently reports only 92 spider species as present in Fiji, while a summary checklist
produced by the Bishop Museum (Evenhuis and Bickel 2005) reports 130 species. Both
checklists are likely to represent an underestimation of the real spider diversity, given the little
effort and the ecological and biogeographical features of Fiji.
During 7 weeks of the 2019 Opwall expedition, the arachnological surveys were designed to
estimate the sub-canopy diversity of spiders and of other minor orders of arachnids using a sub-
set of collecting methods in order to access different microhabitats keeping the sampling
protocol easy and applicable on the field by non-experts.
Methods
The arachnological surveys were carried out on the same transects that were also used for bird
surveys and where habitat and carbon surveys were carried out (Figure 2). Arachnids were
collected during a 10 minutes search session at each of the six transect points (in an area of
approximately 20m surrounding the centre point). Ten of the 15 transects were surveyed twice
and the remaining five just once due to time constraints and difficulties with access. The
collecting team was led by either an experienced arachnologist (FC) or entomologist (JH) and
assisted by trained local guides and 5-8 students who were trained on the day in invertebrate
sampling. Prior to each survey a briefing was held by the team leader to explain and
demonstrate the sampling techniques.
The methods chosen for collecting arachnids included active-search methods techniques at all
sites including the use of three entomological sweep-nets, one vegetation beating tray and the
use of active collection of specimens from spider webs or cryptic habitats as leaf litter or
underneath logs/rocks. All the specimens collected at each point on a transect were pooled into
one vial containing 70% ethanol and labelled with date, transect name and number of the
transect point. Most survey plots were surveyed twice during the season.
After collection, the vials were sorted at the camp and the specimens contained in each vial
were counted and identified to the lowest possible taxonomic category. Given the difficulty of
identifying arachnids in the field without the use of a stereo-microscope, identification to the
family level was recorded in most cases for spiders and to the order level for other arachnids.
22In cases of striking and well visible morphological features, the specimens were identified up
to the species level by FC.
Statistical analysis
After testing data for normality, analysis of variance (ANOVA) was carried out to assess if
there were any differences in arachnid abundance and family richness across sites grouped into
three habitat types (undisturbed forest, disturbed forest and road). Differences in community
composition were assessed by calculating Jaccard’s (based on presence/absence of arachnid
families) and the Bray-Curtis (based on abundance of each arachnid family) indices for each
site, and examining these on a betadipser plot which shows these data points embedded in a
principle coordinates-derived Euclidean space. The three habitat types were grouped using
convex hulls. Differences in habitats (based on each points distance to the centroid) were tested
using ANOVA.
Results
Overview of specimens collected
In total, across the fifteen transects a total of 150 plots were surveyed (including repeated
surveys) for arachnids. Almost 3000 arachnid specimens were collected across the peninsula
in total. They included representatives from six different orders: Acarina (mites and ticks),
Araneae (spiders), Opiliones (harvestmen), Pseudoscorpiones (pseudoscorpions), Schizomida
(short-tailed whip-scorpions) and Scorpiones (scorpions). Opiliones, Pseudoscorpiones and
Schizomida are of particular interest due to very little being known about their diversity even
in well studied tropical forest locations. Among the scorpions, only one species was collected,
belonging to the genus Liocheles, likely to be the species L. australasiae, which is widely
distributed in tropical Asia, Australia and South Pacific.
Among the spiders, 15 different families were collected: Araneidae, Cheiracanthiidae,
Clubionidae, Linyphiidae, Lycosidae, Mimetidae, Nesticidae, Pisauridae, Pholcidae,
Salticidae, Sparassidae, Tetragnathidae, Theridiidae, Thomisidae and Uloboridae.
The total number of species collected is unconfirmed without formal taxonomic identification
but could range between 60 and 80.
Spider abundance, family richness and community composition
There were seven survey plots where a mean of 40 or more arachnids were collected within the
10 minute search window. These were the most abundant plots and included three plots from
C transect (C4, C5 and C6), three from Natovotovo transect (NAT3, NAT4 and NAT5) and
one from Nabu (N5). These sites did not coincide with plots with the greatest family richness,
which included two sites in KNMM (KA2 and KA5), one site in KNMM2 (KB5), two sites in
A (A4 and A5) and one site in E (E1). All of these had a mean of more than six different
families of arachnids identified. From the most family rich sites, all except one (E1) were
undisturbed forest, whereas the most abundant sites for arachnids encompassed all three habitat
types (undisturbed forest, disturbed forest and road habitat).
Although there was no difference in arachnid abundance across the three habitat types
(undisturbed forest, disturbed forest and road) (F = 0.399, df = 2, p = 0.67), arachnid family
richness was found to differ significantly across the three different habitat types (F = 12.31, df
23= 2, p =
flavopunctata). There is a good chance that this endemic species is present in the collected
samples.
Clubionidae (sac spiders)
This family is not recorded for Fiji according to the WSC (2020), while an unidentified species
of Clubiona from Fiji is present in the Bishop Museum collection (Evenhus and Bickel 2005).
Some specimens were collected during our surveys and could represent new records for Fiji.
Lycosidae (wolf spiders)
The WSC (2020) reports only one species for Fiji, Allocosa hostilis, while the Bishop Museum
(Evenhus and Bickel 2005) has two more unidentified species in collection. At least two
different species were collected, among which there could be a potential new record for Fiji.
Pholcidae (daddy long-legs)
Several species were collected, including the Fiji endemic Belisana fiji.
Salticidae (jumping spiders)
Many species were collected. This family includes several Fiji endemic species, further
taxonomical identifications of the specimens could reveal the presence of some of this endemic
taxa in the collected samples.
Sparassidae (hunstman spiders)
Three species are recorded from Fiji. A big huntsman species that was common in the forest
and around the forest camp seems to belong to the genus Heteropoda, but is totally different
from H. venatoria, the only Heteropoda species recorded from Fiji and present in Vusaratu and
at the marine site. This represents a new record for Fiji and further taxonomical analyses are
needed to verify if this is a species already known to science.
Tetragnathidae (long-jawed orb-weavers)
Most of the common long-jawed orb-weavers collected in the forest belong to the
genus Leucauge. No species is reported from Fiji according to the WSC (2020) and only L.
granulata is present in the Bishop Museum collection (Evenhus and Bickel 2005). We
collected at least two different species, so this is a potential new record for Fiji.
Theridiidae (cob-web spiders)
Three specimens belonging to the genus Romphaea were collected. This genus is not recorded
from Fiji, so this represents a new genus record for the country.
Four different species of the klepto-parasitic spiders belonging to the genus Argyrodes were
collected. Only two species are known to occur in Fiji, both endemic, so at least two endemic
taxa were collected and at least two new species are recorded for the country.
Thomisidae (crab spiders)
Two endemic species are reported from Fiji, Xysticus ictericus and Stephanopis erinacea.
Two species of Xysticus were collected, so this represent another Fiji endemic recorded for
the Peninsula and a new record for Fiji. Several specimens belonging to the genus Diaea

                                              25
were also collected. This genus is not recorded from Fiji, so this represents a new genus
record for the country.
Discussion and Future Recommendations
There is no doubt that the arachnid diversity across the Natewa Peninsula is understudied and
the results from the 2019 Opwall season are a strong indicator that further work must be
continued on this group of invertebrates, with may new records recorded.
Previous studies worldwide have shown that arachnids are sensitive to habitat change (e.g. Bell
et al. 2001; Pinkus-Rendon et al. 2006; Lo-Man-Hung et al. 2008). Our data shows that
although abundance did not change, family richness of spiders was greatest in undisturbed
habitats. This suggests that certain families of spiders may not survive habitat disturbances –
for example we only collected one species from the Linypiidae family in undisturbed forest
and 93% of pseudoscorpianidae and 75% of Thomisidae species were collected in undisturbed
habitats. However, certain arachnid families can thrive in disturbed habitats, for example
Lycosidae and Pisauridae were only collected along road habitats, showing a preference for
more open, grassy habitats.
As listed in the results, there are many interesting specimens that were collected over the survey
period and it is likely that the percentage of interesting specimens will increase when the
samples will be further analyzed using correct tools for a proper taxonomical identification.
For example, some of the new records for Fiji could also represent species new to science.
Although a reduced set of sampling methods was applied, and species-rich habitats as the
canopy or the leaf litter were not investigated, the results obtained are promising and clearly
show how great the arachnological diversity is in the Natewa Peninsula and how little we know
about the arachnofauna of Fiji.
In future seasons it would be useful to integrate different search techniques for enlarging the
range of habitats covered by the surveys. Leaf-litter communities are commonly species-rich
and can be accessed by the use of litter extraction techniques as Berlese funnels or
positioning pitfall traps. The problem with these passive methods is that they are not suited
for application by student groups.
26Lepidoptera Report
By Clive Huggins (SBBT) and Visheshni Chandra (USP)
Introduction
Fiji has a number of endemic butterfly species and sub-species, one of which was only
recently discovered in 2018 by OpWall teams, the Natewa swallowtail (Papilio Natewa). P.
Natewa is one of only three known swallowtail species known to the pacific (one other is a
Fijian endemic Papilio schmeltzi and another in Samoa). Current knowledge suggests that P.
natewa could be entirely restricted to the Natewa Peninsula, making it the one of the most
range restricted Papilonidae species in the world (SBBT 2020). It is important to monitor the
two endemic swallowtail species in Fiji as a previous study has found P. schmeltzi has a
restricted range, occurs in low densities and are known to be impacted by forest loss
(Chandra et al. 2013).
Records indicate that 46 species of butterfly occur in Fiji (prior to the discovery of P. natewa)
(Tennent 2006; Patrick and Patrick 2012). In 2017 and 2018, Operation Wallacea teams
carried out butterfly surveys in Vanua Levu, which were likely some of the first in recent
decades and recorded a total of 14 species on the Natewa Peninsula. In 2019, further surveys
on the Natewa Peninsula’s butterfly fauna were required to provide a more complete picture
of the population sizes and distributions. In particular, to follow up on the discovery of P.
natewa with more in depth research on its’ biology. At the current time the species had only
been recorded within a few kilometers from the forest camp.
The overarching aim of the 2019 surveys were to conduct surveys across a variety of habitats
on the Peninsula and to make a representative specimen collection for the Natural History
Museum, London and University of the South Pacific, Suva. These records will supplement
data collection from the previous two Opwall seasons by entomologists. In addition to
Lepidoptera certain moths plus other insect Orders i.e. Longhorn (Cerambycidae) & Jewel
(Buprestidae) beetles were assessed.
More specific aims of the season included:
1. Catch, identify and release butterflies across different survey locations in the Natewa
Peninsula in an attempt to increase the species records from the previous years’ work
2. Locate and collect a representative sample of P. natewa for museum specimens at
University of the South Pacific and the London Natural History Museum
3. Record behaviours of P. natewa and carry out a mark and release surveys to determine the
extent of their territories and flight paths
4. Confirm the larval food-plant for P. natewa and collect for herbarium identification at
University of the South Pacific
5. Carry out mark and release surveys on common Euploea and Hypolimnas species which
were easily identifiable by students to teach them the methods
27You can also read