A road map towards Low Carbon Ahmedabad 2050 - Draft Report-For limited circulation only
←
→
Page content transcription
If your browser does not render page correctly, please read the page content below
Draft Report—For limited circulation only

A road map towards
    Low Carbon
 Ahmedabad 2050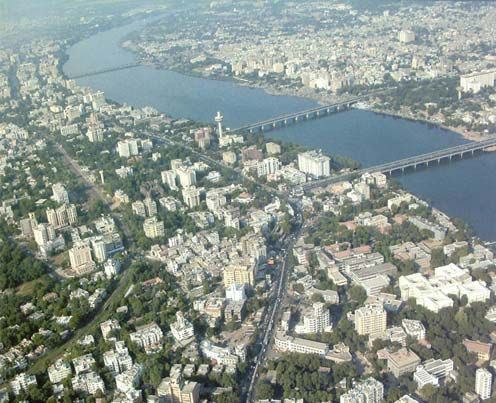
Preface
This roadmap is in continuation to our earlier study Ahmedabad LCS Vision 2035. This
research has been supported by various government agencies ( f or discussions and da-
ta ) and is a collaboration among various academic and research institutions, namely-
Indian Institute of Management Ahmedabad, Kyoto University, National Institute for Envi-
ronmental Studies Tsukuba and Mizuho Information and Research Institute Japan.

We felt the need for extending this study for a much longer period so as to coincide with
the generally agreeable year of 2050 for implementing long-term measures. This timeline
gives us an opportunity to rethink the development paradigm in the city considering the
latest developments in the economy and other sectors.

This LCS roadmap document intends to communicate to city level policy makers - how to
effectively integrate carbon mitigation actions in the development plans of the city. The
actions outlined in the document, we believe, would guide effective transition towards a
Low Carbon Ahmedabad. The proposed actions are in line with national position articulat-
ed in India’ s National Climate Change Action Plan and official Government position in
various high level declarations such as the “ C openhagen Accord” .

We sincerely hope that our research findings, we hope will contribute to towards a sus-
tainable transition in Ahmedabad .

                                                                      - P. R. Shukla

    India                            State of Gujarat             City of Ahmedabad

                                               2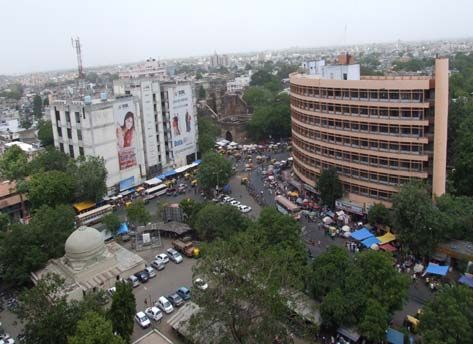
Table of Contents
Executive summary                          4
Policy Package for Ahmedabad               5
Background                                 6
Target setting and Timeline                7
About Ahmedabad                            8
Some initiatives underway                  9
Land Use Planning                          10
Spatial Growth                             11
Scenario Economic Assumptions              12
Sectoral Assumptions                       14
LCS Scenarios: Qualitative Storylines      16
Energy & Emissions: 2035 and 2050          18
Mitigation potential in 2035 and 2050      20
Low Carbon Infrastructures                 21
Actions towards LCS                        22
Description of Actions                     23
Governance & Financing                     25
Snapshot of Solid Waste Management         26
Energy and Environment Policies in India   27
Data Preparation                           28
Methodology                                30

                                    3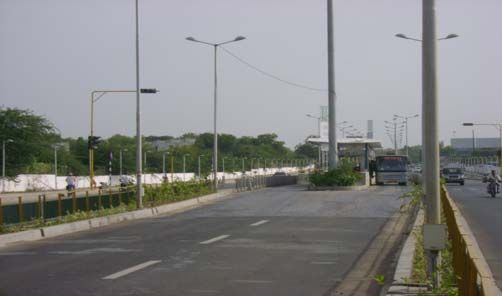
Executive summary
This report articulates a low carbon vision for          potential as compared to decarbonisation of
the city of Ahmedabad. The methodology                   energy. Besides, there is a substantial mitiga-
involves deducing current socio economic,                tion potential from fuel switch and energy effi-
energy and emission parameters for the city              ciency. Specifically, this would mean improve-
using the base year ( 2005 ) data . This data            ments in energy intensity of economic activi-
has been methodically prepared using various             ties, like reduction in energy service demand
approaches as enunciated in literature for vari-         for industrial, transport and commercial sector,
ous sectors. These parameters are used in                cleaner and greener power ( renewable like
conjunction with the future energy service               hydro, solar and biomass ) , and promoting end
demands, energy technology assumptions, and              -use device efficiency in the transport sector,
socio economic assumptions for Ahmedabad                 industrial and residential sector.
( p opulation, etc ) from the City Development
Plan ( CDP) and expert opinion, to obtain the            These countermeasures can be presented as a
target years ( 2035, 2050 ) socio economic               policy package for Ahmedabad, as described
and other assumptions.                                   in the next page.

In order to transit to a low carbon society in Ah-
medabad, several countermeasures are re-
quired. It is interestingly observed from the
model output that for such a transition in Ah-
medabad, decoupling of economic growth and
energy use emerges as the highest mitigation

Figure 1: GHG emissions and mitigations by means ( mt CO2)

  100.0

   90.0

                                                                           Vehcile Efficiency
   80.0

   70.0                                                                    Industrial Efficiency

   60.0                                                                    Building Efficiency

   50.0                                                                    Fuel Switch

   40.0                                                                    Energy Intensity of service demand

   30.0                                                                    Emissions

   20.0

   10.0

    0.0
             2005       2035 BaU    2035 LCS    2050 BaU        2050 LCS

                                                     4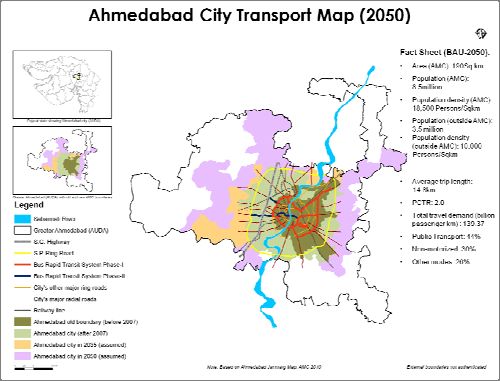
Policy Package for Ahmedabad
For realizing the vision of a Low Carbon Society for Ahmedabad, a comprehensive list of policy
options are required, focused at implementation of the different mitigation measures. The policy
package suggested below is a menu of such actions, that is needed to be integrated in the city
development plan of Ahmedabad. When pursued together, these set of actions would help in de-
vising dedicated policies in the near term, thereby helping in the realization of low-carbon society
vision for Ahmedabad.

                                                 5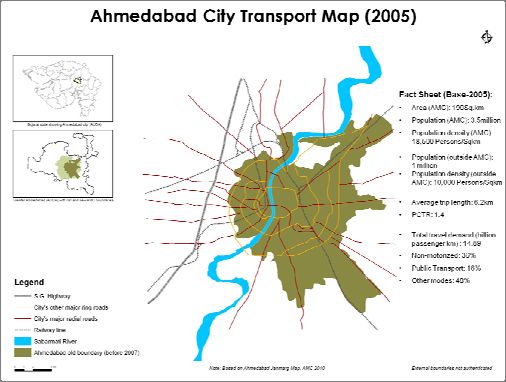
Background
In the developed world context, the concept of             of Life ’ should be embodied within the broad-
a low-carbon society has the following attrib-             er deliverables of providing a safe, secure and
utes:                                                      a comfortable city. Such a society would not
( 1 ) Actions should be compatible with the                emerge in the immediate future but decisions
      principles of sustainable development,               regarding key choices have to be taken now.
      however not at the cost of the develop-
      ment needs of all groups in the society.             Such choices would be either resource/sector
( 2 ) Make an equitable contribution towards               based or hard/soft type. While the former con-
      global efforts in stabilizing CO2 concen-            trols key energy service demands in certain
      tration in the atmosphere and other                  sectors like residential, building, commercial,
      GHG gases, through deep emission                     etc but the latter, provides an alternative option
      cuts.                                                through either physical type decisions or man-
( 3 ) Use low-carbon energy sources and                    agement decisions. It is important to recognize
      technologies and demonstrate a high                  that the concept of LCS from a city-level per-
      level of energy efficiency at all levels of          spective should be planned within the jurisdic-
      energy usage.                                        tion levels of the local government. Specifically,
( 4 ) Adopt certain behavioral and consump-                only those activities or actions should be con-
      tion styles that are consistent with low             sidered which the local government is capable
      levels of greenhouse gas emissions.                  of influencing like operationalisation of stand-
                                                           ards in building sector, promoting the concept
However, the concept of a low-carbon society               of 3R etc.
has a different meaning for the developing
world. Countries, like India, still have low per           At the next level, the LCS framework at the city
capita emissions, are on an increasing eco-                level should look at opportunities which create
nomic growth trajectory and have priorities in             various kinds of co-benefits apart from direct
meeting the development needs, like educa-                 GHG emission reductions. Such co-benefits,
tion, healthcare.                                          like improved local air quality, provide an op-
                                                           portunity to minimize social costs of such a
But, the LCS opportunity for developing coun-              transition. The other advantage of such an ap-
tries arrives with a window of opportunity, as it          proach would be in achieving “ m ultiple divi-
gives a chance for such countries to avoid                 dends ” , at minimum social cost. It also helps
critical lock-ins; particularly in long-lived infra-       in achieving various developmental goals of the
structure assets. From the perspective of a                city and therefore, is in line with the concept of
city, like Ahmedabad, the LCS opportunity is a             sustainable development.
window to decide about the future flow of en-
ergy through infrastructure and other behav-               Extending the LCS framework further, the city
ioral and lifestyle related choices and there-             would therefore be in conformance with a cli-
fore the importance of such a study.                       mate friendly regime. However at the same
                                                           time the city would also be resilient to climatic
For setting priorities within the overall frame-           variability. The LCS opportunity should there-
work of an LCS society, it is imperative to un-            fore be looked at in terms of a platform for
derstand the long-term goals for such a socie-             planning for climatic exigencies and therefore,
ty. At the Ahmedabad city level, the overall aim           minimize operational and other losses.
of implementing actions within the LCS frame-
work should aim at improving the “ Q uality of
Life ” ( QO L ) of the local residents. ‘ Quality

                                                       6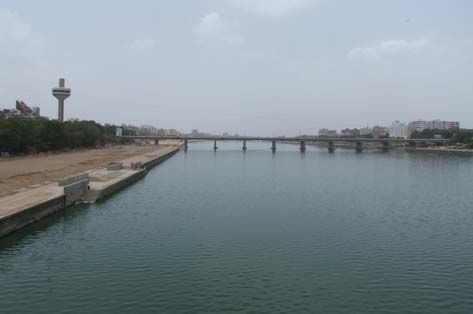
Target Setting and Timeline
The current selection of target years: 2035 and                   In the recent G8+5 summit, deep global reduc-
2050 is done by keeping in mind the three time                    tion target of GHG emissions were agreed up-
periods:                                                          on by nations, with a concern towards stabiliz-
( 1 ) Period up to 2020 ( the terminal year of                    ing mean global temperature rise at 2º Celsius
      Post-Kyoto global carbon architecture                       above the pre industrial level. The present LCS
      period ) , by which many developing na-                     study is in line with the same targets. This sce-
      tions ( including India) have promised                      nario has also been endorsed at the 2009 dec-
      voluntary emission reductions.                              laration by the leaders of the “ Major Econo-
( 2 ) Intermediate year of 2035, which gives                      mies Forum” . However, India has particularly
      an opportunity to check the progress                        acknowledged, that it would, at no point in time,
      made towards the long-term global com-                      exceed the current emission levels ( i.e at
      mitments of GHG emission reduction by                       2005 levels) of the Annex 1 countries.
      2050.
( 3 ) Period terminating in 2050, the year by                     The idea of LCS is not committing to the 2 deg
      which most of emission cuts are pledged                     C target, but an aspirational attempt being
      by the developed as well as the develop-                    made by India. However this target is subject to
      ing world alike.                                            adequate financial and technological commit-
                                                                  ment as agreed upon under the Framework
                                                                  Convention on Climate Change and also by the
                                                                  declaration of world leaders of the major econ-
                                                                  omies. A city like Ahmedabad is also participa-

Figure 2: “Ellis Bridge” connecting east and west Ahmedabad

The time period is typically situated so as to
assess the progress towards meeting GHG
emission targets. Therefore actions taken now                     Figure 3: A glimpse of land use planning scenario in Ahmedabad
could be assessed by 2035 so as to get a real-
istic estimate about achieving deep cuts in                       tory to these global efforts but would need fi-
GHG emissions by 2050; as envisaged by                            nancial, technical and other ( carbon finance )
global leaders at ( G 8+5 ) summit in 2009.                       instruments, as agreed upon under the frame-
The targets in this study are in line with such                   work convention on climate change, to achieve
global commitments, as city level planning is a                   these aspirational targets. These efforts do not
part of the larger national policy making in In-                  under any circumstance undermine the im-
dia. The immediate future, 2020 ( terminal                        portance of various bilateral efforts in achieving
year of post-Kyoto period ) and the long-term                     the LCS targets.
future, 2050; coincides well with the target
years chosen for this study.

                                                              7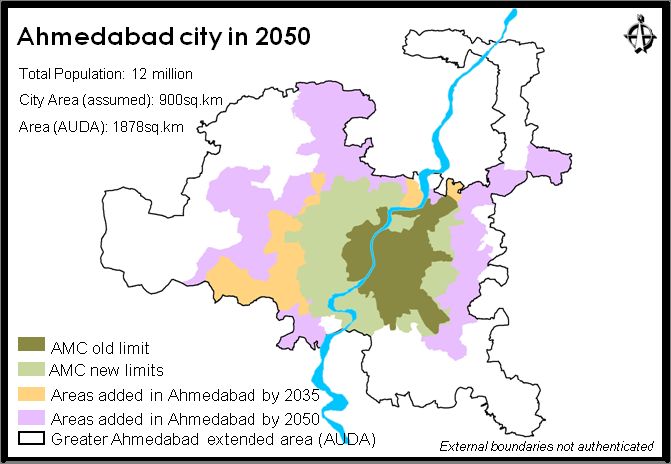
About Ahmedabad
Ahmedabad is the seventh largest ur- merce remains unchanged. The city also has a
ban agglomeration ( U A* ) in India, and the large market for consumer goods in the retail-
largest city in the state of Gujarat. The city ing sector.
plays a significant role in the economy of the Several key high-growth industries
state of Gujarat, accounting for almost 19 per- such as textiles, pharmaceuticals and natural
cent of main urban workers in the state. gas are already firmly anchored in Ahmedabad.
The city was founded in the year 1411 The industrial centers around Ahmedabad are
AD and is located on the banks of River continuously experiencing expansion on ac-
Sabarmati. Ahmedabad gets its name from count of economic growth. The economic
Sultan Ahmed Shah, who founded the city. base of the city is now shifting towards tertiary
Over the last 600 years, the city of Ahmedabad ( s ervice ) sectors, which now account for
has come a long way, from what was devel- more than 50% of total employment. Ahmeda-
oped as a cluster enclosed by a wall in 1456 bad is also a major financial centre contributing
AD. In the late 19th century, development start- about 14% of the total investments in stock ex-
ed spilling over towards the northeast and changes in India.
southeast of the walled city. Ahmedabad and its surroundings are
currently under the jurisdictional authority of
two local bodies, namely the Ahmedabad Mu-
nicipal Corporation ( A MC ) and the Ahmeda-
bad Urban Development Authority ( AUDA ) .
Beyond the municipal limits; the development
is managed by the AUDA.
Table 1: Ahmedabad Demographics
Parameter AMC Urban
Agglomeration
Population (Million)
- 1991 2.8 3.3
- 2001 3.5 4.5
- 2006(estimated) 4.9 5.1
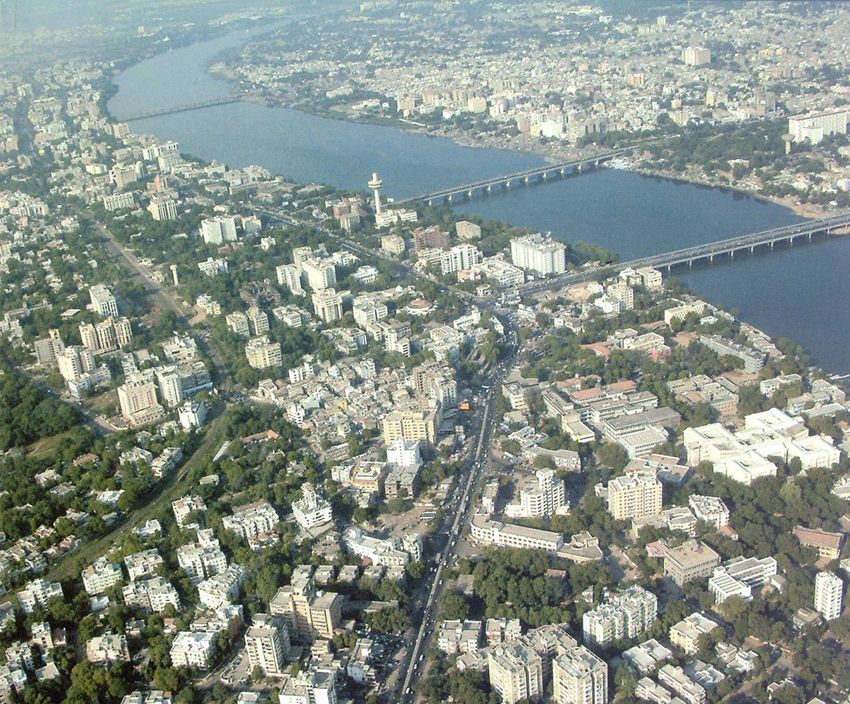
Figure 4: East and West Ahmedabad separated by the Sabarmati River Population Growth
- 1991-2001 2.03% 2.74%
Historically Ahmedabad has been one Area (Km2)
- 2001 190.8 485
of the most important centers of trade and - 2006 464.1 485
commerce in western India. It was once known
as the “ Manchester of India ” owing to its tex- Density (per sq. km.)
18,445#
tile industry. With the establishment of the first
2001 9,290
2006 10,609
textile mill in 1861, residences also developed
across the western side of the Sabarmati river.
# In 2006, the jurisdictional limit of AMC was increased to 464.16 sq. km.
This new limit coincides with the limits of the Ahmedabad Urban Agglom-
Today some of the industrial activities eration. The density of AMC in 2006 has not been calculated since the
area of AMC in 2006 was almost equal to the UA area and the new AMC
that have flourished in the city over the last few imits now included the population formerly housed in UA limits.
decades include chemicals, pharmaceuticals,
electronics, dyes and paints. Ahmedabad ’ s * Urban Agglomeration: It is a continuous urban spread constituting a town and its
adjoining urban outgrowths.
status as an important centre of trade and com-
8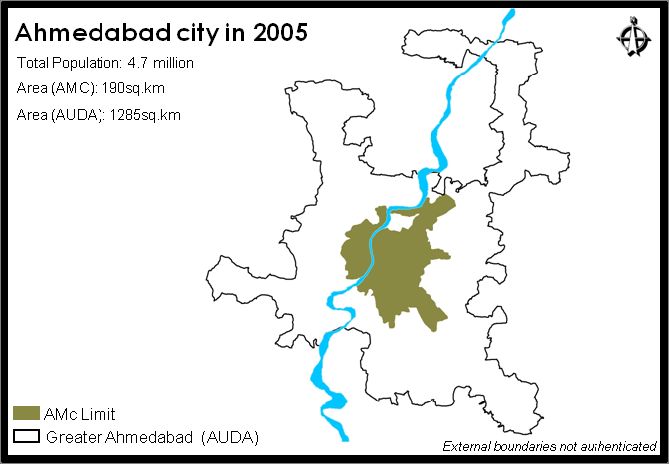
Some Initiatives Underway

Many initiatives are being undertaken currently by              improved collection. This has also resulted in an
the city and the state. The recently announced                  enhanced quality of service for passengers, map-
township policy promotes townships to come up                   ping out loss making routes, reduces overlapping
at growth nodes emerging around various indus-                  of routes and maximizing fleet usage by efficient
trial clusters. The policy sees the government as               management through constant monitoring of bus-
a facilitator providing 'trunk infrastructure' like ac-         es on various routes. The local government has
cess roads, bulk water supply and bulk power                    also taken an initiative to develop the Sabarmati
( e lectricity and gas ) . This would facilitate effec-         riverfront ( Figure 6 ) . This project also demon-
tive planning for city level infrastructure for antici-         strates governance initiative, since it is being
pated expansion and growth in the future. Be-                   managed by a special purpose vehicle ( SPV ) ,
sides, there are various initiatives underway in                which is coordinating all the activities pertaining
the urban transport infrastructure sector, with the             to this project.
Bus Rapid Transit System ( BRTS ) under exe-
cution and the Mass Rapid Transit System
( M etro ) being planned. These initiatives would
also play a significant role in the energy flows and
related emissions from the city.

                                                                Figure 6: Sabarmati River Front , being developed at Ahmedabad

                                                                Among the latest technological innovations, AMC
                                                                has developed Asia ’ s largest landfill site, devel-
                                                                oped over a total area of 2.77 Km2, to dispose
Figure 5: “Janmarg” - The BRTS Corridor under development       1.15 Million tonnes of waste. It has been de-
                                                                signed to meet city ’ s requirements for the next
The new regional plan submitted to the govern-                  30 years. Solid waste will be segregated into bio-
ment envisages Ahmedabad into a much bigger                     degradable and non-biodegradable categories
Ahmedabad Metropolitan Area. It plans for a multi               and dumped in a systematic manner, adhering to
-modal transportation hub with Metro rail, BRTS,                environmental standards. The waste would then
regional rail and the mass rapid transit systems in             be used to make pellets and fluff, to be used as
the next 7-10 years. This regional plan has been                fuel in local industries. This initiative of recycling
prepared for an area of 10,000 Km2 , which also                 waste to useful energy form by generation of me-
comprises of 5 air strips within 65 km radius from              thane ( CH4 ) is currently running successfully
the city and four multi-modal transport stations in             under pilot phase for other existing solid waste
the vicinity.                                                   management ( SWM ) treatment plant. The area
                                                                around the newly created SWM site has been
Reforms in the public transportation system in-                 planned to be developed as a “ Green Zone ” ,
cludes low-floored CNG buses fitted with vehicle                which would contribute in improving the ambient
tracking system ( GPS) and bus conductors                       environment. Thus, the creation of such an envi-
with hand-held electronic ticketing machine. This               ronmental infrastructure leads to multiple divi-
has resulted in an increase of bus patronage, and               dends.

                                                            9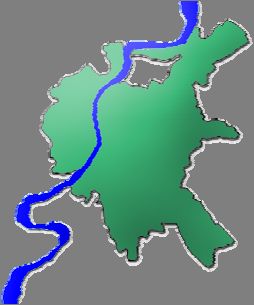
Land Use Planning
The Land use of Ahmedabad is diverse and                        niques which may be applied to implement the
strongly contrasting on either side of the river                master plan and to guide urban development to
( East and West Ahmedabad, or as it is called                   spatially appropriate areas include designation
locally- Old and New city ) . The contrast is not               of sensitive land resources and areas, estab-
only in terms of resources but also in economic                 lishment of buffer zones, management of haz-
profitability and environmental sustainability.                 ard-prone lands, protection of cultural re-
Ahmedabad shows differing trends in spatial                     sources, setting up of recycling schemes, con-
development. It is spilling over towards the                    servation of open spaces and guiding and dis-
northeast and southeast of the walled city.                     couraging of excessive urban sprawl.
While residences also developed across the                      Land use Planning and Transport:
western side of the Sabarmati river to meet the                 Land use and transport are strongly interlinked.
rising demand for housing, changing household                   Land use patterns such as location, scale, den-
pattern and structural changes in the city econ-                sity, mix , clustering and connectivity may not
omy. People everywhere are moving from in-                      automatically cause a shift towards sustainable
-city areas into the outer, a development for                   travel behavior, however it can definitely pro-
which growing car ownership and the modal                       vide an option and support to facilitate the tran-
shift from public transport to car act simultane-               sition towards such behavior. Also, under the
ously as both causes and effects. In addition to                growing threat of climate change and the strict
land area, the amount of floor-space per per-                   global stabilization targets, there is an in-
son is also growing, This, too, can be seen as                  creased need to limit the GHG emissions from
both a cause and an effect of urban sprawl.                     transport. Appropriate land use planning in
                                                                growing cities like Ahmedabad can substantial-
After the establishment of Land Administration Bureau           ly limit the increasing travel demand, thereby
 in 1986, China carried out national land use planning          leading to various spill over benefits like re-
twice. One of which was focused on “serving for social
  and economic development” and second one was to
                                                                duced congestions and improved air quality.
 “protect arable land”. They also aim to achieve high-          Besides, there is an improvement in the overall
er in their ongoing project for land use planning in the        quality of life, by making it easier for people to
            near term horizon of 2005-2020 .                    access the appropriate transport as per their
                                                                need.
                                                                Thus, the government should encourage an
It is widely acknowledged that avoiding urban                   efficient use of urban land by setting targets for
sprawl through high density and mixed-use set-                  the percentage of development occurring on
tlement patterns offers environmental ad-                       brown fields, the promotion of “ t own centre
vantages pertaining to land use, transport and                  first ” policies, setting housing density targets,
heating, thereby contributing to reduce the re-                 and reforming business rate relief for empty
source use per capita. In a developing city like                property and also consider introducing a
Ahmedabad, Urban planning and its effective                     charge on vacant and derelict land. Preserva-
implementation requires proper Land Use                         tion of open space near town and cities, and
( L U ) planning to create curative LU Patterns                 redevelopment of vacant land not only reduces
that provide maximum mobility without the loss                  transport cost but also reduces the cost of
of natural habitats and biodiversity. Thus at the               providing and operating public services and
city level, it is necessary to have proactive re-               utilities. Green belt is also equally important to
sponse from local government to carry out an                    check unrestricted sprawl of large built up area.
integrated land use planning to comprehen-                      All such policy initiatives are crucial for a devel-
sively address the adverse impacts of urbani-                   oping city like Ahmedabad, which is projected
zation including heat island effect. Zoning tech-               to grow substantially over the next 40 years.

                                                           10
Spatial growth
11Socio Economic Assumptions
The population of Ahmedabad has increased the base year. Similarly, the target year GDP of
from 2.8 million in 1991 to 3.5 million in 2001. Ahmedabad and Gujarat was determined using
In response to rapid increase in population and the GDP of India, keeping macro-economic
development on the fringes, the jurisdictional consistency. Thus, on the basis of these as-
limit of AMC was increased to 464.16 sq. km in sumptions, the modeling results show that the
2006. The major portion of this extension of real GDP of Ahmedabad in 2050 is expected to
municipal borders has taken place on the west- be approximately INR 3673 billion ( 12.0 times
ern side of Ahmedabad. The western region is the 2005 level ) .
actually seen as the modern, dynamic and well
-planned part of the city, offering world-famous The specific inputs to the model about the tran-
educational institutions, most recent malls and sitions in the structure of the economy are:
entertainment facilities, and high-income resi- share of the primary sector changes from
dential areas. The new outgrowths have been 3.03% in 2005 to 1.3% in 2035 and 1.1% in
in the western parts of the city, within the AU- 2050, while the share of secondary sector re-
DA jurisdiction. duces from 69.2% in 2005 to 59.0% in 2035
and further to 49.5% in 2050 BAU. The tertiary
Using expert opinion, published references and sector gains from 27.8% in 2005 to 39.7% in
our own estimates, it is projected that the popu- 2035 and further to 49.4% in 2050. Considering
lation of Ahmedabad would increase to 7.8 mil- the trends, it is obvious that the structure of the
lion in 2035, and would further rise to 12 million economy is moving towards more tertiary and
in 2050. Using this assumption about popula- secondary sector activities at the cost of prima-
tion and other assumptions ( see Table 2 ) ry. Thus there is a structural shift in the econo-
about 2035 & 2050 Ahmedabad, future socio- my of the city, which is in line with the experi-
economic indicators in 2035 & 2050 are esti- ences and trends worldwide.
mated exogenously ( see Table 3 ) , which
will be used as inputs in running the model for Further, to determine the structure of the econ-
the target years. Following are the important omy in future, PFCE and other numbers re-
assumptions for target years: garding investments and government con-
sumption have been estimated based on best
Economy: An input-output framework has been available references and expert judgment. For
used to determine the future structure of the the intermediate year of 2035, it is assumed
economy, where the future economic parame- that that import of agriculture commodities fur-
ters ( GDP, etc ) are obtained using certain ther increases ( in line with the decrease in
exogenous assumptions on the expected struc- share of primary activities ) and the share of
ture of the Ahmedabad economy in target electricity import also reduces, due to some
years. In order to estimate GDP projections for localized generation in terms of solar and bio-
Ahmedabad, a top-down approach was fol- mass. On the private consumption side, there
lowed. This approach uses the current GDP will be a reduction in the share agriculture con-
and future projections of India ’ s GDP ( based sumption, which will be complemented by an
on growth rate projections ) as a starting point. increase in consumption of manufacturing sec-
Further, the GDP growth rate for Gujarat were tor goods and a minor increase in service con-
pegged at 2% above India ’ s GDP growth fig- sumption.
ures i.e. 10% from 2004-2032 and 8% from the There will be an increased share of private in-
successive period till 2050. Gujarat GDP was vestment in electricity and water services,
pegged at 7 % of India GDP, and Ahmedabad whereas the share of investment in manufac-
GDP was pegged at 17% of Gujarat GDP for turing and construction sector will reduce, as
12compared to the base year. A similar trend is from outside ( from the state /national grid ) .
assumed for government investments, where There will be a further reduction in the share of
the share of investment in electricity and water agriculture in private consumption side, where-
will increase, with a reduction in the share of as there will be a continuous increase in the
investment in construction. The share of gov- consumption of services. For the private invest-
ernment investment in services, the distribution ment, the trend between 2005-2035 will be fur-
of government consumption, and the distribu- thered, which will have an increased invest-
tion of exports has been kept the same. It is ment in electricity and water services, and a
worthwhile to mention, that in spite of decrease reduced share of investments in manufacturing
in the relative shares, the absolute number will and construction sector. The government in-
still be rising for all the sectors, due to an over- vestment will also follow a similar trend. For the
all expansion of the economy from 2005 to exports, there will be a reduction in the share of
2035. For example, the private consumption in manufacturing, giving way to the export of spe-
2035 will be increased from more than the fac- cialized services from the city like real estate,
tor of population rise, on account of an as- banking, insurance, IT and ITeS. In fact, ex-
sumed increase in consumerism. ports and imports are both assumed to be in-
creasing, on account of a more integrated
For target year of 2050, it is assumed that agri- economy with high degree of economic activi-
culture import will increase to almost 100%. At ties with outside.
the same time, the increased requirement of
electricity in the city will largely be imported
Table 2: Quantitative Assumptions of socio-economic indicators ( 2035 and 2050)
Parameter 2035 BAU 2050 BAU
Demographic composition 0-6 : 33% 0-6 : 20%
7-64: 62% 7-64: 65%
>65 : 5% >65 : 15%
Primary Industry Exports 7.1% CAGR (2005-2035) 7.4% CAGR (2005-2050)
Secondary Industry Exports 6.1% CAGR (2005-2035) 5.8% CAGR (2005-2050)
Tertiary Industry Exports 10.4% CAGR (2005-2035) 10.8% CAGR (2005-2050)
Private consumption 8.0% CAGR (2005-2035) 8.1% CAGR (2005-2050)
Government consumption 9.7% CAGR (2005-2035) 8.4% CAGR (2005-2050)
Fixed capital formation 3.4% CAGR (2005-2035) 9.23% CAGR (2005-2050)
Modal share 2W :24% 2W : 7%
SV : 15% SV : 15%
LV : 1.1% LV : 3.4%
Bus : 15.9% Bus : 36.6%
Train: 8% Train: 8%
Bike : 11% Bike : 8%
Walk: 25% Walk: 22%
13Sectoral Assumptions
Industry: The energy consumption by the in- and the energy intensity of the industrial output
dustrial sector in the city has shown an increas- ( p rocesses) . As discussed above, the econ-
ing trend, and our estimates indicate that the omy of the city will undergo a structural shift in
energy demand CAGR for the 4 year period the future, where the share of industrial sector
between 2003 and 2007 has been a robust 7.5 will be reduced from the current levels. Howev-
%. This is also the period that experienced er, there will still be a wide increase in the in-
heavy investments in natural gas supply infra- dustrial outputs, in terms of absolute numbers.
structure in the city, and the corresponding At the same time, the energy intensity of the
supply linkages from sources. Thus, this in- various industrial process will also experience
crease can be attributed to growing industriali- a change, partly on account of fuel shift ( from
zation during the period and also due to the oil to gas, and subsequently from gas to elec-
easy availability of natural gas as a fuel. tricity ) , and also due to the reduction of ener-
gy use per unit of output, due to energy effi-
Two largest consumers of energy products ciency and process level improvements. Thus,
in Ahmedabad are the textiles and chemicals the future energy demand from the industrial
industry. Textile sector is the largest consumer sector in Ahmedabad is driven by an interplay
of energy, primarily in the form of steam and of these factors.
electricity. The last few years have seen a ma-
jor substitution of oil usage in Textile sector Households: The model structure provides the
with other energy carriers like coal and lignite. possibility of classifying the households in two
Although natural gas does provide a price ad- broad categories, based on the type of housing
vantage, however it is still not used much for facility. This classification broadly links to the
steam generation because of the availability of economic status of the residents, and hence
cheaper substitutes like coal, lignite, and bio- differentiates between the usage of different
mass ( non commercial, for smaller indus- services and appliances in the household, and
tries ) . The other major industrial sector is the also the energy usage per capita and the ener-
chemicals sector. Nearly 1200 chemical units gy source being utilized. Household type hht1
operate in Ahmedabad, majority of which are refers to the high income housing, and hht2
clustered in three major industrial estates. refers to the lower income houses. We have
Steam is the main requirement for these units, assumed that the share of household
and therefore coal/lignite has historically been ( h ht1:hht2) amongst these two types is
used in boiler applications and other heating 40:60 in 2005 ( base year, based on actual
activities ( such as brick kilns, etc) . However, data ) . However, because of the rising eco-
the chemical industry has shown a robust in- nomic affluence and income effects, the share
crease in the demand for natural gas in the re- changes to 50:50 in 2035, and further improv-
cent years, replacing coal and lignite. The pri- ing to 60:40 in 2050.
mary reason is the quality requirements of the
industrial processes ( f or example, ceram- Commercial: As highlighted in the description
ics ) , where the flame to be produced has spe- of future economic structure of Ahmedabad
cific technical requirements, and thus it is im- ( a bove ) , the tertiary sector will have a rapid-
perative to use a superior fuel like natural gas. ly rising share in the economy. This will happen
due to the growth of service related activities
The future demand for energy in the indus- ( b anking, insurance, real estate, IT, ITeS, ed-
trial sector at Ahmedabad is driven by two im- ucation, consulting, etc) to the city, and the
portant parameters: the growth of industrial shifting out of manufacturing related activities
sector ( driven by the growth in economy ) ,
14to other cities in the state or maybe even out- Thus, with rising incomes, the future resident of
side. Also, as the real estate sector in the city/ Ahmedabad will undergo a change in pattern of
country develops, it is anticipated that it will be travel, wherein the average number of trips will
kept pace by policy reforms aimed at increas- be increased in future, on account of some ad-
ing the FSI. Hence, combining all these effects, ditional leisure and work trips, and also in-
our best estimates indicate that the total floor crease in average trips per capita due to more
space for commercial activities will increase women being moving to the job market. Also,
from a base of 21 sq. km in 2005 to 103 sq. km due to an expansion in city limits, the average
in 2035 and further to 156 sq. km in 2050 in trip length will also undergo an increase, ac-
line with tertiary sector growth. counting for the increased distances between
work, home and other travel destinations.
Transport: The main drivers of passenger Thus, accounting for the increase in population,
transport demand are population, per capita per capita trip rate, and the increases average
trip rate ( PCTR ) and the average trip dis- trip length, passenger transport demand will
tance ( ATD ) . It is commonly understood that increase from 14.89 Billion passenger-km in
economic activities have a high correlation with 2005 to 53.3 Bn mil p-km level in 2035 and fur-
mobility, and thus an increase in overall travel ther increase to 129.6 in 2050.
demand is expected as the economic activities The quantitative assumptions that relate to
rise in the city. This increase can be explained these storylines can be summarized in Table 2
on account of the increase in the above men- and 3.
tioned parameters: population, PCTR and ATD.
Table 3: Estimation result of scenario quantification in 2035 and 2050
Indicator 2005 2035 2050 2050/2005
Population (millions) 4.7 7.8 12.0 2.55
No. of households (millions) 1.1 2.1 3.4 3.1
Average persons/household 4.3 3.7 3.5 0.8
GDP (billion INR) 305 3673 9884 32.4
GDP per capita (‘000 INR) 65 471 824 12.7
Gross output (billion INR) 727 7695 19024 26.2
-Primary industry 22 99 210 9.5
-Secondary 503 4538 9424 18.7
-Tertiary 202 3058 9390 46.5
Commercial Floor space 21 103 156 7.4
(square km)
Passenger Transport Demand (Million 14.9 53.3 129.6 8.7
passenger-km)
Freight Transport Demand (Million ton- 3.1 21.7 92.5 30
km)
BAU Energy Demand (Million toe) 1.8 11.3 23.0 12
BAU CO2 Emissions 10.2 44.1 86.3 8.5
(Million ton -CO2)
BAU Emissions per capita 2.16 5.66 7.19 3.3
(ton-CO2)
15LCS Scenario: Qualitative Storylines
In order to achieve the target of transitioning a more towards sustainable lifestyle by using
to a low carbon economy, we need to develop energy efficient materials and local materials.
the low carbon scenarios for a future Ahmeda- This will also provide significant co-benefits in
bad. Hence, it was important to collect a set of terms of promoting a sustainable lifestyle, bet-
counter measures, which will help us to alter ter control of energy service flows and resource
the energy emission profile in the target year. conservation. Similarly, the actions focusing on
However, these counter measures needs to be land Use & urban planning are targeted at in-
consistent with a storyline that defines how we creasing the green cover and improving the
visualize the Ahmedabad city in future. This built environment so as to reduce the urban
section presents the storylines for a future ar- heat island effect. At the same time, it is also
ticulation of low carbon Ahmedabad, enlisting a crucial to focus actions on planning various en-
collection of several low carbon measures. vironmental infrastructures, such as solid waste
management facilities and sewage treatment
The qualitative storyline that help us articu- plants. Apart from direct mitigation benefits,
late low carbon measures and actions can be these are important in realizing other co-
presented as under, classified into few broad benefits such as resource utilization and en-
categories, for the ease of understanding: hancing the quality of life. For example, a mod-
ern landfill can also be a source of fuels in the
Transport Sector: The actions on sustainable form of land fill gas ( L FG ) , pellets and fluff,
transport comprises of improvement in vehicle which can be used in the local industries. Simi-
efficiency, fuel switch from oil to electricity ( for larly, significant improvements can be realized
private vehicles, buses and train ) , modal shift in the energy consumption of public services,
from private vehicles to public transport ( bus by shifting to energy efficient sources like street
and train ) , and better traffic management. lamps.
However to achieve such a scenario, certain
indirect actions would be required. Some of Energy Sector ( Demand Side ) : The actions
these actions will be standardization electricity focused on demand side are aimed at efficien-
supply infrastructure and appropriate institu- cy improvements achieved through device im-
tional mechanisms to ensure transition to mass provements. These efficiency impacts are real-
based transit systems. All these actions would ized in residential, commercial, industrial and
lead to a strong decoupling between economic transport sectors. It is believed that due to
growth, mobility and transport energy use. technological innovations and improvements,
such high efficiency factors are realizable. The-
Urban Sector: The actions aimed at the urban se efficiency improvements can be consistently
sector focus on few broad areas, including the achieved through implementation of uniform
building design, land use & urban planning, building codes ( efficiency in residential sec-
and on environmental infrastructure for the cit- tor ) , standardization in device & vehicle effi-
ies. The low carbon measures focusing on the ciency, promotion of local and less carbon in-
Building Design are crucial for controlling the tensive material for construction and designing
energy flows in the established assets. Use of an appropriate institutional mechanism to facili-
appropriate building technologies, energy au- tate such a transition.
dits and associated standardization across
building types, materials and devices would go Energy Sector ( Supply Side ) : The actions
a long way in controlling flow of energy across focused on energy sector aim at fuel switch,
these stocks. The actions are also aimed at decoupling economic growth and energy re-
promoting dematerialization, directing towards
16quirement, and decoupling the carbon intensity motion of local and less carbon intensive mate-
of power sector. The action on Fuel Switch re- rial for construction. The action on resource
fers to switching from coal to gas and other re- management aims at better management of
newable resources of energy like biomass, natural resources for a substantial GHG mitiga-
wind and solar. This switch can happen across tion. Reduced dependence on groundwater for
sectors, like increased use of gas in industries, irrigation and a shift to surface water signifi-
piped natural gas for domestic usage and gas- cantly alters the energy consumption patterns
based power production technologies. The in the agriculture sector. It also comprises of
measures for decoupling economic growth and creating various infrastructures such as solid
energy requirement are aimed at process level waste management facilities and sewage treat-
improvements in various sectors, especially ment plants. Thus, all these actions primarily
industry. De-carbonizing the electricity sector target at reducing the energy intensity of the
aims at using more renewable sources of ener- output from the local economy. By constructing
gy for power generation or by using coal with common facilities at the city level, one can ac-
CCS option. Another aspect in low carbon tually reduce, reuse and recycle many re-
electricity is generating electricity from waste sources and thereby move on to the sustaina-
( s olid waste management ) . Such possibili- ble style of living. This would give an added
ties have already been explored for Ahmeda- incentive of energy reduction.
bad, and are realistic.
Apart from sectoral measures, there are certain
Resource Efficiency: The actions focused on overarching actions that have been considered
resource efficiency aims at material efficiency separately. Although such actions, like govern-
and resource management. The action on ma- ance and financing, do not facilitate any carbon
terial efficiency aims at promoting demateriali- mitigation directly, they do provide support to
zation and is directed more towards sustaina- other low carbon measures. While well de-
ble lifestyle by using energy efficient materials signed governance structures ensure that the
and local materials. It also aims at efficiency actions are implemented in the most non-
improvements achieved from device improve- conflicting manner, appropriate financing facili-
ments and reducing energy consumption in tates that the actions are able to attract innova-
intensive industrial processes. It needs imple- tive funding mechanisms so that the actions
mentation of energy efficiency codes and pro- are self sustaining.
Figure 7: Low carbon transitions in transport sector
17Energy & Emissions : 2035 & 2050
The macroeconomic data is used to estimate creased household services demand on ac-
future energy demand and the corresponding count of increases economic affluence and the
GHG emissions in 2035 and 2050, based on associated penetration of consumer durables.
scenario quantification. The estimated results
about energy demand and GHG emissions are As can be seen from Figure 4 above, the share
shown in Figures 8-11 below. of electricity increases gradually, and a major
portion of the final energy demand is met by
Final energy demand in Ahmedabad is project- electricity in 2050 ( in this case, gas based
ed to increase from 1.8 million toe in 2005 to thermal power generation ) , closely followed
11.3 million toe in 2035 ( B AU scenario ) , and by gas. The relative shares of electricity and
further to 23 mtoe under 2050 BAU scenario. gas are further enhanced, under the low car-
Industry remains as the bigger consumer of bon scenarios. Thus, in terms of infrastructure
energy, maintaining a share of around 60% in choices, it clearly outlines the need for exten-
the final energy demand, under various sce- sive investments in power sector infrastructure,
narios. The second biggest demand for energy including generation, transmission and distri-
comes from the household sector, where the bution.
share in final energy use increases from
around 18 % to 30 %, because of the in-
50.0
Biomass Solar
40.0 Nuclear Hydro
H2 Gas
30.0 Oil Coal
20.0
10.0
0.0
2005 2035 BaU 2035 LCS 2050 BaU 2050 LCS
Figure 8: Final energy demand by sector (mtoe) Figure 9: Total primary energy supply (mtoe)
t ‐ CO2 /Capita
8.15
5.63
3.13
2.16 2.32
2005 2035 2035 LCS 2050 BaU 2050 LCS
BAU
Figure 10: Sectoral GHG emissions (mt CO2 ) Figure 11: Per capita GHG emissions
18As can be seen from Figure 9 that the primary Based on the energy demand by source, the
energy supply is primarily met by gas, although CO2 emissions in Ahmedabad are projected to
various other sources like nuclear, solar, and increase from 10 million ton CO2 in 2005 to 44
hydro play a crucial rle. Hence, the power infra- million ton CO2 in 2035 BAU scenario, and fur-
structure development will have to follow a ther to 86.3 million ton CO2 under the 2050
portfolio approach, wherein simultaneous in- BAU scenario. However, by making cross sec-
vestments have to be made in acquiring power toral infrastructural investments over the plan-
generation capacity from all these sources, and ning horizon extending upto 2050, there is a
the associated transmission infrastructure to possibility to limit the overall emissions from
haul the generated power to the city. Besides, the city, as has been shown under the 2035
there is a large share of gas in the final energy LCS and 2050 LCS scenario ( F igure 10 &
use in the city, and hence in order to supply 12 ) .
this gas for final energy use, there will be in-
vestment requirements for gas supply infra- As discussed earlier, the biggest consumption
structure, which would mean city gas distribu- of final energy happens in the industrial and
tion grid for household and retail customers, household sector, and correspondingly, the two
and also gas retail outlets for transport sector sectors are also the biggest contributors to
customers. Also, in order to support the elec- overall emissions ( Figure 10 and Figure 12 ) .
tricity driven vehicles on the roads, especially
under the 2050 LCS scenario, there will be a
need to develop the charging infrastructure for
these electric cars.
Figure 12: Sectoral Mitigation Potential (million ton CO2)
19Mitigation potential in 2035 & 2050
In order to transit to a low carbon society in Ah- highlight that there is a significant energy and
medabad, several countermeasures are re- emission decoupling of GDP which is happen-
quired. It is interestingly observed from the out- ing in Ahmedabad over the entire modeling pe-
put that for a LCS transition in Ahmedabad the riod upto 2050.
major contribution is from reduction of energy
intensity. The major emission reduction poten- As can be seen from Figure 13, that the major
tial is from improvements in energy intensity of emission reduction potential is from improve-
economic activities, low carbon power ( more ments in reduction in service demand and en-
renewable like hydro, solar and biomass ) , re- ergy intensity of service demand, fuel switch
duction in energy service demand ( f or indus- ( b oth at end use level, as well as using low
trial and commercial sector ) , fuel switch in carbon electricity i.e. gas or renewable like hy-
power, transport and industrial sector; and dro, solar and biomass) , and investments pro-
measures promoting end-use device efficiency moting end-use device efficiency ( particularly,
( p articularly, in the transport sector, industrial in the transport sector, industrial and residential
and residential sector ) . sector ) . Thus, the sectoral infrastructure de-
velopments have to be aligned in the long term,
Thus with these measures, our target of at to address these emission concerns.
least matching the base level emission figures
or reducing further is achieved and we are situ-
ated at less than the base year emission level.
The overall reduction from the base year emis-
sion of per capita is 6.6%. It is important to
Figure 13 : Breakdown of emissions reduction potential
100.0
90.0
80.0
Vehcile Efficiency
70.0
Industrial Efficiency
60.0
Building Efficiency
50.0
40.0 Fuel Switch
30.0
Energy Intensity
20.0
Emissions
10.0
0.0
2005 2035 BaU 2035 LCS 2050 BaU 2050 LCS
20Low Carbon Infrastructures
Low carbon transition arrives with a window of infrastructure. However, the transition to a low
opportunity for developing countries, as it gives carbon economy provides us with this oppor-
us a chance to avoid critical lock-ins; particular- tunity to make investments in low carbon elec-
ly in long-lived infrastructure assets. From the tricity, thereby aiming at decoupling the carbon
perspective of a city, like Ahmedabad, it facili- intensity of power sector by using greener and
tates the decision about the future flow of ener- cleaner energy sources like renewable, nucle-
gy through infrastructure and other behavioral ar, gas and biomass based generation.
and lifestyle related choices. As can be seen in
the analysis above, several infrastructure Building and other urban infrastructure: Ah-
choices, which could be either resource/sector medabad is a growing city, and hence lot of
based or hard/soft type, determine the future developments in urban infrastructure is yet to
energy and emission dynamics of the take place. This provides us an opportunity to
city. Thus, a BRTS corridor being implemented better control our energy flows in the building
in the city or a Metro under planning will have a sector ( residential and commercial) . With an
long term implication on the energy demand of appropriate land use planning, multiple benefits
the transport sector in the city. However, the are possible, which can impact the overall
decision for such infrastructure investment emissions and also the quality of life. The city
choices has to be taken now, to avoid econom- planning can account for a transit oriented de-
ic and behavioral lock-ins and inertia. velopment to reduce the mobility needs ( and
hence the transport energy use) , an in-
The possibility of aligning long term infrastruc- creased green cover can be targeted, thereby
ture choices so as to simultaneously achieve improving the built environment so as to reduce
the possible sectoral mitigation of CO2 can be the urban heat island effect. Similarly, uniform
better understood as under: building codes, and promotion of local and less
carbon intensive material for construction can
Transport Infrastructures: There is a need for promote efficiency in the residential sector.
sustainable transitions in the transport sector,
which would mean a focus on public transport
investments so as to shift from private vehicles
to public vehicles ( bus and train ) , appropri-
ate city gas distribution grid to facilitate transi-
tion from oil to gas ( private vehicles and bus-
es ) , and also the availability of appropriate
infrastructures ( reticulated electric corridors
for buses, and charging infrastructure for
cars ) , so as to facilitate a further transition to
electric vehicles in the long run.
Power Infrastructure: In order to facilitate a
transitions to electricity, from coal and gas in
the case of industrial sector, oil and gas in the
case of transport sector, and coal, kerosene
and LPG in the case of residential sector, there
is a need to make investments in power gener-
ation as well as transmission and distribution
21Actions toward LCS
General introduction of actions and financing has been separately considered.
While the governance aspect ensures that the
Broadly, the actions are enumerated in the fol-
actions are implemented in the most non-
lowing table. The actions can be broadly cate-
conflicting manner and the financing action en-
gorized into those that promotes improvements
sures that the actions are able to attract inno-
in efficiency, to those that encourages sustain-
vative financing mechanisms so that the ac-
able mode of transportation ,to clean forms of
tions are sustainable by itself. However it must
energy and chiefly, that promotes efficient use
be noted that all the actions yield multiple co-
of energy resources through promotion of
benefits and build adaptive capacities of the
measures like 3R. However within these ac-
local population.
tions, the overarching action of governance
22Description of “Actions”
The action on Sustainable transport comprises of focus fuel switch from oil to electricty
( p rivate vehicles, buses and train) , better traffic management and shift from private vehi-
cles to public vehicles ( b us and train ) . However to achieve such a scenario, certain indi-
rect actions would be required. Some of these actions will be standardization electricity sup-
ply infrastructure and appropriate institutional mechanisms to ensure transition to mass
based transit systems. From the developing countries view-point, such an action would yield
multiple benefits. On the co-benefits side, there would be improvement in local air quality
due to reduced pollution and reduction in use of natural resources. Sustainable transport will
lead to various adaptation benefits as well, by enhancing health security ( o wing to improved
air quality ) and energy security ( due to reduced energy usage, specially oil ) . This action
gives the added benefit of controlling the energy usage, as electricity is used at the end use.
The action on Energy Efficiency ( E E ) is focused on efficiency improvements achieved
through device improvements. These efficiency impacts are realized in residential, commer-
cial, industrial and transport sectors. It is believed that due to technological innovations and
improvements, such high efficiency factors are realizable. These efficiency improvements
can be consistently achieved through implementation of uniform building codes ( efficiency
in residential sector ) , standardization in device & vehicle efficiency norms and its strict im-
plementation & designing an appropriate institutional mechanism to facilitate such a transi-
tion.
The action on Low Carbon Electricity aims at decoupling the carbon intensity of power sector
by using more renewable sources of energy for power generation. Another aspect in low
carbon electricity is generating electricity from waste ( solid waste management) . Such
possibilities have already been explored for Ahmedabad, and are realistic. Such shifts in en-
ergy technology would yield multiple benefits, such as improvement in local air quality and
effective waste management. On the adaptation side, investments in low carbon electricity
would generate livelihood and build capacity in low carbon energy technologies. Besides,
there would also enhance health security ( owing to improved air quality) and energy secu-
rity ( due to reduced usage of fossil fuels, specially coal ) .
The action on Material Efficiency aims at promoting dematerialization and is directed more
towards sustainable lifestyle by using energy efficient materials and local materials. This will
also provide significant co-benefits in terms of promoting a sustainable lifestyle, better control
of energy service flows and resource conservation. These measures would also result in im-
proving livelihood security ( generation of employment through local industries ) and en-
hance energy security by the overall reduction in energy demand.
The action on Environmental Infrastructure & Municipal Services comprises of creating vari-
ous infrastructures such as solid waste management facilities and sewage treatment plants.
Apart from direct mitigation benefits, these are important in realizing other co-benefits such
as promotion of 3R and enhancing the quality of life. For example, a modern landfill can also
be a source of fuels in the form of land fill gas ( LFG ) , pellets and fluff, which can be used
in the local industries. Significant improvements can be realized in the public services do-
main by standardization of consumption and shifting to energy efficient lamps.
23The action on 3R, targets primarily at reducing the energy intensity of the output from the local
economy. By constructing common facilities at the city level, one can actually reduce, reuse and
recycle many resources and thereby move on to the sustainable style of living. This would give an
added incentive of energy reduction.
The larger framework of Governance comprises of how to govern the city. Local government exe-
cutes at the interface of the state and the centre and therefore has to plan, implement and coordi-
nate a host of activities. To facilitate a smooth transition to a low carbon city, the local government
of Ahmedabad would need an effective governance and institutional mechanism. Governance
initiatives will have an overlapping influence in ensuring sustained sectoral emission reductions.
In the residential and commercial sector, effective governance would comprise of implementing
uniform building codes, ensuring faster penetration of energy labeling programs and greater pub-
lic awareness about reducing energy consumption. In the transport sector, governance initiatives
should focus on better city planning ( t o reduce congestion, and encourage shorter movements)
and standardizing vehicle efficiency norms. And in the industry and power sector, it comprises of
implementing energy efficiency standards and ensuring mandatory fuel switch to cleaner fuels.
In the context of developing nations, Financing plays a key role in any low carbon initiative over
and above the business as usual transition. Thus, the deep emission cuts would involve substan-
tial investments in low-carbon infrastructure. Besides, these infrastructure and technology choices
would also lead to some economic losses ( G DP ) , which would translate into developmental
loss and would have to be compensated through either international investments and technology
transfer. For ensuring a transition to a low carbon society, various financial initiatives would be
necessary at the local level. In the building sector, financial incentives are needed for energy effi-
ciency improvements ( a dvance technologies in end use devices ) , and initiatives like green
buildings. In the transport sector, financial support is needed for huge investments in public
transport infrastructure, modern transport technology ( traffic management ) , and incentives to
promote efficient vehicles. Industry sector needs to be supported with financial initiatives such as
tax benefits for investments in efficient and low carbon technology equipments. For the power
sector, investments in CCS and renewable energy technologies need to be appropriately support-
ed financially.
Municipal Services from LCS perspective
From the perspective of electricity usage for municipal services, the major forms of energy us-
age comes from street lighting and electricity for water pumping, treatment and distribution.
From the government estimates, it is found that in the base year of 2005 21.89 ktoe energy
was used in such services. This is projected to increase to 46.97 ktoe in 2035 BAU and 80.77
ktoe in 2050 BAU. This is mainly due to the expansion of the city limits, and therefore more en-
ergy used for street lighting and energy for water. There are significant electricity saving op-
portunities that exist in this sector, chiefly due to energy efficiency measures, automation of
street lighting, automation in water plants, and implementing demand side measures for curtail-
ing the water requirements in the domestic and commercial sector.
24Governance & Financing
At the outset, governance structure is a hierar- office. These offices come under the control of
chical web of interactions at various levels. the state government and therefore, it is a chal-
These interactions, popularly termed as organi- lenge for the local authorities to remove the
zation structure, help in delineating responsibil- multifarious effects of coordination failure.
ities and setting up jurisdictional boundaries.
For e.g., AMC is divided into various zones and On Financing side, the options at the local level
each zone has Deputy Municipal Commission- comprise of innovative mechanisms, like
er with the overall responsibility of the zone. ‘ m unicipal bonds ’ and other innovative insti-
However many common and overlapping func- tutional arrangements. On the institutional
tions are aggregated at the AMC level, like wa- front, for example; the Sabarmati River Front
ter supply and production. These departments Project is a Special Purpose Vehicle, aimed at
have to ensure coordination at all levels to fa- reclaiming land on the sides of the river
cilitate implementation of any initiative. This Sabarmati. Not only improving the built envi-
becomes an onerous task for a large area, and ronment through this initiative of an environ-
therefore manifests itself in various inefficien- mentally initiated infrastructure, this initiative
cies. The local government has thus embarked aims to sell a part of the land claimed back on
upon various initiatives so as to solve this prob- commercial basis. This improves the viability of
lem. One of the initiative is the Continuous the project and ensures speedy pay-back.
Monitoring System – to bring more accounta-
bility and transparency ( a t all levels of govern- Thus in the overall framework of governance
ance ) . and financing, the set of activities like form, fi-
nance and structure; help in connecting with
Another aspect in the governance structure is the framework of sustainability for the LCS so-
the form of governing arrangement. AMC has ciety ( from the resources side as well as from
come up with innovative forms of local govern- the consumption side ) . It also looks at the re-
ance, like Public-Private Partnership distribution justice aspect, as people participate
( i mplemented in Solid Waste Management at the lowest levels and concern about the
Projects ) , Special Purpose Vehicle ( like the common citizen in the policy making process
BRTS project, and the Sabarmati Riverfront helps in ensuring equity in the decision making
Development Project ) , among others. These progress.
forms help in managing policy implementation
in a viable and effective framework. Most of the cities in the current context exhibit
voluntary participation in various activities. The-
Key function of the local government lies in co- se voluntary participations predicate upon the
ordinating, planning and implementing policies. various sources like information. However most
However with a number of policy initiatives, of the initiatives are achieved through private
and with overlapping governance structures; it channels only and are in isolation. Therefore,
becomes extremely difficult in achieving the one has to keep in mind that uniform sustaina-
desired results. For example, BRTS ( bus rap- bility frameworks can only be implemented
id system ) project is implemented via a Spe- through effective governance structures
cial Purpose Vehicle ( S PV ) , a typical project backed by policies, laws and regulations. And
structure which is run on commercial principles, therefore, effective governance structures is a
but local implementation overlaps with jurisdic- fundamental aspect in ensuring implementation
tional responsibilities of various state depart- of various LCS actions.
ments like the traffic police, regional transport
25You can also read