The Future of the Global Pharmaceutical Industry - October 2017
←
→
Page content transcription
If your browser does not render page correctly, please read the page content below
The Future of the Global Pharmaceutical Industry
                                        October 2017
Table of Contents
 Section                                                                                                     Page

 1.   Executive Summary                                                                                      3
 2.   Pharmaceutical Sector Has Grown Rapidly in the Last Century                                            7
       -    Widespread concerns about the sector today                                                       8
       -    Thousandfold increase in value of companies in sector since 1920s                                10
 3.   Pharmaceutical Sector Will Triple in Size in the Next 40 Years                                         12
       -    Pharmaceutical consumption econometrically close related to GDP growth                           14
       -    Based upon expected GDP growth, the pharma sector will likely triple in size by 2060             19
 4.   Total Value of the Pharmaceutical Sector Today over $5 Trillion                                        20
       -    Total revenue in the pharma sector around $1.1 trillion in 2017                                  23
       -    Total value of companies in sector over $5 trillion. Pharma one of the world’s largest sectors   24
 5.   Pharma Will Be Positively Impacted by Growth in Rare Disease Drugs and China                           27
       -    Cost controls widespread and likely to continue. Major impact on Europe market                   28
       -    Rare disease pharma sector has grown in value by 1300% since 2000. To continue growing fast      37
       -    China to become a close #2 to the U.S. market in time. Dramatic growth to continue               49
 6.   Innovations in Inflammation Control, Nucleic Acids and Implantables Will Transform Industry            55
       -    Better Manufacture Will Facilitate Dramatic Growth in Peptide Therapeutics                       56
       -    Control of Inflammation May Substantially Reduce Mortality from Cancer & Heart Disease           61
       -    Nucleic Acid Therapeutics a Source of Substantial Future Growth                                  65
       -    Cell Therapy is Becoming Mainstream in the Pharmaceutical Industry                               70
       -    Implantables and Electroceuticals Will Redefine Therapeutic Sector                               74
 7.   Summary                                                                                                84
 A1. About Torreya                                                                                           93

                                                                                                                    2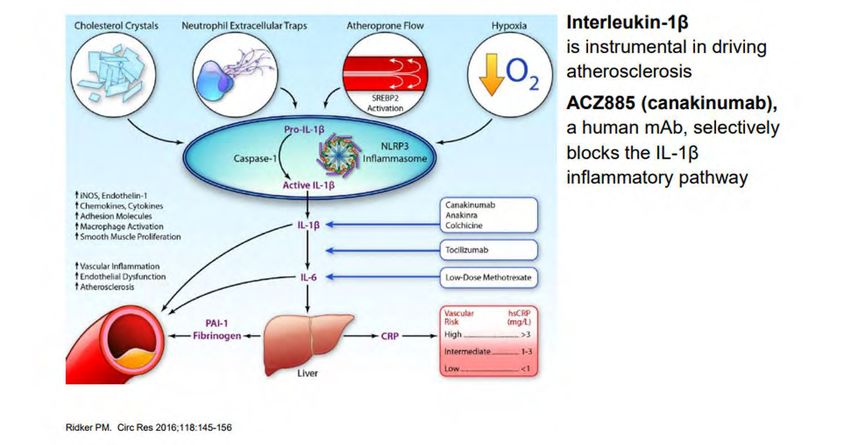
1.       Executive Summary
Overview

                               3
Preface
We at Torreya are engaged in providing strategic advice to companies in the life sciences industry and have compiled a
comprehensive global database of companies in the pharmaceutical sector. We have analyzed key trends in
pharmaceuticals and have built a model relating pharmaceutical revenue over time and place to fundamental economic
factors. We have used this model to forecast pharma revenues at the country level out to 2060.
This report focuses on the most important trends and innovations that will shape the pharmaceutical sector and impact
human life in the decades ahead.
The analysis and observations in this report were compiled by Torreya in the Fall of 2017. We have focused on ideas and
trends that we observed in both the scientific literature but also in discussions with client companies in recent years. Our
analysis is by necessity incomplete and does not comment in detail on a number of important trends associated with
aging, the rise of cell therapy, pricing pressure on generics, consolidation in drug wholesaling, digital health, the growth of
biologics etc.
We are grateful to many individuals who helped us with the insights in this report and the underlying database used herein
including: Elizabeth Condo, Torreya; Pam Demain, formerly of Merck; Chuck Dimmler, Torreya; Masaki Doi, Torreya;
Benjamin Garrett, Torreya; Weijun Gu, JPT; Kylor Hua, Torreya; Jeremy Ji, JPT, Stephanie Leouzon, Torreya; David
Paterson, Impax Laboratories, Melissa Pearlman, Torreya, Alan Selby, Torreya and Ping Shek, Torreya.
All opinions and forecasts are our own and may prove to be inaccurate. All errors and omissions are our own and the
information in this report, particularly that on private companies, may be inaccurate, dated or, at best, directional. All
content in this report is subject to the disclaimer provided on page 92.

                      Megan Ledger, Ph.D.                                   Tim Opler, Ph.D.
                   Head, Torreya Research Group                              Partner, Torreya
                    megan.ledger@torreya.com                             tim.opler@torreya.com
                         +1 212.257.5820                                    +1 212.257.5802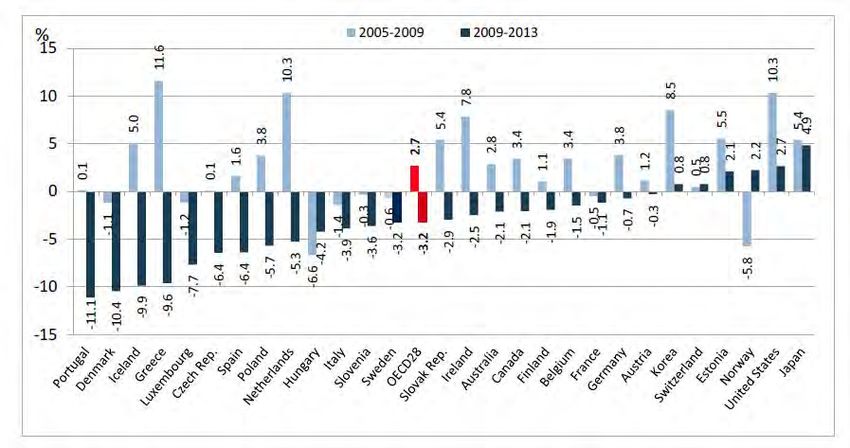
Topics Discussed in this Presentation

      1.                 2.               3.                4.
  Where has the     Where is the      What is the       What trends and
  pharma industry   pharma industry   composition and   innovations that
  been?             going?            size of the       will shape the
                                      sector today?     industry in the
                                                        future?

                                                                           5
Executive Summary
§   Growth in the pharmaceutical industry will be driven
    by increasing wealth across the world

§   The pharmaceutical industry is likely to triple in size in
    by 2060 on an inflation-adjusted basis

§   The pharmaceutical industry is around 30% larger
    than previously thought and is one of top five in the
    global economy

§   Major innovations will continue to drive the size and
    growth of the industry with positive implications for
    the health of the global population
                                                                 6
Pharmaceutical Sector
       2.       Has Grown Rapidly in
                the Last Century
Where Have We
        Been?

                                        7
Major Concerns About the Pharma Industry and the
  Medical Sector

                                                                          Pharma 2020
Nov 2014: “There are already signs of trouble      “Tomorrow’s challenge is to develop new medicines that
ahead - thousands of job losses and widespread     can prevent or cure currently incurable diseases. Today’s
consolidation are hardly characteristics of an     challenge is to get to tomorrow – and that’s a tall order in
industry in rude health…                           itself.
'Little breakthrough'
For a start, big pharmaceutical companies are
                                                   Rising customer expectations: The commercial
no longer providing the service they once did.     environment is getting harsher, as healthcare payers
                                                   impose new cost constraints on healthcare providers and
"The system has served us well in terms of         scrutinize the value medicines offer much more carefully.
developing good new medicines, but in the past
10-20 years there has been very little             Poor scientific productivity: Pharma’s output has
breakthrough in innovation," says Dr Kees de       remained at a stable level for the past decade. Using the
Joncheere at the World Health Organisation.        same discovering and developing processes, there’s little
                                                   reason to think its productivity will suddenly soar.
Of the 20 or 30 new drugs brought to the
market each year, "many scientists say typically   Cultural sclerosis: The prevailing management culture,
three are genuinely new, with the rest offering    mental models and strategies on which the industry relies
only marginal benefits," he says.”
                                                   are the same ones it’s traditionally relied on, even though
                                                   they’ve been eclipsed by new ways of doing business.”

                                                   Source: PWC, Pharma 2020: From vision to decision, 2012.       8
Some Perspective. In the 1920s…
The combined market cap of the pharma sector was
less than a half billion dollars.

Penicillin had not been invented.

Insulin was extracted from pig bladders.

A leading treatment for mental disorders was
lobotomy.

U.S. consumers spent less than 5% of their income on
healthcare and less than 1% of their income on
pharmaceuticals.

Merck and Wyeth were small chemical companies in
New Jersey. Pfizer was making progress in
confectionery.
                                                                                  Eli Lilly worker operating
                                                                                  machine for producing insulin by
J&J was building market leadership in Band-Aids. Some                             grinding pig pancreases.
Lilly labs closed for the winter.
                               Source on US consumer expenditures: U.S. Bureau of Economic Analysis, National Income and Product Accounts.
                                                                                                                                             9
Today…
Global Pharmaceutical sales exceed $1 trillion (by just
how much we are going to discuss).

The value of the sector is over $5 trillion (up one
thousand fold from the 1920s).

Mortality rates from major diseases including heart
disease, cancer and stroke are down dramatically.
                                                                                 Mortality from major disease is down
Most drugs on the market in developed economies
                                                                                 dramatically – due in part to
have proven efficacy and safety.                                                 pharmaceutical interventions

U.S. consumers spent nearly a fifth of their income on
healthcare and more than 3% of their income on
pharmaceutical products.

The pharmaceutical business has globalized with
modern drugs available in most countries in the world.

                                Source on US consumer expenditures: U.S. Bureau of Economic Analysis, National Income and Product Accounts.
                                                                                                                                              10
U.S. Pharma Spend Has Risen Rapidly in Real Terms
Pharmaceutical Expenditures in the U.S. Have Gone Up by 900 Times Since 1929.
90,000 INDEXED TOTAL PHARMACEUTICAL SPENDING ON AN INFLATION ADJUSTED BASIS, 1929-2016 (INDEXED
1929 = 100)
80,000
Acceleration of spending
started in the 1990s with
Normalized Index of Expenditures (1929 = 100)
70,000 the advent of new
medicines for chronic
60,000 conditions and advanced
medicines for cancer and
50,000 expansion of employer-
provided health insurance
40,000 plans
30,000
20,000
10,000
0
1929 1935 1941 1947 1953 1959 1965 1971 1977 1983 1989 1995 2001 2007 2013
Time
Source: U.S. Bureau of Economic Analysis, National Income and Product Accounts. 11Pharmaceutical Sector
3. Will Likely Triple in Size
in the Next 50 Years
Where is Pharma
Going?
12Healthcare Spending Rises with GDP
Healthcare Spending in the US Has Gone Up Faster than GDP Over The Last 90 Years
16,000 3,000
US GDP VERSUS TOTAL MEDICAL CARE SPENDING ON AN
INFLATION ADJUSTED BASIS, 1929-2016 U.S. Consumer Has Spent an
14,000 Increasing Percentage of Wallet
2,500
on Medical Care
Healthcare Spending (Current $ billion)
12,000
2,000 § Healthcare has an income
10,000 elasticity of demand above
GDP (Current $ billion)
one.
Real GDP
8,000 1,500 § Or put another way, once the
Healthcare Spend consumer has covered the
6,000 basics of food, shelter and
1,000
transportation he directs the
4,000 marginal consumption dollar to
superior goods such as
500
2,000
investment in life extension
(medical care).
0 0 § Economists would call
1929 1935 1941 1947 1953 1959 1965 1971 1977 1983 1989 1995 2001 2007 2013 healthcare a “luxury good”.
Time
Source: Bureau of Economic Analysis, National Income and Product Accounts.
13Pharma Spending Also Rises Disproportionately with
Total Consumption
U.S. Pharmaceutical Spending in the US Has Gone Up Faster than Total Consumption
Over The Last 90 Years
90,000
INDEXED US TOTAL CONSUMER EXPENDITURES VERSUS The percentage of the consumer’s
TOTAL PHARMACEUTICAL SPENDING ON AN INFLATION wallet that is spent on pharma
80,000 ADJUSTED BASIS, 1929-2016 (INDEXED 1929 = 100)
products has gone up dramatically
Normalized Index of Expenditures (1929 = 100)
70,000 since 1930.
60,000 The proportion of total spending
Total Consumption that goes to pharmaceutical
50,000 products has been rising at an
Pharma Spend increasing rate since 1990. This likely
40,000 reflects acceleration of innovation,
the advent of more expensive drugs
30,000
for life threatening diseases,
particularly biologics and the greater
20,000
availability of employer and
10,000
government reimbursement for
pharmaceutical product
0 expenditures.
1929 1935 1941 1947 1953 1959 1965 1971 1977 1983 1989 1995 2001 2007 2013
Time
Source: Bureau of Economic Analysis, National Income and Product Accounts.
14Pharma Spending as a Fraction of Total Spend has
Risen Five Times in Less than a Century
US Pharmaceutical Spend as a Percent of Total Consumer Spending, 1930-2016
Spending on Prescription and OTC Pharmaceuticals /
3.80%
3.23%
Total Consumption
2.33%
1.54%
1.05% 1.13% 1.07%
0.84% 0.78%
0.71%
1930 1940 1950 1960 1970 1980 1990 2000 2010 2016
Source: Bureau of Economic Analysis, National Income and Product Accounts. Torreya Calculations.
15Relationship Between Pharma Spending and Wealth
Consistent Across Countries
There is a strong positive relationship Pharma Spend / Capita - Versus GDP /
between Pharma Expenditures / Capita Capita – 2016 ($), 37 Countries
in 2016 and GDP / Capita in the same
year.
$703
This cross-sectional pattern is
$648
consistent with the longitudinal data
from the United States.
$490
Globally, consumers spend an $453
increasing fraction of their income on
pharmaceuticals as their income rises
up to GDP / Capita of $30,000 and then
pharma spend rises roughly one to one
$204
with GDP afterwards.
On average pharma spend as a percent $9 $84
of GDP is 1.33% across 37 countries. < $2000 $2000 - $10000 - $25000 - $30000 - $40000 - $50000 +
$10000 $25000 $30000 $40000 $50000
GDP/ Capita 2016 ($)
Source: OECD Health Data and Selected Country Level Sources; Torreya calculations. 16GDP Growth Forecasts, Top 20 Countries, OECD
GDP Growth Forecast (%) Between now and 2060 (43 years), World GDP is expected
to more than triple in real (inflation-adjusted) terms.
Country 2017-2030 2030-2060
World 3.7 2.3
USA 2.3 2.0 World GDP Growth Forecast ($millions, current)
China 6.6 2.3 $300,000,000
Japan 1.2 1.4
Germany 1.3 1.0
Russia 3.0 1.3 $250,000,000
France 2.0 1.4
Italy 1.3 1.5 $200,000,000
Mexico 3.4 2.7
UK 1.9 2.2
Canada 2.1 2.3 $150,000,000
South Korea 2.7 1.0
Spain 2.0 1.4 $100,000,000
Brazil 4.1 2.0
Australia 3.1 2.2
Poland 2.6 1.0 $50,000,000
Saudi Arabia 4.2 2.4
India 6.7 4.0 $-
Argentina 3.6 2.2
2017
2019
2021
2023
2025
2027
2029
2031
2033
2035
2037
2039
2041
2043
2045
2047
2049
2051
2053
2055
2057
2059
Indonesia 5.3 3.4
South Africa 3.9 2.5
Source: Looking to 2060: Long-Term Global Growth Prospects, OECD 2012.
17Forecast “Real” Pharmaceutical Sector Growth
Size of Sector in Future Versus Size Pharmaceutical Expenditures
Today (Percentwise) (Current $millions)
Country 2030 vs. 2017 2060 vs. 2017 2017 2030 2060
World 160% 317% $ 1,042,545 $ 1,671,932 $ 3,307,407
USA 134% 243% $ 385,191 $ 517,678 $ 937,702
China 230% 454% $ 122,728 $ 281,701 $ 557,260
Japan 117% 177% $ 103,006 $ 120,285 $ 182,536
Germany 118% 159% $ 64,007 $ 75,710 $ 102,045
Russia 147% 216% $ 46,693 $ 68,570 $ 101,023
France 129% 196% $ 45,524 $ 58,890 $ 89,367
Italy 118% 185% $ 36,909 $ 43,657 $ 68,239
Mexico 154% 343% $ 36,263 $ 56,006 $ 124,551
United Kingdom 128% 245% $ 33,235 $ 42,448 $ 81,543
Canada 131% 259% $ 29,113 $ 38,144 $ 75,456
South Korea 141% 191% $ 28,350 $ 40,084 $ 54,027
Spain 129% 196% $ 27,123 $ 35,087 $ 53,246
Brazil 169% 305% $ 25,915 $ 43,693 $ 79,144
Australia 149% 286% $ 15,575 $ 23,164 $ 44,497
Poland 140% 188% $ 14,082 $ 19,660 $ 26,499
Saudi Arabia 171% 348% $ 13,345 $ 22,782 $ 46,408
India 232% 754% $ 12,863 $ 29,887 $ 96,934
Argentina 158% 304% $ 11,599 $ 18,370 $ 35,289
Indonesia 196% 534% $ 10,858 $ 21,249 $ 57,936
Source: Torreya forecast based on OECD GDP projections and historical relationship
between country GDP growth and pharmaceutical consumption.
18Pharma Sector Outlook:
The pharmaceutical sector is likely
to triple in size between now and
2060 after adjusting for inflation.
This is a result of greater wealth –
which in turns fuels society’s ability
to pay for new drugs.
194. Total Value of the
What is the Size Pharmaceutical Sector
Today over $5 Trillion
and Composition of
the Pharmaceutical
Sector?
20Torreya’s Data Group Tracks Global Pharma Sector
Torreya has created a § Torreya is a globally active investment bank focused on the
data group focused on pharmaceutical sector.
understanding the
global pharma industry § In the process of closing 150+ licensing, M&A and capital
markets transactions in the last decade, we have had to
learn the various players pharmaceutical sector in detail.
§ We began to track assets, people and companies the
industry with our own databases in 2008.
§ Today, we have a dedicated data group which focuses on our
internal database resources.
§ Torreya’s data group is headed by Dr. Megan Ledger, a social
statistician.
21Torreya Pharma Study Approach
§ Identified approximately 30,000 companies globally that are involved in doing
research or marketing pharmaceutical products.
§ Excluded OTC, distributors, manufacturing and API players from this database.
§ Because over half the companies are not listed on a stock market, we
developed an algorithm to impute value for private companies (based on
financial metrics where available). Our approach is to use publicly traded
company multiples in six key categories and to impute private company value.
§ Collated a list of the top 2000 companies by value.
Note: All references to pharmaceutical company “Value” in the following pages refer to either enterprise value (market
capitalization less cash plus debt) or, for private companies, values derived from our algorithm.
22Sector Size
Industry is larger than generally believed
Current Estimates of Industry Size by Net Revenue:
Torreya’s
Estimate of Total Recent estimates of the size of the global pharma sector in 2016 range from
Global Revenues $774 billion to $868 billion.*
of the Ethical
Pharmaceutical Torreya’s Estimate of Industry Size: $1.13 Trillion (30% larger than the
Sector in 2016: previous estimate).
$1.1
This estimate is the sum of net sales of the largest 1,700 companies in the
pharmaceutical sector.
One of the key explanations of the difference is China and India. Torreya’s
Trillion database likely goes deeper into ranks of Chinese and Indian pharmaceutical
companies than other sources.
Our database is still likely missing some players so the actual revenue of the
pharma sector is likely even higher than our estimate, although we have
included some companies which have some non-pharma revenue in the
compilation.
* See Evaluate Pharma, World Preview 2017, Outlook to 2022, June 2017, p. 3. and “Outlook for Global
Medicines Through 2021,” QuintilesIMS Institute, December 2016, p. 18.
23Pharma Sector is one of the Largest in the Global
Economy
The value of the commercial side of the drug sector is
approximately $5.4 trillion (about $700 per every
living person).
Pharma is a very large and complex growing part of
the global economy.
The only parts of the economy that are larger by value
are technology, consumer products and oil.
The $5.4 trillion value estimate is calculated as the sum of the values of the top 2000 pharmaceutical companies in Torreya’s pharma database.
24Value Breakdown VALUE SHARE OF PHARMACEUTICAL
SUBSECTORS, SEPTEMBER, 2017
by Subsector Animal Development stage
Health Biotechnology
1% 3%
China
Specialty Pharma
Pharma 10%
The world pharmaceutical 23%
Korean
sector value pie is led by 17 Pharma
large global pharmaceutical 1% Generics
11%
companies (45% value
share), followed by 277
smaller pharma companies
(we call specialty pharma, Japan
23% share), followed by Pharma
6%
China and the generic sector
which are about the same in Global
size. These are followed by Pharma
Japan Pharma (6%) and 45%
Biotechnology (3%).*
* We know the biotech sector seems smaller than some might have expected. This is because we classify a company
with no approved product as a “biotechnology company” and a company with a marketed product that is not a big
pharma, not a Japan pharma nor a China pharma as a specialty pharma company. Thus, many companies (think Incyte)
that some would think of as biotech are classified by us as specialty pharma.
25Value Evolution of the Top Twenty Companies Over Time
The global pharmaceutical industry has grown enormously in just six years by value. In August
2011 the value of the top 20 companies was $1.45 billion. Today, the top 20 companies are now
worth $2.9 billion.
Global Value Champions
Up 351% with minimal
M&A. Highly innovative
cancer products.
Up $201 billion in value
(equivalent to a whole large
pharma). Introduction of
numerous new high value
biologics.
26Pharma Will Be
5. Impacted by Cost
What Key Trends Controls, Growth in
Rare Disease Drugs
Will Shape the
Pharmaceutical
Sector?
and China
27First Trend
Cost Controls Increase in
Severity
28Widespread Global Adoption of Pharma Cost Controls
§ As the pharmaceutical industry has grown, governments around the world have
become more conscious of associated costs.
§ In more countries than not, pharmaceutical cost controls set by government
reimbursement agencies have affected the direction and profitability of the
pharmaceutical industry.
§ In free market economies, an increasing percentage of consumers’ budget is
spent on pharmaceuticals as income grows. This pattern has held in the U.S.
§ However, because pharmaceutical spending is influenced to a significant
degree by governmental decisions and associated budgets, the pattern
between income and pharmaceutical spend has been broken in some markets –
particularly in Europe.
29Examples of Global Drug Cost Containment Policies
Policy Class Specific Type of Action Representative Countries Adopting Policy
Pricing Controls One-off cut in prices of patented medicines Austria, Belgium, Germany, Italy, Portugal, Spain, UK
and Cuts
Implementation of reference pricing Brazil, Canada, France, Germany, Italy, Mexico, N. Zealand, Spain
Change in reference price system by cluster Greece, Ireland, Portugal, Spain
Reduction of Mark-Up for Distributors Austria, Canada, Greece, Ireland, Italy, Portugal, Spain
Implementation of Essential Drug List with Low Prices Argentina, China, India, Russia, Vietnam
Mandatory Annual Price Cuts Japan, Philippines
Increase of government rebates / most favored nation approach Germany, United States
Extraordinary Price Reviews Greece, Ireland, Portugal, Slovakia, Spain
Group purchasing approach / negotiation for lower prices Canada
Reimbursement Delisting of products on reimbursement lists Czech Republic, Greece, Portugal, Spain
Policies
Increase in patient co-pays Austria, France, Greece, Ireland, Sweden
Health Technology Assessment / Cost-Benefit for price decisions Germany, United Kingdom
Entry management agreement Belgium, Italy, United Kingdom
Policies to Implementation of INN name prescribing (can't use brand name) France, Italy, Portugal, Slovakia, Spain
promote generic
medicines Incentives for physicians to prescribe generics Belgium, France, Hungary, Japan
Incentives for pharmacists to prescribe generics Belgium, France, Ireland, Japan
Incentives for patients to receive generics France, Iceland, Ireland, Portugal, Spain
Generic price cuts and tendering approach Canada, China, Italy, Vietnam
Sources: Torreya research and Belloni, A., et.al., “Pharmaceutical Expenditure and Policies,” OECD Working Papers No. 87, April 19, 2016.
30Real Pharma Spend Dropped in Almost All European
Countries After 2009
Government-mandated price reductions have led to substantial declines in real
pharmaceutical spending after 2009 in countries such as Portugal, Denmark, the
Netherlands and Spain.
Retail Pharmaceutical Spending Growth Before and After 2009 in Real Terms, OECD Countries
Source: Belloni, A., et.al., “Pharmaceutical Expenditure and Policies,” OECD Working Papers No. 87, April 19, 2016.
31Impact of European Price Controls on Pharmaceutical
Spending
Pharma Spend / GDP by Location, 2015
Europe spends about
40% less than the US 2.03%
1.93%
as a percentage of 1.78%
GDP on drugs.
1.54%
Remarkably, Europe 1.51%
also spends less on 1.33%
1.20%
GDP-adjusted basis
than Canada, Mexico,
South Korea and even
Russia.
United States Japan Canada Mexico South Korea Russia European
Countries (12
majors)
Source: Torreya research and OECD data.
32Case Study: Portugal
Portugal unfortunately found that its national debt became unsustainably high and
sought a €79.0 billion IMF debt bailout in 2011. This was followed by deep budget
cuts that were ultimately followed by an economic turnaround. In Portugal, there is
a single default insurer for most drugs, the National Health Service. The Infarmed
sets retail drug prices. Drug prices were cut by between 10% and 30% per annum
in many years in the 2009-2015 time period. The result was that the average price
of generic drugs fell by more than two thirds between 2003 and 2013 and branded
drug prices were cut by roughly a third.
In an article, Tough Times for Pharma in Portugal on Dec 10, 2012 it was reported: Portugal cut drug
“The approval of new drugs has ground to a halt for 18 months and reimbursement prices to the levels
decisions have been constricted for non-generics says the Portuguese seen in Estonia. The
pharmaceutical industry body, Apifarma. Price cuts and mounting debt in public result was decreased
hospitals are making access to essential medicines more difficult for patients and access to drugs and
harming the industry, it warns.” By 2013, Portugal’s drug prices mirrored those of significant hardship on
Estonia and Slovakia. the R&D efforts of local
companies like Bial.
The impact on the domestic pharmaceutical industry was devastating. Portugal’s
leading domestic branded pharmaceutical company is Bial, led by Luis Portela.
“Luis Portela mentioned in 2013 that Bial had to postpone the development of a
new Parkinson´s Disease drug due to budget constraints.” [Pharmupdates, Mar 15,
2015].
33U.S. only OECD Country Without Direct Control of
Drug Prices
With the exception of the United States, all OECD countries directly regulate
pharmaceutical prices.
In the United States pressure on pharmaceutical prices is becoming increasingly
severe. The VA and State Medicaid receive substantial discounts in the United States
as do hospitals and other providers who reach substantial amounts of low income
recipients (340B program).
According to Blumenthal and Squires: “The strategies described above clearly result
in cheaper drugs for the VA, DOD, Medicaid, and 340B providers. The Congressional
Budget Office has estimated that the VA and DOD pay drug prices that are roughly
half as much as those paid by retail pharmacies, and that Medicaid pays about one-
third less than Medicare Part D (which pays whatever prices its plans negotiate in
private markets). The agency that runs the 340B program estimates that it reduces
drug prices for participating providers by one-third.”
See D. Blumenthal and D. Squires, "Drug Price Control: How Some Government Programs Do It," To the Point, The Commonwealth
Fund, May 10, 2016.
34Adoption of Novel Medicines Impacted by Price
Regulations
In one recent study carried out by three authors from the London School of Economics*,
it was noted: “This paper analyses the impact of reimbursement regulation on launch
times in the adoption of new medicines in a sample of OECD countries and a subsample
of European countries. The latter also allows examination of price spillover effects, given
that pharmaceutical product reimbursement regulation commonly benchmarks from
prices in other countries. We empirically focus on the relative delays imposed by
regulation on the adoption of a global set of molecules, which have diffused across more
than 10 markets in the OECD over the period 1999–2008, controlling for various
confounding effects. Through examining time to launch across a number of markets, and
controlling for a number of confounding influences, we find that price and reimbursement
regulations appear to delay the adoption of new pharmaceutical products. We also find
that the existence of interdependencies in pricing may have a further indirect effect of
such regulation on launch times. Firm economies of scale, the therapeutic importance of
specific product innovations and market size are found to counter the delaying impact of
price and reimbursement regulation on new medicines adoption.”
*Joan Costa-Font, Alistair McGuire and Nebibe Varol (London School of Economics), “Regulation Effects on the
Adoption of New Medicines,” Empirical Economics, November 2015, pp. 1101-1121.
35New Medicine Innovation Impacted by OECD Price
Regulations
In 2004, the U.S. Department of
Commerce published a study of the
impact of OECD price controls on the
global pharmaceutical industry. The
study noted that OECD price controls
could be linked to reductions in global
R&D spending of approximately $5 to $8
billion per year with the consequence of
3 to 4 new molecular entities not being
developed per annum. These NME’s
would have had many billions of benefit
for consumers according to HHS
analysis.
36Second Trend
Greater Focus on Rare Disease
37Rare Disease Therapeutics Becoming Much More
Important Across the Pharmaceutical Industry
§ The 1983 Orphan Drug Act in the U.S. was designed to
encourage drug manufacturers to develop new medicines
for smaller, neglected diseases that didn't offer as much of
a financial return.
§ Along with tax credits and other benefits, the 1983 law
granted drugmakers who secured approval of a rare
After the widespread
disease drug seven years of marketing exclusivity — a worldwide adoption of
powerful monopoly. Later, certain orphan disease orphan drug statutes, the
interest in developing drugs
developers also received the right to FDA Priority review
for rare diseases has
vouchers. increased.
§ Other countries have also adopted incentives to develop
drugs for rare disease.
§ As a result, developing drugs for rare disease has become
increasingly mainstream.
§ Because of low development costs but high market value,
this area has attractive substantial investment.
38Size of Rare Disease Segment
§ We identified a number of pure play rare disease companies and have also included the
Genzyme segment of Sanofi.
§ Rare disease therapeutics companies have themselves gone from being a rarity to an
important and growing part of the pharmaceutical marketplace. In October 2017, the
total enterprise value of the top 20 pure play rare disease non-oncology companies
was $315 billion.
§ Many oncology companies have pursued rare forms of cancer for approvals. The sum
of the enterprise value of pure play rare disease oncology companies as of October
2017 was $193 billion.
§ The end result is that the pure play segment of rare disease is now more than a half
trillion in value.
§ To be sure, some of the rare disease companies counted here have products that are
not aimed at the orphan market (e.g., Shire’s ADHD franchise). However, since many
big pharmas (not counted here) also have rare disease products in their portfolio, the
real value of the rare disease segment of the pharma industry is likely much higher
overall than the half trillion mark noted here.
§ However, one looks at it, the rare disease segment of the pharma sector is one of the
largest and likely to remain so.
39Value of Rare Disease Sector is Up Thirteen Times Since
2000
TOTAL ENTERPRISE VALUE ($MIL) OF TOP 31 PURE PLAY RARE
DISEASE THERAPEUTIC COMPANIES
(INCLUDED ARE GENZYME AND ASSUMED VALUE OF GENZYME TODAY. ALSO INCLUDED IS
BAXALTA BACK TO 2000 USING ASSUMPTIONS ON VALUE UNDER BAXTER FROM 2000-2014).
Non-Oncology Oncology
$193,116
$132,310
$115,595
$311,493 $315,681
$252,231
$27,909
$6,728
$6,619 $81,698
$30,725 $47,929
2000 2005 2010 2015 2016 OCT-17
Source: Torreya calculations using data obtained CapitalIQ, October 2017. 40Top Pure Play Rare Disease Companies by Value
($millions)
The pure rare disease sector is FYE Enterprise Value of Leading Pure Players in Rare Disease Therapeutics, 2000 –2017
Company Key Disease 2000 2005 2010 2015 2016 Oct-17
now more than 17% of the Biogen Multiple Sclerosis $ 3,548 $ 11,303 $ 14,459 $ 90,507 $ 62,236 $ 69,812
Shire (+predecessors) Hereditary Angioedema $ 16,572 $ 18,563 $ 33,788 $ 71,017 $ 59,590 $ 67,777
value of the big pharma sector Vertex Pharma
Genzyme
Cystic Fibrosis
Multiple Sclerosis
$ 1,900
$ 4,062
$ 769
$ 14,813
$ 7,032
$ 14,653
$
$
26,938
28,391
$
$
20,965
31,230
$
$
37,428
36,070
- larger than the entire biotech Alexion
BioMarin
Paroxysmal Nocturnal Hemoglobinuria
Morquio Syndrome
$ 1,604
$ 1,173
$
$
720
382
$ 4,177
$ 2,219
$
$
33,707
16,966
$
$
33,572
13,299
$
$
33,114
16,261
sector (defined as the value of
Jazz Pharma Narcolepsy $ 472 $ 11,342 $ 7,675 $ 10,141
Non-Oncology
Bioverativ Hemophilia $ 6,086
Ionis Pharma Spinal Muscular Atrophy $ 570 $ 375 $ 467 $ 7,598 $ 3,719 $ 6,053
companies that do not yet have bluebird bio Cerebral Adrenoleukodystrophy $ 2,663 $ 1,320 $ 5,320
United Therapeutics Pulmonary Arterial Hypertension $ 1,296 $ 945 $ 3,156 $ 6,672 $ 4,713 $ 4,225
an approved drug) and larger Swedish Orphan Biovitrum
Horizon Pharma
Hemophilia
Urea Cyclic Disorders
$ 1,105 $
$
3,100
2,695
$
$
3,896
3,029
$
$
4,073
3,409
than the entire Japan pharma Spark Therapeutics
AveXis, Inc.
Retinal Dystrophy
Spinal Muscular Atrophy
$ 1,627 $
$
634
500
$
$
3,044
2,671
Amicus Therapeutics Fabry Disease
sector or China pharma sector. Corcept Therapeutics Cushing's Syndrome $ 60
$
$
17
152
$
$
674
415
$
$
599
416
$
$
2,416
2,127
Prothena Corporation AA Amyloidosis $ 492 $ 765 $ 2,060
Ultragenyx X-Linked Hypophosphatemia $ 1,826 $ 1,991 $ 1,970
Intercept Pharma Primary Bilieary Colangitis $ 4,866 $ 2,082 $ 1,624
This estimate belies even Subtotal Value ($ millions) $ 30,725 $ 47,929 $ 81,698 $ 311,493 $ 252,231 $ 315,681
greater value because Celgene Multiple Myeloma $ 1,883 $ 5,125 $ 24,562 $ 98,127 $ 85,514 $ 113,055
Incyte Myelofibrosis $ 3,875 $ 539 $ 1,371 $ 13,452 $ 12,709 $ 23,576
substantial portions of non- Genmab Chronic Lymphocytic Lymphoma $ 158 $ 406 $ 506 $ 3,713 $ 5,857 $ 13,477
Kite Pharma Diffuse B Cell Lymphoma $ 2,088 $ 1,569 $ 9,533
pure play big pharma (e.g.,
Oncology
Exelixis Advanced Renal Cell Carcinoma $ 703 $ 486 $ 544 $ 4,193 $ 3,609 $ 7,773
Seattle Genetics Relapsed Hodgkin's Lymphoma $ 172 $ 926 $ 823 $ 1,045 $ 7,207
BMS, Merck, Novartis) are now Tesaro Ovarian Cancer
Relapsed B-Cell Non-Hodgkins
$ 1,744 $ 1,521 $ 6,122
Juno Therapeutics Lymphoma $ 4,961 $ 2,605 $ 4,182
driven by rare disease drugs. Clovis Oncology Advanced Ovarian Cancer $ 2,406 $ 466 $ 3,735
Array Biopharma BRAF-mutant Melanoma $ 704 $ 474 $ 2,307
Loxo Oncology Solid tumors with NTRK-fusion proteins $ 99 $ 226 $ 2,149
Subtotal Value $ 6,619 $ 6,728 $ 27,909 $ 132,310 $ 115,595 $ 193,116
Total Value $ 37,344 $ 54,657 $ 109,607 $ 443,803 $ 367,826 $ 508,797
Value as Percent of Big Pharma Value 2.75% 3.98% 7.58% 16.36% 14.63% 17.54%
Source: Torreya calculations using data obtained CapitalIQ, October 2017. 41Perspective: Less than 1% of World Population Served
by Rare Disease Companies Today
We collected data on prevalence of the leading diseases Prevalence per
Disease 100,000
treated by the top 20 rare disease companies listed on
Multiple Sclerosis 90
the previous page (see table at right). The known
Hereditary Angioedema 2
prevalence data are often incomplete and can be off
Cystic Fibrosis 25
substantially. Recall that the sum of the enterprise
PNH 0.16
value of these companies is $315 billion. It is important
Morquio 0.16
to note that these companies offer drugs that treat
Narcolepsy 50
more than just these diseases.
Hemophilia 20
Spinal Muscular Atrophy 13
The collective prevalence of the leading diseases
Cerebral Adrenoleukodystrophy 3
treated by these rare disease companies is 300 per
Pulmonary Arterial Hypertension 3
100,000 or 0.3%. Assuming that the drugs developed
Urea Cycle Disorders 3
by these companies reach all of the world’s population,
Retinal Dystrophy 13
the number of persons treated would be under 25
Fabry Disease 30
million. To put it in perspective, somewhere between
Cushing's Syndrome 1
10% and 20% of the world’s pharmaceutical sector
AA Amyloidosis 1.5
value is associated with treatments for well less than
X-Linked Hypophosphatemia 5
1% of the world’s population.
Primary Biliary Colangitis 40
Total 299.8
Source: various reports on prevalence of individual diseases. 42We See Continued Growth in Rare Disease Sector
Given the statistics shown on the previous page, one might suspect that we will see a
slowdown in the rare disease sector in the future. We do not believe that this is a likely
outcome for several reasons:
1. Rare disease companies are making a difference for patients. Most of the
treatments sold by these companies are truly life-saving and extend life
substantially.
2. Reimbursement favorable in wealthy countries and likely to become more
favorable. Budgets are available in many countries to pay for rare disease drugs.
3. Rare disease business is globalized and less vulnerable to reimbursement changes
in any one country.
4. Strong patient advocacy groups underlie government’s willingness to reimburse
rare disease drugs.
5. Number of new drugs in development rising fast and likely to continue on the same
path. We are still relatively early in finding cures for many genetic diseases.
6. The pipeline is rich and is benefitting from breakthroughs in gene therapy, nucleic
acid therapy and gene editing.
43Reimbursement Policies are Relatively Favorable
We have discussed Illustrative pricing of orphan drugs across three countries on an annualized basis, 2016
substantial price cuts
made by European and Marketer Drug US Pricing UK Pricing Australia Pricing
Asian governments Alexion Soliris 440,000 444,000 500,000
worldwide, especially Vertex Kalydeco 306,000 267,000 300,000
following the Global
Seattle Genetics Adcetris 100,000 NA 110,000
Financial Crisis.
Interestingly, the same governments that have implemented severe price cuts have been relatively
permissive about pricing and reimbursement for rare disease drugs. The table above shows the market
reality which is that there is little discounting across countries of rare disease products like Kalydeco or
Soliris.
This is a reflection of the profound impact that these drugs can make on the lives of patients that are
treated and the rarity of the diseases treated. The overall budgetary burden of rare disease drugs has
been modest thus far. Europe, Latin America, Japan and North America have taken relatively
permissive policies towards rare disease drugs. In contrast, the two most populous countries – China
and India have not adopted orphan drug regulation and associated pricing policies.
It is important to note that there are often value limits imposed on the potential sales of a rare disease
drug by a country and it is not uncommon for rebates to be put in place to lower the effective cost.
44Japan Expanding Orphan Drug Access
§ The interest in marketing rare disease drugs has risen
markedly in recent years. This has been associated
with policies from the Japanese MHLW that
encourage sales of such drugs. Pricing is generally
within 70% to 120% of the global prevailing price.
§ Recently, Japan’s MHLW expanded orphan drug
criteria from diseases with less than 50,000 patients
to less than 180,000 patients if the disease is
classified as an otherwise “intractable disease”.
§ Japanese regulators also introduced the “ultra-
expensive drug repricing rule” in early 2016 that
allowed for drug prices to be slashed if they exceeded The Japanese government has
aggressively encouraged
revenue forecasts provided at the initial approval. adoption of orphan drugs.
This was in reaction to the high pricing of Opdivo in
Japan. To date, this rule has yet to be implemented.
45Rare Disease Pharmaceutical Business is Global
Reimbursement policies are favorable towards rare disease drugs in many countries. Thus, despite
high prices for many rare disease drugs, the distribution of these drugs is highly globalized. For most
countries, the cost of these drugs has yet to raise substantial budgetary concerns in comparison to
rising costs for other drug categories (e.g., cancer care, autoimmune disease, diabetes). To illustrate
the globalization of rare disease drugs, consider the sales distribution charts below taken from the
2016 annual reports of Alexion and BioMarin – two leading pure play rare disease companies. Alexion’s
revenues are 36% from the US and BioMarin’s 46%. These figures are in line with the current global
distribution of pharma sales.
Alexion Revenue Distribution, 2016 BioMarin Revenue Distribution, 2016
Rest of World US Rest of World
21% 36% 18% US
Latin 46%
Asia Pacific America
11% 13%
Europe Europe
32% 23%
Source: 2016 annual reports of Alexion and BioMarin. 46Orphan Drug Designation Requests at FDA Have
Doubled in the Last Five Years
Number of Orphan Drug Designation Requests Received by
FDA’s Office of Orphan Drug Development, 2012-2016
568
471
453
Number of Requests
339
267
2012 2013 2014 2015 2016
Source: FDA Orphan Drug Modernization Plan, June 29, 2017.
47Rare Disease Drug Pipeline Enriched by Gene Therapy,
Gene Editing and Nucleic Acid Drugs
§ A key advance in the last forty years in science has been
the decoding of the genome and the increasing
understanding of the genetic causes of rare disease.
§ The last decade has seen widespread advances in the Ultragenyx Acquisition
ability to use drugs to address genetic mutations and Dimension Therapeutics uses (AAV) gene
associated disease. delivery technology to develop rare disease
therapeutics. Dimension has drugs in Phase
§ Particularly exciting has been the application of nucleic 1/2 development inherited metabolic
diseases, including OTC deficiency and
acid therapeutics by companies such as Alnylam and GSDIa.
Ionis for rare disease. More recently, we have seen rapid
Traditionally, strategic players in rare
advances made with gene therapy and gene editing as a disease have avoided investment and M&A
mechanism to address genetic diseases. in gene therapy – seeing this area as quite
risky.
§ Companies such as AveXis, AVROBIO, bluebird, Editas
Ultragenyx’s acquisition of Dimension in
and Spark Therapeutics have made major advances in October 2017 for $150 million is a landmark
gene therapies and editing for rare disease. We expect transaction in rare disease therapeutics
insofar as it represents one of the first times
the pace of innovation from such companies to where there has been high acquisition in a
accelerate in the years ahead. gene therapy company.
48Third Trend
Growing Importance of China
49Chinese Pharmaceutical Market Growth
Total Pharma Revenues, China 2005-2017,
($ Billions) Key Trends
Chinese pharmaceutical
122
market has grown six times
114
107.1
larger in just 13 years
96
China is the second largest
85.1
pharma market in world today
74.8
63.5 Usage of Western medicines
52.2
up massively
42.1
High growth for cancer,
33.1
26.2
cardiovascular and respiratory
23.5
21 drugs given disease burden in
Chinese population
2005 2006 2007 2008 2009 2010 2011 2012 2013 2014 2015 2016 2017
Source: OECD Estimates
50Growing Importance of Chinese Pharmaceutical Sector
Chinese companies have added $84 billion in Top 20 Chinese Pharma Companies by Value
shareholder value in just 18 months. This is August 30, 2017
despite major changes in the regulatory regime
2016
and increasing pressure on prices (especially via Value Value Estimate Revenue
Company Rank ($ mil) ($mil)
Essential Drug Lists). Yangtze River Pharma 1 $ 50,630 $ 8,300
Hengrui 2 $ 22,391 $ 1,606
Valuation of the Leading CR Pharma Rx Segment 3 $ 19,087 $ 3,129
Qilu Pharma 4 $ 16,520 $ 1,666
Chinese Private and Kangmei Pharma 5 $ 15,239 $ 3,159
Publicly-Traded $534,066 Yunnan Baiyao 6 $ 13,505 $ 3,245
Pharmaceutical $518,640
Fosun Pharma 7 $ 12,275 $ 2,125
Companies, Last 18 Sinopharm - Rx Segment 8 $ 12,163 $ 1,994
CSPC Pharma 9 $ 9,252 $ 1,522
Months Huadong / China Grand 10 $ 6,863 $ 3,634
Tasly Pharma 11 $ 6,209 $ 2,017
Sino Biopharma 12 $ 6,097 $ 1,990
$460,894
Neptunus Group 13 $ 5,831 $ 956
$449,916
Chongqing Zhifei Bio 14 $ 5,765 $ 65
Kanghong Pharma 15 $ 5,038 $ 365
Salubris Pharmaceuticals 16 $ 5,010 $ 543
Kelun Pharma 17 $ 5,008 $ 1,241
Apr 2016 Nov 2016 Mar 2017 Aug 2017 Humanwell 18 $ 4,782 $ 1,784
Dongbao Pharma 19 $ 4,670 $ 286
Source: Torreya calculations and Torreya pharma database. GPC 20 $ 4,389 $ 2,939
51China Will Lead Major Market Growth in the Pharma
Sector Over the Next 50 Years
US market will double while China market up 4X. Japan, Germany and France markets will
grow less than 2X.
Projected Global Pharma Expenditures For Six Largest Countries ($millions), 2017-2060
$1,000,000
$900,000
$800,000
$700,000
$600,000
$500,000
$400,000
$300,000
$200,000
$100,000
$-
USA China Japan Germany Russia France
2017 2030 2060
Source: Torreya calculations and OECD data. 52China Passes W. Europe in Total Market Share by 2060
Current Share of Pharma Revenue by Country, 2017 Forecast Share of Pharma Revenue by Country, 2060
Indonesia, 1% Australia, 1%
South Korea,
Canada, 2% Indonesia, 2%
Australia, 1% 2%
Saudi Arabia, Canada, 2%
India, 1%
Saudi Arabia,
South Korea, 1% India, 3%
Russia, 4% 2%
2%
Russia, 3%
ROW, 6% USA, 30%
USA, 33%
ROW, 5%
Japan, 9% Japan, 6%
Latam5, 7% Latam5, 8%
China, 10%
Western Western China, 18%
Europe 15, Europe 15, 17%
22%
Source: Torreya calculations and OECD data. 53Implications for the Global Sector of China’s Rise
§ If forecasts for outsize GDP growth in China in the decades ahead hold true it is
highly likely that the China market will not only come to rival that of the United
States but also outstrip the entire pharmaceutical sector in Europe.
§ As already discussed, the European sector has increasingly been saddled by severe
price controls – reflecting structural fiscal issues in the EU. By hampering GDP
growth, Europe’s sector will collectively become increasingly less relevant in the
global pharmaceutical sector.
§ Japan is also destined to become a less relevant pharmaceutical marketplace in time
given its slower GDP growth.
§ The implications for the sector are obvious. Just as other sectors such as film have
begun to tilt their product towards the taste of Chinese consumers, we will
increasingly see the pharmaceutical industry address diseases which are particularly
prevalent in China such as liver fibrosis, hepatitis, gastric cancer, etc.
54Innovations in
6. Inflammation Control,
What Innovations Nucleic Acids and
Implantables Will
Could Change the
Pharma Sector in
the Future?
Transform Industry
55First Innovation
Better Manufacture Will
Facilitate Dramatic Growth in
Peptide Therapeutics
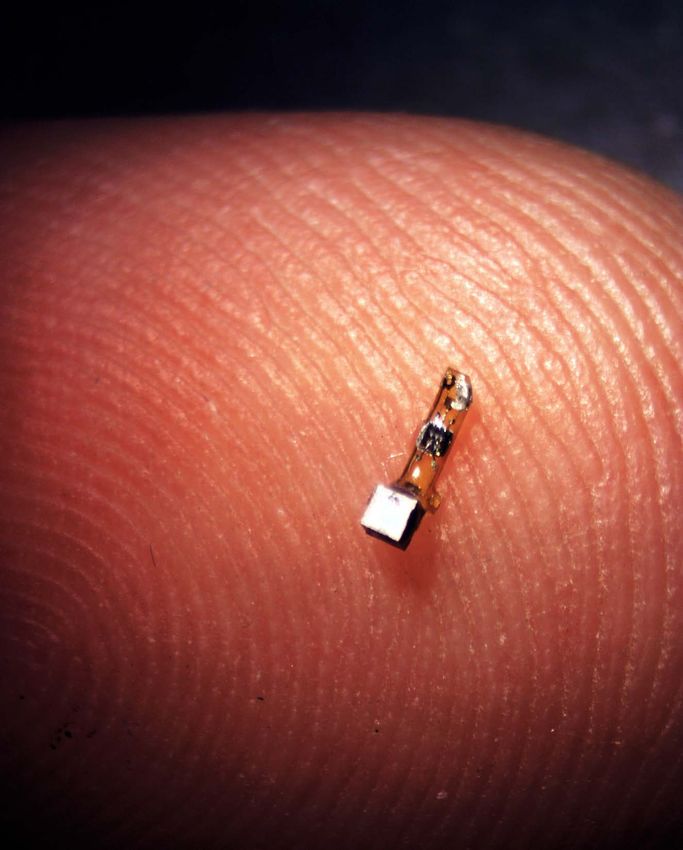
56Peptides Today Come From Nature, Recombinant
Methods or Solid State Synthesis
Peptide
Manufacture
Today
“Peptide manufacturing can be achieved entirely through chemical synthesis, either in the solution
phase (top left), coupled to a solid phase (top right) or by the combination of both. Alternatively, peptides
can be produced by recombinant microorganisms (bottom left) or by extraction from their natural
(plants or animal) source.”
Source: Uhlig, et.al, “The emergence of peptides in the pharmaceutical business: From
exploration to exploitation,” EuPA Open Proteomics, Sep 2014.Peptides Will be Increasingly Important in the
Pharmaceuticals
1 2 3
Today, the peptide However, the challenge Manufacturing is
market is around $20 is that new peptides are especially difficult for
billion. In the future this longer and much more long peptides where
market will likely double difficult to make with impurities from SPS are
or triple. Solid State Synthesis or show stoppers.
recombinant methods.
58Manufacturing Innovation is Going to Change This Field
1 2
Enzymatic Synthesis of Better Recombinant
Peptides Production and
Processing
59A Company to Watch
Has patented methods for using enzymes to dramatically reduce the
cost and complexity associated with manufacture of long peptides.
A major innovation given the primacy of solid state synthesis and
recombinant manufacture in today’s peptide market.
New generations of peptides such as Semaglutide will be far easier and
cheaper to make in the future.
60Second
Innovation
Control of Inflammation May
Substantially Reduce Mortality
from Cancer & Heart Disease
61Inflammation Hypothesized by Dr. Paul Ridker to be a
Key Cause of Heart Attacks
Inflammation is a Key Hallmark of Atherosclerosis, Potentially Leading to
Heart Attacks and Death from Heart Disease. This motivated the Novartis
CANTOS study, which looked at whether IL-1beta blockade with
Canakinumab reduced the risk of cardiac events.
62CANTOS Study Results
1. Substantial improvement in heart disease observed in persons treated
with an IL-1beta antibody (Canakinumab). MACE (primary endpoint) was
reduced by 15% over the 3.7 year median follow-up period.
2. A dose dependent reduction in cancer was seen in those persons treated
with Canakinumab over four years.
3. At the highest dose in the trial (300mg Canakinumab), there was a 51%
reduction in all cancer mortality versus placebo.
4. At the highest dose in the trial (300mg Canakinumab), there was a 77%
reduction in lung cancer mortality versus placebo.
Source: Novartis Website, August 2017.
63Comments on the CANTOS Results
1. These are profound results with implications for the world population
(heart disease and cancer are the two leading causes of mortality
worldwide).
2. Novartis sponsorship of the trial carried out in collaboration with Dr.
Ridker and others represents the first large-scale validation that control
of inflammation can reduce cancer.
3. Novartis is likely to pursue approval of Canakinumab for cardiovascular
disease prevention and cancer prevention.
4. The findings of this trial creates an important research agenda for
companies focused on science and biologics as there is clearly much
more to learn about the potential for inflammation control to impact
cancer and heart disease.
64Third Innovation
Nucleic Acid Therapeutics Will
Grow the Pharmaceutical Field
65Nucleic Acids Are Increasingly Being Developed as
Therapeutics
Our genes (DNA or deoxyribonucleic
acid) regulate protein expression which Three Exciting Young Companies
affects all aspects of our body through
transcription of gene factors that are Using RNAi to prevent
regulated by RNA (ribonucleic acid) and, transcription of
disease-causing
ultimately, messenger RNA (mRNA). proteins
Using CRISPR-cas9
We refer to the class of companies gene editing to
working with DNA delivery, DNA conquer disease
modification (gene editing, gene
therapy) and modified RNA/mRNA as
Delivering mRNA
being involved in Nucleic Acid directly as a drug
Therapeutics.
Some of the most exciting young
biotech companies worldwide are in the
field of nucleic acid therapeutics,
66Some Innovators in this Field
Sep 20, 2017 - The APOLLO trial enrolled 225 hATTR Liver cirrhosis, as well as fibrosis in other organs,
amyloidosis patients with polyneuropathy, involves the formation of excess connective tissue.
representing 39 genotypes, at 44 study sites in 19 This process results in permanently scarred organs.
countries around the world. Patients were randomized Collagen is the key constituent of this excess
2:1 to patisiran or placebo, with patisiran administered connective tissue and in the liver the collagen is
intravenously at 0.3 mg/kg once every three weeks for synthesized by hepatic stellate cells.
18 months. For both the mNIS+7 and Norfolk QOL-DN
endpoint measures provided below, a lower score BMS/Nitto Denko are developing a drug for the
indicates a better clinical result. treatment of fibrotic diseases of the liver and of
other organs. The first clinical indication being tested
At 18 months, the mean change from baseline in is liver cirrhosis. Phase 1 clinical trials using ND L02-
mNIS+7 was significantly lower in the patisiran group as s0201, an siRNA lipid nanoparticle which targets
compared with placebo (p less than 0.00001). hepatic stellate cells showed direct reduction of
The mean and median changes in mNIS+7 impairment collagen production from liver cells in man.
scores for patisiran both achieved negative values,
indicating an improvement overall and in the majority There is a $20 billion market opportunity
of patients compared with baseline. for the first company to cure liver fibrosis
and cirrhosis.
67The Promising of Gene Editing
In theory, a gene therapy product could produce a one time correction of a genetic
mutation which would mean that a disease would not require additional treatment.
This is medically important but also of high economic interest given the cost burden
of chronic patients with long-term pharmaceutical treatments.
Gene editing is a particularly promising approach to gene therapy. CRISPR /Cas9
genome editing can target virtually any gene location where there is a mutation that
is the cause of a disease. CRISPR-Cas9 editing leverages the complex of nuclease
protein and RNA guides to reprogram nuclease.
The first CRISPR products are now in clinical testing and appear to have high
potential. It is also possible to edit large populations of mutated cells, with the result
that edited cells can ultimately grow over time and overcome the burden of a
mutation.
68The Relevance of Next Generation Gene Sequencing
Genetically targeted drugs are not helpful if genetic mutations are not found in the
first place.
Thanks to the introduction of rapid gene sequencing and, now, the advent of next
generation sequencing (NGS) machines, it has become practical to sequence the
genes of the broader population. Companies such as 23&Me are growing rapidly in
the consumer genomics space and there is high growth taking place worldwide in the
field of prenatal gene sequencing.
We expect substantial volume of NGS-guided medications to come to market in the
decades ahead, including genetic marker-based drug choice, genetic background-
guided disease care protocols, etc, which will lead to precision medicine and
subsequent cost containment (by sparing waste of drug consumption).
Key companies that are driving NGS-guided medicine include Foundation Medicine
(part of Roche) and Ambry (part of Konica Minolta).
69Fourth
Innovation
Cell Therapy is Becoming
Mainstream in the
Pharmaceutical Industry
70The Growing Importance of Cell Therapy
§ Cell therapy involves injection of cellular material into a patient for
therapeutic benefit.
§ Cell therapies have been approved clinical for many years. Genzyme
pioneered Carticel for knees and Epicel for burns in the 1990s.
§ Today, hundreds of cell therapy products are in clinical testing and the
expected market for these products is likely to grow dramatically over the
next decade.
§ Key players in cell therapy today include Adaptimmune, Asterias,
bluebird, Celgene, Cellectis, Kite, Mesoblast, Novartis, Osiris, Smith &
Nephew, Tigenix and Vericel.
§ There are hundreds of emerging companies that are making major
investments to build a business in this field.
§ Not so long ago, cell therapy was viewed as having little to do with the
pharmaceutical industry. Today, attitudes have changed substantially.
71The Growing Importance of Cell Therapy in Cancer
§ With CAR-T being the first meaningful achievement, more T-cell
mediated target therapy will follow as disease/marker specific cell-based
modality particularly for end stage cancer and other life-threatening
conditions.
§ Companies to look at in this area are Adaptimmune (with GSK), Noile
Immune (with Takeda) and a future comer, Neon.
§ TCR technologies are rapidly maturing and companies like Adaptimmune,
Kite and Lion Bio have meaningful libraries of TCRs.
§ We expect this area of pharmaceutical drug development to grow rapidly
in the next decade.
§ Several groups such as Aleta Biotherapeutics are working to extend CAR-
T cancer treatments to solid tumors.
72Market Potential Helped by Positive Statutes in Japan
and Europe
“Cell therapy is the fastest growing “Current regenerative medicine market is worth
segment of regenerative medicine. $18.9 billion globally, and will hit over $53 billion by
2021
Cell therapy is comprised of immune
cell therapy and stem cell therapy, According to the [Research and Markets] report
with stem cell therapy making up the ‘due to the dominance of the bone and joint
largest part of this market; it is reconstruction market, the US currently has the
estimated that the global stem cell biggest space, followed by Europe. However, due to
therapy market will reach $40 billion recent positive legislation in Japan and Europe, the
by 2020 and $180 billion by 2030.” stem cell arena will grow more substantially in these
regions over the next five years. By 2021, it is
possible that Europe will surpass the US market with
Frost & Sullivan, “The New Age of
respect to stem cell applications, and this will
Regenerative Medicine – Why Stem become more likely if the Trump Administration
Cell Therapy” restricts legislation and funding.”
Research and Markets, “Global $53 Billion Regenerative
Medicine Market Analysis & Forecast Report 2017-2021:
Focus on Stem Cells, Tissue Engineering, BioBanking &
CAR-T Industries,” May 2017
73You can also read