The economic burden of epilepsy in Australia, 2019-2020 Epilepsy Australia
←
→
Page content transcription
If your browser does not render page correctly, please read the page content below
The economic burden of epilepsy in Australia, 2019-2020

The economic burden of epilepsy
in Australia, 2019-2020
Epilepsy Australia
February 2020

 1
Contents
Glossary i

Executive summary 1

 Background 1
 Prevalence and incidence 1
 Cost of epilepsy in 2019-20 3
 Lifetime costs of epilepsy 3

1 Epidemiology of epilepsy in Australia 5

 1.1 Defining epilepsy 5
 1.1.2 Focal seizures 6
 1.1.3 Primary generalised seizures 6
 1.1.4 Risk factors of epilepsy 7
 1.1.5 Risk factors for seizures 8
 1.2 Epilepsy treatment 8

2 Prevalence and incidence of epilepsy 9

 2.1 Prevalence of epilepsy 9
 2.2 Incidence of epilepsy 11
 2.3 Epilepsy-related mortality 12

3 Health costs of epilepsy 14

 3.1 Hospital inpatient costs 14
 3.2 Hospital outpatient costs 15
 3.3 General practitioner costs 15
 3.4 Pathology and imaging costs 16
 3.5 Medication costs 17
 3.6 Research costs 17
 3.7 Summary - Health system costs 17

4 Other financial costs 20

 4.1 Productivity 20
 4.1.1 Absenteeism 20
 4.1.2 Reduced workforce participation 21
 4.1.3 Productivity loss from premature mortality 22
 4.2 Informal care costs 22
 4.3 Equipment costs 24
 4.4 Transport costs 25
 4.5 Deadweight loss 26
 4.5.1 Welfare payments for individuals with epilepsy (DSP) 26
 4.5.2 Welfare payments for individuals with epilepsy (NDIS) 26
 4.5.3 Welfare payments for carers 27
 4.5.4 Deadweight losses from welfare payments 27
 4.5.5 Deadweight loss of taxation payments and administration 28
 4.6 Summary – Other financial costs 30

5 Burden of disease 32
5.1 Methodology 32
 5.2 Disability and mortality for epilepsy and attributable health conditions 32
 5.2.1 Disability and mortality for epilepsy 32
 5.2.2 Disability and mortality for attributable health conditions 34
 5.3 Converting DALYs to costs 35
 5.4 Summary – Burden of disease 35

6 Summary of costs 36

 6.1 Annual cost of epilepsy in 2019-20 36
 6.2 Lifetime cost of epilepsy 37

References 39

Appendix A – Health costs 44

Appendix B – Population attributable fractions 48

 B.1. Methodology 48
 B.2. Depression and anxiety 49
 B.3. Fractures 49
 B.4. Motor vehicle accidents 49
 B.5. Cardiovascular disease 50
 B.6. Sleep disorders 50
 B.7. Neurodevelopment disorders 50
 B.7.1. Attention deficit hyperactivity disorder 50
 B.7.2. Autism 51
 B.7.3. Cerebral palsy and intellectual disability 51
 B.8. Migraine 51
 B.9. Summary of PAFs 52

Limitation of our work 53

 General use restriction 53

Tables
Table i : Prevalence of epilepsy in Australia by jurisdiction, 2019-20 .......................................... 2
Table ii : Total annual costs associated with epilepsy, Australia 2019-20..................................... 3
Table iii : Total lifetime costs associated with epilepsy, Australia 2019-20 ................................... 4
 : Prevalence of epilepsy in Australia by age and gender, 2019-20 .............................. 10
 : Prevalence of epilepsy in Australia by jurisdiction, 2019-20 .................................... 11
 : International literature for incidence and prevalence of epilepsy .............................. 12
 : Estimated incidence of epilepsy by age and gender in Australia, 2019-20 ................. 12
 : Estimated hospitalisation costs, 2019-20 .............................................................. 15
 : Estimated outpatient costs related to epilepsy, 2019-20 ......................................... 15
 : Estimated GP costs related to epilepsy treatment, 2019-20 .................................... 16
 : Estimated pathology and imaging costs related to epilepsy (non-hospital), 2019-
20.................................................................................................................................... 16
 : Estimated pharmaceutical costs related to epilepsy, 2019-20 .................................. 17
 : Estimated health care expenditure on epilepsy by component , 2019-20 .................. 18
 : Proportion of healthcare costs of epilepsy by cost bearer, 2019-20 .......................... 18
: Employment rates (UK) in the general population and for individuals with epilepsy .... 22
 : Productivity cost breakdown ($ million), 2019-20 .................................................. 22
 : Informal care costs ($ million), 2019-20............................................................... 24
 : Estimated equipment and devices costs, 2019-20 .................................................. 24
 : Equipment cost breakdown ($ million), 2019-20.................................................... 25
 : Estimated transport costs, 2019-20 ..................................................................... 25
 : Transport cost breakdown ($ million), 2019-20 ..................................................... 25
 : Estimated annual deadweight loss from welfare payments, 2019-20 ........................ 28
 : Estimated lifetime deadweight losses from welfare payments, new cases in 2019-
20.................................................................................................................................... 28
 : Estimated annual deadweight losses from health system expenditure, 2019-20 ....... 29
 : Estimated lifetime deadweight losses from health system expenditure, new
cases in 2019-20 ............................................................................................................... 30
 : Estimated annual deadweight losses from lost taxation, 2019-20 ........................... 30
 : Estimated lifetime deadweight losses from lost taxation, new cases in 2019-20 ....... 30
 : Summary of other financial costs, 2019-20 ......................................................... 31
 : Proportion of other financial costs of epilepsy by cost bearer, annual and lifetime
2019-20 ........................................................................................................................... 31
 : Disability weights for epilepsy ............................................................................. 33
 : Estimated prevalence, YLDs and YLLs for epilepsy and attributable health
conditions ......................................................................................................................... 35
 : Summary of burden of disease, 2019-20 .............................................................. 35
 : Total annual costs associated with epilepsy in Australia 2019-20 ............................. 36
 : Total annual cost of epilepsy, by state and territory, 2019-20 ................................. 37
 : Total lifetime costs associated with new epilepsy cases in Australia in 2019-20 ......... 38
 : Total lifetime cost of epilepsy, by State and Territory ............................................. 38
Table A.1 : Estimated number of hospital separations related to epilepsy by jurisdiction,
2019-20 ........................................................................................................................... 44
Table A.2 : Estimated hospitalisation costs by jurisdiction, 2019-20 ......................................... 44
Table A.3 : Estimated outpatient costs related to epilepsy by jurisdiction, 2019-20 .................... 45
Table A.4 : Estimated GP costs related to epilepsy treatment by jurisdiction, 2019-20................ 45
Table A.5 : Estimated pathology and imaging costs related to epilepsy (non-hospital), 2019-
20.................................................................................................................................... 46
Table A.6 : Estimated pharmaceutical costs related to epilepsy (non-hospital), 2019-20 ............. 46
Table A.7 : Estimated research funding related to epilepsy, 2019-20........................................ 47
Table A.8 : Estimated healthcare expenditure on epilepsy by component, 2019-20 ($
millions) ........................................................................................................................... 47
Table B.1 : Summary of PAFs used in this report ................................................................... 52

Figures
Figure 1.1 : Seizure types and classification 6
Figure 3.1 : Breakdown of annual and lifetime healthcare costs of epilepsy, by cost bearer
(2019-20) 19
Figure 4.1 : Breakdown of annual and lifetime non-health costs of epilepsy, by cost bearer
(2019-20) 31
Acknowledgements
Deloitte Access Economics acknowledges and thanks Epilepsy Australia for commissioning the report
with support from the Australia Epilepsy Community Associations. In particular we would like to thank
the following associations for their contribution:

• Epilepsy Foundation
• Epilepsy WA
• Epilepsy Queensland
• Epilepsy Tasmania
• Epilepsy ACT
• Epilepsy Centre South Australia and the Northern Territory

Disclaimer
Deloitte Access Economics completed this work and released it to Epilepsy Australia in June 2019.
The data used in the report was current at the time the report was released to Epilepsy Australia.
The economic burden of epilepsy in Australia, 2019-2020

Glossary
Acronym Full name

ABC Aberrant Behaviour Checklist
ABS Australian Bureau of Statistics
ADHD Attention deficit hyperactivity disorder
AED Anti-epileptic drug
AELS Australian Epilepsy Longitudinal Survey
AIHW Australian Institute of Health and Welfare
ASD Autism spectrum disorder
AWE Average weekly earnings
CDC Centers for Disease Control and Prevention
DALY Disability adjusted life year
DRE Drug resistant epilepsy
DRG Diagnostic related group
DSP Disability Support Pension
DSS Department of Social Services
EEG Electroencephalogram
GBD Global burden of disease
GEM Geriatric evaluation and management
GP General practitioner
ILAE International League Against Epilepsy
IPHA Independent hospital pricing authority
MVA Motor vehicle accident
MRI Magnetic resonance imaging
NHMRC National Health and Medical Research Council
NSA New start allowance
PAF Population attributable fraction
QALY Quality adjusted life year
OR Odds ratio
OSA Obstructive sleep apnoea
RBS-R Repetitive Behaviour Scale-Revised
RR Relative risk
SDAC Survey of disability, ageing and carers
SKA Sickness allowance
SRS Social Responsiveness Scale
SUDEP Sudden unexpected death in epilepsy
US United States
VSLY Value of statistical life year
The economic burden of epilepsy in Australia, 2019-2020

Acronym Full name
WHO World Health Organisation
YLD Years lost due to disability
YLL Years of life lost
Executive summary
In 2019-20, there will be an estimated 142,740 people living
with active epilepsy in Australia, costing a total of $12.3 billion.
The lifetime costs for the estimated 14,603 new cases per year
is $22.2 billion. Epilepsy doesn’t discriminate, being prevalent
across gender, age and location.

Background
Epilepsy is a serious neurologic condition that carries with it stigma, psychiatric comorbidities and
high economic costs. It is the second most burdensome neurological condition, after dementia,
accounting for 14.6% of the burden of disease of all neurological conditions.1 According to the World
Health Organisation (WHO) epilepsy accounts for over 13 million disability-adjusted life years
(DALYs) and is responsible for more than 0.5% of the global burden of disease (GBD. While epilepsy
is a condition that affects people worldwide, nearly 80% of people living with epilepsy reside in low-
and middle-income countries.2

The causes of epilepsy are complex and vary depending upon the age at which the first seizure is
experienced. Known risk factors include serious head injuries sustained during motor vehicle
accidents, trauma or serious falls; strokes or brain haemorrhages; prolonged oxygen deprivation;
brain infections and abnormalities; tumours; degenerative conditions such as dementia; and genetic
factors. However, in half of all cases, the cause cannot be determined and the individual may never
understand why they suffer from the condition.

For those who live with epilepsy, the condition can be debilitating and have serious adverse effects
on their personal life, ability to maintain employment, and quality of sleep. It may also pose serious
danger to the individual themselves, due to the unpredictable nature of seizure events.

Epilepsy is also associated with a number of comorbidities which can worsen the burden on people
living with the condition, and those who provide care to them. In particular, epilepsy has been found
to increase the likelihood of an individual experiencing depression and anxiety, fractures, motor
vehicle accidents, cardiovascular disease, sleep disorders, neurodevelopmental disorders, and
migraines.

Prevalence and incidence
In Australia, there is approximately a 10% population prevalence of individuals who have experienced
one seizure during their lifetime.3 However, as per the International League Against Epilepsy’s (ILAE)
definition, an individual is only considered to have epilepsy when they experience more than two
seizures more than 24 hours apart.4 By this definition, approximately 3-4% of the Australian
population will develop the condition at some stage in their lives.5

To estimate the burden of epilepsy in Australia in a given year, only active cases of the condition
should be considered. This adjusts the above figure downwards, accounting for cases of epilepsy that
have gone into remission. In this case, the Australian Bureau of Statistics (ABS) 2017-18 National

1
 Australian Institute of Health and Welfare 2016. Australian Burden of Disease Study: Impact and causes of
illness and death in Australia 2011. Australian Burden of Disease Study series no. 3. BOD 4. Canberra: AIHW.
2
 World Health Organisation 2019, Epilepsy: A Public Health Imperative - Summary, Geneva, WHO.
3
 Hauser, W.A., Annegers, J. F., & Rocca, W. A. (1996). Descriptive epidemiology of epilepsy: Contributions of
population-based studies from Rochester, Minnesota. Mayo Clinic Proceedings, 71(6). 576-586
4
 Fisher, R. S., Acevedo, C., Arzimanoglou, A., Bogacz, A., Cross, H., Elger, C. E., Engel, J., Forsgren, L., French,
J. A., Glynn, M., Hesdorffer, D., Lee, B. I., Mathern, G., Moshe, S., Perucca, E., Scheffer, I., Tomson, T., Watanabe,
M., & Wiebe, S. (2014). A practical clinical definition of epilepsy. Epilepsia, 55(4):475-482.
5
 Epilepsy Australia 2018, Epilepsy Explained. Available at: http://www.epilepsyaustralia.net/epilepsy-
explained, accessed March 2019

 1
Health Survey (NHS) estimates that 0.6% of Australians of all ages were estimated to be living with
the condition.

Due to the complex nature of epilepsy and the stigma that surrounds neurological conditions,
accurately estimating the prevalence of epilepsy can be complicated. For example, survey data may
be affected by disclosure bias where respondents don’t feel comfortable reporting that they are living
with epilepsy. It is also possible that some individuals are not aware of their condition, or do not
identify as having epilepsy. This may mean that prevalence is higher than estimated. For example,
the Centers for Disease Control and Prevention (CDC) estimated that 1.2% of the US population were
living with active epilepsy in 2015.6 If a similar figure is applied to the Australian population, the
prevalence of epilepsy may be as high as 250,000. Equally, estimation based on clinical records can
be confounded by misdiagnosis, where rates may vary from 4.6% to as high as 30%.

The NHS contains age and gender specific prevalence rates. These were applied to ABS population
data to estimate the total prevalence of epilepsy in Australia in 2019-20. It was estimated that a
total of 142,740 Australians will be living with active epilepsy during this period, of which 52% are
male and 48% are female. By age group, an estimated 19,196 people aged 0-14 are living with
epilepsy, 93,987 people aged 15-64 and 29,557 people aged over 65.

Furthermore, the number of new cases of epilepsy annually i.e. the incidence of epilepsy, was also
investigated, and based on ratios of incidence to prevalence found in international literature. From
this, the average ratio was calculated to be 0.102. This was applied to the NHS prevalence rates for
each age group and gender to derive an implied incidence. The total estimated annual incidence of
epilepsy is 14,603 new cases. By age group, there are an estimated 1,964 new cases of epilepsy
among those aged 0-14, and 9,615 and 3,024 among those aged 15-64 and those over 65 years,
respectively.

The report also disaggregated overall prevalence estimates and number of new cases by state and
territory (excluding Other Territories as per explanatory note). This is presented in Table i below.

Table i: Prevalence of epilepsy in Australia by jurisdiction, 2019-20

 Number of active Number of new Incidence (%)
State and territory Prevalence (%)
 cases (total) cases (total)

NSW 45,634 0.56 4,669 0.057

VIC 36,775 0.55 3,762 0.057

QLD 28,740 0.56 2,940 0.058

WA 14,727 0.56 1,507 0.057

SA 10,044 0.57 1,028 0.059

TAS 3,110 0.58 318 0.060

ACT 2,344 0.54 240 0.056

NT 1,339 0.53 137 0.054

Other territories^ 28 0.60 2 0.043

National 142,740 0.56 14,603 0.057

Source: Deloitte Access Economics estimates based on ABS 4364.0.55.001 - National Health Survey:
First Results 2017-18 (2018) and ABS 3222.0 - Population projections, Australia, 2017-2066 (2018)
Note: The prevalence differs by state due to the age and gender profiles of the various jurisdictions.

^Note: ABS population projections for Australia include Other Territories, comprising of Christmas Island,
Cocos Islands, Jervis Bay Territory and Norfolk Island. While the 28 cases attributable to these territories
are included in the Australia-wide estimates, they are not recognised for the purposes of the jurisdiction
breakdown.

6
 Zack, M. M., & Kobau, R. (2017). National and state estimates of the numbers of adults and children with
active epilepsy - United States, 2015. Morbidity and Mortality Weekly Report, 66(31): 821-825.

 2
Cost of epilepsy in 2019-20
The total annual cost of epilepsy in 2019-20 was $12.3 billion, as summarised in Table ii below.
Financial costs associated with epilepsy were estimated to be $4.2 billion for this year. Financial costs
include costs related to health care, productivity loss, informal caring, equipment, transportation and
deadweight losses.

The largest contributor to financial costs are productivity costs, which account for $2.3 billion of the
total (see costs presented in Table ii below). There are also significant costs to the healthcare system
related to treatment, which account for $557.1 million of total financial costs. Informal care costs for
those with epilepsy were estimated as $438.2 million in 2019-20, while other financial costs, such
as equipment and transport, account for $8.6 million and $9.9 million, respectively. Deadweight
efficiency losses from government payments and taxation forgone were $821.6 million.

In addition to the financial costs, the burden of the disease, resulting in loss of wellbeing, was
estimated to cost Australia $8.2 billion in 2019-20 based on the value of a statistical life year (VSLY)
and the disability adjusted life years (DALYs) lost due to the condition.

Table ii: Total annual costs associated with epilepsy, Australia 2019-20

Cost component Annual cost ($m)

Health system 557.1

Productivity 2,326.6

Informal care 438.2

Equipment 8.6

Transport 9.9

Deadweight losses 821.6

Total financial costs 4,162.0

Loss of wellbeing (non-financial) 8,172.2

Total costs (financial and non-financial) 12,334.2

Source: Deloitte Access Economics estimates

These estimated costs are comparable to many other health conditions, demonstrating the
significance of epilepsy in terms of its annual burden in Australia. For example, epilepsy is estimated
to impose a greater burden on Australia’s health system than prostate cancer ($0.5 billion) and a
burden similar to that of lung cancer ($0.6 billion).7

Furthermore, the estimated burden of disease of epilepsy is comparable to that of Parkinson’s
disease. In 2011, it was found that the burden of disease of this common neurological condition was
$7.6 billion. This equates to approximately $8.8 billion when inflated to 2019;8 the equivalent figure
for epilepsy is $8.2 billion, as per Table ii.

Lifetime costs of epilepsy
In total, the lifetime cost for the 14,603 new cases of epilepsy in Australia in 2019-20 is $22.2 billion,
as summarised in Table iii below. Total lifetime financial costs of new epilepsy cases in Australia in
2019-20 are $7.1 billion, while non-financial costs are $15.1 billion.

7
 Cancer Council 2019, Cancer costs Australian health services over $6 billion a year: new research, available
at: https://www.cancercouncil.com.au/media-release/cancer-costs-australian-health-services-6-billion-year-
new-research/, accessed April 2019.
8
 Deloitte Access Economics 2011, Living with Parkinson’s disease - update, available at:
https://www2.deloitte.com/au/en/pages/economics/articles/living-with-parkinsons-disease.html, accessed April
2019.

 3
The largest financial cost component was again the productivity losses stemming from disruption of
individuals’ productivity. This amounts to an estimated $4.1 billion.

Table iii: Total lifetime costs associated with epilepsy, Australia 2019-20

Cost component Lifetime cost ($m)

Health system 897.6

Productivity 4,086.6

Informal care 598.8

Equipment 6.7

Transport 20.8

Deadweight losses 1,517.2

Total financial costs 7,127.7

Loss of wellbeing (non-financial) 15,094.7

Total costs 22,222.4

Source: Deloitte Access Economics estimates

Deloitte Access Economics

 4
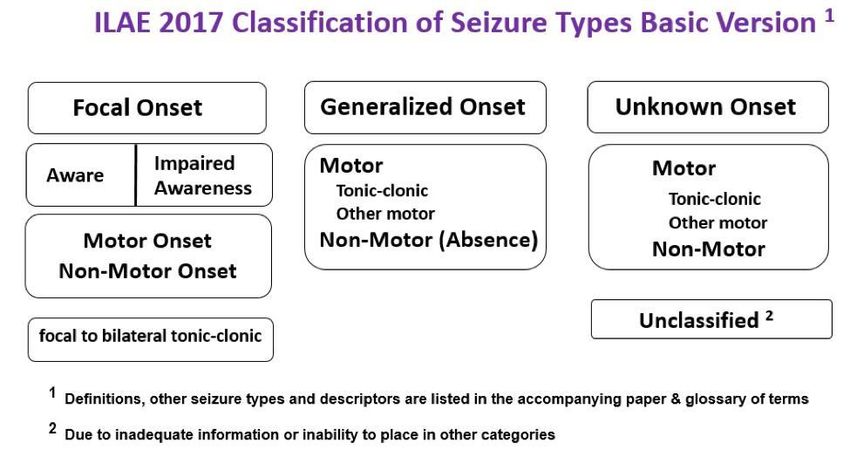
1 Epidemiology of epilepsy in
 Australia
Epilepsy is a serious neurologic condition that carries with it stigma, psychiatric comorbidities and high
economic costs. It is defined as a disorder of brain function that takes form of recurring convulsive or
non-convulsive seizures.9 The condition affects people of all ages and, although treatable, often
requires lifelong medication. Approximately 30% of all cases will not respond to medication,
necessitating surgery or vagus nerve stimulation (VNS) as part of the treatment.10 This can incur
significant costs related to the healthcare system through inpatient and outpatient hospitalisation,
research, medication, and out-of-hospital costs.

However, the burden extends beyond these health-related costs. Epilepsy may also reduce
employment and lower productivity, and incur deadweight losses associated with reduced income and
increased government welfare payments. This, along with the aforementioned health system costs,
can place a significant burden on the individual, their carers, and society as a whole.

1.1 Defining epilepsy
Epilepsy is an umbrella term for a diverse family of disorders that comprise many seizure types and
frequency. As such, epilepsy may be defined in several ways. However, the International League
Against Epilepsy (ILAE) classifies epilepsy as a disease of the brain that can be defined by the presence
of any of the following conditions:11

1. At least two unprovoked (or reflex) seizures occurring > 24 hours apart.
2. One unprovoked (or reflex) seizure and a probability of further seizures similar to the general
 recurrence risk (at least 60%) after two unprovoked seizures, occurring over the next 10 years.
3. Diagnosis of an epilepsy syndrome.

Around the world, approximately 50 million people are living with the condition, making it one of the
most common neurological diseases globally.12 The aetiology of epilepsy is multifactorial and varies
by the individual, ranging from idiopathic to genetic to post-stroke.13 For people who suffer from
epilepsy, seizures can be triggered by infections, excess caffeine or alcohol consumption, and bright
lights or drugs, among others.14 While epilepsy conditions can be categorised into a number of
syndromes, they generally fall into two broad categories: primary generalised or focal (shown in Figure
1.1).15

9
 Epilepsy Australia 2018, Epilepsy Explained: What is epilepsy? Available at:
http://www.epilepsyaustralia.net/epilepsy-explained/, accessed March 2019.
10
 Ibid
11
 Fisher, R. S., Acevedo, C., Arzimanoglou, A., Bogacz, A., Cross, H., Elger, C. E., Engel, J., Forsgren, L., French,
J. A., Glynn, M., Hesdorffer, D., Lee, B. I., Mathern, G., Moshe, S., Perucca, E., Scheffer, I., Tomson, T., Watanabe,
M., & Wiebe, S. (2014). A practical clinical definition of epilepsy. Epilepsia, 55(4):475-482.
12
 World Health Organisation 2019, Epilepsy: A Public Health Imperative - Summary, Geneva, WHO.
13
 Nevalainen, O., Ansakorpi, H., Simola, M., Raitanen, J., Isojarvi, J., Artama, M., & Auvinen, A. (2014). Epilepsy-
related clinical characteristics and mortality: a systematic review and meta-analysis. Neurology. 82(21):1968-77.
14
 Epilepsy Australia 2018, Epilepsy Explained. Available at: http://www.epilepsyaustralia.net/epilepsy-explained/,
accessed February 2019.
15
 Ibid

 5
Figure 1.1: Seizure types and classification

Source: Epilepsy Australia, 2019

1.1.2 Focal seizures
As shown in Figure 1.1, focal seizures originate in a specific section of the brain. As such, the effect
of the seizure is limited to the parts of the body controlled by that part of the brain. However, this
means that symptoms can vary significantly depending on the function that the focal point is
associated with or controls. For example, a person may notice involuntary movement or stiffening of
a limb, feelings of déjà vu, unpleasant smells or tastes, or sensations in the stomach such as nausea. 16

People’s level of consciousness during focal seizures can also vary. In some cases, the individual will
remain completely alert throughout and remember the event, while others can see the individual enter
a dyscognitive state. These distinctions between focal seizures were previously termed simple partial
seizures and complex partial seizures, respectively. While in the former the individual is likely to be
responsive and aware of what is occurring, people suffering the latter are generally unaware, and may
appear confused and/or perform strange and repetitive actions.17

These seizures typically last no longer than two minutes, however the individual may remain in a state
of confusion for minutes or even hours afterwards. The person may also have no memory of the
seizure itself or the events immediately before or after the seizure. In certain cases, focal seizures
may develop into secondary generalised seizures, a further type of seizure similar to primary
generalised but only develop after a focal seizure has occurred. These secondary events tend to occur
in more than 30% of people who experience focal seizures.

1.1.3 Primary generalised seizures
In contrast to focal seizures, primary generalised seizures involve the entire brain and, therefore,
symptoms can affect the entire body. However, they can take form of either convulsive (motor) or
non-convulsive (non-motor), as per Figure 1.1 above. Symptoms associated with primary generalised
seizures range from the impairment of the person’s responsiveness and awareness, generally lasting
no longer than 10 seconds, to full-body convulsions and loss of consciousness lasting many minutes.18

At the less severe end of the spectrum are ‘absence seizures’. These seizures do not involve a motor
response, and may even be difficult to discern from daydreaming. However, they can be particularly
disruptive to day-to-day life owing to their sudden onset, the inability to be interrupted, and the
frequency at which they can occur.19 ‘Myoclonic seizures’ are quite similar to absence seizures in

16
 Epilepsy Foundation 2018. Types of seizures. Available at: https://www.epilepsy.com/learn/types-seizures,
accessed March 2019.
17
 Ibid.
18
 Ibid.
19
 Ibid.

 6
duration, however they involve a motor response. This takes the form of brief jerks to a muscle or
group of muscles, either in a single, isolated event, or repeated many times rapidly. 20

Other generalised seizure types may elicit a more severe motor response. For example, full-body
convulsive seizures are associated with ‘atonic’, ‘tonic’ and ‘tonic-clonic’ seizures, and can vary
significantly in terms of duration, level of consciousness and/or type of convulsions. Atonic seizures
generally occur during the day and affect the individual’s muscle tone, causing them to collapse to the
ground. While tonic seizures are similar in nature, they typically occur during sleep and cause the
body, arms and/or legs to stiffen. In both cases, the individual tends to retain consciousness, however
atonic events carry a heightened level of injury risk due to the time of day at which they occur.21

The most serious type of primary generalised seizure is termed ‘tonic-clonic’. Each event typically lasts
for one to three minutes but can last - either individually or in a series of seizures - over 30 minutes.
During these seizures, the individual’s body stiffens and they collapse to the ground. While these
events generally stop after a few minutes, confusion and drowsiness can last for a number of hours,
making this the most debilitating form of epilepsy.22

Tonic-clonic seizures are also the most likely to cause serious harm to the individual. While they
generally last one the three minutes, events lasting longer than five minutes are not uncommon and
require immediate medical attention. The most severe cases (e.g. lasting longer than 5 minutes)
indicate a dangerous condition called status epilepticus, a condition that requires emergency attention
in hospital.23 While the seizure itself is unlikely to cause serious harm to the individual, injuries can
occur while collapsing and also due to the person biting their tongue or cheek. Furthermore, these
seizures are a common risk factor for sudden unexplained death in epilepsy (SUDEP), which is
discussed further in Section 2.3.

1.1.4 Risk factors of epilepsy
Epilepsy is a common neurological condition that can develop at any stage in the life course,
irrespective of gender or ethnicity. In fact, research suggests that approximately 3-4% of the
Australian population will develop epilepsy at some stage in their lives.24 The causes of epilepsy are
complex and vary depending upon the age at which the first seizure is experienced. However, in half
of all cases, the cause cannot be determined and the individual may never understand why they suffer
from the condition.25

Notwithstanding this uncertainty surrounding many cases, several known risk factors do exist. These
include:26

• Head injury such as in a car accident, trauma or serious fall.
• Stroke or brain haemorrhage.
• A lack of oxygen to the brain for a prolonged period (such as in birth trauma, cardiac arrest,
 drowning, drug overdose).
• Brain infections (for example, meningitis, encephalitis or brain abscess).
• Brain abnormalities or malformations, particularly during childhood.
• Brain tumours, an uncommon cause in children but more common in adults and the elderly.
• Genetic factors, such as having a parent with epilepsy.
• Degenerative conditions affecting the brain (such as dementia or Alzheimer’s disease).

20
 Epilepsy Foundation 2018, Myoclonic seizures. Available at: https://www.epilepsy.com/learn/types-
seizures/myoclonic-seizures, accessed March 2019.
21
 Epilepsy Australia 2018, Epilepsy explained. Available at: http://www.epilepsyaustralia.net/epilepsy-
explained/, accessed March 2019.
22
 Ibid.
23
 Epilepsy Foundation 2018, Tonic-clonic seizures. Available at: https://www.epilepsy.com/learn/types-
seizures/tonic-clonic-seizures, accessed March 2019
24
 Epilepsy Australia 2018, Epilepsy explained: Who gets epilepsy? Available at:
http://www.epilepsyaustralia.net/epilepsy-explained/, accessed March 2019.
25
 Ibid.
26
 Ibid.

 7
1.1.5 Risk factors for seizures
In addition to the risk factors for having a first seizure and being diagnosed with epilepsy, there are a
range of factors associated with seizure occurrence in people who are epileptic. For these individuals
who already suffer from epilepsy, triggers may include:27

• Alcohol consumption, due to interaction with medications.
• Dietary factors, such as high levels of caffeine.
• Infections or illness, particularly in children.
• Sleep deprivation, especially due to large fluctuations in one’s sleep pattern.
• Medication adherence, or lack thereof.
• Use of other medications or recreational drugs.
• Photosensitivity, severe temperature changes and high stress levels for certain individuals.

It has also been noted in the literature that Indigenous Australians face disproportionately high rates
of seizure-related hospital admissions compared to non-indigenous.28 Between 1998 and 2004, the
rate of hospitalisation related to seizures for Indigenous Australians was five times more than the non-
Indigenous rate. Whilst this is not a risk factor in itself, it likely reflects the health inequalities
experienced by Indigenous Australians which results in poor seizure control for those living with
epilepsy.

1.2 Epilepsy treatment
Treatment of epilepsy is dependent on a range of factors, foremost of which is how the condition is
classified. In most cases, antiepileptic medication is used, however the choice of which medication is
dependent upon severity, frequency, side effects and interactions, and other individual characteristics
such as age or gender. Nonetheless, 60-70% of people diagnosed with epilepsy will gain seizure
control through medication alone within a year.29 After two to five years of successful adherence and
being seizure-free, medication can be withdrawn in about 70% of children and 60% of adults without
later relapse.30

However, in some cases epilepsy may be medication-resistant, necessitating the use of alternative
treatments. This may involve surgery, stimulation of the vagus nerve, or, particularly in children, the
ketogenic diet may be recommended.31 Surgery and vagus nerve stimulation are only considered in
cases when medication has failed but can be highly effective at controlling seizures in many cases.
For example, surgery has a high success rate for seizures that are found to be caused by abnormal
brain tissue. Vagus nerve stimulation is generally only considered if the condition has been
unresponsive to medication and other surgical options have been ruled out. This procedure involves
the implant of a stimulator attached to the vagus nerve to deliver intermittent but frequent pulses to
regulate the activity of the vagus nerve.32

In other situations where seizure control is not satisfactory through medication, particularly involving
children, a ketogenic diet may be considered to control seizures. The mechanisms through which this
operates are not yet fully understood, however it has proved effective in many cases. It has proven
to elicit the most beneficial responses from children with mixed myoclonic seizure disorders, however
there have also been reports of success in adults and with other types of epilepsy.33

27
 Epilepsy Australia 2018, Epilepsy Explained. Available at: http://www.epilepsyaustralia.net/epilepsy-explained/,
accessed February 2019.
28
 Plummer, C., Cook, M. J., Anderson, I., & D’Souza, W. (2014). Australia’s seizure divide - indigenous versus
non-indigenous seizure hospitalisation. Epilepsy & Behaviour, 31: 363-368.
29
 Epilepsy Australia 2018, Epilepsy Treatment. Available at: http://www.epilepsyaustralia.net/epilepsy-
treatment/, accessed March 2019.
30
 World Health Organisation 2019, Epilepsy: Treatment. Available at: https://www.who.int/news-room/fact-
sheets/detail/epilepsy, accessed March 2019.
31
 Epilepsy Australia 2018, Epilepsy Treatment. Available at: http://www.epilepsyaustralia.net/epilepsy-
treatment/, accessed March 2019.
32
 Ibid
33
 Ibid

 8
2 Prevalence and incidence
 of epilepsy
2.1 Prevalence of epilepsy
The prevalence of epilepsy refers to the total number of people living with the active condition in a
given time period. Active epilepsy is defined as cases in which the individual is experiencing ongoing
seizures or requires ongoing treatment through medication or alternative methods. 34

In Australia, there is approximately a 10% population prevalence of individuals who have experienced
one seizure during their lifetime. 35 However, by definition, a case is only considered epilepsy when
more than two seizures occur more than 24 hours apart. In these terms, around 3-4% of the
population will develop the condition at some point in their lives. 36 Refining further to only consider
those whose condition is active at any given time results in a population prevalence of approximately
6 persons per 1,000 population in Australia, as estimated by the Australian Bureau of Statistics
(ABS).37

There is a significant body of literature that validates these Australian findings. For example, it was
found that the prevalence of active epilepsy in high-income countries is generally estimated to be
between five and eight per 1,000 persons.38 In comparison, low and middle-income countries are
typically estimated to experience a prevalence of approximately 10 persons per 1,000 population. 39 It
is suggested that this between-country heterogeneity is reflective of economic development and,
specifically, regional risk of infections, differences in antenatal and perinatal care, and overall quality
of and access to healthcare.40 There are also notable differences observed throughout the life course,
and some tenuous evidence of gender based heterogeneity.41

When estimating the prevalence of epilepsy, it should also be noted that there is the possibility of over
or underreporting of the condition. This may occur for a number of reasons, including the following:

• As prevalence estimates are often based on self-reported data, subsets of the population who do
 not fully understanding their condition may incorrectly state that they have the condition without
 diagnosis, or vice versa.
• It may also be the case that some individuals do not feel comfortable reporting their condition
 when responding to surveys due to the social stigma surrounding neurological conditions. This
 ‘disclosure bias’ may mean true prevalence is higher than estimated. For example, the Centers
 for Disease Control and Prevention (CDC) estimated that 1.2% of the US population were living
 with active epilepsy in 2015.42 If a similar figure is applied to the Australian population, the
 prevalence of epilepsy may be as high as 250,000.

34
 World Health Organisation 2019, Epilepsy: Rates of Disease. Available at: https://www.who.int/news-room/fact-
sheets/detail/epilepsy, accessed March 2019.
35
 Hauser, W. A., Annegers, J. F., & Rocca, W. A. (1996). Descriptive epidemiology of epilepsy: Contributions of
population-based studies from Rochester, Minnesota. Mayo Clinic Proceedings, 71(6):576-586.
36
 Bell, G. S., Neligan, A., & Sander, A. W. (2014). An unknown quantity: The worldwide prevalence of epilepsy.
Epilepsia, 55(7):958-962.
37
 Australian Bureau of Statistics 2018, National Health Survey: First Results, 2017-18. Cat. no. 4364.0.55.001.
Canberra, Australia.
38
 Kotsopoulos, I. A., Van Merode, T., Kessels, F. G., De Krom, M. C., & Knottnerus, J. A. (2002). Systematic review
and meta-analysis of incidence studies of epilepsy and unprovoked seizures. Epilepsia, 43(11):1402-1409.
39
 Moshe, S. L., Perucca, E., Ryvlin, P., & Tomson, T. (2014). Epilepsy: new advances. The Lancet, 385(9971):884-
898.
40
 Fiest, K. M., Sauro, K. M., Wiebe, S., Patten, S. B., Kwon, C., Dykeman, J., Pringsheim, T., Lorenzetti, D. L.,
& Jette, N. (2017). Prevalence and incidence of epilepsy: A systematic review and meta-analysis of
international studies. Neurology, 88(3): 296-303.
41
 McHugh, J. C., & Delanty, N. (2008). Epidemiology and classification of epilepsy: gender comparisons.
International Review of Neurobiology, 83: 11-26.
42
 Zack, M. M., & Kobau, R. (2017). National and state estimates of the numbers of adults and children with
active epilepsy - United States, 2015. Morbidity and Mortality Weekly Report, 66(31): 821-825.

 9
• Misdiagnosis of epilepsy by clinicians can also occur. Reported misdiagnosis rates vary
 substantially with estimates drawn from international studies ranging between 4.6% and 30%.43
 Two studies in the United Kingdom purposely designed to assess the prevalence of misdiagnosis
 within the community found that epilepsy was misdiagnosed between 16% and 23% of cases.44,45
 As such, it is also possible that prevalence rates of epilepsy are over-reported.

Overall, the literature suggests that epilepsy is active in between 6 and 7.5 persons per 1,000
population in Australia.46 This figure is consistent with the estimated range for high-income countries
in the literature and more recent estimates released by the ABS, which indicate that there is an overall
population prevalence of active epilepsy of 0.6%.47 These prevalence rates would suggest that
approximately 150,000 Australians are living with active epilepsy. For the modelling in this report, we
develop a more precise estimate using the methods outlined below.

Estimates produced for this report by Deloitte Access Economics are based on National Health Survey
(NHS) data published by the ABS. 48 The NHS was conducted from a sample of approximately 21,300
people in 16,400 private dwellings across Australia between July 2017 and June 2018, and contains a
component which asks whether respondents have epilepsy. These NHS prevalence rate estimates were
applied to ABS population projection data for June 2019 to estimate the total prevalence of epilepsy.

Our estimates indicate that 142,740 people are living with active epilepsy in Australia. This estimate
may be conservative if epilepsy is significantly underreported in self-reported data, however it is also
consistent with a number of existing studies. Table 2.1 below presents this prevalence figure,
disaggregated by applying gender and age-specific rates reported in the NHS.

 : Prevalence of epilepsy in Australia by age and gender, 2019-20

Age Prevalence rate Prevalence Prevalence rate Prevalence Total
group (%, males) (total, males) (%, females) (total, females)

0-14 0.4 9,854 0.4 9,342 19,196
15-24 0.4 6,686 0.4 6,369 13,055
25-34 0.3 5,708 0.1 1,915 7,623
35-44 0.5 8,419 0.8 13,618 22,037
45-54 1.0 15,764 1.0 16,386 32,150
55-64 0.6 8,610 0.7 10,513 19,123
65+ 1.0 18,853 0.5 10,704 29,557
Total 0.59 73,893 0.54 68,847 142,740

Source: Deloitte Access Economics estimates based on ABS 4364.0.55.001 - National Health Survey:
First Results 2017-18 (2018) and ABS 3222.0 - Population projections, Australia, 2017-2066 (2018).
Note: Figures may not sum to total due to rounding.

For the purposes of this report, it is assumed that prevalence rates by age and gender are constant
across states and territories. However, due to differences in population age and gender distributions,
epilepsy is imposing a slightly greater burden in some jurisdictions than in others. Overall, prevalence
is very similar across states and territories, however Tasmania is estimated to have the highest rate

43
 Chowdhury, F. A., Nashef, L., & Elwes, R. D. C. (2008). Misdiagnosis in epilepsy: a review and recognition of
diagnostic uncertainty. European Journal of Neurology, 15(10): 1034-1042.
44
 Scheepers, B., Clough, P. & Pickles, C. (1998). The misdiagnosis of epilepsy: findings of a population study.
Seizure, 7(5): 403-406.
45
 Leach, J. P., Lauder, R., Nicolson, A., & Smith, D. F. (2005) Epilepsy in the UK: misdiagnosis, mistreatment,
and undertreatment?: the Wrexham area epilepsy project. Seizure, 14(7): 514–20.
46
 D’Souza, W. J., Fryer, J. L., Quinn, S. J., Taylor, B. V., Ficker, D. M., O’Brien, T. J., Pearce, N. E., & Cook, M. J.
(2007). The Tasmanian Epilepsy Register - A community-based cohort: background and methodology for patient
recruitment from the Australia national prescription database. Neuroepidemiology, 29:255-263.
47
 Australian Bureau of Statistics 2018, National Health Survey: First Results, 2017-18. Cat. no. 4364.0.55.001.
Canberra, Australia.
48
 Ibid.

 10
(0.59%) while the Northern Territory has the lowest (0.53%). Prevalence by state and territory is
presented in Table 2.2 below.

 : Prevalence of epilepsy in Australia by jurisdiction, 2019-20

Jurisdiction Share of total population (%) Implied prevalence

NSW 31.99 45,634

VIC 25.99 36,775

QLD 20.05 28,740

WA 10.32 14,727

SA 6.87 10,044

TAS 2.09 3,110

ACT 1.69 2,344

NT 0.99 1,339

^Other territories 0.02 28

Total 100 142,740

Source: Deloitte Access Economics estimates based on ABS data (2018). Note: The prevalence differs by
state due to the age and gender profiles of the various jurisdictions.

^Note: ABS population projections for Australia include Other Territories, comprising of Christmas Island,
Cocos Islands, Jervis Bay Territory and Norfolk Island. While the 28 cases attributable to these territories
are included in the Australia-wide estimates, they are not recognised for the purposes of the jurisdiction
breakdown.

2.2 Incidence of epilepsy
The incidence of epilepsy refers to the total number of cases first diagnosed or reported in a given
year. For the purposes of this report, our analysis estimated the total number of cases first diagnosed
or reported in the year 2019-20, and the associated lifetime cost. An underlying assumption is that
each new case of epilepsy is a lifelong condition, with an average life expectancy of 82 years for people
who develop the condition, similar to the overall average life expectation in Australia.49

The observed incidence of epilepsy has been reported to vary in a manner similar to prevalence.
Specifically, it is estimated that the annual incidence is 45 persons per 100,000 population in high-
income countries and 82 in low and middle-income countries.50 For adults, which is generally defined
in the literature to be those aged 20-64, incidence has been estimated as being between 30 and 35
per 100,000 persons per year.51 52

For the purposes of this report, incidence rates for epilepsy in Australia were derived from ratios of
incidence to prevalence rates found in the international literature. The incidence and prevalence rates
reported in each of these studies are outlined in Table 2.3.

49
 The onset of epilepsy was assumed to occur at the midpoint of each age group considered in the economic
modelling section of this report.
50
 Ngugi, A. K., Kariuki, S. M., Bottomley, C., Kleinschmidt, I., Sander, J. W., & Newton, C. R. (2011). Incidence
of epilepsy: a systematic review and meta-analysis. Neurology, 77:1005-1012.
51
 Ibid.
52
 Kotsopoulos, I. A., Van Merode, T., Kessels, F. G., De Krom, M. C., & Knottnerus, J. A. (2002). Systematic review
and meta-analysis of incidence studies of epilepsy and unprovoked seizures. Epilepsia, 43(11):1402-1409.

 11
: International literature for incidence and prevalence of epilepsy

Study Prevalence (per 1,000 Incidence (per 100,000 Ratio of incidence to
 persons) persons) prevalence (per 1,000
 persons)
Fiest et al. (2017) 6.38 61.44 0.096

Helmers et al. (2015) 5.0 64.5 0.129

Christensen et al. (2007) 5.7 68.8 0.121

Hirtz et al. (2007) 7.1 48 0.068

Olafsson et al. (1996, 1999) 4.8 47 0.098

Average 5.8 57.95 0.1023

Source: Deloitte Access Economics estimates based on Fiest et al. (2017), Helmers et al. (2015),
Christensen et al. (2007), Hirtz et al. (2007), Olafsson et al. (1996, 1999), ABS 4364.0.55.001 - National
Health Survey: First Results, 2017-18 (2018) and ABS 3222.0 - Population projections, Australia (2018).

The ratios were calculated as:53

 =
 ×100

From this, the average ratio was calculated to be 0.1023. This was applied to the age and gender
specific prevalence rates to derive the corresponding implied incidence rates. These rates are
reported in Table 2.4 below.

 : Estimated incidence of epilepsy by age and gender in Australia, 2019-20

Age Prevalence Implied Implied Prevalence Implied Implied Incidence
group (%, males) incidence incidence (%, incidence incidence (total)
 (%, males) (total, males) females) (%, females) (total, females)

0-14 0.40 0.04 1,008 0.40 0.04 956 1,964
15-24 0.40 0.04 684 0.40 0.04 652 1,336
25-34 0.30 0.03 584 0.10 0.01 196 780
35-44 0.50 0.05 861 0.80 0.08 1,393 2,254
45-54 1.00 0.10 1,613 1.00 0.10 1,676 3,289
55-64 0.60 0.06 881 0.70 0.07 1,076 1,956
65+ 1.00 0.10 1,929 0.50 0.05 1,095 3,024
Total 0.59 0.06 7,560 0.54 0.05 7,043 14,603

Source: Deloitte Access Economics estimates based on Feist et al. (2017), Helmers et al. (2015),
Christensen et al. (2007), Hirtz et al. (2007), Olafsson et al. (1996, 1999), and ABS 4364.0.55.001 -
National Health Survey: First Results, 2017-18.

2.3 Epilepsy-related mortality
People living with epilepsy have a heightened risk of premature death. This can be due to the condition
itself, but also one or more associated comorbidities. In fact, it is suggested that people living with
epilepsy may have a mortality risk that is two to three times higher than the general population.54
Moreover, the risk of sudden and unexpected death is approximately 24 times higher.55

53
 Prevalence is multiplied 100 as reporting conventions in the literature sees prevalence report per 1,000
persons, while incidence is reported per 100,000 persons.
54
 Gaitatzis, A., & Sander, J. W. (2003). The mortality of epilepsy revisited. Epileptic Discord, 6:3-13.
55
 Ficker, D. M., So, E. L., Shen, W. K., Annegers, J. F., O’Brien, P. C., & Cascino, G. D. (1998). Population-based
study of the incidence of sudden unexplained death in epilepsy. Neurology, 51(5):1270-1274.

 12
The major causes of death for people with epilepsy include:

• accidents
• drowning
• status epilepticus
• suicide
• sudden unexpected death in epilepsy (SUDEP).

The most common cause of epilepsy-related death is SUDEP. This condition is defined as a sudden
and unexpected non-traumatic or non-drowning-related death in a patient with epilepsy that may or
may not be related to a recent seizure.56 Overall, the incidence of SUDEP in the general epilepsy
population has been reported to be as high as 1.2 per 1000 persons per year in the general epilepsy
population.57 Based on the estimated 142,740 people living with epilepsy in Australia, this would
equate to approximately 171 SUDEP-related deaths per year across the general epilepsy population.
These deaths occur in otherwise healthy individuals with epilepsy, generally during or immediately
following a tonic-clonic seizure.

Between 2007 and 2017, the average number of deaths in Australia attributable to epilepsy was 284
per year according to the ABS, however AIHW provides a slightly higher estimate of 322 in 2015.58,59
Assuming a SUDEP rate of 1.2 per 1000 persons, there are more than a 100 epilepsy-related deaths
in Australia per year not attributable to SUDEP. Other factors such as workplace or motor vehicle
accidents, drowning, suicide and status epilepticus account for the majority of the remaining deaths.
In particular, status epilepticus has been responsible for an average of 22, or 7.6%, of the epilepsy-
related deaths per year between 2007 and 2017.60 The reported number deaths attributable to
epilepsy is likely to be underestimated as the number of deaths reflect cases where there is strong
evidence linking the death to epilepsy.

According to AIHW, there were 322 deaths attributable to epilepsy in 2015. The AIHW mortality rate
of 322 was used in the modelling of the report as the figure is disaggregated by age and gender.61
The figure was inflated to 2019-20 using an implied mortality rate and the estimated prevalence of
epilepsy in 2019-20, giving a total number of deaths attributable to epilepsy of 342 in 2019-20.

56
 Nashef, L. (1997). Sudden unexpected death in epilepsy: terminology and definitions. Epilepsia, 38(11):6-8.
57
 Tomson, T., Nashef, L., & Ryvlin, P. (2008). Sudden unexpected death in epilepsy: current knowledge and future
directions. The Lancet Neurology, 7(11):1021-1031.
58
 Australian Bureau of Statistics (ABS). Causes of Death, Australia, 2017. Cat. no. 3303.0. ABS, Canberra, 2018.
59
 AIHW 2018, Australia Burden of Disease Study 2015: Fatal burden preliminary estimates.
60
 Ibid.
61
 Ibid.

 13
3 Health costs of epilepsy
This section estimates the health care costs of epilepsy in Australia. Estimates of direct health system
costs on epilepsy were based on several dataset including the Australian Institute of Health and
Welfare (AIHW) and the Independent Hospital Pricing Authority (IHPA). The study follows a ‘bottom-
up approach’ to estimate expenditure. The health care costs include:

• hospital inpatients and outpatients
• primary medical care by general practitioners
• pathology and imaging
• pharmaceuticals
• research

3.1 Hospital inpatient costs
The total cost of hospitalisation for epilepsy was estimated by multiplying the number of separations
for epilepsy by an estimated average cost of hospitalisation. The number of hospitalisations was
based on separation statistics from the IHPA’s National Hospital Cost Data Collection62 and the
AIHW’s Health Expenditure data63.

AIHW data provides the number of separations in public and private hospitals for acute, sub-acute
and non-acute admissions. The number of separations where the principal diagnosis is epilepsy was
estimated using the number of separations where the Diagnostic Related Group (DRG) was seizures
with and without catastrophic consequences (B76A or B76B respectively). As these DRGs also contain
admissions for fits, seizures and convulsions not specified as epilepsy, it is assumed that 50% of all
hospital separations for seizures have epilepsy as principal diagnosis. This is a conservative
assumption and is based on the ratio outlined in 1.1, that approximately 60% of people who have
one seizure go on to have more seizures, which would be diagnosed as epilepsy64. In 2016-17, 0.55%
of all hospital separations were attributed to major and minor seizures.65 It is assumed that half of
these separations can be attributed to epilepsy.

Table 3.1 below summarises the estimated number of acute, sub-acute and non-acute admissions
for 2019-20 and the associated costs. As the separations are from 2016-17, an annual growth rate
of 4.1% was applied to estimate the 2019-20 separations. This growth rate is based on the historic
five year growth of total hospital separations. Separations by jurisdiction is summarised in
Appendix A.

The average costs per weighted acute, sub-acute and non-acutes separations of $5,444 and $13,997
respectively are sourced from IHPA data, which provides costs by DRG in public hospitals. It is
assumed that the average cost rate is the same for both private and public hospitals. The average
costs are weighted to consider the complexity of each jurisdiction’s work profile. This allows average
costs to be compared between jurisdictions (see Appendix A for average cost by jurisdiction). The
average costs were inflated to 2019-20 values by using the health inflation rate of 1.7 per cent,
based on AIHW hospital expenditure data66.

The acute separation cost components included costs associated with hospital ward, non-clinical,
pathology, imaging, allied health, pharmaceuticals, critical care, operating rooms, admittance
through the emergency department, supplies and others. Sub-acute and non-acute care included
geriatric evaluation and management (GEM), maintenance, palliative care, psychogeriatric and

62
 Independent Hospital Pricing Authority, 2019, National Hospital Cost Data Collection Report, Round 21
(Financial year 2016-17), available from: https://www.ihpa.gov.au/publications/national-hospital-cost-data-
collection-independent-financial-review-round-21-financial
63
 Australian Institute of Health and Welfare, 2018, Health Expenditure Australia 2016-17, available from:
https://www.aihw.gov.au/reports/health-welfare-expenditure/health-expenditure-australia-2016-17/data
64
 Epilepsy Australia, available from: http://www.epilepsyaustralia.net/epilepsy-explained/
65
 Ibid
66
 Australian Institute of Health and Welfare, 2018, Health Expenditure Australia 2016-17, available from:
https://www.aihw.gov.au/getmedia/e8d37b7d-2b52-4662-a85f-01eb176f6844/aihw-hwe-
74.pdf.aspx?inline=true

 14
rehabilitation. The total estimated hospital inpatient costs related to epilepsy for 2019-20 is
$199.4 million.

 : Estimated hospitalisation costs, 2019-20

Component Acute Sub-acute Total
 and non- separations
 acute

Number of separations (number) 31,194 1,804 32,998

Average cost per weighted separation ($), 2019-20 prices 5,444 13,997 -

Total costs ($ million), 2019-20 prices 169.8 29.6 199.4

Source: IPHA (2019) and AIHW (2018). A growth rate of 4.1% annually is applied to project the number
of separations in 2016-17 to 2019-20. A health inflation rate of 1.7% annually is applied to inflate costs
to 2019-20 prices.

3.2 Hospital outpatient costs
Outpatient, or non-admitted events relate to services provided in an outpatient clinic. Services
typically include diagnostic testing, specialised care for complex epilepsy patients, surgical programs
and telehealth services. The number of outpatient events were sourced from IPHA data, which
provides annual non-admitted events and average costs, by jurisdiction. Similar to inpatient costs,
the number of events related to epilepsy was estimated by applying the share of epilepsy related
separations to the total number of events. This results in an estimated 96,838 events related to
epilepsy per year. Total estimated outpatient costs related to epilepsy for 2019-20 were estimated
to be $31.5 million.

 : Estimated outpatient costs related to epilepsy, 2019-20

Component Estimates

Events related to epilepsy (number) 96,838
Average cost ($), 2019-20 prices 325
Total cost ($ million), 2019-20 prices 31.5

Source: IPHA (2019) and AIHW (2018). A growth rate of 4.1% annually is applied to project the number
of events in 2016-17 to 2019-20. A health inflation rate of 1.7% annually is applied to inflate costs to
2019-20 prices.

Note: Non-admitted events was only available for public hospitals. A ratio of 0.7 was applied to estimate
the number of non-admitted events at private hospitals. This was based on the ratio of public to private
hospital separations, IPHA (2019)67.

3.3 General practitioner costs
The estimated costs related to primary care by general practitioners (GP) for people with epilepsy
was $24.9 million in 2019-20. A large share of patients with epilepsy are treated exclusively by their
general practitioner (GP) for seizures and epilepsy. According to D’Souza et al. (2009), 78% of
patients were treated by their GP only in a study on patients with epilepsy in Tasmania. Fewer
patients reported attending hospitals as outpatients or specialists (24.8%). Primary care therefore
makes up an important part of patient treatment. The study also showed that the mean number of
GP visits specifically for treatment of seizures and epilepsy was 3.3 over the previous 12 months of
the survey period68.

The annual number of GP visits for patients with epilepsy was estimated by applying the average
number of visits of 3.3 to the prevalence of epilepsy. This results in 471,043 GP visits per year related
to epilepsy treatment. See Appendix A for breakdown by jurisdiction. The average costs related to

67
 Ibid
68
 Lacey, C., Salzberg, M., Roberts, H., Trauer, T., & D'Souza, 2009, Psychiatric comorbidity and impact on
health service utilization in a community sample of patients with epilepsy, Epilepsia, 50(8): 1991-1994

 15
You can also read


