State of the North East 2019: Cardiovascular disease prevention - GOV.UK
←
→
Page content transcription
If your browser does not render page correctly, please read the page content below
State of the North East 2019: Cardiovascular disease prevention
About Public Health England
Public Health England exists to protect and improve the nation’s health and wellbeing,
and reduce health inequalities. We do this through world-leading science, research,
knowledge and intelligence, advocacy, partnerships and the delivery of specialist public
health services. We are an executive agency of the Department of Health and Social
Care, and a distinct delivery organisation with operational autonomy. We provide
government, local government, the NHS, Parliament, industry and the public with
evidence-based professional, scientific and delivery expertise and support.

Public Health England
Wellington House
133-155 Waterloo Road
London SE1 8UG
Tel: 020 7654 8000
www.gov.uk/phe
Twitter: @PHE_uk
Facebook: www.facebook.com/PublicHealthEngland

Prepared by: Roy Maxwell, Andrew Billett, Louise Unsworth, Anna Christie, Paul
Collingwood, Gillian Bryant.
For queries relating to this document, please contact: Roy Maxwell at
LKISNorthEast@phe.gov.uk

© Crown copyright 2019
You may re-use this information (excluding logos) free of charge in any format or
medium, under the terms of the Open Government Licence v3.0. To view this licence,
visit OGL. Where we have identified any third party copyright information you will need
to obtain permission from the copyright holders concerned.

Published October 2019
PHE publications                               PHE supports the UN
gateway number: GW-769                         Sustainable Development Goals
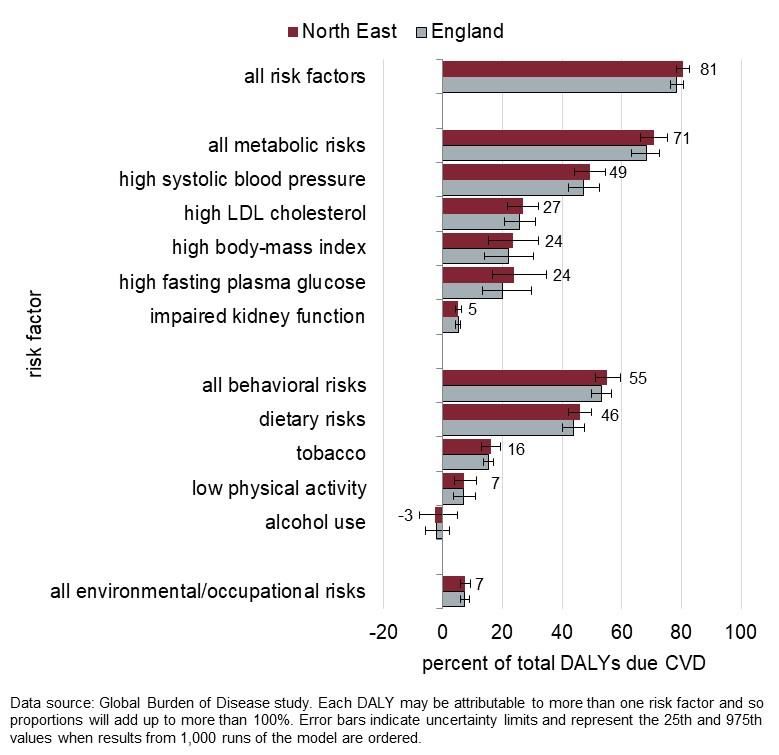
Table of Contents
Foreword ........................................................................................................... 4
Executive summary ........................................................................................... 5
Recommendations ............................................................................................. 7
1. Introduction ................................................................................................. 9
     1.1.    Context ......................................................................................................... 9
     1.2.    Definition ....................................................................................................... 9
     1.3.    Data sources............................................................................................... 10
     1.4.    Scope of the report ..................................................................................... 10
2.     Risk factors ............................................................................................... 11
     2.1.    Attributable risk and the relative importance of risk factors ......................... 11
     2.2.    High blood pressure.................................................................................... 12
     2.3.    Cholesterol ................................................................................................. 14
     2.4.    Obesity ....................................................................................................... 15
     2.5.    Physical inactivity........................................................................................ 18
     2.6.    Diet ............................................................................................................. 20
     2.7.    Smoking ...................................................................................................... 23
     2.8.    Alcohol ........................................................................................................ 26
     2.9.    Air pollution ................................................................................................. 28
     2.10.   Non-diabetic hyperglycaemia (pre-diabetes) .............................................. 32
     2.11.   Diabetes ..................................................................................................... 33
3.     Outcomes.................................................................................................. 37
     3.1.    Introduction ................................................................................................. 37
     3.2.    Coronary heart disease (CHD) ................................................................... 39
     3.3.    Angina ........................................................................................................ 39
     3.4.    Heart failure ................................................................................................ 41
     3.5.    Heart attack ................................................................................................ 42
     3.6.    Atrial fibrillation ........................................................................................... 45
     3.7.    Stroke ......................................................................................................... 47
4.     Interventions ............................................................................................. 50
     4.1.    Introduction ................................................................................................. 50
     4.2.    NHS Health Check programme .................................................................. 50
     4.3.    NHS Stop Smoking Services ...................................................................... 51
     4.4.    NHS Diabetes Prevention Programme ....................................................... 53
     4.5.    Prescribing of statins among people at increased risk of future CVD ......... 53
     4.6.    Hospital-based services .............................................................................. 54
5. Conclusions .............................................................................................. 55
Glossary and abbreviations ............................................................................. 56
References ...................................................................................................... 58

                                                                       3
Foreword
As Centre Director for Public Health England in the North East, I am very aware that
cardiovascular disease (CVD) – heart disease, strokes and related conditions – is one
of the biggest causes of ill health and early deaths in the North East of England. Each
year over 6,700 people die from CVD across the region, which represents one quarter
of all deaths. Two thousand of these people die under the age of 75 years. Many more
have the quality of their lives restricted because they are unable to undertake routine
daily activities without care and support.

This report shows how CVD affects people in the North East. It highlights the factors
that increase the risk of having CVD and shows where in the region and among which
population groups these are most common. It also describes the distribution of ill health
and deaths due to CVD, showing clearly how it has a greater impact on those people
living in socially and economically disadvantaged communities.

Many of the risk factors for CVD – obesity, smoking, physical inactivity, excessive
alcohol consumption and poor diet – are more common in the North East region
compared to England as a whole. There are a range of evidence-based services –
including the NHS Health Check programme, the NHS Diabetes Prevention Programme
and NHS Stop Smoking Services – that aim to identify those at high risk of future CVD
and support them to adopt a healthier lifestyle. There is also a challenge to create a
society and an environment where it is easier to make healthy lifestyle choices. This can
be achieved by building and creating an environment where it is safer and more
enjoyable to take regular physical activity, where healthy food choices are readily
available in every community and where ‘smokefree’ is the norm.

Over the past 12 months people from a wide range of backgrounds and professions
have come together at a series of events in the North East to share ideas and plan
services so that we are more effective at preventing CVD. We all have an opportunity to
contribute to improving the health of people in the North East and, in its
recommendations, this report clearly demonstrates what different groups – individuals,
local authorities, clinical commissioning groups and NHS acute and mental health
Trusts – can do to prevent CVD. Communities, councillors, voluntary sector
organisations, local planners, health and care workers and employers all have a role to
play.

I ask you to consider this report and play your part in reducing the burden of CVD in the
North East.

Professor Peter Kelly

Centre Director, Public Health England North East.

                                                4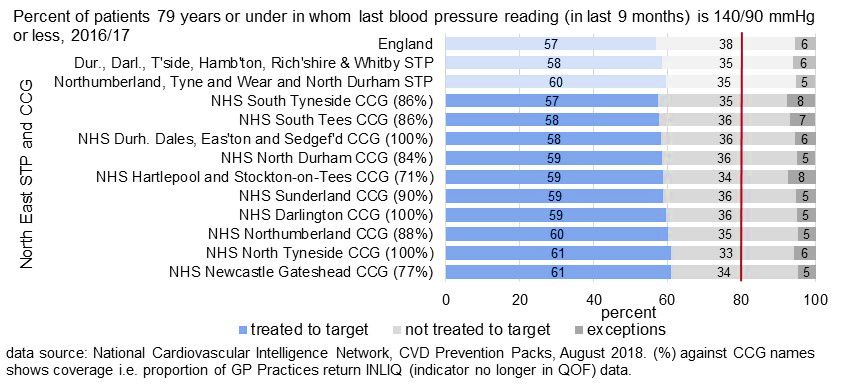
Executive summary
Since 2011, the rise in life expectancy in the North East region has slowed. A decline in
the rate at which the cardiovascular disease (CVD) mortality rate is falling has been a
major contributory factor. In the North East of England, CVD now accounts for 24% of
all deaths. CVD is also a major burden of ill-health, accounting for 15% of all disability-
adjusted life years in the region.

This report examines the current evidence about cardiovascular disease in the North
East, the joint ambitions set by the National Health Service and Public Health England
to address CVD, and the opportunities to reduce the burden of disease in this region by
addressing modifiable risk factors.

High blood pressure. The ambition is for 80% of people with hypertension to be
diagnosed, and 80% of those diagnosed to have their blood pressure controlled within a
recommended range. Currently, across the North East, only around 60% are diagnosed
and 60% of those diagnosed have their blood pressure controlled within the
recommended range.

Cholesterol. An imbalance between the different types of cholesterol in the body
increases the risk of developing CVD. Data showing the number of people with high
cholesterol and the proportion that are being treated with appropriate medications will
be available from NHS England within the next year. In the meantime, promotion of the
NHS Health Check programme can improve diagnosis.

Obesity. It is estimated that two thirds (65%) of adults in the North East are overweight
or obese compared with 62% across England. Obesity levels 10 and 11 year old
children are also high in the region. Local authorities can help to address obesogenic
environments through planning regulations, and prioritising active travel.

Physical inactivity. People in the UK are 20% less active now than in the 1960s.
Twenty-five percent of adults in the North East don’t achieve the minimum
recommended levels of physical activity each week compared to 22% across England.
Local authorities can maximise community assets and influence local plans to develop
environments that encourage physical activity.

Diet. Around four in ten adults in the North East don’t regularly consume the
recommended five portions of fruit and vegetables each day. There is evidence that
local authorities in the region are already using planning regulations to restrict the
concentrations of fast-food takeaways where necessary.

Smoking. Sixteen percent of adults currently smoke in the North East compared to 15%
across England. Smoking prevalence has fallen consistently over the past six years in

                                                 5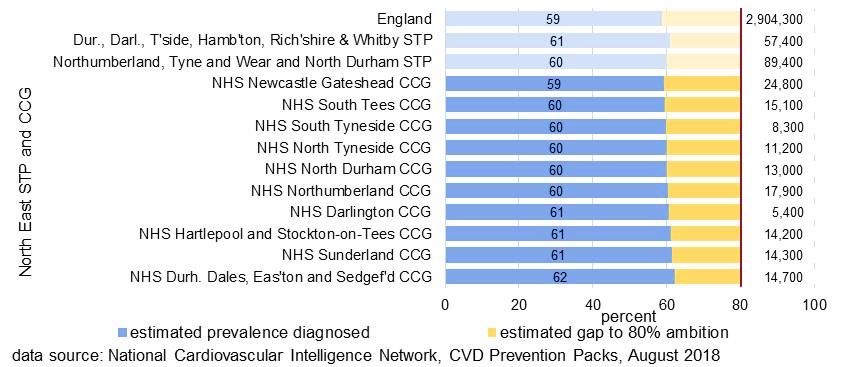
the region but remains higher than the national average. Around 7.5% of 15 year olds in
the North East regularly smoke compared to 5.5% across England. Hospital trusts can
provide screening, advice and referral for patients who smoke, and consider stop
smoking support as part of discharge care plans.

Alcohol. Survey data suggests that 20% of adults in the North East regularly consume
alcohol above the current low risk limit of 14 units a week but only one quarter of adults
realise that alcohol can cause heart disease.

Air pollution – The North East has relatively low levels of air pollution but there are
some exceptions. The relevant local authorities must produce action plans to show how
they intend to improve air quality in the future and may consider the promotion of public
transport, changing road layouts or road charges to reduce congestion.

Non-diabetic hyperglycaemia. This is condition that indicates that there is a risk of
developing Type 2 diabetes and other CVD conditions and an estimated 250,000 adults
in the North East have the condition. A new programme – Healthier You, the NHS
Diabetes Prevention Programme – will offer people with non-diabetic hyperglycaemia
personally tailored advice to improve their diet and increase their physical activity.

Diabetes. In 2017/18 there were 163,000 adults aged17 years and over in the North
East (around 7%), diagnosed with type 1 or type 2 diabetes. It is estimated that another
32,000 have diabetes but are not yet diagnosed. Of those diagnosed, only around half
receive all the recommended care processes that help them manage their condition.

Outcomes

The term cardiovascular disease includes angina, heart failure, heart attack, atrial
fibrillation and stroke. The early mortality rate (under 75 years) due to CVD is twice as
high in the most disadvantaged populations as it is in the least disadvantage.

In the North East, the rate of emergency hospital admissions due to angina is twice as high in
one local authority as it is in another. Cumbria and the North East has the higest recorded
prevalence of heart failure of all NHS regions. However, there has been good progress on
reducing mortality and the all age age-standardised mortality rate due to heart attack in the
North East is now lower than the England rate for both males and females.

There is an ambition for 85% of the expected number of people with atrial fibrillation (AF) to
be diagnosed and for 90% of patients with the condition who are known to be at high risk of a
stroke to be adequately anticoagulated by 2029. Currently the proportion diagnosed with AF
among North East CCG populations varies from 77% to 85% compared to an England average
of 77%. Sixty-two thousand people or 2.2% of all people in the North East are recorded on GP
registers as having had a stroke or transient ischaemic attack (a mini stroke or TIA) compared
to 1.8% across England. The proportion has been rising in recent years.

                                                6
Recommendations
Individuals can:
• reduce the risk of developing cardiovascular diseases by eating well, moving more,
   stopping smoking and losing weight if you are overweight
• take heart protective medications as prescribed
• use the least polluting fuels in open fires or stoves to reduce air pollution

Individuals with a heart or circulatory condition can:
• regularly monitor air pollution levels where you live and work. Checking the forecast
   can help to reduce the time spent in places where or when there are high levels of
   air pollution

GP Practices can:
• undertake a systematic audit to identify people with possible undiagnosed
  hypertension and maximise the proportion of those diagnosed that have their blood
  pressure controlled to target (≤140/90 mmHg ≤79yrs, ≤150/90 ≥80yrs)
• provide alcohol Identification and Brief Advice in primary care settings
• offer people diagnosed with non-diabetic hyperglycaemia referral into the NHS
  Diabetes Prevention Programme
• introduce regular systematic audit to identify people at risk of an Atrial Fibrilation-
  related stroke who are not anticoagulated or who are sub-optimally anticoagulated

CCGs and Primary Care Networks (PCNs) can:
• encourage, support and fund initiatives to evaluate local social prescribing
  programmes in primary care that include the prescribing of opportunities for physical
  activity
• consider commissioning medicine use reviews, blood pressure self-test units and
  digital solutions for self-monitoring and treatment optimization

Local authorities, CCGs, Primary Care Networks (PCNs) and General Practices can:
• work together to maximise NHS Health Check programme uptake & follow up
• review data on the numbers of patients tested, known cholesterol levels and
  resulting treatments when it is published by NHS England from the CVDPrevent
  initiative (1)

Local authorities can:
• monitor the trends in levels of physical activity among the local population
• prioritise active travel in transport and development plans and deliver walking and
  cycling infrastructure through Local Cycling and Walking Infrastructure Plans
• use planning policies to avoid the over-concentration of hot food takeaways

                                                7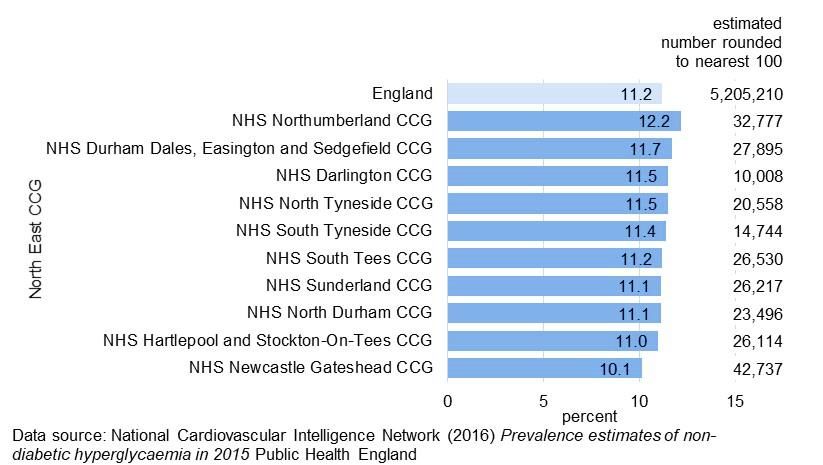
•   develop policies that will improve air quality such as changing road layouts at
    congestion and air pollution pinch points, encouraging public and private uptake of
    ultra low emission vehicles, using innovative retrofitting technologies and new fuels
    and encouraging use of public transport
•   Iientify and support community assets that provide opportunities for physical activity,
    including access to quality green spaces
•   consider the potential benefits of ‘school superzones’ which aim to create healthier
    and safer places around schools for children to live, learn and play
•   work with schools to encourage healthier eating eg through provision of healthy
    snacks within vending machines or provision of healthier options on menus
•   encourage continuing high participation rates in the National Child Measurement
    Programme
•   commission or provide accessible activity schemes, ensuring participation from less
    active population groups (older people, young female adults, people with a disability,
    people on low incomes)
•   encourage employers to develop workplace environments and policies that facilitate
    active travel to and from work
•   support the implementation of the NHS Diabetes Prevention Programme (NHS DPP)
    and the development of referral pathways between the NHS Health Check
    programme and the NHS DPP

NHS Trusts can:
• have smokefree buildings and grounds with staff trained to facilitate smoke
  cessation
• provide screening, advice and referral to stop smoking services in acute and mental
  health secondary care settings. Ensure that the care plan at discharge of patients
  who smoke addresses their tobacco dependence
• implement NICE guidance PH45 “Smoking: Harm reduction”
• provide support for temporary abstinence for smokers unready to stop smoking
  completely or permanently
• assess all pregnant women for carbon monoxide to identify potential smoking and
  refer for specialist support
• establish and/or optimise alcohol care teams in district general hospitals
• provide alcohol Identification and Brief Advice in secondary care settings
• audit current practice in the management of stable angina against the
  recommendations in NICE Guideline CG126

                                                 8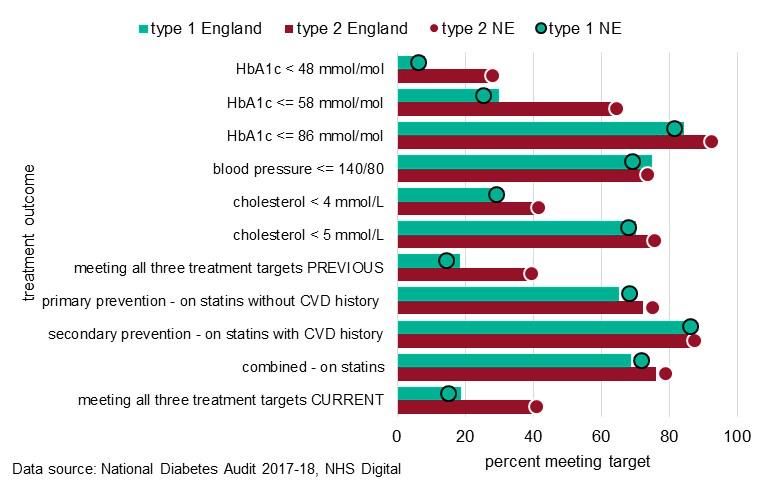
1. Introduction
1.1.    Context

Deaths from cardiovascular diseases (CVD) such as heart disease and stroke have a
significant impact upon life expectancy. Between 2001 and 2016, declining mortality rates from
CVD in England were the biggest single cause of increasing life expectancy (2). The downward
trend in CVD deaths has slowed in recent years, contributing to the slowdown in increases in
life expectancy (3).
CVD is also a major burden of ill-health in England, second only to all cancers (4). In the North
East of England, CVD accounts for 24% of all deaths (5) and 15% of all disability adjusted life
years (DALYs).
The National Health Service (NHS) and Public Health England (PHE) have identified the
prevention of cardiovascular disease as a major priority (6) and produced a set of joint
ambitions for the next ten years, aiming to prevent ill-health and to reduce the health
inequalities associated with CVD (7).

1.2.    Definition

CVD is a group of diseases and conditions which affect the heart and/or blood vessels and
share a common set of causes and risk factors. It includes (8):
• atrial fibrillation (an irregular heart rate)
• coronary heart disease (angina; heart failure; heart attack)
• diabetes
• hypercholesterolemia (excess cholesterol)
• hypertension (high blood pressure)
• kidney disease
• peripheral vascular disease (affecting blood vessels)
• stroke
• vascular dementia (caused by reduced blood flow to the brain)

Some people will live with cardiovascular diseases or conditions and be unaware of them. This
may be because they have not yet developed noticeable symptoms, or because they have not
been diagnosed. If left untreated and uncontrolled, conditions such as hypertension may lead to
more serious outcomes such as heart attack or stroke.
Increasing physical activity, improving diet, maintaining a healthy weight, stopping smoking and
limiting the consumption of alcohol can all reduce the risk of CVD and improve health
outcomes. Having high levels of low density lipoproteins, or low levels of high density
lipoproteins in the blood, or high blood pressure pressure, can also increase the risk of CVD. All
these risks are assessed when adults aged 40-74 are invited to attend the NHS Health Check
programme every five years (9).

                                                9
1.3.    Data sources

This report draws on epidemiological data from several different sources. Age-standardised
mortality rates are calculated from Office for National Statistics (ONS) death records. Some of
these rates are published within the Fingertips suite of tools (10). Hospital admission rates are
calculated from Hospital Episode Statistics (HES) data supplied by NHS Digital (11). Data on
the prevalence of diagnosed disease is from the Quality and Outcomes Framework (QOF),
published by NHS Digital (12).
Published indicators from the National Cardiovascular Intelligence Network (NCVIN) show
diagnosed prevalence as a proportion of expected prevalence for Clinical Commissioning
Group (CCG) and general practice populations (13).
NHS Rightcare have published Long Term Conditions Packs (14) for each CCG. This report
complements the NCVIN and Rightcare packs by focusing on the risk factors, outcomes and
interventions for the North East region.
Data showing the relative burden of morbidity and mortality is taken from the Global Burden of
Disease study (15). The study uses modelled data to allow the direct comparison of illness in
different countries and from different sources.

1.4.    Scope of the report

This report focuses on the health of the population in the North East of England, specifically:
• the modifiable risk factors which can lead to CVD, including high blood pressure,
    smoking, high cholesterol, diabetes, inactivity, obesity, poor diet and high alcohol
    consumption (16)
• specific cardiovascular conditions, such as heart attack and stroke
• effective and cost-effective interventions that can prevent or minimise ill-health due
    to CVD
Family history, age, gender and ethnicity are also risk factors for CVD but are not considered in
this report because they cannot be modified.
The report examines trends in the total number of cases (prevalence), hospital admissions and
deaths due to CVD and relevant risk factors. It also considers health inequalities between the
North East and England, and within the North East. The current availability and uptake of
evidence-based preventative interventions is reviewed.
The intended audience for this report is: decision makers in local authorities, clinical
commissioning groups and the North Cumbria and the North East Integrated Care System;
public health practitioners; healthcare commissioners; clinicians; voluntary sector organisations;
and interested members of the public.

                                                10
2. Risk factors
2.1. Attributable risk and the relative importance of risk factors
The Global Burden of Disease (GBD) study has developed methods to systematically estimate
the risks attributable to key health conditions (17). Figure 1 shows that an estimated 81% of
Disability-adjusted Life Years (DALYs) due to CVD in the North East can be attributed to
specific risk factors. Seventy one per cent of DALYs are the result of metabolic risk factors such
high blood pressure or high body mass index. Fifty five per cent of DALYs are attributable to
behavioural risks, such as diet or smoking. Similar data showing attributable risk fractions for
each North East local authority population are available in the GBD results tool (18).
Figure 1: Disability-adjusted life years (DALYs) due to CVD by contributory risk factors,
as a proportion of all DALYs due to CVD for the North East and England, 2017
112.2. High blood pressure
2.2.1. Description
Blood pressure measurements are recorded when the heart beats (systolic pressure) and when
it rests (diastolic pressure). It is shown using systolic/diastolic mmHg readings. Blood pressure
is considered normal within the range of 90/60mmHg and 120/80mmHg, and high (indicating
hypertension) when readings are higher than 140/90mmHG. Levels between 120/80mmHg and
140/90mmHg may be referred to as pre-hypertension. Modifiable risk factors for hypertension
are: a high amount of salt in your diet; a lack of exercise; being overweight or obese; regularly
drinking large amounts of alcohol; smoking; and long-term sleep deprivation (19).
2.2.2. Ambition
Moderate to high hypertension is usually symptomless. It is estimated that over 5 million people
are currently living with undiagnosed hypertension in England (20). Untreated hypertension
increases the risk of a stroke and other serious conditions affecting the heart and kidneys.
PHE and NHS England, along with their partners, have set the following ambitions for 2029:
• 80% of the expected number of people with high blood pressure are diagnosed;
• 80% of the total number of people diagnosed with high blood pressure are treated to
targets set by the National Institute for Health and Care Excellence (NICE) (21).
2.2.3. Evidence
PHE’s CVD Prevention Packs show the observed and expected prevalence of hypertension in
2016/17, and provide estimates to meet the 2029 ambitions. The packs are available for
Sustainability and Transformation Partnerships (STPs), CCGs and general practices (13). The
latest information packs (currently 2016/17) can be downloaded here.
An estimated 59-62% of patients with hypertension in North East CCGs are diagnosed (Figure
2), better than the England average of 58.6%. But there is a need to identify a further 140,000
people with hypertension in order to meet the 80% diagnosis ambition the North East.
CCGs in the North East are controlling the hypertension of more of their patients than the
England average (Figure 3). There are still 39.1-42.7% of patients with hypertension in North
East CCGs who do not have their blood pressure appropriately controlled or for whom this is
unknown.
12Figure 2: Prevelance of diagnosed hypertension as a proportion of expected prevalence
for North East STPs and CCGs and number required to be diagnosed to meet 80%
ambition
Figure 3: Proportion of people diagnosed with hypertension within treatment target
for North East STPs and CCGs
2.2.4. Opportunities:
The The NHS RightCare CVD prevention pathway identifies a number of opportunities to
improve blood pressure detection and management.
GP Practices can:
• Undertake a systematic audit to identify people with possible undiagnosed hypertension
(see the CVD prevention packs)
13• support people with hypertension to control their blood pressure to target (≤140/90
mmHg in people under 80, and ≤150/90 in people over 80). Note that QOF is not
currently aligned with this treatment target, rewarding the less stringent control level
of ≤150/90mmHg
• use practice-based pharmacists to optimise management of hypertension
Local authorities, CCGs and General Practices can:
• work to maximise NHS Health Check uptake & follow up
• tackle inequalities - people in the most deprived areas are 30% more likely to
have high blood pressure than the least-deprived (22 p. 8) and hypertension is be more
common in some ethnic groups, including Black African and Black Caribbean
populations (22 p. 8).
CCGs and General Practices can:
• commission ambulatory blood pressure monitoring services for diagnosis, with
pharmacies and general practice the most cost-effective providers (22 p. 19).
• consider commissioning:
o Pharmacies to review medicine use to improve adherence.
o BP self-test units, eg in surgery waiting rooms, pharmacies or leisure centres.
o Digital solutions for self-monitoring and treatment optimisation
2.3. Cholesterol
2.3.1. Description
Cholesterol is a fat (lipid) produced by the liver which is needed by the human body to produce
cell membranes, bile acids and Vitamin D. Cholesterol is also present in animal-based foods,
such as dairy products and meat. Cholesterol is transported around the body in the
bloodstream by lipoproteins (combinations of fat & protein). Low density lipoproteins (LDL)
transport cholesterol from the liver to the tissues and high density lipoproteins (HDL) transport
excess cholesterol to the liver for disposal. Both high levels of LDL and low levels of HDL in
the blood are associated with an increased risk of Coronary Heart Disease (CHD).
Hyperlipidemia, referred to as ’high’ cholesterol, is an imbalance in the two types of cholesterol.
It can be genetic (primary hyperlipidemia) or acquired (secondary hyperlipidemia). It can be
controlled through exercise, diet, statins, or a combination of these factors.
2.3.2. Ambition (NHS)
For individuals:
Total cholesterol levels should be: less than or equal to 5mmol/L for healthy adults and less
than or equal to 4mmol/L for those at high risk
Low-density lipoprotein levels should be less than or equal to 3mmol/L for healthy adults and
less than or equal to 2mmol/L for those at high risk.
High-density lipoprotein levelhould be greater than or equal to 1mmol/L.
The ratio of total cholesterol to HDL should be below 4, to reduce the risk of heart disease (23).
14For populations:
By 2029, 75% of people aged 40 to 74 should have had a formal validated CVD risk
assessment and cholesterol reading recorded in the last five years and 45% of 40 to 74 year
olds with a 20% or greater 10-year risk of developing CVD will be treated with statins.
25% of people with familial hypercholesterolaemia (FH) will be diagnosed and treated optimally
according to the NICE FH guideline by 2024. (20)
2.3.3. Evidence:
Cholesterol readings are collected as part of the NHS Health Check programme. Data on the
NHS Health Check programme offers and uptake are available for the North East and for
unitary authorities (see section 4.2). Data showing the proportion of patients with poorly
controlled cholesterol are not currently published. An estimated 6 in 10 adults have a raised
cholesterol level (24). It is also estimated that between 1 in 250 and 1 in 500 people have
familial hypercholesterolaemia, a genetic cause of raised cholesterol (20).
2.3.4. Opportunities:
Data on the numbers of patients tested, known cholesterol levels and resulting treatments is
due to be published by NHS England within the next 12 months within the CVDPrevent initiative
(1), allowing a review of the effectiveness of the NHS Health Check programme.
Local authorities, CCGs and General Practices can:
• maximise NHS Health Check programme uptake and follow up
• use new published data on cholesterol levels and resulting treatments to inform
delivery and targeting of the NHS Health Check programme
2.4. Obesity
2.4.1. Description
Gaining weight is caused by an imbalance of calories expended and calories consumed (25).
The recommended healthy and balanced diet comprises 2,000 calories per day for women, and
2,500 for men – “400 calories for breakfast, 600 calories for lunch and 600 for dinner – leaving
room for a couple of healthy snacks and drinks.” (26).
Figure 4: Easy meals app, part of PHE’s One You campaign
15Body Mass Index (BMI) measures healthy weight by dividing an adult’s weight in kilograms by
the square of thei height in metres. A BMI of 25 kg/m2 or more is categorised as overweight and
a BMI 30 kg/m2 or more is classed as obese. For children, the BMI centile is used.
Being overweight or obese can lead to an increase in: the amount of cholesterol in blood, high
blood pressure and the risk of developing Type 2 diabetes, all risk factors for CVD. The NHS
spent an estimated £6.1 billion on overweight-related ill-health in 2014 to 2015, ‘greater than
the amount spent on the police, the fire service and the judicial system combined.’ (27)
2.4.2. Ambition
The Call to Action on Obesity (28) sets out the Government’s ambitions in relation to excess
weight in England.:
• a sustained downward trend in the level of excess weight in children by 2020
• revised (June 2018) to halve childhood obesity rates by 2030 and significantly
reduce the health inequalities that persist (Childhood obesity: a plan for action,
Chapter 2)
• a downward trend in the level of excess weight averaged across all adults by 2020
2.4.3. Evidence
Figure 5: Childhood obesity, key statistics, England 2015
Source: Promoting healthy weight in children, young people and families: A resource to support local authorities
(based on Health Survey for England 2015 Children’s body mass index, overweight and obesity)
Between 2006/7 and 2017/18, the prevalence of obesity in Reception year children in England
decreased slightly, from 9.9% to 9.5%, but it increased from 17.5% to 20.1% in Year 6 children.
(29) (Figure 5). Obesity rates are highest in the most deprived areas (30 pp. 9-14), amongst
those with a learning disability (31), and among Black African and Bangladeshi populations (30
pp. 15-20). The prevalence of obesity among children is highest in the North East, West
16Midlands and London (29). Nine out of twelve North East local authorities have a prevalence of
obesity among Year 6 children significantly higher than the England average (Figure 7).
Figure 6: Trends in prevalence of obesity, In the North East in 2017/18, around
North East and England, children 10-11 years 3,100 Reception year children and
around 6,300 Year 6 children were
recorded as obese. If the obesity rates in
the North East were the same as for
England, approximately 400 fewer
children in Reception year, and 740 fewer
in Year 6 would be obese.
It is estimated that 62% of the adult
population in England were classified as
overweight or obese in 2017/18. In the
North East, this percentage was 67% ,
the highest of all English regions. Within
the North East, the prevalence of
overweight and obesity in local authorities
Source: PHE (2019) Fingertips at https://fingertips.phe.org.uk varies from 62% to 72% of adults (Figure
8).
Figure 7: Year 6 Prevalence of overweight (including obese), 2017/18
Data source: Public Health Outcomes Framework tool, PHE
17Figure 8: Prevalence of adult excess weight by North East local authority, 2017/18
Data source: Public Health Outcomes Framework tool, PHE based on data published by NHS Digital
2.4.4. Opportunities
Local authorities can:
• prioritise active travel in transport plans and Local Cycling and Walking Infrastructure
Plans (32 p. 24)
• ensure access to quality green space to promote physical activity (32 p. 24)
• partner with leisure facilities to offer accessible physical activity opportunities (32 p. 24)
• consider the potential benefits of ‘school superzones’, which aim to create healthier and
safer places around schools for children to live, learn and play (33).
• Continue to ensure good participation in the National Child Measurement Programme -
in 2017/18, 8 out of 12 North East authorities had rates of 95% or more (29)
2.5. Physical inactivity
2.5.1. Description
In 2011 the Chief Medical Officers from the four home countries of the United Kingdom
published the ‘Start Active, Stay Active’ report (34). The report provides evidence that
physical activity can help us to achieve happier andy healthier lives, reducing the risk of
developing coronary heart disease, stroke and type 2 diabetes. The report provides
age-dependent guidelines on the recommended levels of activity to confer substantial
health benefits, which can can be adjusted for people with disabilities according to
exercise capacity and any risk issues.
Health Matters: getting everybody active every day (35) notes that increasing physical activity
can reduce the risk of cardiovascular disease by 35%. .
182.5.2. Ambition
Children and young people should engage in moderate to vigorous intensity physical activity for
at least 60 minutes every day. Vigorous intensity activities, including those that strengthen
muscle and bone, should be incorporated at least three days a week (36).
All adults should aim to be active daily. Over a week, activity should add up to at least 150
minutes of moderate intensity activity in bouts of 10 minutes or more (37) (38).
2.5.3. Evidence:
People in the UK are around 20% less active now than in the 1960s and, if current
trends continue, we will be 35% less active by 2030 (45). One quarter of adults 19
years and over in the North East don’t routinely meet the minimum recommended
weekly activity level of 150 minutes of moderate intensity physical activity (Figure 9),
significantly higher than the average of 22% for England. Across the North East, an
additional 65,000 adults would need to meet the recommended weekly level of activity
to close the gap with England.
Figure 9: Percentage of physically inactive adults, 2017/18
Data source: Public Health Outcomes Framework tool, PHE, based on the Active Lives survey, Sport England
2.5.4. Opportunities
PHE’s national physical activity framework, Everybody active, every day (39), identifies four
areas for local and national action:
• active society: creating a social movement
• moving professionals: activating networks of expertise
• active environments: creating the right spaces
• moving at scale: scaling up interventions that make us active
19An update ‘Everybody Active, Every Day: Two years on’ was published in 2017 (40)
People are more likely to be active if it is seen as ‘normal’, if their friends and peers are also
active or if advised to be by a GP or nurse.
Local authorities can:
• maximise community assets that provide opportunities for people to be
physically active
• commission sports and leisure facilities, monitor access for populations that are
less active eg older people, young females and people with a disability (41)
• improve or add green spaces and tree cover
• influence the Local Development Plans and Transport Plans to develop physical
environments that encourage people to incorporate activity into their daily
routines
• encourage employers to develop workplace environments and policies that
facilitate active travel to and from work
• re-allocate road space to support walking and cycling
• restrict motor vehicle access, introduce road-user charging and traffic-calming
schemes
• create safe routes to schools
CCGs and Primary Care Networks (PCNs) can:
• evaluate local prescribing of opportunities for physical activity (42)
2.6. Diet
2.6.1. Description
The Global Burden of Disease study (18) identifies that dietary risks contributed to 46% of all
CVD disability-adjusted life years in the North East (a measure of morbidity and mortality due to
CVD). There is strong evidence that consumption of fruit and vegetables, fish and fish oils and
low to moderate alcohol intake will reduce the risk of CVD. Evidence also demonstrates an
increased risk of CVD from diets high in saturated fats, salt and alcohol (43 p. 81).
Supporting people to adopt a healthier diet must go beyond advice on healthy foods, recipes
and cooking skills. PHE’s publication, Health Matters: obesity and the food environment (44),
identifies where Local Authorities can help organisations offer healthier food and drink.
2.6.2. Ambition
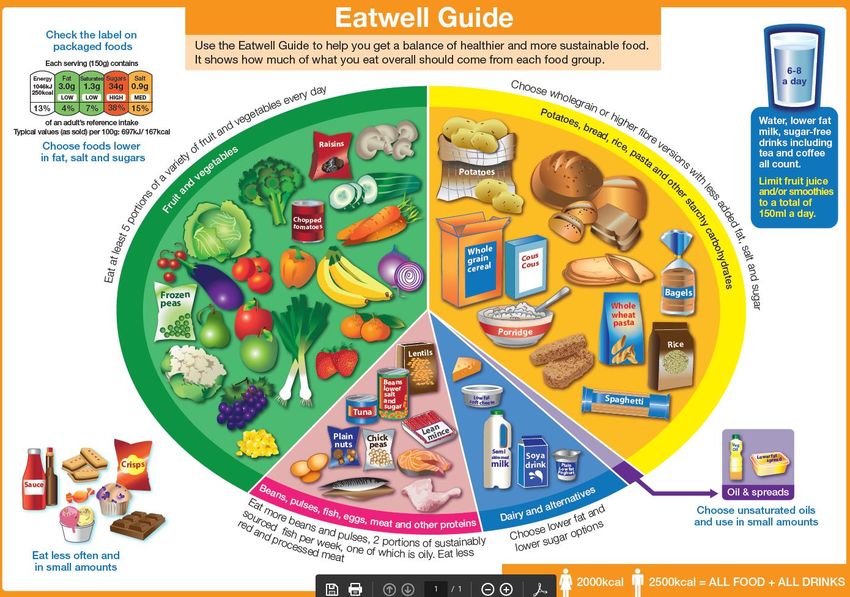
People should follow a diet that resembles the Eatwell Guide (45) and consume an average of
at least five portions of fruit and vegetables each day. (Figure 10)
Local authorities work with other stakeholders to further increase the opportunities for
communities to access healthier food , both managing new business applications and working
with existing food outlets to provide healthier food. (46) (47) (48)
20Figure 10: The Eatwell guide
Source: PHE in association with the Welsh Government, Food Standards Scotland, and the Food Standards
Agency in Northern Ireland
2.6.3. Evidence
Survey data suggests that 4 out of 10 adults in the North East don’t currently eat the
recommended five or more portions of fruit and vegetables on a ‘usual day’ (49), similar to the
population of England as a whole. There is little significant variation in the proportion
consuming ‘5 a day’ between North East local authority populations (Figure 11).
21Figure 11: Proportion of adults consuming five portions of fruit and vegetables on a
‘usual day’, 2017/18
Data source: Active Lives survey, Sport England, in Public Health Outcomes Framework profile, indicator 2.11i
Figure 12: Density of fast food outlets, 2017
Data sources: indicator data from GOV.UK published by PHE, based on number of fast food outlets from Food
Hygiene Rating System, Food Standards Agency and population from ONS mid-year population estimates
PHE estimated that, in 2017, there were over 50,000 fast food and takeaway outlets, fast food
delivery services, and fish and chip shops in England (50). The density of outlets (measured as
a crude rate per 100,000 population) was significantly higher in the North East, and in eight out
of twelve of the region’s local authorities (Figure 12), compared to England as a whole.
22In Gateshead, a Supplementary Planning Document, supported by an integrated public health
policy, has been used successfully to control the proliferation of takeaways in areas with high
levels of child obesity. A case study can be found at https://www.gov.uk/government/case-
studies/planning-document-to-limit-the-proliferation-of-takeaways.
2.6.4. Opportunities
Local authorities can work with other stakeholders to:
• use planning policies to tackle obesity egby avoiding the over-concentration of
hot food takeaways in existing town centres or high streets, and restricts their
proximity to schools
• work with schools to encourage healthier eating eg through provision of healthy
snacks within vending machines or provision of healthier options on menus
2.7. Smoking
2.7.1. Description
Across England, it is estimated that 16% of all deaths in 2016 and 4% of all hospital admissions
in 2016/17 were attributable to smoking (51). Despite the known risks of smoking and its
association with cardiovascular disease, almost 6.5 million adults (14.9% of adults) in England
in 2017 were estimated to be smokers (Annual Population Survey). In the North East in 2017,
the proportion was higher at 16.2% of the adult population - 340,000 smokers. The rate of
smoking-attributable hospital admissions in 2017/18 amongst people aged 35 or over was 45%
higher in the North East (2,221 per 100,000) than in England as a whole (1,530) (Figure 18).
2.7.2. Ambition
The objectives of the tobacco control plan (52) are, by 2022, to:
• reduce the number of 15 year olds who regularly smoke from 8% to 3% or less
(Figure 17)
• reduce smoking among adults in England from 15.5% to 12% or less (in 2017
this was estimated to be 14.9%)
• reduce the inequality gap in smoking prevalence, between those in routine and
manual occupations and the general population
• reduce the prevalence of smoking in pregnancy from 10.5% to 6% or less
2.7.3. Evidence
The proportion of adults that are current smokers has fallen consistently in the North East over
the past six years, but prevalence is still significantly higher than for England as a whole. At its
widest, the absolute prevalence gap was 2.7% in 2012. By 2018, the gap between England and
the North East was 1.6%. Relative to the England average, prevalence in the North East was
14% higher in 2012 and was 11% higher in 2018 (Figure 13).
23Figure 13: Smoking prevalence among adults, current smokers, North East and England
Source: PHE, Public Health Outcomes Framework, indicator 2.14, data from Annual Population Survey, ONS
Figure 14 Smoking prevalence in adults 18+ - current smokers, 2018
Source: Annual Population Survey, ONS, published in Fingertips
24Figure 15: Indicators of smoking prevalence among young people
Source: PHE Local Tobacco Control Profiles
Figure 16: Smoking attributable hospital admission rates, 2017/18
Data source: Local Tobacco Control Profiles in Fingertips at https://fingertips.phe.org.uk
2.7.4. Opportunities
The report Local Health and Care Planning: Menu of preventative interventions (53) makes the
following recommendations:
NHS Trusts can:
• Provide screening, advice and referral in acute and mental health care settings.
Secondary care providers can ensure that the discharge care plans for patients who
smoke addresses their tobacco dependence.
There is evidence of Stop Before Your Op initiatives being introduced in many areas in
the North East eg Northumberland and North Tyneside and South Tees. Work to support
and monitor the development of stop smoking service provision within NHS acute Trusts
25is being undertaken by the North East Smokefree NHS/Treating Tobacco Dependency
Taskforce.
• Implement NICE guidance PH45 “Smoking: Harm reduction”
• Provide support for temporary abstinence for smokers unready to stop smoking
completely or permanently. This may include cutting down to quit and long-term nicotine
use to prevent relapse to smoking
• Use regular ante-natal screening appointments to assess all pregnant women for carbon
monoxide to identify potential smoking and refer for specialist support, for example using
the BabyClear initiative (54).
Mental health NHS Trusts can:
• Have smokefree buildings and grounds with staff trained to facilitate smoke cessation.
The two NHS mental health Trusts in the North East both implemented smokefree
policies in 2016. A report (55) summarises findings from a study that evaluated the
introduction of these policies.
2.8. Alcohol
2.8.1. Description
Excessive alcohol consumption can increase your cholesterol and blood pressure levels and
contribute to weight gain (16). All these effects increase your risk of cardiovascular disease.
2.8.2. Ambition
The Chief Medical Officers’ current guidelines for low-risk drinking are:
• it is safest not to drink more than 14 units a week on a regular basis
• if you regularly drink as much as 14 units per week, it is best to spread your
drinking evenly over 3 or more days. Having one or two heavy drinking
episodes a week, increases your risk of death from long-term illness and from
accidents and injuries. (Figure 20)
• the risk of developing a range of health problems (including cancers of the
mouth, throat and breast) increases the more you drink on a regular basis.
• a good way to cut down the amount that you drink is to have several drink-free
days every week
2.8.3. Evidence
There were over 600,000 cardiovascular alcohol-related hospital admission episodes in
England in 2017/18 (broad measure, based on primary and secondary diagnoses). In the North
East region the equivalent figure was over 34,000 admissions: the highest rate was in South
Tyneside, and the lowest in Darlington (Figure 17).
Despite this, only a quarter of respondents to a BALANCE survey (56) were aware that alcohol
can cause heart disease. BALANCE estimate that: i) more than one fifth of the adult population
26in the North East drinks in excess of the weekly ‘low risk’ guideline of 14 units; and ii) more than
one third of adults aged 45-54 in the region consume more than 14 units per week, and iii) 11%
consume more than 29 units. Of those who admit to drinking double the low risk guideline,
three quarters believe they are a ‘light or moderate drinker’ (56).
Figure 17: Admission episodes for alcohol-related CVD conditions 2017/18 (broad
definition)
Data source: Hospital episode statistics (HES), NHS Digital. Rates calculated by PHE and published in Local
Alcohol Profiles for England within the Fingertips tool (https://fingertips.phe.org.uk)
Figure 18 Percentage of adults binge drinking on heaviest drinking day, 2011-14
Data source: Secondary analysis of Health Survey for England data by PHE, published in Local Alcohol Profiles
for England within the Fingertips tool (https://fingertips.phe.org.uk)
272.8.4. Opportunities
The following are recommended within PHE’s Menu of Preventative Interventions (53 pp. 9-10)
NHS Trusts, CCGs and local authorities can:
Establish and/or optimise Alcohol Assertive Outreach Teams (57) (58) and alcohol care teams
in district general hospitals (59). The NHS Long-Term Plan includes a commitment that
“hospitals with the highest rate of alcohol dependence-related admissions will be supported to
fully establish Alcohol Care Teams” (60).
General Practices and NHS Trusts can:
Provide alcohol Identification and Brief Advice in primary and secondary care settings (61) (62)
2.9. Air pollution
2.9.1. Description
Air pollution is the presence in the atmosphere of gases such as nitrogen dioxide, nitric oxide
(NO2), sulphur dioxide, carbon monoxide, and fine particulates. Fine particulates are defined as
those between 2.5 and 10 microns in size which, if inhaled, can cause serious harm to health.
As a general rule, the smaller the size of the particulate (nearer to 2.5 microns), referred to as
PM2.5, the greater the risk to health. Air pollution can result from of natural events such as
volcanic activity, or human activity. This section of the report concentrates on air pollution that
is the result of human activity, and consequently modifiable.
Evidence indicates that air pollution and cardiovascular morbidity and mortality are correlated
(63) (64) (65) but proximity to the source of pollution, time of day, environmental factors, and
personal characteristics all affect an individual’s exposure and response to air pollution. Further
details on airborne pollutants may be found in the Government’s ‘Clean Air Strategy 2019’ (66).
2.9.2. Ambition
Ambient pollution, from vehicles industry or agriculture:
• to reduce PM2.5 levels to an annual average of 25 µg/m3 by 31 December 2020
in the UK (excluding Scotland) (67). It is argued that adopting the WHO
guideline of an annual average levels of 10 µg/m3 would result in improvements
in life expectancy (68)
• to reduce roadside NO2 concentration ‘hotspots’ to within statutory limits1, as
quickly as possible, and “to transform the UK’s most polluted towns and cities
into clean and healthy urban spaces, supporting those most directly affected
18 Hourly mean limit value – 200 micrograms per cubic metre not to be exceeded more than 18 times a calendar
year Annual mean limit value – 40 micrograms per cubic metre
28and ensuring that vehicle manufacturers play their part to improve the nation’s
air quality.” (69)
Household:
• to restrict the sale of less efficient stoves, and prohibit the sale of the most
polluting fuels eg coal and ‘wet’ wood. The use of wood in domestic combustion
activities accounted for 36 per cent of PM2.5 emissions in 2017. (70)
2.9.3. Evidence
Air pollution increases the risk of cardiovascular disease by causing cell and tissue damage
and inflammation, arterial blood clots and an irregular heartbeat (71). There appears to be
stronger evidence to support the negative effect of particulates than for gaseous pollutants (72).
In 2016, the North East had the lowest average annual concentration of human-made fine
particulate matter (PM2.5) of the nine English regions (73). All local authorities in the North East
in 2016 had average annual concentrations of PM2.5 below WHO guidelines of 10 µg/m3
(Figure 19). Note that these are average figures, and that levels of particulates vary depending
on the time of year, day, proximity to the source of exposure, and the prevailing weather.
Information on 2016 and 2017 annual average PM2.5 roadside concentrations can be found on
the Department for Environment Food & Rural Affairs (DEFRA) UK Air Information Resource
website.
Figure 19: Mean levels of fine particulate matter (µg/m3) by North East local authority,
2016
Source: PHE (2019) Fingertips at Public Health Profiles
Analyses by Mitchell and colleagues (74) suggest that whilst there have been substantial
improvements in air quality in Great Britain, it has not been equally distributed: people in more
deprived areas have benefitted less from those improvements.
29Figure 20: 2015 deprivation index plotted against mean levels of fine particulate matter
(µg/m3) 2016 by North East local authority
Source: Fingertips, Public Health England at https://fingertips.phe.org.uk
DEFRA, in its ‘UK plan for tackling roadside nitrogen dioxide concentrations’ (69) states that
their current priority is to reduce the levels of roadside nitrogen dioxide (NO 2), the only air
quality limit that is currently unmet.
Table 1 shows the best NO2 forecast for North East local authorities which had in 2017 one or
more roads with NO2 concentrations above statutory limits (69).
Table 1: North East local authorities with concentrations of NO2 forecast above legal
limits and assuming no additional measures.
All figures are provided in µg/m3: 40 µg/m3 is the statutory annual mean limit value for NO2
Action: Required to produce local action plans by March 2018 on the basis of modelling which
indicates a number of roads need a solution
2017
2018
2019
2020
2021
2022
2023
2024
2025
2026
2027
2028
2029
2030
Council year
Middlesbrough Borough Council 53 59 56 52 49 45 43 40 38 36 35 33 32 31
Gateshead Met. Borough Council 53 51 48 46 43 40 38 36 34 32 30 29 28 27
Newcastle City Council 53 51 48 46 43 40 38 36 34 32 31 29 28 27
North Tyneside Council 50 48 46 44 41 38 36 34 32 31 29 28 27 26
Source: Department for the Environment, Food and Rural Affairs (2017)
Mapped air pollution information can be accessed using the Strategic Health Asset Planning
and Evaluation (SHAPE) tool (75), free to NHS professionals and Local Authority professionals
with a role in public health or social care.
302.9.4. Opportunities
Local authorities can:
Develop policies that will improve air quality. These could include:
• changing road layouts at congestion and air pollution pinch points;
• encouraging public and private uptake of low emissions vehicles (emitting
75g/km CO2 or less);
• using innovative retrofitting technologies and new fuels; and
• encouraging use of public transport.” (69)
Individuals can:
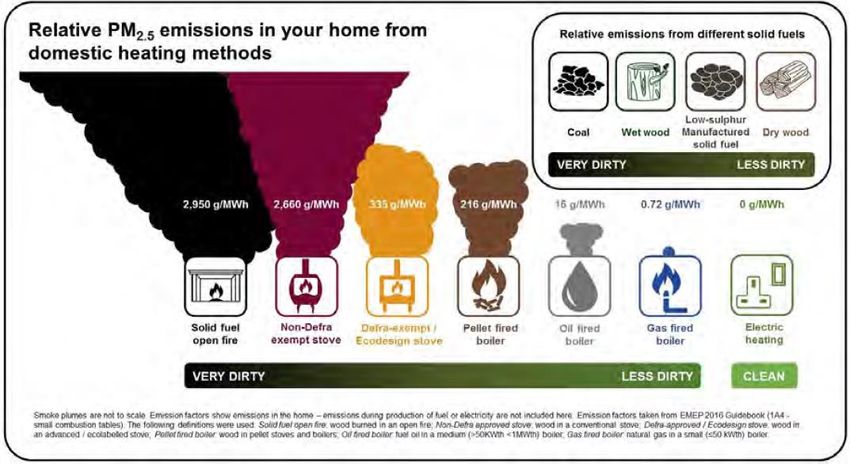
• use the least polluting fuels in open fires or stoves (see Figure 21)
Individuals with a heart or circulatory condition can:
• regularly monitor the air pollution levels where they live and work using the daily
pollution forecast on the Government’s UK-AIR website. There is also an air
pollution Twitter feed @DefraUKAir and a free telephone helpline 0800 55 66
77. (76)
•
Figure 21: Relative PM2.5 emissions from domestic heating methods
Source: Department for the Environment and Rural Affairs (66)
312.10. Non-diabetic hyperglycaemia (pre-diabetes)
2.10.1. Description
Hyperglycaemia is high blood sugar (glucose) and it is common in people with diabetes,
whether diagnosed or not. Non-diabetic hyperglycaemia indicates that there is a risk of
developing Type 2 diabetes and other CVD conditions. It is often referred to as pre-diabetes.
Hyperglycaemia can be caused by stress, and by conditions such as pancreatitis,
hyperthyroidism, and certain medications. Long-standing untreated hyperglycaemia can
damage blood vessels leading to complications such as diabetic retinopathy, organ damage,
heart attacks and stroke. An extremely high blood glucose level, if left untreated, can lead to
coma and death.
The HbA1c blood test measures an individual’s average blood sugar over the previous three
months or so. In the UK, normal blood glucose levels are where HbA1c is measured to be
below 42 mmol/mol (6%). Non-diabetic hyperglycaemia is diagnosed for levels between 42 &
47 mmol/mol (6% to 6.4%). HbA1c levels of 48 mmol/mol (6.5%) or above indicate diabetes.
2.10.2. Ambition:
Since 2016, all adults with non-diabetic hyperglycaemia, identified as being at high risk of
developing type 2 diabetes should be offered the opportunity to take part in the Healthier You:
NHS Diabetes Prevention Programme (NHS DPP) (77). This programme aims to provide
tailored help on healthy eating and weight loss, providing an individual exercise programme
(78). The ambition is to support up to 200,000 people per year through this programme. (79)
2.10.3. Evidence
There are estimated to be five million people in England who are at high risk of developing
(largely preventable) type 2 diabetes (80). Estimates of non-diabetic hyperglycaemia for clinical
commissioning groups (CCGs) in England in 2015 have been calculated by the National
Cardiovascular Intelligence Network (81).
32You can also read