THE IMPACT - AND THE ROLE OF RE to empower a long term and sustainable recovery - Tralac
←
→
Page content transcription
If your browser does not render page correctly, please read the page content below

THE
       IMPACT
            of Covid-19 on
    Africa’s energy sector

AND THE ROLE OF RE
to empower a long term and
      sustainable recovery

        In partnership with :   With the support of :

                                                        1
Foreword

For several weeks now, Africa has been fighting against an invisible enemy: COVID-19. Although the spread
in the continent is much lower than in other parts of the world today, it is not less worrying considering the
limited capabilities and resources of African countries to mitigate the potentially devastating effects of the
virus, from a public health, social and economic context.

Limited access in the continent to electricity particularly in health centers and facilities increases the
vulnerability to COVID-19. As Africa strives to sustain gains in reducing lack of access to electricity to more
than 600 million people today, putting the access agenda among the priorities in the health sectors has
become timely.

Due to the Covid-19 crisis, the African economy, similar to the global economy, is impacted by the disruption
of supply chains, mainly through exposures to inputs from Asia, Europe, and the Middle East, as well as
lower demand in global markets for a wide range of African commodity exports.

Travel bans and lockdowns are not only limiting the movement of people within countries and across borders,
but they are also disrupting the way of working for individuals, businesses and government agencies. The
employment effects of COVID-19 are raising social challenges, as already witnessed in the backstreets of
the megacities around the continent.

African leaders of the public and private sectors have been quick to act and the international development
community is expected to extend their commitment to work with Africa to safeguard the economies and
livelihoods of millions of people.

The renewable energy sector can play a fundamental role in the fight against the disastrous effects of
COVID-19. Access to reliable and sustainable energy is a crucial need, and is even more important today
for supporting essential services during a global crisis. In a period of extreme crisis such as the one we are
experiencing, ensuring a continuous flow of electricity is essential to keep the strategic infrastructures of
the countries going. Through strategic investment in sustainable energy, stimulus measures to induce
economic recovery will strengthen the foundation of sustainable development.

Renewable energy investments at scale will contribute to support sustained economic growth, including
by strengthening local value chains and supporting local jobs. As factories operate again at full scale,
commercial services return to normal functioning and as new business open, and progress towards
expanding energy capacity and access gains momentum in Africa, supporting investment in energy capacity
and infrastructure will remain fundamental.

Africa should sustain policy attention on increasing the share of sustainable and renewable sources in the
energy mix to enable structural shift towards a low-carbon and more resilient power system. Certainly,
governments must not abandon their climate action commitments in the midst of the pandemic, as the
climate emergency requires sustained climate action. Governments must seize the opportunities to create
jobs and improve vital infrastructure while accelerating the transitions to cleaner energy. More investments
in grid enhancement, interconnections, storage and flexibility solutions are urgently needed for an effective
and accelerated deployment of renewables. The private sector must play its part in complementing public
sector action towards increasing investment and closing the pre-COVID energy infrastructure gap of $90 to
$120 billion USD.

                                                                                                              1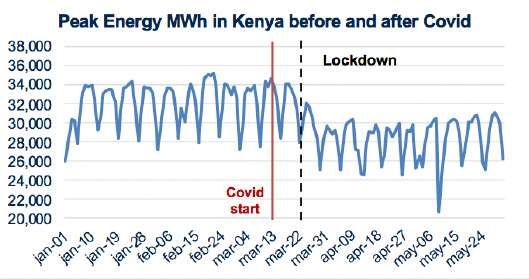
Decisions that governments and public institutions are making now will shape Africa’s development for
years to come.

As African countries look to give their economies a much-needed jolt in the wake of the COVID-19 outbreak:
they can prioritise shifts from decades of polluting, inefficient, high-carbon and unsustainable development,
to low-carbon and increasingly affordable energy and transport systems that will bring long-term economic
benefits. Development partners and the international private sector should play their part by engaging
Africa’s development priorities through productive and impactful collaboration with African governments
towards increased investment for sustainable development.

								Antonio Cammisecra

								President, RES4Africa Foundation

                                                                                                           2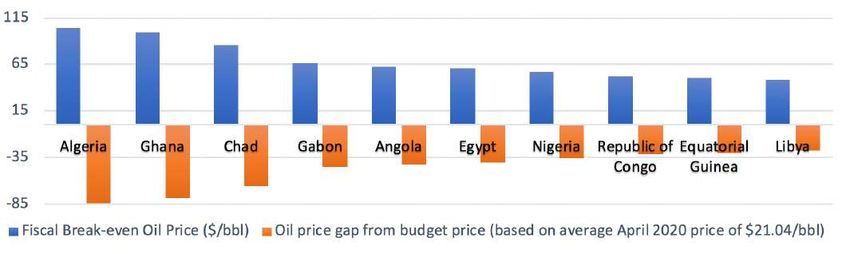
3
INDEX

Index

1.   THE ECONOMIC IMPACTS OF COVID-19 IN AFRICA: FROM MACROECONOMIC SHOCKS TO
     SUSTAINABLE RECOVERY

a.   Economic impacts of Covid-19 in Africa
b.   COVID-19 and its impacts on both the Macroeconomy and the Energy Sector
c.   The electricity sector, its macroeconomic and other miscellaneous impacts
d.   Further Ripple Effects throughout the Economy and recommendations

2.   COVID-19 IMPACTS ON GLOBAL ELECTRICITY SECTOR

a.   The Implications of COVID-19 on the global energy sector
b.   The effects of the pandemic on the electricity demand in world major countries
c.   The change of the electricity supply and the record of renewables in Europe
d.   The impact on investments in renewable energies

3.   COVID-19 IMPACTS ON AFRICAN ELECTRICITY SYSTEMS

a.   North Africa: Tunisia
b.   Western and Eastern Africa: Kenya and Nigeria
c.   Special country focus: Ethiopia by EWiEn
d.   Central and Southern Africa: Mozambique, Zambia, DR Congo, Namibia and South Africa

4.   CONCLUSIONS AND POLICY RECOMMENDATIONS

a.   The role of the electricity sector on African development
b.   The centrality of renewable energy sources
c.   Policy recommendations

                                                                                           4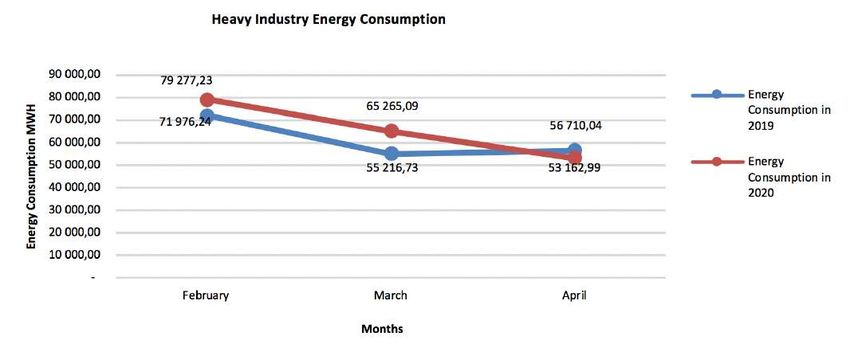
1. The Economic Impacts of COVID-19 in Africa:
     from Macroeconomic Shocks to Sustainable Recovery

Introduction

The last decade has seen rapid economic growth in Africa, enabled by favorable commodity market
performance for key African exports and growing investment in infrastructure and growth-enabling assets in
the continent. Africa’s economy grew by 3.4% in 2017, and moderated to 3.2% in 2018; with growth in Eastern
Africa taking a fast pace at 6.2% in 2018, followed by 3.2% in West Africa, while other regions of Africa
grew moderately (UN Economic Commission for Africa (UNECA), 2019). Implementation of SDGs since 2015
and unprecedented progress concluding the African Continental Free Trade Agreement (AfCFTA) in record
time have improved Africa’s long-term growth outlook. While African economies were on the trajectory to
growth, the unexpected and unforeseen external shock stemming from the Coronavirus (COVID-19) has hit
the global and African with a potential growth thwarting prospect for Africa.

From early January 2020, COVID-19 has spread rapidly from the on-set epicenter to all regions of the world
precipitating diverse set of measures to stem the pandemic. In the U.A.E., cases increased from 664 in early
April to over 34,000 two months later. In Latin America, Brazil saw a sharp increase from a little over 5,000
by April 1 to over 500,000 by June 1. In Europe, cases escalated rapidly from about 67,000 in Germany,
52,000 in France and 106,000 in Italy by April 1 to above 181,000 in Germany, 151,000 in France and 233,000
in Italy by June 1. In Russia, a low level spread of about 2,000 by April 1 has escalated to over 405,000 by
June 1 (Fig. 1). In the United States, an initial onset grew to about 190,000 by April 1, before geometrically
spreading to afflict about 1.7 million people by June 1. This has clearly altered the global macroeconomy
by precipitating moderate to highly stringent measures that resulted in lockdown in many of these leading
global economies. Though these economies have a relatively better health care infrastructure, higher
median age and significant population above the age of 65 have intensified vulnerabilities and relatively
higher death rates.

Figure 1. COVID-19 global spread, response measures and underlying vulnerabilities

Source: based on data from European CDC, shared by https://ourworldindata.org/coronavirus-data. The stringency index is based on nine indicators
including closure of schools and workplace travel bans and measures ranging from 0-100, 100 being the most stringent measure a country takes.

By June 6, out of 6.6 million global cases, Africa reported about 176,000 cases, with new daily infections
of about 6,000 people, representing 2.67% of global infections. Out of nearly 393,000 global deaths
attributed to COVID-19, Africa saw 4,900 deaths representing 1.2% of the global death rate.

                                                                                                                                               5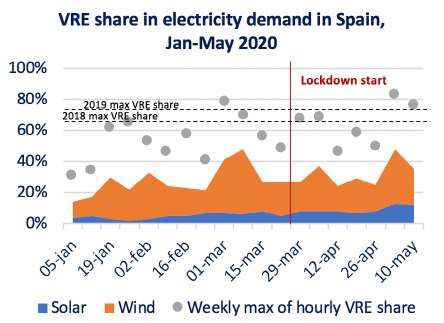
However, UNECA (2020) warns that given the nearly 600 million people (43.5% of Africa’s population) reside in urban
areas, of which 56% reside in congested settlements, and with an average of 1.8 hospital beds per 1,000 people, Africa
faces high risk of escalation. Based on Imperial College Epidemiological Model of 25 March 2020, UNECA (2020)
further warned that under worst case scenario of no governments action, up to 1.2 billion infections are projected;
while under conditions of stringent measures, nearly 123 million infections are expected. While these projections
appear vastly higher than the relatively low livelihoods current levels of infection, what is nonetheless clear is that
African governments have taken one of the stringent measures under lockdown beneficial for public health protection;
however, acutely challenging to and macroeconomic stability.

The economic effect of COVID-19 in Africa largely depends on the response govenrments have given to the trajectory
of the pandemic in their respective countries. Looking at the Africa case regionally, North Africa has seen rapid increase
in infection rates since April 2020. Egypt, Algeria and Morocco are the most affected countries in this region. All of the
North African countries implemented one of the most stringent lockdown measures, mostly rated above 80, out of
100 (Fig. 2). The region has better healthcare infrastructure in Africa, with youthful population. However, relatively high
levels of urbanization and gaps in healthcare capacity pose major risks.

The Southern Africa region has similarly seen increases in COVID-19 infections since April. South Afica has seen a much
higher infection trajectory, increasing from about 1,353 cases by April 1 to over 32,000 cases by June 1 (Fig.2). Gibson
and Rush (2020) have shown that the high infection rates in South Africa are exacerbated by informal settlements
constraining effective implementation of social distancing and other preventive measures. In response, countries have
taken lockdown measures of varying intensity. The relatively low share of population above 65 years old can help
contain death rates; however, healthcare infrastructure limitations can overburden response capacity.

Figure 2. COVID-19 North and South Africa, response measures and underlying vulnerabilities

Source: based on data taken from European CDC, shared by https://ourworldindata.org/coronavirus-data.

                                                                                                                          6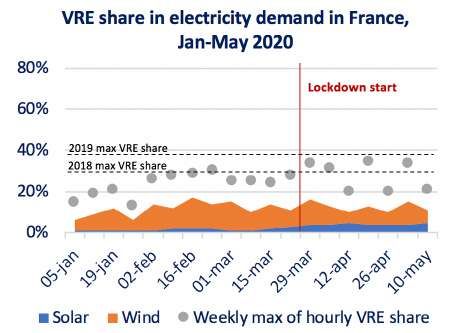
The Central Africa region has also seen COVID-19 infections increase since April, mainly in Cameroon
and Gabon. The region implemented moderate to high stringent response measures in the face of
inadequate healthcare infrastructure in the region. In Eastern Africa, while the demography is largely
young, healthcare capacity concerns and population concentration in urban centers, among others,
have triggered varying restrictions in most countries, including among the stringent measures in
Djibouti, Kenya, Madagascar, Rwanda, Seychelles and Uganda. Rapid increase in infections is observed
in Djibouti, D.R. Congo, Ethiopia, Madagascar and Somalia. In Western Africa, given very limited
healthcare capacity and overall concern about the implications of COVID-19 community transmission
triggered similar restrictions of moderate to high intensity. Cote d’Ivoire, Ghana, Guinea, Nigeria and
Senegal saw significant infection increases since April 1, 2020.

Figure 3. COVID-19 Central, West and East Africa, response measures and underlying vulnerabilities

Source: Based on data from European CDC, shared by https://ourworldindata.org/coronavirus-data.

                                                                                                      7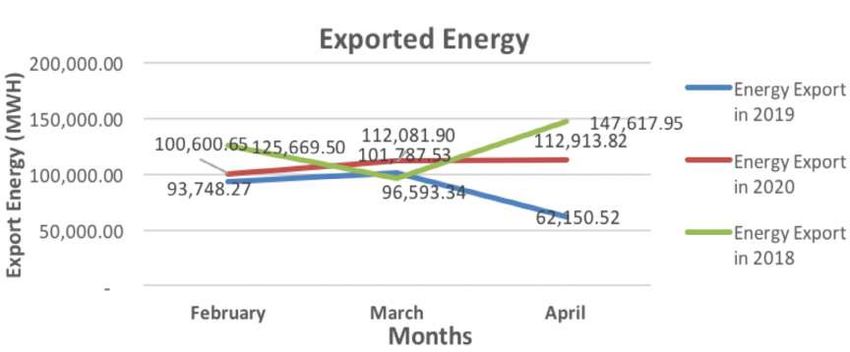
Therefore, despite the relatively low population and COVID-19 infection rates currently experienced in
Africa, compared with all the other regions worldwide, Africa faces vulnerabilities caused by population
settlements, insufficient healthcare infrastructure capacities, healthcare expenditure limitations and
livelihood effects (economic ramifications) triggering the stringent lock-down measures to prevent rapid
infection progression, and perhaps enable timely easing of constraints placed on their economies.
African economies have suffered substantial impacts, threatening to eliminate the progress gained over
the last decade.

a. Economic impacts of COVID-19 in Africa

The COVID-19 pandemic has triggered demand and supply side shocks to African economies. Demand
side shocks are impacted through different channels, including trade and external demand contraction,
oil and non-oil commodity price and demand shocks, and investment effects with consequences on
revenue collection and government expenditure. One of the supply side shocks already realized is in
labor supply, drastically reduced as a result of lockdowns, particularly in manufacturing and service
sectors. The impacts of demand and supply-side shocks in African economies differ depending,
among others, on the structure of their economies, dependence on certain commodities for export,
the extent of trade and investment disruptions, prevailing public finance positions, and the stringency
and duration of public health measures implemented.

Macroeconomic Impacts

On the basis of the UNECA macroeconomic model, and taking into account predictions about
the extent of demand and supply shocks, two scenarios are analysed: best-case and worst-case
scenarios. As a result, GDP growth rate for 2020 is expected to decline from 3.2% to 1.8% under best-
case scenario; however, if the level of shock is heightened, the worst-case scenario forecast will be a
GDP contraction of 1.4 to 2.5% (UNECA, 2020). This slower growth has major implications to poverty
reduction and employment growth in the continent. Based on the growth forecast, UNECA estimates
that between 5 million – 29 million people could fall back to extreme poverty for a period of time from
the reference 2020 African forecasted growth scenario. While majority of those who fall into poverty
are expected to be transient, a small percentage are expected to stay in extreme poverty for longer
than a decade.

In terms of employment, the International Labor Organization (ILO) forecasts that Africa will face
19 million job losses largely due to closures (ILO, 2020). Countries have already faced pressure
related to stringent lockdown measures and unintended consequences to livelihoods, including loss
of employment and income, particularly for those in the informal economy. ILO statistics indicate
that the share of employment in the informal sector from total non-agricultural employment is above
70% in Cote d’Ivoire, Cameroon, Comoros, Ghana, Madagascar, Mali, Mozambique, Mauritania, Niger,
Senegal, Togo, Tanzania and Uganda. For Africa, the share is 71.9%. As a result, lockdowns and
resultant economic disruptions is having negative employment impacts mainly in the informal sector.

                                                                                                       8
Beyond employment and household income effects, the lockdown is also having major impact on
public finance. The 2019 Economic Report on Africa (ERA) of ECA, which focused on fiscal policy
in the continent, indicated that Africa already had low tax-to-GDP ratio of 13.4% by 2018. The onset
of COVID-19 and resultant public health protection measures are expected to lead to significant
reductions in revenue collection (taxes). In contrast, expenditures are expected to rise, particularly in
healthcare and social protection. Under best case scenario where African governments take stringent
public health protection measures, UNECA (2020) estimate that an additional $44 billion will be
required to meet COVID-19 related healthcare expenditure. Social protection needs, such as allocation
of food and other necessities to the vulnerable will require additional resources, constraining the
already dissipated revenue, leading to deficits.
These macroeconomic conditions have led to currency depreciation pressure in numerous economies.
Currency value instability (see Fig. 4) ranges from less than 5% in Rwanda and Guinea to major
disruptions in Botswana, Angola, Zambia and South Africa to 15-25%. Oil and commodity exporting
countries are particularly hit hard. The Central African Economic and Monetary Community (CEMAC)
will be “severely” impacted by oil price drop precipitating shortage of foreign currency and likely
strengthening devaluation of the CFA (African Union, 2020).
Figure 4. COVID-19 and depreciation of currencies in Africa
0
-10
-20
-30
Ethiopian Birr
Mozambican Metical
Ghanaian Cedi
Ugandan Shilling
Kenyan Shilling
Nigerian Naira
Botswanan Pula
Angolan Kwanza
Zambian Kwacha
Guinean Franc
Mauritian Rupee
South African Rand
Rwandan Franc
Congolese Franc
Source: fitchsolutions.com; Bloomberg.
Current fiscal conditions, an unstable macroeconomic environment and the need to re-invigorate economies
through semi-stimulus packages requiring a major international call for economic stabilisation support, and
hence, a quick response from financial institutions worldwide. Public debt is expected to rise. Prior to the
outbreak of COVID-19, 22 African countries had already recorded a debt-to-GDP ratio above the continental
average of 61% (UNECA, 2020). Timely efforts are needed in order to stabilise the macroeconomy through
the infusion of new capital; however, this will have long-term effects due to the accumulation of further
public debt during the post COVID-19 period. This is the reason for UNECA’s urgent call to plenish an initial
$100 billion to ensure economic stabilisation in Africa, alongside a 1-year debt-servicing freeze window in
order to provide fiscal space in the fight against COVID-19.
9b. COVID-19, the Macroeconomy and Energy Sector Impacts
Macroeconomic Impacts in Oil and Gas Exporting Countries in Africa
Restrictions in the travel, commercial, services and manufacturing sectors have led to a global demand
shortfall leading to plunges in oil and gas prices. While extreme and very short lived, oil markets even
registered negative prices on April 22, 2020. This trend clearly benefits oil importing countries; however, oil
exporting African countries are hard hit.
Figure 5. Crude oil and natural gas prices (January 2019 – April 2020)
Crude oil, average ($/bbl) Natural gas, US ($/mmbtu)
80 4,00
60 3,00
40 2,00
20 1,00
0 0,00
2019M01
2019M02
2019M03
2019M04
2019M05
2019M06
2019M07
2019M08
2019M09
2019M10
2019M11
2019M12
2020M01
2020M02
2020M03
2020M04
2019M01
2019M02
2019M03
2019M04
2019M05
2019M06
2019M07
2019M08
2019M09
2019M10
2019M11
2019M12
2020M01
2020M02
2020M03
2020M04
Source: US Energy Information Administration.
Plunging oil prices had two impacts – decline in export receipts and further budget impacts as 2020
expenditures were planned based on high oil price expectations. For budgetary purposes, oil prices were
forecasted to be above $85/bbl in Algeria, Chad and Ghana, and between $55-$70/bbl in Angola, Egypt,
Gabon and Nigeria. Therefore, unanticpated plung in oil prices below the budgeted price target introduces
fiscal distress. Public debt is required to close this fiscal gap; therefore, placing further strain on the already
narrow fiscal space.
Figure 6. Fiscal distress in Africa’s oil exporting countries
Source: Analysis based on data from multiple sources, such as IMF, national documents, budget documents, Fitch’s forecast, and Ministerial
statements.
10Beyond the fiscal effect of the unexpected oil price plunge, the actual price reduction has destabilised the
macroeconomy in oil-exporting countries including the deterioration of national currencies. In Equatorial
Guinea, Chad and Algeria, current account deficits exceeded 10% of the GDP. The net borrowing position
has deteriorated in Angola, Equatorial Guinea, Libya and Algeria. The disruption caused by the Covid-19
shock in oil-dependent countries is alarming.
Figure 7. Current Account Balance (% GDP) and net lending/borrowing position
Source: Analysis based on data from the IMF.
c. The Electricity Sector and its Macroeconomic and Other Impacts
The public health measures to contain COVID-19 has diminished energy demand at large, and
electricity demand especially in the commercial and industrial demand classes. Furthermore, economic
recovery will require availability of adequate and stable electricty supply. On employment, Mensah
(2018) argues that electricity shortages reduce the likelihood of employability by 35 to 41% due to
effects on industry, export setors and overall competitiveness. The implication of this is that power
shortages will undermine the recovery process in labor markets. Furthermore, in a study focused on
Africa, Burke and Csereklyei (2016) demonstrated that industrial output response to electricity supply
is slightly elastic (1.06), and that a 1% GDP growth is associated with 0.66% additional demand from
households, 0.53% additional demand from the services sector and 1.06% more demand from the
industrial sector. Therefore, through direct and indirect linkages, the performance of the electricity
sector is linked to a degree with macroeconomic conditions.
11The effect of COVID-19 on the electricity sector of Africa is mixed. From a generation perspective, drastic
declines in heavy fuel prices have reduced electricty generation cost in high share of thermal generation
countries (Fig. 8). Eritrea, Senegal, Niger, Benin and the Sudan have over 40% reliance on thermal generation,
benefiting from lower oil prices. The benefit is unlikely to pass to consumers due to tariff regulation. In
these countries, it is an opportune time to invest the windfall gain towards diversification to sustainable and
domestic energy sources that will reduce fuel-import dependence long-term.
Figure 8. Oil share in electricity generation in Africa
Source: Analysis based on data from the International Energy Agency.
Spill-over effects in energy commodities are observed in coal and natural gas markets. For African countries
reliant on coal and natural gas as major baseload power, the windfall gains from lower input prices are not as
strong as heavy fuel-based electricity systems; however, appreciable declines in coal and natural gas prices
offer the scope to reduce generation costs for supplies not governed by preexisting contracts with locked
prices. These benefits should strategically be invested in creating new generation capacity from sustainable
energy sources to accelerate energy transition. Beyond macro level impacts, further effects of COVID-19 on
the electricity system of Africa are analyzed in-depth in this report. Strategic areas of intervention in COVID-19
recovery within the sector include the following: (1) sustaining investment in energy infrastructure in Africa,
including through deepening the participation of private capital; (2) addressing regulatory and business
climate to complement constrained public resources with private sector investment; (3) accelerating energy
transition while expanding energy access; (4) addressing the challenge of transmission and distribution
systems upgrade and expansion with effective participation of investment under public, private and
public-private partnership models; and (5) amidst a public health emergency and requirements for public
expenditure in socail protection and health, finding a fiscal space for capital expenditure in infrastructure to
support sustainable recovery and growth in Africa.
12Figure 9. Share of coal and natural gas in electricity supply and their prices
Source: Analysis based on data from the US Energy Information Administration and the International Energy Agency.
d. Further Ripple Effects in the Economy
Demand and supply side shocks induced by COVID-19 will lead to cutting growth prospects in Africa in
2020 and beyond. Certain sectors; however, are particularly hard hit. As a result of lockdown measures,
particularly travel bans, Africa’s aviation industry came to a halt, except for repatriation and cargo services,
disrupting travel of estimated 77 million annual travelers. The UNECA report (2020) assesses that the
industry supports 6.2 million jobs and contributes 56 billion USD to Africa’s GDP. Therefore, COVID-19 will
have major employment and GDP effects, amplified by the duration of the lockdown and anticipated lag
before demand returns to pre-COVID levels.
A direct implication from travel bans is the full effect on the tourism sector, particularly in countries that
heavily rely on the sector, such as Cote d’Ivoire, Egypt, Kenya, Mauritius, Morocco, South Africa, Tunisia,
Uganda and Zimbabwe. The sector contributes an average of 8.5% to GDP in the continent, and brings over
1.4 billion visitors per year, 95% of which are from outside Africa (UNECA, 2020). Therefore, the economic
impacts of travel bans are consequential.
Beyond air transport, logistics is also disrupted causing economic implications. More than 90% of global trade
is sea-bound. Measures taken in the sea freight industry include 14-days quarantine, reduced sea transport
frequency, closure of some terminals (except for essential cargo), connecting road transport constraints and
reduced number of trucks, and additional border inspection and control mesures have increased the cost of
13transit. For most African countries already facing higher transport component in their export commodities,
these additional logistical costs reduce competitiveness and impose higher import prices. Specific measures
such as Tunisia’s closure of maritime entry points, congesion in Cameroon’s Douala Port, and restriction on
crew disembarkement from vessels in Eritrea are examples. Overall, compared with similar period in 2019,
2020 forecasted container activity in Africa is expected to decline by 12% (UNECA, 2020).
Finally, another notable ripple effect of COVID-19 on Africa’s economies was the effect on remittances.
Due partly to rising unemployment and economic uncertainties in different regions of the world, Africa’s
diaspora has reduced remittance transfers from the expected $65 billion in 2020. This will particularly impact
remittance-dependent countries, such as Comoros, Egypt, the Gambia, Lesotho, Liberia, Senegal, Togo and
Zimbabwe where remittances account for 8 to 21% of GDP (based on 2015 World Bank remittance data).
Given the expected global economic recession, the negative remittance effect of COVID-19 is expected to
last at least in the short term. This will further constrain balance of payments, and public finance.
Macroeconomic recommendations
The onset and spread of the COVID-19 pandemic has caused negative macroeconomic and sectoral impacts
with effects that could be felt into the medium term. Growth is expected to slowdown, public debt will rise,
public finance is constrained, trade is disrupted, travel is halted, and millions of livelihoods are disrupted,
thus continually eroding the gains of poverty reduction in the last decade. Overall, economic and social
vulnerabilities have increased. Countries are facing three fundamental challenges. First, COVID-19 has
imposed painful trade-offs between public health security related lockdowns and severe economic impacts
that require lifting constraints on the economy. Balancing these dual challenges continues to grapple
policymakers. Second, countries are pursuing diverse strategies to contain COVID-19 such that common exit
strategy and return to relative normalcy within a broader regional and global system has proven complex,
leading in some cases to bubble solutions. Third, the duration through which painful measures can be
sustained in the face of millions of livelihoods at stake has complicated policy choices.
The UN framework for the immediate socio-economic response to COVID-19 (UN, April 2020) offers the
following recommendations:
• Health First – protecting health services and systems during the COVID-19 crisis
• Protecting People – providing social protection as well as basic services
• Economic Response and Recovery: protecting jobs, Micro, Small and Medium Enterprises (MSMEs) and
informal sector workers
• Macroeconomic Response and Miltilateral Collaborations – macroeconomic stability support to countries
and international collabrations to address the economic effects of COVID-19
• Social Cohesion and Community Resilience – solidarity and social dynamism to deal with the ramifications
of COVID-19.
14UNECA advocates the following policy measures to moderate the effect of COVID-19 on African economies:
• Mobilize $100 billion as a fiscal stimulus to address health and social safety net, and other economic
challenges
• Mobilize a further $100 billion for Africa’s private sector via special drawing rights to provide liquidity and
access to foreign exchange
• Initiate temporary debt service standstill for two years for all African countries
• Ensure access to the IMF Emergency Financing Facility and increase special
• drawing rights allocations to enhance liquidity
• Speed-up budget support through fast disbursement facilities, such as the Crisis Response Window, the
Global Pandemic Window and reprogramming other support programs at the World Bank Group; solicit
significant support from the European Union and other Group of 20 members.
References
African Union. 2020. “Impact of the Coronavirus (COVID 19) on the African Economy.” AU, Addis Ababa, Ethiopia.
Economic Commission for Africa. 2020. “COVID-19 in Africa: Protecting Lives and Economies.” UNECA, Addis Ababa, Ethiopia.
Fiscal Policy for Sustainable Development in Africa. UNECA, 2019. Available [Online] at https://www.uneca.org/sites/default/files/
PublicationFiles/era-en-final-web.pdf.
International Labour Organisation. 7th April 2020. “COVID-19 causes devastating losses in working hours and employment.”
Available [Online] at www.ilo.org/global/about-the-ilo/newsroom/news/WCMS_740893/lang--en/index.htm.
Mensah, J.T. 2018. “Jobs! Electricity Shortages and Unemployment in Africa.” Policy Research Working Paper 815. The World Bank,
Washington, D.C., USA.
Paul J. B. and Z. Csereklyei. 2016. “Understanding the Energy-GDP Elasticity: a Sectoral Approach.” Centre for Applied Macroeconomic
Analysis, Austrian National University. Available [Online] at https://core.ac.uk/download/pdf/156709088.pdf.
152. COVID-19 impacts on global electricity sector
It has long been acknowledged in the literature that economic growth has been the most important driver
of energy demand. Furthermore, electricity demand has historically increased at a higher rate than both the
Gross Domestic Product (GDP) and the total energy demand. Although in recent years economic activity
and power demand have begun to decouple - mainly thanks to energy efficiency, the penetration of new
technologies and the decline in energy intensity of the GDP – there is wide consensus regarding the fact that
access to reliable energy still represents the backbone of any country’s economic development. Moreover,
today more than ever, it has been confirmed that a reliable power system plays a crucial role in supporting
healthcare systems worldwide during global crisis such as the one the world is now suffering1.
a. Implications of COVID-19 on the global energy sector
Since January 2020, in order to limit the spread of the virus, governments around the world have enacted
new measures restricting social and economic activities. Today, certain countries are starting to ease the
measures they have imposed, aiming to gradually come out of lockdown over the forthcoming months;
however, COVID-19 impacts are likely to last for a long time with shock waves on the global economy
and, as a consequence, on the energy sector. Indeed, data published in mid-April shows that countries
under full lockdown experienced an average 25% decline in energy demand per week and those under
partial lockdown an average 18% decline2. Generally speaking, assuming a gradual easing of lockdown
measures, even if some energy uses – such as residential consumption – have been unaffected or even
more pronounced, the latest forecasts suggest that the annual global energy demand will drop by 6% in
2020, the largest shockwave of the past 70 years3 (see Fig. 1.1). This decline will occur in all major regions,
yet advanced economies will experience it the most. Indeed, in the European Union and the United States,
demand is likely to fall by around 10% to below levels witnessed in 2019.
Figure 1.1 Rate of change of global primary energy demand, 1900-2020
30
Spanish Flu
Great depression
World War II
First oil shock
Second oil shock
Financial crisis
25
20
15
10
5
0
-5
-10
-15
-20
1900 1910 1920 1930 1940 1950 1960 1970 1980 1990 2000 2010 2020
Source: IEA 2020
1
Energy access takes centre stage in fighting COVID-19 and powering recovery in Africa, The World Bank 2020
2
Global Energy Review 2020, IEA 2020
3
Ibidem
16Fossil fuels were the energy sources mostly affected by the drop in energy demand and, during the first
quarter of the year, the hardest hit source was coal mainly due to a significant reduction of electricity needs
and competition from the cheapest natural gas. Travel restrictions, as well as a sharply reduced demand
from shipping and aviation industries, contributed to a fall in oil demand that could drop by an average of
9% across the entire year. Moreover, even if the demand for natural gas declined only by around 2% during
the first quarter of 2020 - softened by continued low prices - the annual gas demand could fall much further,
due to a reduced consumption of power and industry applications.
In this scenario, renewable energy sources were the only energy typology to witness an increase in demand
during the first quarter of the year and the latest forecasts suggest that this data is expected to be positive
throughout the entire year, mainly due to falling operating costs and preferential access to many power
systems (see Fig. 1.2). Although several projections suggest that renewable added capacity in 2020 will be
13% less than the previous year, renewable power sources have so far showed impressive resilience despite
changes and disruptions caused by the Coronavirus pandemic and their growth is expected to resume
rapidly within a short period of time4.
Figure 1.2 Projected change in primary energy demand by fuel in 2020 relative to 2019
2,0%
0,8%
0,0%
-2,0%
-2,5%
-4,0%
-6,0% -5,0%
-6,1%
-8,0%
-7,7%
-10,0% -9,1%
Total energy Coal Gas Oil Nuclear Renewables
demand
Source: IEA 2020
Another consequence of the COVID-19 pandemic is the widespread re-shaping of financial trends in
the energy sector that will lead to a fall by one-fifth in energy investments during 2020, as stated in the
latest report published by IEA in mid-May. Indeed, data suggests that investment cuts are occurring as a
consequence of lower demand and reduced earnings (particularly severe in the oil industry) and due to
the practical disruption to investment activity caused by the lockdown measures5. This decline occurs in
situation that was already negative for energy investments in terms of GDP that have declined over recent
years and are now expected to fall below 2% in 2020. This trend is of particular concern, and has to be
reversed in order to meet rising global needs and to address climate change. However, even if renewable
investments declined due to COVID-19, in any case they are expected to recover in 2021.
4
Renewable energy market update, IEA 2020
5
World energy investments, IEA 2020
17b. The effects of the pandemic on electricity demand in the rest of the world
Before going into further details regarding the effect the pandemic has had on the African electricity
market, it is important to understand the reaction of the rest of the world to this crisis, that has also left
its mark on the African energy sector. The lockdown imposed by the COVID-19 emergency has led to
inevitable consequences on the electricity consumption of several regions worldwide. Different economies
have responded in different ways as can be seen in the next chapter. In fact, electricity demand in many
countries has experienced a significant decline following the introduction of confinement measures aimed
at containing the pandemic.
Every month of full lockdown witnessed a decrease in electricity demand by an average of 20%, with a trend
similar to that which would be experienced on a prolonged holiday break6. More specifically, the global
electricity demand declined by 2.5% in the first quarter of 2020, when compared to 2019 values. China
was the first to introduce containment measures, starting in mid-January, experiencing the world’s largest
demand reduction of 6.5%.
On the other hand, the residential electricity demand registered an increase as a consequence of lockdowns.
However, the dramatic reduction of industrial and commercial businesses, as well as the suspension of a
large portion of service sector-related activities, has more than offset the growth of household consumption.
Countries adopting more stringent containment measures showed a sharp contraction of the demand. The
case of Italy, one of the worst affected countries in Europe, is a prominent example: the electricity demand
plummeted by more than 25%, with a significant drop in electricity consumption coming from the service
sector, i.e., 75% lower when compared to the last year.
Furthermore, the electricity demand showed the first signs of recovery following the softening of the
restriction measures. The demand, after correction due to effects caused by the weather, in most countries
dropped 10% below the original values recorded prior to the introduction of the first lockdown measures,
except for India, where the recovery has been more pronounced.
The IEA estimates that the global electricity demand will decline by 5% this year, reaching the lowest
numbers ever. The impact of the pandemic on electricity demand would represent the largest decline since
the economic crisis suffered in the 1930s and would be eight times the reduction recorded in 2009 following
the global financial crisis.
6
Global Energy Review 2020, IEA 2020
18c. The change in electricity supply and the record of renewables in Europe
The lockdown measures introduced following the spread of the virus did not only affect the electricity demand
on a global scale but it also considerably influenced the electricity generation as well as the electricity mix.
On the other hand, the electricity mix has shifted towards Renewable Energy Sources (RES), especially
wind and solar PV power. Renewable Energy Source-based generation increased by 3% and the share of
renewables in electricity supply neared 28% in Q1 2020, a 26% increase from Q1 2019. Hence, the strong
decline in electricity demand due to the closure of businesses, combined with the low operating costs of
renewables and their priority access to the grid, led to the increase in many countries of the green electricity
share.
Figure 1.3 – Electricity mix in different countries worldwide that implemented lockdown measures
Source: IEA, Statistic Report, May 2020
Observing what happened to the electricity mix in different countries (Fig. 1.2), it is relatively clear that the
share of renewables significantly increased following the introduction of lockdown measures combined
with a reduction in fossil fuels, especially coal. As reported by the IEA, China had the largest reduction in
coal-fired power generation (approximately 100 TWh), whereas in India the gap between the share of coal
and renewables has considerably narrowed. In the USA, natural gas has continued to play a crucial role as
a primary source of electricity, yet at the same time RES have overcome the contribution of coal-fired power
plants.
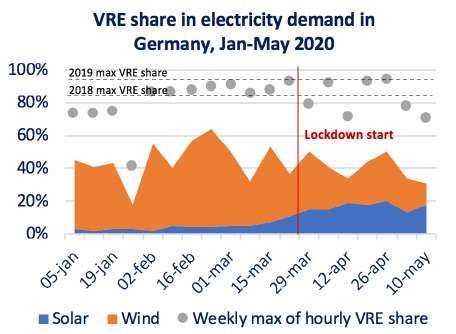
Similarly, there is strong evidence of RES-related growth in the electricity mix of European regions and certain
countries reached new records in the share of variable Renewable Energy Sources (Fig. 1.4), especially Italy,
Spain and Germany. These countries were able to absorb large percentages of hourly VRE share, also close
to 100% in the case of Germany, without incurring any disruption of the electricity grid. Furthermore, as
reported by the IEA, the share of variable renewables continues to remain high as lockdown measures are
easing.
19Figure 1.4 – VRE share in electricity demand of France, Germany, Italy and Spain, Jan-May 2020
Source: IEA, Statistic Report, May 2020
In the UK7, wind power also reached record levels during the first quarter of this year. In fact, wind power
supplied 30.5% of Britain’s electricity, driving the supply coming from all RES to over 40% of the total power
consumed, overtaking fossil fuels for the first time. At the same time, due to the weak electricity demand
caused by lockdown measures, generation of fossil fuels was down 25% during Q1 2020 when compared to
2019, the largest fall ever recorded.
Gas-fired power stations ran at an average of just 38% of their installed capacity over the quarter (a much
lower use than onshore wind farms). However, when the electricity demand peaked and renewable output
was low, there was still the need to rely on fossil fuel-generating power plants, especially gas.
Indeed, these last months represented a proper “stress test” for grids worldwide, that were also able to
cope with a combination of larger portions of VER and a lower electricity demand. Referring back to Italy,
the strong hydroelectric component within the electricity mix allowed variable renewable energies to be
balanced. In this case, of course, thermal power plants have not been completely shut down but were kept
at minimum levels, in order to guarantee the grid stability in case of unforeseen events.
Thus, in Europe and Asia, especially in countries that experienced stringent lockdown measures, the
pandemic did not stop the growth of renewables that showed a remarkable resistance emphasising the
huge potential of green energy sources for the future of our planet.
7
Electric Insights Quarterly – Q1 2020.
20d. The impact on investments in renewable energies
Before the COVID-19 crisis, new RES installations were expected to reach record levels in 2020. However,
due to the impact of the pandemic, the power sector was considerably struck by the disruption of global
supply chains and the delay of renewable energy projects.
The world is going to generate a lower amount of RES capacity this year, marking the first annual decline
in new additions in 20 years, according to the latest update8. However, RES investments are expected
to recover in 2021 with most of the delayed projects being implemented also supported by government
policies (Fig. 1.5). In fact, despite the fact that RES have been severely affected by the COVID-19 crisis,
they have proved to be more resilient with respect to fossil fuels and the pandemic could represent an
opportunity for their development.
Furthermore, according to the IEA, the COVID-19 crisis is going to exacerbate existing challenges that
renewable energies are currently facing, starting with the rooftop solar PV as investors lack short-term
liquidity and need to re-prioritise spending. The pandemic is going to impact hard all countries worldwide,
especially China, Europe, and India, with a negative impact on financing in Africa (Figure 1.6).
Figure 1.5 - Renewable net capacity additions
Source: IEA, Renewable Energy Market Update - Outlook for 2020 and 2021
Figure 1.6 - Renewable capacity addition revisions in 2020 and 2021
Source: IEA, Renewable Energy Market Update - Outlook for 2020 and 2021
8
Renewable Energy Market Update - Outlook for 2020 and 2021
213. COVID-19 impacts on African electricity systems
In order to give a more comprehensive view of what occurred in Western, Eastern and Southern countries on
the African Continent, data will be shown according to a scheme that summarises, first of all, data regarding
access to electricity, the final power consumption rate as per sector and the lockdown measures adopted.
Then, data will focus on the trend of the electricity demand (expressed in the majority of cases only in MW),
due to data limitations and, when available, how it changed with respect to previous years.
With regards to Nigeria, we were not able to provide a complete framework due to the lack of data relating
to the electricity trend. However, it is an interesting case to mention since the demand would seem to have
behaved in a totally different way with respect to the countries analysed in the rest of the world. Thus, in this
paragraph, the way in which the lockdown measures imposed by the COVID-19 emergency has impacted
on the power demand will be discussed, starting with Western and Eastern Africa and concluding with the
analysis of Southern African countries.
a. North Africa: Tunisia
Tunisia
COUNTRY DATA:
• Electricity access (IEA, 2019):
99,8%
• Electricity final consumption by
sector (IEA, 2017):
• Lockdown measures adopted:
− 18th March: curfew prohibiting
outdoor movement from 6 pm till 6
am.
− 20th May: general confinement.
Source: 1) MEMTE 2020 2) Athir Nouice, The Tunisian power sys-
− 4th May: selective lockdown tem and the COVID-19 pandemic. FSR, 13th May, 2020
Following the onset of the lockdown, over the period ranging between 19th March to 30th March, the daily
electricity generation dropped from 47,469 MWh to 33,263 MWh9.
9
Athir Nouice, The Tunisian power system and the COVID-19 pandemic. Florence School of Regulation, 13th May 2020.
22Despite an increase in household consumption, April registered a 20% reduction in overall electricity demand
compared to the same period in 2019. In the same month, the evening peak recorded on 1st April in 2019
was 2,398 MW, while in 2020, it registered only 2,067 MW. During the spring months, energy consumption
reached its minimum levels compared to the rest of the year. However, in 2020, the off-peak rate recorded
its lowest values for decades.
Furthermore, due to the reduction in electricity demand and the closing of certain industries, there was
a 26% decrease in the natural gas demand compared to the same period in 2019 and a 16% decrease in
gas demand for the electricity sector. Thus, just as in most countries around the world under confinement,
the electricity demand in Tunisia has experienced a significant reduction with negative effects also on gas
demand.
b. Western and Eastern Africa: Kenya and Nigeria – Special focus on Ethiopia
Kenya
COUNTRY DATA:
• Electricity access (IEA, 2019): 75%
• Electricity final consumption by
sector (IEA 2017)
• Lockdown measures adopted:
− 25th March: national lockdown
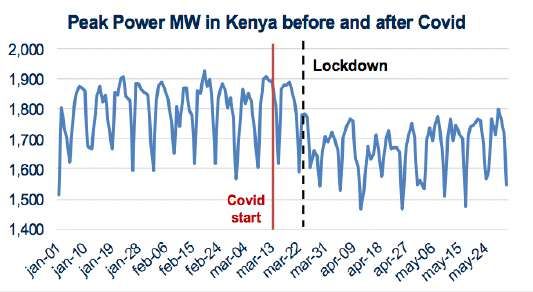
In Kenya, the lockdown measures resulted in a drop in peak power, compared to two months prior to the
COVID-19 outbreak (January and Feb 2020), of approximately 6.5% (i.e. 117 MW) and in energy around 11%
(3,609 MWh).
Kenya is facing a rigid lockdown and some fundamental sectors for its economy such as the tourism sector
have been dramatically affected by the global pandemic resulting in a decrease in energy consumption.
23Special Focus on Ethiopia by EWiEn (Association of Ethiopian Woman in Energy)
This section assesses the impact that measures taken to prevent and control the COVID-19 pandemic has
had on the Ethiopian electricity sector. The report covers the period from February to April 2020.
Ethiopia has been recording cases of COVID-19 infection since mid-March. Accordingly, different restrictive
measures have been issued by the government to prevent and control the public health crisis. The impact
of these restrictions has also been observed on the electricity sector in Ethiopia, although this impact can
be considered as mild. The overall trend of the energy supply witnessed in February, March and April
2020 did not show any significant change, compared to the trend in the same months in the previous two
years. However, power consumption in the country underwent a decrease while exported energy through
interconnection experienced an increase. From the power consumption in the country itself, the commercial
sector was significantly more affected by such measures compared to the industrial and residential sectors.
Introduction
Since COVID-19 was declared by the World Health Organisation as a global pandemic on 11th March 2020,
Ethiopia has adopted several prevention measures. The first case of contagion in Ethiopia was recorded
on 13th March 2020. In order to prevent and control the pandemic, the Government of Ethiopia passed the
following resolutions.
• On 16th March 2020, the directive to close schools throughout the country was passed and public
gatherings were suspended, as publicly announced by the Prime Minister via mass media. (7)
• On 20th March 2020, the directive introducing a 14-day quarantine period for every air traveller entering
Ethiopia was passed, becoming effective as of 23rd March 2020. Moreover, on the same date, all
cross-border transport services, with the exception of essential goods were suspended. (8) At the time
of the announcement, the number of confirmed cases of infection amounted to 11. It is believed that
this directive marked the beginning of the economic effect due to COVID-19 restrictions, especially
influencing the service sector.
• On 8th April 2020, a state of health emergency was declared. On 18th April 2020, a state of health
emergency declaration and guidelines were approved by the House of Representatives. The general
guidelines gave directives with regard to a new transport scheme, changes in working hours and
conditions. The working conditions guidelines included directives to reduce the numbers of employees
working in the federal public and private sectors in order to avoid crowding of working places and
inappropriate working conditions. Based on the general directives, all federal public sectors saw their
workforces reduced by at least 50% (5). When the state of health emergency was declared, the number
of recorded cases of infection reached 96.
At the time this report was completed, lockdown measures had still not been enforced in Ethiopia.
The effect of COVID-19 on the Ethiopian economy partly depends on the structure of its economy. The
service sector is among the leading sectors in terms of GDP contribution and employment creation. This
sector has proved to be one of the sectors that has been the most vulnerable to COVID-19, according
to the report of the Planning and Development Commission of Ethiopia published on 25th April 2020.
More specifically, certain subsectors including tourism, airlines, hospitality (Hotels and Restaurants) and
24distribution services will be hit particularly hard due to the travel ban. The manufacturing sector in Ethiopia
is dominated by labour-intensive industries that will be impacted by measures to implement physical
distancing. Employment distribution in Ethiopia shows that the Hotels and Restaurants category takes up
5.6% of the employment distribution share and Industry, especially the manufacturing sector, takes up to
12.3% of the total employment distribution share. (6)
Both sectors, highly dependent on power supplies, are considered to have been severely affected by the
pandemic. In this section, the power supply trend has been reviewed and analysed over the last three years
to determine the impact of the pandemic on sectors between the periods ranging between February and
April 2020.
The Ethiopian Power Supply Trend
Ethiopia’s power supply is mainly dependent on hydro-power generation which accounts for up to 95.6%
of the daily MWH production. The remaining 4.4% of the power supply is generated by wind and thermal
energy. As shown in reports issued by the Ministry of Water, Irrigation and Energy, the power supply coverage
in the country reaches a peak of 71% based on access to the power grid. Other reports show that household
connections to the power grid are much lower than 44.98% (9). Beyond the domestic demand, the Ethiopian
power system also supplies electricity to neighbouring countries of Djibouti and the Sudan. The grid supply
trend in the months of February, March and April over the past 3 years is shown in Figures 1 and 2.
As can be seen in Fig. 1, the peak generation in
April 2019 significantly decreased due to the ‘load
shedding’ of EEP to tackle the power generation
shortage at the Gilgel Gibe-3 hydropower plant.
Fig. 1 - maximum daily peak power supply (mw) in February, march
and April over the past 3-year period.
Fig. 2: Total energy supply in February, March and April over the past
3-year period
25The amount of energy supplied in 2020 has been higher throughout the three-month period in question
when compared to 2018 and 2019 (Fig. 2). The rise in energy supply can be attributed to the increase in
generation capacity that resulted in the implementation of a new grid network connection as well as new
load demands. For instance, in 2020, two new generation plants were connected to the grid. Reppi Waste
to Energy Power plant with a 25 MW generation capacity became operational on 1st January 2020 and the
Genale Dawa (GD3) hydro-power plant with a 254 MW generation capacity became operational on 20th
March 2020. Hence, the total amount of energy generated has increased to 3,717,523.16 MWh. In addition,
as from 1st January 2020 a new heavy industry load namely Wonji Sugar factory was connected to the
power grid network.
On the other hand, when comparing the amount of energy supplied between the months of February, March,
and April in 2020, this latter month shows a declining supply trend.
Sector-related power consumption
The Ethiopian power grid supply can be divided into three main wholesale customers, namely the Utility
customers, heavy industries and the power grid system (energy export) connected to neighbouring
countries). The Utility customer is responsible for power distribution and retail to residential and commercial
customers as well as medium and low-voltage industries. Heavy industries on the Ethiopian power grid
include categories of customers that have dedicated substations or intakes of dedicated high voltage lines
amounting to 132 kV or more.
A. Heavy industry power consumption
Heavy industries in Ethiopia mainly consist of construction material manufacturers such as concrete-
producing and steel working factories. Out of the 13 industries in this category, 9 of these are construction
material manufacturers. The power supply to heavy industries on average accounts to 5.6% of the country’s
total energy production, relating to the months under consideration. The data shown in Fig. 3 shows the
energy supply to heavy industries in 2019 and 2020.
Fig. 3: Heavy industry energy consumption from February to April in 2019 and 2020.
26Comparing the three months under study in 2019 and 2020, the power supplied to the heavy industrial
sector has increased by 6.9%. However, comparison made between these three months in 2020 shows that
supply has declined from February to March and then from March to April by 17.7% and 13.11%, respectively.
Considering no particular measure has been passed to restrict construction activities in the country, a major
impact on energy consumption in this category is not expected in the near future.
B. Exported energy
The Ethiopian power grid network exports power through interconnection to Djibouti and the Sudan. The
graph below shows the energy retail trend over the three months under study over the last three years.
Fig. 4: Exported energy – from February to April in 2018, 2019 and 2020
• The amount of energy exported in 2018 plummeted in March and a relatively similar supply trend was
experienced in both February and April. 2019 also showed a sharp fall in April, which could be attributed
to a power generation shortage in the country, due to a water level decrease at the Gibe-III HPP, the
largest functional dam in Ethiopia. However, to date, the 2020 trend has witnessed a much flatter curve
related to exports over the three-month period.
• When comparing 2019 and 2020, the energy exported in this latter year has experienced a 21% increase.
• In addition, when comparing the energy exported between the months of February, March, and April
2020, the energy exported in April 2020 increased by 10.9% and 0.74%, respectively compared to
February and March 2020.
This shows that there had been no impact on energy export figures due to COVID-19-related measures.
C. Power Consumption in Residential, Commercial, Medium and Low-Voltage Industries
The Ethiopian Electric Utility (EEU) company provides power to residential and commercial customers
as well as Medium and Low-Voltage industries. Considering that the Ethiopian power sector unbundling
process is still in progress, direct data relating to power supplies from the grid operator to the distributor
and retailer is not currently available. At the same time, since the invoice and billing data recording system
was initiated after November 2019, consumption data regarding the months in question was only available
for 2020. Besides, measuring the MWh demand at all substation feeders is a demanding feat as Electricity
Meter installations are currently underway. Hence, the demand data for customer categories is taken from
the Invoices collected by the Business Intelligence (BI) team.
27You can also read