MINI GRIDS IN UTTAR PRADESH - A CASE STUDY OF A SUCCESS STORY - World Bank Documents
←
→
Page content transcription
If your browser does not render page correctly, please read the page content below
Public Disclosure Authorized

                                                                                                       November 2017 | Conference Edition

                                                 MINI GRIDS IN UTTAR PRADESH
Public Disclosure Authorized

                                                                A CASE STUDY OF A SUCCESS STORY
Public Disclosure Authorized
Public Disclosure Authorized

                               Upon completion, the final version of this report will be available for free download at https://www.esmap.org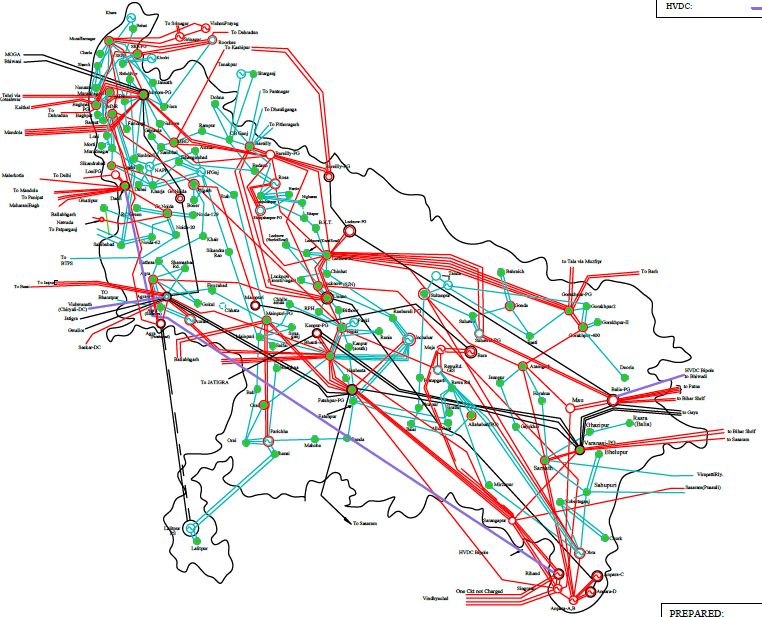
ESMAP Mission
 The Energy Sector Management Assistance Program (ESMAP) is a global
 knowledge and technical assistance program administered by the World Bank. It
 provides analytical and advisory services to low- and middle-income countries to
 increase their know-how and institutional capacity to achieve environmentally
 sustainable energy solutions for poverty reduction and economic growth. ESMAP
 is funded by Australia, Austria, Denmark, the European Commission, Finland,
 France, Germany, Iceland, Italy, Japan, Lithuania, Luxemburg, the Netherlands,
 Norway, The Rockefeller Foundation, Sweden, Switzerland, and the United
 Kingdom, as well as the World Bank.

 Copyright © November 2017
 The International Bank for Reconstruction
 and Development / THE WORLD BANK GROUP
 1818 H Street, NW | Washington DC 20433 | USA

 Written by: Castalia

 Cover Photo: © Castalia Strategic Advisors. Permission required for reuse

 Energy Sector Management Assistance Program (ESMAP) reports are published to
 communicate the results of ESMAP’s work to the development community. Some sources
 cited in this report may be informal documents not readily available.

 The findings, interpretations, and conclusions expressed in this report are entirely those of
 the author(s) and should not be attributed in any manner to the World Bank, or its
 affiliated organizations, or to members of its board of executive directors for the countries
 they represent, or to ESMAP. The World Bank and ESMAP do not guarantee the accuracy
 of the data included in this publication and accept no responsibility whatsoever for any
 consequence of their use. The boundaries, colors, denominations, and other information
 shown on any map in this volume do not imply on the part of the World Bank Group any
 judgment on the legal status of any territory or the endorsement of acceptance of such
 boundaries.

 The text of this publication may be reproduced in whole or in part and in any form for
 educational or nonprofit uses, without special permission provided acknowledgement of
 the source is made. Requests for permission to reproduce portions for resale or
 commercial purposes should be sent to the ESMAP Manager at the address below. ESMAP
 encourages dissemination of its work and normally gives permission promptly. The ESMAP
 Manager would appreciate receiving a copy of the publication that uses this publication
 for its source sent in care of the address above.

 All images remain the sole property of their source and may not be used for any purpose
 without written permission from the source.

2 | DRAFT NOVEMBER 2017
TABLE OF CONTENTS
Preamble ....................................................................................................................................................... 2
1|    Introduction....................................................................................................................................... 3
2|    Country Context ................................................................................................................................ 5
3|    Overview of the Power Sector .......................................................................................................... 9
  3.1    Main actors.................................................................................................................................... 9
  3.2    Evolution of the sector ................................................................................................................12
  3.3    Access to electricity: main grid and mini grids ............................................................................16
4|    Policy Settings for Mini Grids ..........................................................................................................19
  4.1    Bottom-up efforts (aided by top-down programs) to create mini grid growth ..........................19
  4.2    Policy approach to State-wide tariff............................................................................................20
  4.3    Expansion planning .....................................................................................................................21
5|    Overview of the Private Mini Grid Sector .......................................................................................22
  5.1    Mini grids technologies ...............................................................................................................22
  5.2    Business models ..........................................................................................................................22
6|    Authorizing Mini Grid Operators .....................................................................................................25
7|    Technical and Service Standards .....................................................................................................26
8|    Tariffs, financing, and subsidies ......................................................................................................27
  8.1    Setting retail tariffs......................................................................................................................28
  8.2    Type of subsidies available ..........................................................................................................29
  8.3    Eligibility to get subsidies and sources of money for subsidies ..................................................30
  8.4    Level of subsidies.........................................................................................................................30
  8.5    Regulatory treatment of subsidies ..............................................................................................30
9|    Handling the Relationship with the Grid .........................................................................................31
  9.1    What happens when the grid arrives ..........................................................................................31
  9.2    Wholesale tariff setting ...............................................................................................................32
  9.3    Obligation of utility to purchase output......................................................................................32
  9.4    Power Purchase Agreements ......................................................................................................32
10 | Lessons Learnt .................................................................................................................................33

1 | DRAFT NOVEMBER 2017
PREAMBLE
The Global Facility on Mini Grids of the Energy Sector Management Assistance Program (ESMAP) hired
Castalia to study the regulation of mini grids in six jurisdictions in Sub-Saharan Africa and Asia (Kenya,
Tanzania, and Nigeria; and Bangladesh, Cambodia, and the state of Uttar Pradesh in India). The study’s
objective is to understand what regulatory settings governments may adopt to scale up electrification
through private development of mini grids, drawing on the experience of these six jurisdictions; provide
technical assistance to four countries that want to further develop their mini grids framework; and
disseminate findings and recommendations globally to inform successful mini grids regulation.
The study focuses on mini grids defined as small, privately-owned and operated systems with generation of
up to 10 megawatts (MW) capacity and a network that distributes power to several customers. The study
includes small mini grids of less than 1 kilowatt (kW) capacity, also known as ‘micro’ or ‘pico’ grids.
The six case studies are intended to be combined in one report. The report is to provide a cross-country
comparison of these topics: it examines side by side how each of the countries studied have responded to a
specific regulatory question, and presents a decision-tree approach to developing regulatory frameworks for
mini grids.
This case study is based on in-depth interviews with a number of key stakeholders in Uttar Pradesh,
conducted during and after a research trip in August 2017. We supplemented the insights gained from these
interviews with extensive background research. Several experts in the India context and mini grids more
broadly reviewed this case study for accuracy and clarity, and we have incorporated their comments while
retaining a neutral fact-based position.
Like the other five case studies, this document is structured as follows:
• A brief introduction (Section 1 | ),
• A brief description of the context of the state of Uttar Pradesh (Section 2 | ),
• An overview of the power sector (Section 3 | ),
• Main aspects of the policy setting for mini grids (Section 4 | ),
• Technologies and business models used in the mini grids sector (Section 5 | ),
• The process to authorize mini grid operators (Section 6 | ),
• Technical and service standards for mini grids (Section 7 | ),
• Tariff setting, financing, and subsidies (Section 8 | ),
• Handling the relationship with the main grid (Section 9 | ), and
• A summary of lessons learnt from the experience of the country (Section 10 | ).
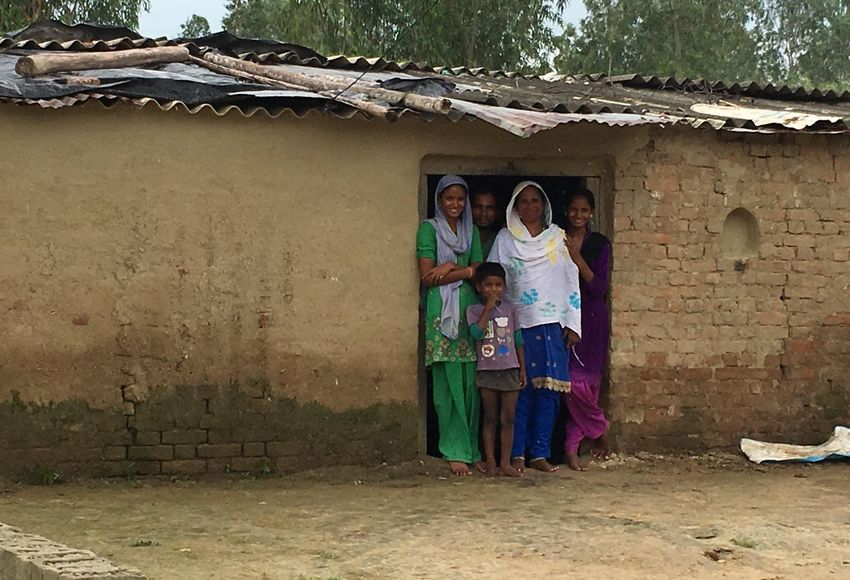
UTTAR PRADESH COUNTRY CASE STUDY | 21| INTRODUCTION Uttar Pradesh, the most populous state in India, has among the lowest levels of electricity connection in the country.1 Over 100 million people, at least half of the rural population, lack a formal connection to a distribution grid.2 The level of electricity services remains low despite the physical extension of the state-owned grid to all official villages. Unelectrified households are reluctant to apply for grid connection because they expect electricity supply to be unreliable, and they would have to spend money on coping strategies to replace electricity. In addition, connecting individual households in each village is costly to the state-owned distribution utilities. Highly regulated tariffs and a high cost of servicing remote areas mean that rural connections promise few returns to the utilities. Electrification has been a public policy priority for decades of successive state and central governments across the political spectrum. Public policy has maintained ambitious objectives to expand grid services from the state-owned medium-voltage (MV) distribution grid to rural areas. The state-owned grid has electrified all cities and surrounding towns. The high-voltage (HV) transmission grid extends throughout most of the state, in contrast to other energy-poor countries in Asia such as Cambodia, Indonesia, and Sri Lanka. Private mini grid operators have occupied a small but growing space in the rural electricity market in Uttar Pradesh since around 2010. Several small companies, as well as individual entrepreneurs, are now providing electricity services in almost 1,900 settlements (villages and hamlets) in the state, and have made about 37,000 connections (and growing).3 This is an impressive achievement for a young and innovative sector. But it represents only a tiny fraction of consumers: about 0.2% of the population. Independent mini grid operators in Uttar Pradesh have proven they can earn rural customers’ trust and their business. Rural consumers’ simple energy needs can absorb up to a third of households’ monthly expenditure without an electricity connection.4 Kerosene lighting is expensive, and has damaging impacts on health and the environment. Pay-per-use phone charging is both costly and inconvenient for a household. At the same time, rural residents and businesses tend to distrust the state-owned power supply. Electricity delivery from the conventional grid is highly unreliable: in 2016, there were almost 500 hours of power cuts in only 4 months (from May to August).56 Mini grid operators are addressing these gaps in service through renewable-based systems that deliver power to underserved villages. They have gained credibility as a more reliable service than the state-owned grid in rural areas by providing a reliable solution to residents’ and businesses’ lighting, phone charging, and appliance-powering problems.7 They provide basic light-emitting diode (LED) home lighting and a mobile phone charging 1 The population of Uttar Pradesh was projected to be almost 220 million people in 2017 (Census of India, 2011) 2 Government of India (2016), "Garv Dashboard," www.garv.gov.in/garv2/dashboard/garv; Mudaliar, Jena, Gupta (2016), “Renewable Energy Base Mini Grids,” Policy Framework 1:1 3 Meetings with private operators in Uttar Pradesh, August 2017 4 Times of India (2013), “Poor in villages live on Rs 17 a day, in towns on Rs 23 a day: Survey,” accessed on 17 August 2017 at timesofindia.indiatimes.com/india/Poor-in-villages-live-on-Rs-17-a-day-in-towns-on-Rs-23-a-day-Survey/articleshow/20690610.cms 5 Government of India Ministry of Power (2017), “Urja Dashboard,” accessed on 10 November 2017 at urjaindia.co.in/stats.php?id=33&type=state&level=saidi_analytics 6 The Indian Express (2016), “All villages electrified, but darkness pervades,” accessed on 15 August 2017 at indianexpress.com/article/india/india-news-india/electricity-in-india-villages-problems-still-no-light-poverty-3030107/ 7 Sachiko Graber, Tara Narayanana, Jose Alfaro, Debajit Palit (2018), “Solar microgrids in rural India: Consumers' willingness to pay for attributes of electricity.” Energy for Sustainable Development 42, 32–43 3 | DRAFT NOVEMBER 2017
outlet to a household for a scheduled 6 to 8 hours a day. Some companies offer packages with longer
hours of service, up to 24 hours a day.

Independent mini grid services have thrived in Uttar Pradesh within a liberal policy setting. Licenses are
not required, and a nascent registration system is not yet implemented. There are efforts to encourage
strict service standards, but these are not strictly enforced and rather left to the incentive that quality of
service represents. Tariffs of private mini grids are not regulated. The main commercial operators charge
a flat tariff of 120 Indian Rupees (INR) a month (just under US$1.50) for basic services. These tariffs are
an order of magnitude above public utilities’ tariffs, which do not recover costs. Table 1.1 shows some
key metrics related to mini grids in Uttar Pradesh.

Table 1.1: Key Metrics for Mini Grids in Uttar Pradesh, 2017

 Penetration of mini grids
 Number of mini grids                                Number                                                     Approx. 1,850
 Customers served by mini grids                      Number                                                              37,000
                                                     % of total population                                                 0.1%
                                                     Of the population with access                                         0.2%
                                                     to electricity, % connected to
                                                     a mini grid
 Average growth in connections 2010                  Thousand/year                                                           2.2
 to 2017
 Tariffs and Rates, tier 1(1)
 Cost of connection(2)                               US$                                                                      47
                                                     % of GDP/Capita                                                         5%
 Average subsidy per connection (3)                  US$                                                                        5
                                                     % of GDP/Capita                                                       0.5%
 Monthly bill                                        US$                                                                    1.86
                                                     % of Monthly GDP/Capita                                              2.53%
                  (4)
 Average tariff                                      US$/kWh                                                                1.18
 Quality of Service
 Availability of electricity, all tiers              Hours per day                                           7-24, scheduled
Sources: Meetings with private mini grid operators in Uttar Pradesh, August 2017
Notes:   (1) Tier 1 electricity access is service that meets basic needs for a household for 4 to 8 hours a day, at up to 50 Watts;
         and provides lighting and basic communication (mobile, radio). See World Bank/ESMAP (2015), Beyond Connections –
         Energy Access Redefined. Rates of operators providing service at higher tiers was confidential and not provided.
         (2) The cost to the mini grid operator of connecting a new tier 1 customer. In general, new customers do not pay for
         connection in a separate upfront connection charge; however, this varies depending on the operator.
         (3) The state government offers mini grid developers a subsidy of 30% that comes with certain conditions of pricing
         and service hours.
         (4) Average tariff for residential tier 1 services, assuming maximum usage of a scheduled capacity-based service. Most
         rural residential customers pre-pay a flat monthly fee rather than paying on a metered per kWh basis.

                                                                                     UTTAR PRADESH COUNTRY CASE STUDY | 4
2| COUNTRY CONTEXT
Table 2.1 presents summary demographic and economic statistics for Uttar Pradesh, as well as
governance statistics and indices for India.
Table 2.1: Uttar Pradesh Summary Statistics
1995 2005 2014
Demographics
Population Million 149 179 211
Population growth Annual average 1.8% 1.9% 1.9%
Rural population Million 120 141 163
Rural population growth Annual average 1.6% 1.7% 1.7%
Population density, People/sq. km 614 735 868
National
Economy
GDP PPP, 2011 US$ 23,916 61,778 161,100
million
GDP per capita PPP, 2011 US$ 160 345 883
Real GDP per capita 5-year compound 3.3% 1.5% 11.3%
growth rate
Debt to GDP ratio % 34% 52% 31%
Governance (India country rankings)
Ease of Doing Business See Note (1) N/A N/A 134
rank
Corruption Perceptions See Note (2) 2.6 2.9 3.8
Index
World Bank Governance See Note (3) -0.20 -0.17 -0.21
Indicator
Electricity Sector
Electricity connection % of population 25 37 49
rate, national
Urban 70 77 83
Rural 14 26 45
Electrification growth rate % change in 3.8 3.9 1.7
population with a
connection, 5-
year compound
rate
Population with electricity Million 38 65 113
connection
Urban 21 29 40
5 | DRAFT NOVEMBER 2017Rural 17 36 73
Electrical power kWh/person/year N/A 310 472
consumption kWh/person with N/A 833 956
an electricity
connection/year
Customers served by the Thousands 6,140 8,844 17,169
grid
Source: World Bank Development Indicators (2016), Transparency International (2016)
Notes: (1) The Ease of Doing Business Index ranks countries from one to 190. The closest a country is to one, the more
conducive its regulatory environment is to starting and operating a local firm.
(2) The Corruption Perceptions Index ranks countries on a scale of zero to 10, with zero indicating very high levels of
corruption and 10 indicating very low levels of corruption.
(3) The Worldwide Governance Index assign scores to countries from -2.5 to 2.5, with higher values indicating higher
quality of governance
Demographics
Uttar Pradesh is one of 29 states in the Republic of India, but it has the proportions of a country in its
own right. With an estimated population of almost 220 million in 2017, Uttar Pradesh is the most
populous state in India and would be the fifth most populous country in the world if it were a sovereign
nation (about the same size as Pakistan).8 It is the most populous country subdivision in the world, and is
India’s fifth largest state by area, accounting for 7.2% of the land mass. It covers much of the fertile plain
of the upper Ganges. Its annual population growth rate is nearly 2%, with population density of over 850
people per km2.9 The population density of Bangladesh is around 1,250 people per km2 by comparison,
and Cambodia has only 90 people per km2.10
Literacy rates, as of the 2011 national census, were below 68% on average in the state, well below the
national average of 74%.11 The most commonly spoken language is Hindi.
Economy
Uttar Pradesh is the third largest Indian state by economy, with a GDP of over US$160 billion in 2014.12
However, it is one of the poorest states by GDP per capita.13 The state’s gross domestic product (GDP)
per capita is five times lower than Pakistan’s, and six times lower than Nigeria’s, which have a similar
population size.14
Service industries, such as hospitality and Information Technology Enabled Services (ITES), make up the
largest portion of the state’s GDP.15 The state has sanctioned 20 special economic zones in the state, of
which 16 are reserved for IT and ITES.16
8 Population estimate based on Census of India data, 2001 and 2011
9 India Brand Equity Foundation (2017), “About Uttar Pradesh: Tourism, Agriculture, Industries, Economy & Geography,” accessed on 25 August
2017 at www.ibef.org/states/uttar-pradesh.aspx
10 World Bank Group (2016), accessed on 15 November 2017 at data.worldbank.org/indicator/EN.POP.DNST
11 Census of India 2011
12
India Brand Equity Foundation (2017)
13 World Bank (2016), “Uttar Pradesh - Poverty, growth and inequality,” India state briefs. Washington, D.C.: World Bank Group
14 World Bank Development Indicators (2016), accessed on 30 June 2017 at data.worldbank.org/indicator
15 India Brand Equity Foundation (2017), “Uttar Pradesh: A Rainbow Land,” State Reports, www.ibef.org
16 India Brand Equity Foundation (2017)
UTTAR PRADESH COUNTRY CASE STUDY | 6The primary sector remains a major share of the economy.17 Agriculture is the state’s leading occupation.18 Uttar Pradesh farmers produced around 20% of India’s total milk and food grain output in 2015. Wheat and sugarcane are the main commercial food crops. The state has become a key hub for IT and ITES, including software, captive business process outsourcing and electronics.19 State industries also include locomotive plants, manufacturing of engineering products, electronics, steel, leather, textiles, jewelry, and transport vessels for road, railway, and shipping. Governance Uttar Pradesh was created under the British Administration in 1937 as the United Provinces, in the historic region of the 16th century Mughal and 18th century Maratha kingdoms. The state is governed through a parliamentary system, with elected representatives from each of the 75 administrative districts. The districts are organized around nodal towns, which serve to administer local government, public services, and economic activities. India has a federal system of government. The Government of Uttar Pradesh, in the state capital of Lucknow, holds important decision-making authority over the state’s laws and policies, including for the energy sector and the economy. The President of India appoints the Governor of Uttar Pradesh for a 5- year term.20 The Chief Minister is the leader of the publicly-elected majority party or coalition of the Legislative Assembly (lower house of parliament). The day-to-day governing body of the state is called the Council of Ministers, whose members are appointed by the Chief Minister. Uttar Pradesh borders Delhi, as well as nine other states and Nepal to the North. It has well-developed connections with these areas, including four national highways, six airports, and rail links to all major cities.21 Figure 2.1 shows a map of the state’s roads, railways, and boundaries. 17 Government of Uttar Pradesh (2013), “Social Demography,” accessed on 14 August 2017 at www.up.gov.in/Social-Demography.pdf 18 Quartz India (2017), “Akhilesh, Mayawati or Modi: Can anybody actually fix Uttar Pradesh’s economy?” accessed on 15 September 2017 at qz.com/891969/akhilesh-mayawati-or-modi-can-anybody-actually-fix-uttar-pradeshs-economy/ 19 India Brand Equity Foundation (2017) 20 Governor of Uttar Pradesh, “Role of The Governor,” accessed on 26 September 2017 at upgovernor.gov.in/upgovernor.gov.in/roleofgov.htm 21 India Brand Equity Foundation (2017) 7 | DRAFT NOVEMBER 2017
Figure 2.1: Map Uttar Pradesh

Source: D-Maps.com, accessed at d-maps.com/m/asia/india/uttar/uttar17.gif

                                                                            UTTAR PRADESH COUNTRY CASE STUDY | 8
3| OVERVIEW OF THE POWER
SECTOR
The Government of Uttar Pradesh began a program of power sector reforms from 1998 to 2000, in the
context of the reforms initiated by the Government of India.22 These reforms established the state
regulator and unbundled the electricity utility.23 Figure 3.1 shows the structure of the power sector in
Uttar Pradesh since 2000.
Figure 3.1: Uttar Pradesh’s Power Sector Structure
Ministry of New and
Ministry of Power
Central Electricity Renewable Energy
Regulatory Commission
Give funding
UP New and Renewable UP Department
Energy Development Agency of Energy
UP Electricity
Regulatory Commission Set and implement policy
Set tariffs and standards
UP Power Corporation Ltd State-owned
SPV-financed generation generation
Rural Electrification
Corporation Federal
Give funding State transmission grid generation
State-sponsored
IPP
Private mini-grids Distribution companies generation
mini-grids
Sell power
Consumers
3.1 MAIN ACTORS
Three public bodies oversee setting policies and regulations in the state’s power sector, including for
rural electrification, subsidies, and service standards:
• The Uttar Pradesh Department of Energy (UPDOE) defines electricity policies specific to the
state’s needs and priorities, and in line with national power sector legislation.
• The Uttar Pradesh New and Renewable Energy Development Agency (UPNEDA) outlines
policies, service standards, and subsidies specifically for rural electrification and promoting
renewable energy in the state.
• The Uttar Pradesh Electricity Regulatory Commission (UPERC) sets tariffs and implements
public policies and laws for the sector.
22 Debajit Palit, Bandyopadhyay, K. (2017), “Rural electricity access in India in retrospect: A critical rumination,” Energy Policy 109
23 Navroz K. Dubash, Rajan, S. (2001), “The Politics of Power Sector Reform in India,” World Resources Institute
9 | DRAFT NOVEMBER 2017The Government of India has a separate, central structure to define nation-wide energy policies. The
Ministry of Power sets national policy and proposes legislation governing the power sector, focusing on
large-scale grid electrification, conventional generation, and distributed generation for remote areas.
The Ministry of New and Renewable Energy (MNRE) creates policies and programs to foster
development of renewable power as well as for supporting rural electrification.
State utility, Uttar Pradesh Power Corporation Limited (UPPCL)
The electricity sector reform program in 1999 unbundled the Uttar Pradesh State Electricity Board
(UPSEB) into three publicly-owned power companies:
• Uttar Pradesh Power Corporation Limited (UPPCL) manages transmission, distribution, and
retail operations.24 UPPCL has five distribution subsidiaries geographically arranged
throughout the state.
• Uttar Pradesh Rajya Vidyut Utpadan Nigam Limited (UPRVUNL) manages the state’s thermal
generation assets.
• Uttar Pradesh Jal Vidyut Nigam Limited (UPJVUNL) manages its hydropower assets.25
UPPCL procures power from four types of generators:
• State-owned generators UPRVUNL and UPJVUNL.
• Central government-owned generators.
• Independent power producers, mostly privately-financed power companies, through tendered
or negotiated power purchase agreements (PPA).
• Project-financed power plants owned by UPPCL.
The financial situation of UPPCL is precarious, despite having received a healthy balance sheet when it
was created by the state government in 2007. The Government of Uttar Pradesh wrote off INR19 billion
of liabilities of the former UPSEB when it was unbundled to give it an easier starting point.26 UPPCL’s five
distribution utilities have challenging financial situations, with collection losses averaging about 35%.
The state issued government-backed bonds worth US$1.5 billion against the distribution companies’
losses in 2017.
State agency for rural electrification, UPNEDA
UPNEDA, or ‘the agency’, is an arm of the state Government responsible for rural electrification and
renewable energy development. The agency defines and implements policies for those portfolios. It also
disburses funds, subsidies, and other financial incentives for operators to carry out these duties.
UPNEDA supports both private and public financing and development of mini grids through two
strategies:
• Developing Uttar Pradesh’s flagship Mini Grid Policy of 2016 (the 2016 Policy): this incentivizes
mini grid development by the private sector through a subsidy structure.
24
Anjula Gurtoo and Rahul Pandey (2001). “Uttar Pradesh Power Sector: Past Problems and the Initial Phase of Reforms,” Indian Institute of
Management, Lucknow
25 UPERC, "The Journey So Far," accessed on 10 August 2017 at uperc.org/html.aspx?FormName=html/Achievement.htm
26 Times of India (2012), “Government affirms 1.9 lakh crore discom loan recast,” accessed on 15 September 2017 at
timesofindia.indiatimes.com/city/delhi/Government-affirms-1-9-lakh-crore-discom-loan-recast/articleshow/16535258.cms
UTTAR PRADESH COUNTRY CASE STUDY | 10• Planning fully subsidized mini grids with funding from the central Government’s rural
electrification program:27 the agency has procured 16 solar-powered mini grids on an EPC basis;
residential customers pay nothing for electricity services from state-owned mini grids. The
electricity is offered as a free service for bottom-of-pyramid consumers. UPNEDA has
previously implemented mini-grids with funding from MNRE.
State regulator, UPERC
The Electricity Reforms Act (1999) of Uttar Pradesh set up the state’s independent regulator, UPERC.28
Its objectives are to:
• Oversee a cost-efficient, high quality supply of power to support economic development in the
state,
• Enable the power sector to become financially viable, and
• Protect the interests of consumers.
UPERC sets tariffs and service standards based on power sector policies and laws from both state and
central government levels.29 UPDOE and UPNEDA set the policy direction on service standards and
pricing. These form the policy backbone of UPERC’s regulations. UPERC interprets policies issued by the
central Government as suggestions rather than instructions. The Central Electricity Regulatory
Commission (CERC) provides guidelines and frameworks on regulating technical and commercial aspects
of the power sector for state-level regulators to adapt to their needs.
UPERC regulates the tariffs of all electricity providers except those of private operators of mini grids that
offer services in deprived, under-serviced rural areas (tariffs of state-subsidized isolated mini grids are
regulated through the subsidy contract with the State Government). State-owned distribution utilities
are regulated along with their franchisee companies, which distribute electricity from the main
distribution grid. Following the Electricity Act of 2003, and consistent to the 2016 Policy, private
operators delivering privately-generated electricity in rural areas are not subject to tariff regulation.
Rural Electrification Corporation (REC)
The Rural Electrification Corporation (REC) is a central government-owned infrastructure finance
company.30 It offers grants, loans, and subsidies to entities that provide electricity services to rural areas
across India. Its clients include publicly-owned utilities, rural electricity cooperatives, non-governmental
organizations, and private developers of generation, transmission, and distribution in designated rural
areas.
REC administers the national rural electrification scheme, known as Deen Dayal Upadhyaya Gram Jyoti
Yojana (DDUGJY), since its launch in 2015.31 DDUGJY receives funding from the Government of India,
state distribution utilities, private lenders, and additional grants from the central government if
prescribed milestones are achieved.
27 DDUGJY, described on next page.
28
UPERC, “About UPERC and its Mission,” accessed on 12 August 2017 at uperc.org/html.aspx?FormName=html/Uperc_ItsMission.htm
29 UPERC, “Functions,” accessed on 12 August 2017 at uperc.org/html.aspx?FormName=html/Functions.htm
30 REC India, “Business Profile,” accessed on 23 October 2017 at www.recindia.nic.in/business-profile
31 The DDUGJY scheme subsumed the Government of India’s prior rural electrification scheme, Rajiv Gandhi Grameen Vidyutikaran Yojana
(RGGVY), which was initiated in 2005. The REC administered the RGGVY scheme.
11 | DRAFT NOVEMBER 2017Mini grids
Most mini grids in Uttar Pradesh are privately financed and operated. Mini grid entrepreneurs often
receive development financing, grants, and equity from non-governmental sources. The handful of
publicly-financed mini grid projects procured by UPNEDA do not run on a commercial basis.32
Privately financed mini grids may set their own tariffs as long as they do not connect to the grid, or hold
any funding agreement that sets pricing conditions. The Electricity Act of 2003 exempts rural electricity
service providers from price regulation and licensing requirements. When Government agencies hold no
financing or subsidy agreements with private developers, they have no means to impose tariff or service
standards. Such privately financed mini grids may sell directly to consumers through unregulated
distribution agreements.
UPNEDA has financed 16 publicly-funded mini grids.33 It procures EPC contractors under 5-year build-
operate-transfer arrangements, after which it runs a new procurement for operation and maintenance.
Operations and maintenance costs are funded by UPPCL’s budget, while capital costs are provided by
UPNEDA and some funding from DDUGJY. These state-owned mini grids currently provide services free
of cost to rural residents and micro-enterprises. In future, they may charge a rate regulated by UPERC.
3.2 EVOLUTION OF THE SECTOR
The Power Policy of Uttar Pradesh, released in 2009, fueled public and private investment in power
generation that satisfied latent demand from 2010 to 2012.34 35 The state now has over 22.7GW of
installed generating capacity, including a share of the central government-owned generation resources
allocated to Uttar Pradesh.36 37 This year, the state expects to have an energy surplus for the first time in
its history.38 39 The governments of India and of Uttar Pradesh have also accelerated power sector
investment since the late 1990s through reforms in the sector. Figure 3.2 shows the change in power
consumption (left axis) and generation (right axis) in Uttar Pradesh from 1999 to 2015.
32 Meeting with Director of UPNEDA, August 2017
33 Meeting with Director of UPNEDA, August 2017
34 Uttar Pradesh Power Policy, 2009
35 Business Standard (2014), “Corporates commit Rs 35,000-cr investment to Uttar Pradesh,” accessed on 23 September 2017 at www.business-
standard.com/article/economy-policy/corporates-commit-rs-35-000-cr-investment-to-uttar-pradesh-114061201048_1.html
36 Governments of India and Uttar Pradesh (2017)
37 Bloomberg New Energy Finance, "Climatescope 2015," accessed on 15 August 2017 at 2014.global-
climatescope.org/en/download/reports/countries/climatescope-2015-in-up-en.pdf
38 Economic Times, Times of India (2017) "India Likely to be Power Surplus Nation in FY 2018," accessed on 20 October 2017 at
economictimes.indiatimes.com/industry/energy/power/india-likely-to-be-power-surplus-nation-in-fy18/articleshow/59093054.cms; Hindustan
Times (2017), "For the first time in history, Uttar Pradesh may become a power surplus state," accessed on 12 October 2017 at
www.hindustantimes.com/lucknow/for-the-first-time-in-history-uttar-pradesh-may-become-a-power-surplus-state/story-
T7MBBAjW1RFMIhexTGVrUM.html
39 Central Electricity Authority (2016), Load Generation Balancing Report 2016-2017
UTTAR PRADESH COUNTRY CASE STUDY | 12Figure 3.2: Evolution of Power Consumption (kWh per Capita, left) and Electricity Generation (GWh, right), 1999
to 2015
500 100,000
Consumption
450
400 80,000
350 Generation
300 60,000
kWh/capita
GWh
250
200 40,000
150
100 20,000
50
0 -
2000 2002 2004 2006 2008 2010 2012 2014
Source: Governments of India and Uttar Pradesh (2017), 24x7 Power for All Uttar Pradesh
Power generation in Uttar Pradesh is a combination of central government-owned, state-owned, and
privately-owned assets. In 2017, 76% of capacity is from thermal generation; 13% is from hydropower;
10% is from variable renewables, biomass, and small hydro; and 1% is from nuclear.40
Poor and unreliable power supply has historically been a persistent problem in the state that hampers
industrial investment and economic development.41 Power cuts remain common, as well as prolonged
periods of low voltage.42 During peak times, electricity demand frequently exceeds supply by over 10%,
sometimes reaching over 40%.43
Uttar Pradesh has a low installed generating capacity per capita of population compared to the all-India
average.44 It trails behind neighboring countries Pakistan, Myanmar, and Bangladesh;45 and has the
second-lowest installed capacity per capita among the six case study countries (Bangladesh, Cambodia,
Kenya, Nigeria, and Tanzania).46 Figure 3.3 shows the national installed capacity per population in Uttar
Pradesh (orange) compared to the two other case studies in Asia (Bangladesh and Cambodia, in light
blue), as well as to all India and neighboring countries (Nepal and Pakistan, in dark blue).
40 UPPCL data, 2016
41 Times of India (2013), "Power crisis looms over UP," accessed on 15 October 2017 at timesofindia.indiatimes.com/city/delhi/Power-crisis-
looms-over-UP/articleshow/19485158.cms
42 Governments of India and Uttar Pradesh (2017), “24x7 Power for All Uttar Pradesh”
43
Times of India (2013)
44 Governments of India and Uttar Pradesh (2017)
45 Export.gov (2017), “Burma – Energy,” accessed on 21 November 2017 at www.export.gov/article?id=Burma-Energy
46 Energy Information Administration, International Energy Statistics: Generation, www.eia.gov/beta/international/data/browser, accessed July
23, 2017
13 | DRAFT NOVEMBER 2017Figure 3.3: Electricity Capacity per Capita in Uttar Pradesh and Neighboring Countries (MW per million people)
250
200
MW/million people
150
100
50
0
Pakistan Myanmar India Uttar Pradesh Bangladesh Cambodia
(India)
Source: Energy Information Administration, International Energy Statistics: Generation,
www.eia.gov/beta/international/data/browser, accessed July 23, 2017
Uttar Pradesh’s electricity grid has been part of the Northern Grid of India since the 1960s, when Indian
state grids were interconnected to form five regional links.47 The Northern Grid of India was
interconnected through HVDC transmission lines with other regional grids in 2006, as part of an initiative
to form a National Grid. This interconnection enabled national transport of electricity between all states
in the union. Figure 3.4 shows the remarkably dense network of transmission lines interconnecting Uttar
Pradesh with its nine neighboring states. HV lines crisscross the state to and from Delhi, Uttarakhand,
Bihar, Chhattisgarh, and Rajasthan.
47 Power Grid Corporation of India Ltd., “One Nation One Grid,” accessed on 15 October 2017 www.powergridindia.com/one-nation-one-grid
UTTAR PRADESH COUNTRY CASE STUDY | 14Figure 3.4: Uttar Pradesh’s Transmission Grid Source: Uttar Pradesh Power Transmission Corporation Ltd., 2017. “UP Transmission Network (220 KV & Above)” 15 | DRAFT NOVEMBER 2017
3.3        ACCESS TO ELECTRICITY: MAIN GRID AND MINI GRIDS
Private mini grids first emerged in Uttar Pradesh less than a decade ago. To date, almost all electricity
consumers in the state are still connected through the state-owned grid, which has been developed
since the incorporation of the UPSEB in 1959.48

Over three quarters of households in Uttar Pradesh are in rural areas, totaling about 163 million people,
and about half of them lack a connection to electricity services.49 Of those with grid connections, many
remain illegal and unmetered, and supply is unreliable.50 Many rural households resort to using
kerosene lamps as their main source of lighting, and a significant proportion now use solar lamps.51

The overall rate of electricity connections in Uttar Pradesh is close to 60%, while only 60% of those
connections are metered. Data suggest a 28% increase in electricity connections since the last census in
2011.52 UPPCL distribution companies have officially electrified 120,000 villages and hamlets.53 However,
to qualify as being officially electrified a village need only have 10% of households connected (as well as
public services and street lighting).

About half of all rural households in the state are connected to UPPCL distribution services; of those, an
estimated 40% receive unmetered, informal electricity connections.54 Consumers in underserved
communities often connect to the distribution grid illegally, adding losses that worsen the utility’s fragile
financial position.55 Newly-connected households in remote communities often do not receive a meter
at the time of installation, which also poses a billing challenge. Theft further complicates state efforts to
collect data on electricity services.56

Many rural consumers with a connection to the main grid have chosen to switch to mini grid electricity
services when the option was available.57 Although mini grid tariffs can be over 20 times higher than the
main grid, they provide reliable service at predictable hours.58 Rural consumers are willing to pay higher
prices in exchange for reliability and supply that meets a predefined level of demand.59

Increasing electricity connections through the main grid in Uttar Pradesh has followed a growth
trajectory similar to the India-wide average since the 1990s (see Figure 3.5).60 However, before then, the
power system had developed less than in other Indian states, due to its relative economic weakness.
The state electricity companies have operated at a loss despite Government efforts to relieve the
financial pressure by writing off liabilities. The expansion of electricity access in India has been funded
through central and state-government investment in large centralized fossil fuel power plants and

48 Anjula Gurtoo and Rahul Pandey (2000), “Uttar Pradesh Power Sector: Past Problems and the Initial Phase of Reforms,” Indian Institute of
Management, Lucknow
49 Census of India, 2011
50
   Governments of India and Uttar Pradesh (2017), “24x7 Power for All Uttar Pradesh”
51 EUEI PDF (2013), “Mini Grid Policy Toolkit Case Study: India (Husk Power Private Operator Model)”
52 Census 2011
53 Governments of India and Uttar Pradesh (2017), “24x7 Power for All Uttar Pradesh.” Note that official sources provide conflicting data.
54 Ibid.
55 Sachiko Graber, Tara Narayanan, Jose Alfaro, Debajit Palit (2018), “Solar microgrids in rural India: Consumers’ willingness to pay for attributes

of electricity,” Energy for Sustainable Development
56 The Hindu Business Line (2017), “Uttar Pradesh plans to step up crackdown on power theft,” accessed on 16 November 2017 at

www.thehindubusinessline.com/news/national/uttar-pradesh-plans-to-step-up-crackdown-on-power-theft/article9920206.ece
57 Meetings with mini-grid operators and customers in Hardoi district, Uttar Pradesh, August 2017
58 Graber et al., (2018).
59 Ibid.
60
   Census of India 1991, 2001, 2011

                                                                                               UTTAR PRADESH COUNTRY CASE STUDY | 16
expensive long transmission lines across the subcontinent (as noted, Figure 3.4 shows the existing
transmission grid and interconnections with neighboring states).
Uttar Pradesh’s rate of adding new electricity connections has been slower than bordering countries and
states. In the past two decades, the proportion of people connected to grid services has doubled from
below 30% to about 60% (including unmetered connections).61 Across the border to its north, Nepal has
increased the rate of electricity connections by a factor of eight, from 10% in 1995 to over 85% since
2013.62 Bangladesh meanwhile, tripled its connection rate in the same period. Figure 3.5 shows the
evolution of electrification in Uttar Pradesh, India, neighboring countries, and the South Asia average.
Figure 3.5: Access to Electricity (% of population)
Pakistan
100
Nepal
80
India
Bangladesh
60
South Asia Average
40 Uttar Pradesh (India)
20
0
Source: World Bank, Electricity Access, http://data.worldbank.org/indicator, accessed 10 July 2017
The wide urban-rural disparity in electricity connections has narrowed in the past two decades. In 1995,
the rate of connections in urban areas was five times higher than in rural areas. However, by 2015, the
gap between urban and rural access had reduced to less than two times: in urban areas, over 84% of the
population is connected to the main grid; in rural areas, over 50% have an electricity connection
(although many remain illegal and unmetered).63 Urban customers receive day-long, albeit unreliable,
electricity service.64 Service to rural customers tends to be less reliable, with only around 9 hours of
service a day at irregular times.65 Table 3.1 summarizes service data for grid and mini grid electricity
61
Ibid.
62 World Bank Development Indicators (2016)
63 Governments of India and Uttar Pradesh (2017), “24x7 Power for All Uttar Pradesh.”
64 Ibid.
65
Graber et al. (forthcoming)
17 | DRAFT NOVEMBER 2017services. Several mini grids customers also have a main grid connection, but no data is available on
them.
Table 3.1: Electricity Summary Statistics, 2015
Main Grid Mini Grids
Customers served Thousand 17,169 37
Share of total customers served % 99.8% 0.2%
Average tariff for Tier 1 services US$/kWh 0.04 1.18
Electricity Service Quality Hours of Irregular Regular
Urban service/day 18 to 24 N/A
Rural 9 6 to 24
The population served by the grid has almost tripled in the past two decades. Average annual
population growth in Uttar Pradesh is 1.8% (slightly above the Indian average of 1.7%).66 At the same
time, the proportion of households with a grid connection has increased from 25% in 1995 to about 50%
in 2015. Table 3.2 shows the change in electricity connections compared to population growth. It also
shows how mini grids suddenly appeared in the late 2000s to provide electricity services to over 350,000
rural residents and counting.
Table 3.2: Electricity Connections Through Main Grid and Mini grids (millions)
1995 2005 2015
Population 149.4 178.9 215.2
Urban Million 29.7 38.2 49.2
Rural 119.7 140.7 165.9
Population served by the main grid Million 37.6 65.4 113.3
Population served by mini grids Million N/A N/A 0.21
Sources: Census of India 2011, 2001; Governments of India and Uttar Pradesh, 2017, “24x7 Power for All Uttar Pradesh”
66
Census of India, 2011
UTTAR PRADESH COUNTRY CASE STUDY | 184| POLICY SETTINGS FOR MINI GRIDS
Electricity in India is a ‘concurrent subject,’ where both federal and state rules apply. Electricity services
have been promoted since the 1950s as a need and a right for all residents, and used as a bargaining
chip to meet political objectives.67 Both politicians and the public see electricity as key to foster
agricultural growth and reduce poverty. The promise of providing electricity connections has proven to
be a powerful vote-garnering tactic to win rural support.68 In 2017, the Government of India announced
that all residents living below the poverty line would receive free connections from state governments.69
UPPCL’s distribution utilities still lack the capacity to provide reliable services to remote areas. Power
theft and unmetered connections cause distribution losses of around 35% on average.70 Utilities’
finances are worsening, and heavily cross-subsidized tariffs mean that small rural customers are very
expensive to serve. The cross-subsidies that have been in place for decades are insufficient to earn
utilities sufficient return.
The following sections outline:
• The bottom-up and top-down events that spurred growth in the mini grid sector
• How policy addresses mini grid tariffs, and
• The top-down approach to expansion planning.
4
4.1 BOTTOM-UP EFFORTS (AIDED BY TOP-DOWN PROGRAMS) TO
CREATE MINI GRID GROWTH
Mini grids have emerged in an early laissez-faire environment. The Electricity Act of 2003 allowed
private operators to provide electricity services in rural areas without tariff regulation or licensing
requirements.71
The Government of India launched the Rajiv Gandhi Grameen Vidyutikaran Yojana (RGGVY) in 2005, a
‘National Rural Electrification Program’ that targeted universal electricity access. The program aimed to
provide connections for 32 million below-poverty-line (BPL) households, focusing on decentralized
distributed generation as a tool to achieve those aims.72 RGGVY introduced the distribution franchise
(DF) model, in which a private operator generates or buys power wholesale from the grid to distribute
67 Hindustan Times (2017), “‘Should we live in darkness’: Why much of power-rich Uttar Pradesh remains without electricity,” accessed on 12
August 2017 at www.hindustantimes.com/india-news/should-we-live-in-darkness-why-much-of-power-rich-uttar-pradesh-remains-without-
electricity/story-NHjoneKcoPn9g7KNB2ygzH.html
68 Swarajya Magazine (2017), “How the Yogi Plans to Light Up Uttar Pradesh by 2019,” accessed on 18 October 2017 at
swarajyamag.com/politics/how-the-yogi-plans-to-light-up-uttar-pradesh-by-2019
69 Times of India (2017), “Free electricity connections to 842 BPL families,” accessed on 18 October 2017 at
timesofindia.indiatimes.com/city/bareilly/free-electricity-connections-to-842-bpl-families/articleshow/59734405.cms; The Hindu Business Line
(2017), “PM launches ‘Saubhagya’ scheme to provide power to all,” accessed on 18 October 2017 at www.thehindubusinessline.com/news/pm-
launches-saubhagya-scheme-to-provide-power-to-all/article9872678.ece
70 NDTV (2017), “A Woman IAS Officer's Battle Against Power Thieves In Uttar Pradesh,” accessed on 12 August 2017 at
www.ndtv.com/business/a-woman-ias-officers-battle-against-power-thieves-in-uttar-pradesh-1749119
71 Electricity Act 2003, s.7. “Any generating company may establish, operate and maintain a generating station without obtaining a licence
under this Act if it complies with the technical standards relating to connectivity with the grid.” s.14. “[W]here a person intends to generate and
distribute electricity in a rural area to be notified by the State Government, such person shall not require any licence for such generation and
distribution of electricity, but he shall comply with the measures which may be specified by the Authority under section 53.”
72 Akanksha Chaurey, P.R. Krithika, Debajit Palit, Smita Rakesh, Benjamin K. Sovacool (2012), “New partnerships and business models for
facilitating energy access,” Energy Policy 47
19 | DRAFT NOVEMBER 2017to rural customers at retail prices.73 The DF would conduct all metering, billing and collections on behalf
of the distribution utility at the local level, creating better financial outcomes and customer service.
While the DF model never took off, in around 2009 private entrepreneurs saw an opportunity to
generate and sell small-scale renewable power at commercially viable rates to unserved and
underserved rural populations (those with a connection to the main grid that does not meet their
electricity demand).74 Several mini grid companies started up to take advantage of this potential market
of last-mile (remote) populations.75
The Government of Uttar Pradesh also recognized the benefits of using private mini grid developers to
offer services in last-mile areas, and began to develop policy efforts for the sector.76 Developing policies
would provide more regulatory certainty and structure to the growing market and the investment
community. In 2016, the Government of Uttar Pradesh adopted its flagship Mini Grid Policy, designed to
operate for 10 years. UPNEDA is working with mini grid advocates, civil society, and industry groups to
define implementation guidelines for the 2016 Policy.
The 2016 Policy targets mini grid projects of a maximum capacity of 500kW. It states as its first three
objectives:
• Promoting decentralized generation of clean and green power by harnessing renewable
energy;
• Creating a conducive investment climate to stimulate private sector participation in
decentralized generation of renewable power; and
• Providing reliable power supply to nearly 20 million households to meet basic needs of power
(such as lighting, fan, and mobile charging).
The agency does not see a long-term role for mini grids to deliver electricity services in rural areas.
Rather, it believes that mini grids represent an important interim solution for rural electrification.77 A
top priority for Uttar Pradesh policy-makers is to develop centralized power infrastructure for delivering
electricity services. In June 2017, the agency released a draft Solar Power Policy for developing large
solar projects of over 5MW.78
4.2 POLICY APPROACH TO STATE-WIDE TARIFF
There is no uniform tariff required, or tariff ceiling imposed for private mini grids. The Electricity Act of
2003 exempts independent electricity providers in rural areas from tariff regulation.
Operators that accept subsidies from the state would no longer be considered private, and must comply
with government tariff policy. The 2016 Policy described above offers a 30% state subsidy to private
developers to install mini grids in “remote and economically weaker areas.” The state subsidy is
conditional on specified service standards (8 hours per day), and on limiting monthly tariffs to INR60
(US$0.91) for a load of 50 Watts, and INR120 for 100 Watts. No commercially-operating mini grid
73 Meeting at The Energy and Resources Institute (TERI), August 2017
74 Huffington Post (2013), “Meet Uttar Pradesh, India’s Next Distributed Solar Hotbed,” accessed on 18 October 2017 at
www.huffingtonpost.com/justin-guay/meet-uttar-pradesh-indias_b_2152777.html
75 The Climate Group (2015), “The Business Case for Off-grid Energy in India,” Finance Report in partnership with Goldman Sachs
76
Ashok Kumar Srivastava (2013), “Solar Minigrids in Rural Areas of Uttar Pradesh,” RE Feature, 12:4, Government of India Ministry of New and
Renewable Energy
77 Meeting with Director of UPNEDA, August 2017
78 Uttar Pradesh Solar Power Policy 2017 (Draft), accessed on 26 October 2017 at
upneda.org.in/sites/default/files/all/section/Uttar_Pradesh_Solar_Power_Policy-2017___Final_Draft_.pdf
UTTAR PRADESH COUNTRY CASE STUDY | 20operators are currently accepting state subsidies, as the tariff limitations are too low to be commercially
viable.
4.3 EXPANSION PLANNING
As mentioned, successive central and state governments have prioritized universal electricity access
since power sector reform in the late 1990s, using joint initiatives to electrify Uttar Pradesh. The
Governments of India and of Uttar Pradesh signed a Memorandum of Understanding in February 2000
to cooperate on grid expansion and investments in power generation.79 The agreement was designed to
support Uttar Pradesh’s broader sector reform program. Despite the optimism of both governments, the
distribution utilities’ finances continued to suffer losses in the following years.
UPPCL and its subsidiary distribution companies continue to plan and carry out grid extension funded by
loans from the REC. However, where rural villages have been connected to central distribution grids,
they seldom receive reliable or stable power supply. Distribution utilities lack the financial and
operational capacity to deliver services to remote areas where billing and collection is difficult, costly,
and brings few revenues.
The current governments have adopted a liberalization program to define their infrastructure policies. In
2017 the central and state governments established “24x7 Power for All Uttar Pradesh,” a joint initiative
to expand reliable electricity services to all residents of the state.80 Specifically, it envisages a financial
and operational turnaround of the state’s transmission and distribution utilities. The turnaround plan
highlights the need to invite more private participation in grid investments through, for example, tariff-
based competitive bidding.
Mini grid companies have carved out a space for themselves in rural areas, in parallel to the
governments’ efforts. To develop a new mini grid project, the private operator studies a district’s
geography and existing grid system.81 Field operators conduct field visits and surveys to gauge potential
new markets.
Mini grid companies’ expansion into new villages and districts remains limited by the availability of
financing to install new systems and serve new locations. Any funding they might receive from the REC
could put them at risk of heavy-handed tariff regulation.
79 Government of India, Ministry of Power (2000), “Memorandum of Understanding Between Ministry of Power, Government of India and the
Government of Uttar Pradesh,” accessed on 10 September 2017 at powermin.nic.in/en/content/uttar-pradesh
80 Governments of India and Uttar Pradesh (2017), “24x7 Power for All Uttar Pradesh”
81
Meetings with executives of OMC Power and Mera Gao Power, August 2017
21 | DRAFT NOVEMBER 2017You can also read