Energy & Environmental Science - PAPER

Page created by Crystal Bates
 
CONTINUE READING
Energy & Environmental Science - PAPER
Energy &
                                                                                                                Environmental
                                                                                                                Science
            This article is licensed under a Creative Commons Attribution-NonCommercial 3.0 Unported Licence.

                                                                                                                                                                                                                                                        View Article Online
                                                                                                                    PAPER                                                                                                                               View Journal | View Issue

                                                                                                                                                           Delivering low-carbon electricity systems in
                                                                                                                                                           sub-Saharan Africa: insights from Nigeria†
Open Access Article. Published on 19 May 2021. Downloaded on 10/13/2021 11:44:36 AM.

                                                                                                                Cite this: Energy Environ. Sci.,
                                                                                                                2021, 14, 4018
                                                                                                                                                           Habiba Ahut Daggash                  *abc and Niall Mac Dowellbc

                                                                                                                                                           Sub-Saharan Africa (SSA) faces many challenges: two-thirds of the world’s extreme poor population; a
                                                                                                                                                           shrinking economy because of commodity price declines and the COVID-19 pandemic; widespread
                                                                                                                                                           energy poverty; and climate variability that is disrupting agrarian livelihoods and stirring conflict over
                                                                                                                                                           natural resources. Climate change threatens to exacerbate these through further disruption of the
                                                                                                                                                           physical environment, and a transition away from the fossil fuels on which many of the region’s
                                                                                                                                                           economies depend. Through their nationally determined contributions (NDC) to the Paris Agreement, all
                                                                                                                                                           SSA countries committed to the increased utilisation of intermittent renewable energy sources (IRES) to
                                                                                                                                                           tackle the twin challenges of energy poverty—which limits economic development—and climate
                                                                                                                                                           change. There is a dearth of analysis on the nature of sustainable energy transition(s) necessary to
                                                                                                                                                           deliver these NDCs, especially given the limited financial and technical resources of SSA. Using Nigeria
                                                                                                                                                           as a case study, this study seeks to address this gap by determining the power system transitions
                                                                                                                                                           required to deliver NDCs alongside universal energy access in SSA by 2050; their financial and policy
                                                                                                                                                           implications; and the barriers and opportunities that they present to sustainable development efforts. We
                                                                                                                                                           find that Nigeria can deliver its NDCs with no added cost implications, thereby debunking the prevalent
                                                                                                                                                           view that climate change mitigation is too costly to pursue in SSA. Furthermore, we find that the higher
                                                                                                                                                           availability and dispatchability of fossil fuel generation makes it critical for the rapid scale-up of energy
                                                                                                                                                           supply; thus, entirely leapfrogging carbon-intensive development will prove costly to SSA. Finally, owing
                                                                                                                Received 11th March 2021,                  to the limited cost reductions that IRES have experienced in SSA, delivering NDCs through the
                                                                                                                Accepted 19th May 2021                     deployment of decentralised IRES systems proves more expensive than using conventional generation.
                                                                                                                DOI: 10.1039/d1ee00746g                    The distributed nature of IRES however means that they can democratise energy investment and job
                                                                                                                                                           creation, thus facilitating the equitable sharing of economic resources which is crucial to conflict
                                                                                                                rsc.li/ees                                 prevention in the fragile socio-political landscapes that pervade the region.

                                                                                                                    Broader context
                                                                                                                    Given its large population, poor socio-economic indices, and abundant fossil fuel resources, sub-Saharan Africa (SSA) can derail global climate change
                                                                                                                    mitigation efforts if it pursues a carbon-intensive development model. Using Nigeria as a case study, this work offers a systems approach to determining
                                                                                                                    integrated electrification pathways that deliver universal energy access alongside the nationally determined contributions (NDC) to the Paris Agreement in SSA
                                                                                                                    countries. We find that the current NDCs have minimal cost implications; thus, there is potential for more ambitious climate change mitigation targets.
                                                                                                                    Furthermore, we find that SSA is yet to experience cost reductions in solar and wind power to the extent seen in advanced economies. Consequently, fossil fuels
                                                                                                                    remain cheaper, and an electrification strategy that seeks to minimise costs alone leads to significant fossil fuel use. We highlight that the value proposition
                                                                                                                    that renewables offer to SSA is not due to their low cost, but to their ability to democratise energy infrastructure, investment, and job creation in undiversified
                                                                                                                    economies and fractured geopolitical landscapes, the types of which are prevalent in the region. Thus, to promote sustainable energy use, electrification
                                                                                                                    planning should have holistic objectives that seek energy equity alongside affordability.

                                                                                                                a
                                                                                                                  Grantham Institute – Climate Change and the Environment, Imperial College Lon-
                                                                                                                  don, Exhibition Road, London, SW7 2AZ, UK.
                                                                                                                  E-mail: h.daggash16@imperial.ac.uk; Tel: +44 (0)7714 262868
                                                                                                                b
                                                                                                                  Centre for Environmental Policy, Imperial College London, Exhibition Road,
                                                                                                                  London, SW7 2AZ, UK
                                                                                                                c
                                                                                                                  Centre for Process Systems Engineering, Imperial College London, Exhibition Road,
                                                                                                                  London, SW7 2AZ, UK
                                                                                                                † Electronic supplementary information (ESI) available. See DOI: 10.1039/
                                                                                                                d1ee00746g

                                                                                                                4018 | Energy Environ. Sci., 2021, 14, 4018–4037                                                         This journal is © The Royal Society of Chemistry 2021
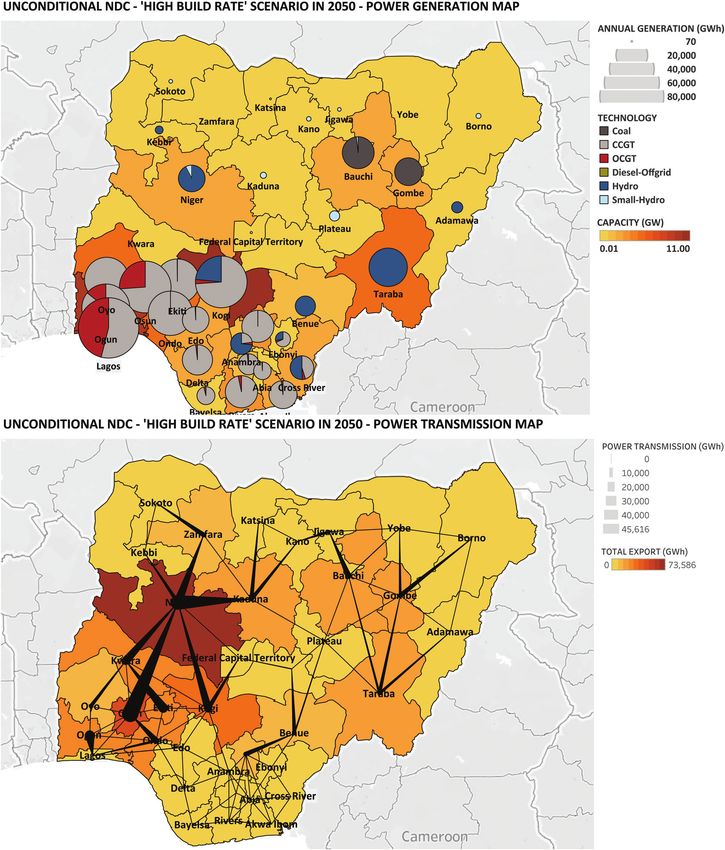
Energy & Environmental Science - PAPER
View Article Online

                                                                                                                Paper                                                                                                                Energy & Environmental Science

                                                                                                                1. Introduction                                                                    (particularly solar, wind and hydro) in the region. All the
                                                                                                                                                                                                   nationally determined contributions (NDCs) submitted by SSA
                                                                                                                Sub-Saharan Africa (SSA)‡ is uniquely vulnerable to the physical
                                                                                                                                                                                                   countries highlighted the increased deployment of renewable
                                                                                                                and socio-economic impacts of climate change because of its
                                                                                                                                                                                                   energy as a priority for climate action and development.16–18
            This article is licensed under a Creative Commons Attribution-NonCommercial 3.0 Unported Licence.

                                                                                                                geography and economy. Climate change projections suggest a
                                                                                                                                                                                                   Currently, 47.7% of the population are without access to
                                                                                                                warming trend on the continent, particularly in the inland
                                                                                                                                                                                                   electricity, and those with access suffer from poor quality and
                                                                                                                subtropics.1 SSA is expected to experience increased frequency
                                                                                                                                                                                                   lack of affordability of supply.6 Fig. 1 illustrates the per capita
                                                                                                                of extreme weather events (droughts, floods and rainstorms),
                                                                                                                                                                                                   electricity consumption and gross domestic product (GDP)§ of
                                                                                                                increased desertification, and changes in crop and soil
                                                                                                                                                                                                   SSA countries. The mean regional electricity consumption and
                                                                                                                productivity.2,3 These environmental stresses threaten the
                                                                                                                                                                                                   GDP levels are 84% and 86% lower than the global averages,
                                                                                                                rain-fed agricultural systems that 70% of the region’s popula-
Open Access Article. Published on 19 May 2021. Downloaded on 10/13/2021 11:44:36 AM.

                                                                                                                                                                                                   respectively.6,19 Thus, SSA must pursue climate change mitiga-
                                                                                                                tion rely on for their livelihoods.4 Incidences of natural disas-
                                                                                                                                                                                                   tion and universal energy access in the face of rapid population
                                                                                                                ters and extreme weather also imperil other key sectors of the
                                                                                                                                                                                                   growth that contributes additional demand, and limited finan-
                                                                                                                region’s economy, including the urban economy, forestry, water
                                                                                                                                                                                                   cial resources.
                                                                                                                resources, coastal areas and settlements, and health.5 The
                                                                                                                                                                                                       There is a danger of imported narratives when discussing
                                                                                                                region’s population, currently at 1.1 billion with 43% below
                                                                                                                                                                                                   climate change mitigation in the sub-Saharan African (SSA)
                                                                                                                the age of 15, is expected to double by 2050 and quadruple by
                                                                                                                                                                                                   context. Many studies have suggested that SSA countries can
                                                                                                                2100.6,7 Demographic pressures will intensify competition for
                                                                                                                                                                                                   leapfrog fossil-fuelled development owing to the falling costs of
                                                                                                                scarce natural resources such as arable land and freshwater.
                                                                                                                                                                                                   renewable electricity generation, mainly solar and wind
                                                                                                                Owing to the fragile socio-political landscapes of many SSA
                                                                                                                                                                                                   power20,21—a recent study projected that some SSA countries
                                                                                                                countries, natural resource competition and environmental
                                                                                                                                                                                                   could rely on solar photovoltaics alone for up to 90% of power
                                                                                                                degradation have historically triggered violent conflict, often
                                                                                                                                                                                                   generation by 2050.22 Additionally, it is often asserted that
                                                                                                                across ethno-religious divides.8–12 Thus, if unmitigated, climate
                                                                                                                                                                                                   least-cost universal energy access can be achieved through the
                                                                                                                change is expected to interact with non-climatic stresses to
                                                                                                                                                                                                   deployment of decentralised mini-grid systems that greatly
                                                                                                                exacerbate the vulnerability of the region’s economic systems,
                                                                                                                                                                                                   reduce the need for centralised generation and transmission
                                                                                                                deepen poverty and increase the likelihood of conflict.2,12,13
                                                                                                                                                                                                   infrastructure.19 Often the energy system or integrated assess-
                                                                                                                   Many SSA countries have recognised the harmful impacts of
                                                                                                                                                                                                   ment models22,23 that underlie these studies have relatively low
                                                                                                                climate change and committed to both domestic policies and
                                                                                                                                                                                                   spatial or temporal granularity so grid reliability and operabil-
                                                                                                                international treaties that promote mitigation and adaption,
                                                                                                                                                                                                   ity—both crucial for the quality of electricity service provided
                                                                                                                alongside development efforts. All 48 SSA countries have signed
                                                                                                                                                                                                   especially in systems dominated by intermittent renewable
                                                                                                                and, with the exception of Eritrea, ratified the 2015 Paris
                                                                                                                                                                                                   energy sources (IRES)—are insufficiently assessed. Further-
                                                                                                                Agreement.14 However, the region’s limited financial and tech-
                                                                                                                                                                                                   more, the principally techno-economic nature of previous
                                                                                                                nical resources, poor infrastructure, and weak governance and
                                                                                                                                                                                                   analyses means that socio-cultural or political considerations
                                                                                                                institutions means that addressing climate change is even
                                                                                                                                                                                                   are entirely absent from discussions on the feasibility of future
                                                                                                                more challenging than currently observed in more prosperous
                                                                                                                                                                                                   energy scenarios. Such analyses, whilst academically interest-
                                                                                                                countries. Owing to the region’s dependence on primary com-
                                                                                                                                                                                                   ing, provide a very limited basis for real-world policy making in
                                                                                                                modity (raw materials and food) exports for fiscal revenues,
                                                                                                                                                                                                   these regions.
                                                                                                                recent commodity price declines and the COVID-19 pandemic
                                                                                                                                                                                                       This paper uses a spatio-temporal power systems planning
                                                                                                                (which led to demand collapse) have depleted government
                                                                                                                                                                                                   tool, the ESONE model,24 to determine optimal transition
                                                                                                                coffers and intensified economic hardship.6,15 In 2020, SSA
                                                                                                                                                                                                   pathways for a country’s electricity system to deliver its NDC
                                                                                                                experienced its first recession in 25 years.6 Furthermore, demo-
                                                                                                                                                                                                   to the Paris Agreement. A key strength of this approach is that
                                                                                                                graphic pressures from both urbanisation, which requires
                                                                                                                                                                                                   the spatially disaggregated nature of this tool allows attention
                                                                                                                improved infrastructure, and a rapidly increasing working-age
                                                                                                                                                                                                   to be given to the implications of fragile, subnational geopoli-
                                                                                                                (15–64) population who require jobs, compound the challenge
                                                                                                                                                                                                   tical landscapes on the feasibility of various transition path-
                                                                                                                of designing effective climate change solutions.
                                                                                                                                                                                                   ways. ESONE is a mixed integer linear optimisation problem
                                                                                                                   The electricity sector has been identified as a potential
                                                                                                                                                                                                   (MILP) that combines generation expansion planning and unit
                                                                                                                driver of both economic growth and climate change mitigation
                                                                                                                                                                                                   commitment model formulations to determine the lowest-cost
                                                                                                                in SSA because of the abundance of renewable energy sources
                                                                                                                                                                                                   system design and electricity dispatch pattern over a planning
                                                                                                                                                                                                   horizon, subject to a set of constraints that maintain grid
                                                                                                                ‡ Sub-Saharan Africa consists of 48 countries: Angola, Benin, Botswana, Burkina    reliability, operability and limit GHG emissions. The model
                                                                                                                Faso, Burundi, Cabo Verde, Cameroon, Central African Republic, Chad, Comoros,      is described in detail in the Methods section. Owing to
                                                                                                                Côte d’Ivoire, Democratic Republic of the Congo, Equatorial Guinea, Eritrea,      the unavailability of data on electric power infrastructure,
                                                                                                                Eswatini, Ethiopia, Gabon, the Gambia, Ghana, Guinea, Guinea-Bissau, Kenya,
                                                                                                                                                                                                   and computational complexity, it is not possible to model all
                                                                                                                Lesotho, Liberia, Madagascar, Malawi, Mali, Mauritania, Mauritius, Mozambi-
                                                                                                                que, Namibia, Niger, Nigeria, Republic of Congo, Rwanda, Sao Tome and
                                                                                                                Principe, Senegal, Seychelles, Sierra Leone, Somalia, South Africa, South Sudan,   § Gross domestic product is the total monetary or market value of all the finished
                                                                                                                Sudan, Tanzania, Togo, Uganda, Zambia, and Zimbabwe.                               goods and services produced within a country’s borders in a year.

                                                                                                                This journal is © The Royal Society of Chemistry 2021                                                   Energy Environ. Sci., 2021, 14, 4018–4037 | 4019
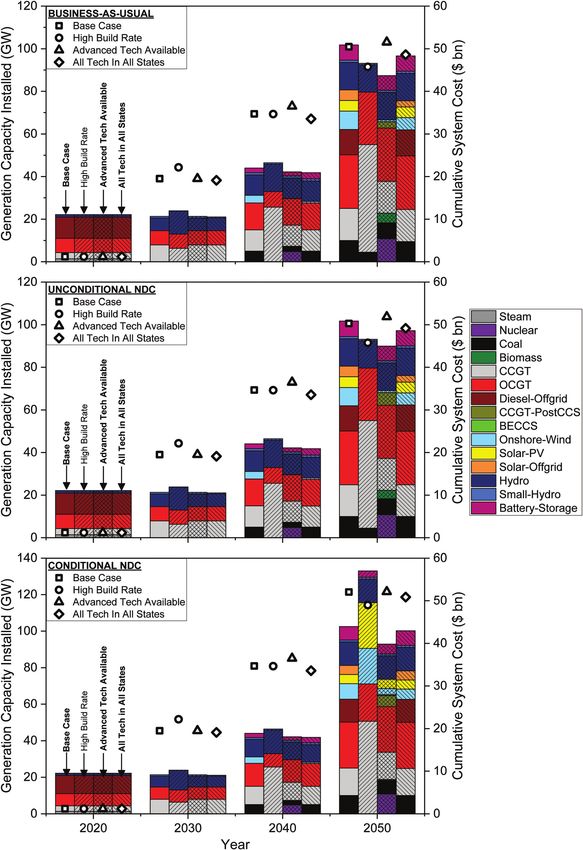
Energy & Environmental Science - PAPER
View Article Online

                                                                                                                Energy & Environmental Science                                                                                                                      Paper
            This article is licensed under a Creative Commons Attribution-NonCommercial 3.0 Unported Licence.
Open Access Article. Published on 19 May 2021. Downloaded on 10/13/2021 11:44:36 AM.

                                                                                                                Fig. 1    Per capita electricity consumption and gross domestic product (GDP) of sub-Saharan African countries. All data is obtained from the World Bank.6

                                                                                                                48 SSA countries at sufficient levels of spatial and temporal                    2013, generation and distribution assets were privatised to
                                                                                                                granularity. Consequently, this study uses Nigeria as a case                   improve efficiencies and attract investment into the sector.
                                                                                                                study to derive insights for sustainable power systems planning                PHCN was unbundled into 6 state-owned generation compa-
                                                                                                                for the rest of the region.                                                    nies (GenCos) and 11 distribution companies (DisCos) and sold
                                                                                                                   Nigeria exemplifies the challenges that the rest of the region              to private entities.28 The Federal Government of Nigeria (FGN)
                                                                                                                faces. A historic dependence on the oil and gas exports for 47–                retained ownership of the national transmission network under
                                                                                                                85% of government revenues has left the economy vulnerable                     the Transmission Company of Nigeria (TCN), which consists of
                                                                                                                to a climate change-induced energy transition that will lower                  a system operator and a market operator.25,29,30 Thus far,
                                                                                                                the price of, or demand for, fossil fuels.25,26 Crude oil price                privatisation efforts failed to create a functioning market that
                                                                                                                collapses in 2014 and 2020 (due to demand collapse from the                    is fit for the purpose of providing reliable and affordable power
                                                                                                                COVID-19 pandemic) have since limited GDP growth rate to a                     to the population, owing to weak governance and institutions.
                                                                                                                maximum of 2% which is lower than the population growth                        The current power system continues to operate well-below
                                                                                                                rate.6 Population, currently 193 million with 44% below the age                international reliability and security standards resulting in
                                                                                                                of 14, is expected to double by 2050 when it is expected to be the             frequent system collapses. In 2016 alone, 22 full collapses
                                                                                                                third most populous nation in the world.6,7 Furthermore,                       and 9 partial collapses occurred.28
                                                                                                                cultural and religious heterogeneity has created a fragile poli-                   Although installed power generation capacity is near 13 000
                                                                                                                tical landscape in the country, with ethno-religious conflicts                 MW, actual generation has never been greater than 5000 MW31
                                                                                                                often triggered by environmental insecurity (farmer–herder                     for several reasons: outage of generation units due to lack of
                                                                                                                clashes over pastureland, water scarcity and pollution, and                    maintenance (3674 MW); inadequate gas supply to power
                                                                                                                droughts).8–10 Similarly, Nigeria exemplifies the opportunities                plants (3704 MW) due to pipeline vandalism and lack of
                                                                                                                that climate action presents to SSA. Its abundance of well-                    investment in network expansion;32 and transmission line
                                                                                                                distributed renewable energy sources holds significant                         constraints and water shortages (1268 MW) (Fig. 2).33 Ageing
                                                                                                                potential for economic development and diversification, and
                                                                                                                job creation. Additionally, the international climate finance
                                                                                                                that has been pledged for developing countries could also
                                                                                                                prove to be a vital source of financing for climate change
                                                                                                                mitigation and economic development in the country.27

                                                                                                                1.1      Overview of the Nigerian power sector
                                                                                                                Until 2007, the government was responsible for all policy
                                                                                                                formulation, regulation, operation and investment in the power
                                                                                                                sector—with regulation handled by the Federal Ministry of
                                                                                                                Power and operation handled by the state-owned National
                                                                                                                Electric Power Authority (NEPA).25 In 2007, NEPA was restruc-
                                                                                                                tured into the Power Holding Company of Nigeria (PHCN). In                     Fig. 2   Installed and available power generation capacity in Nigeria.

                                                                                                                4020 | Energy Environ. Sci., 2021, 14, 4018–4037                                                This journal is © The Royal Society of Chemistry 2021
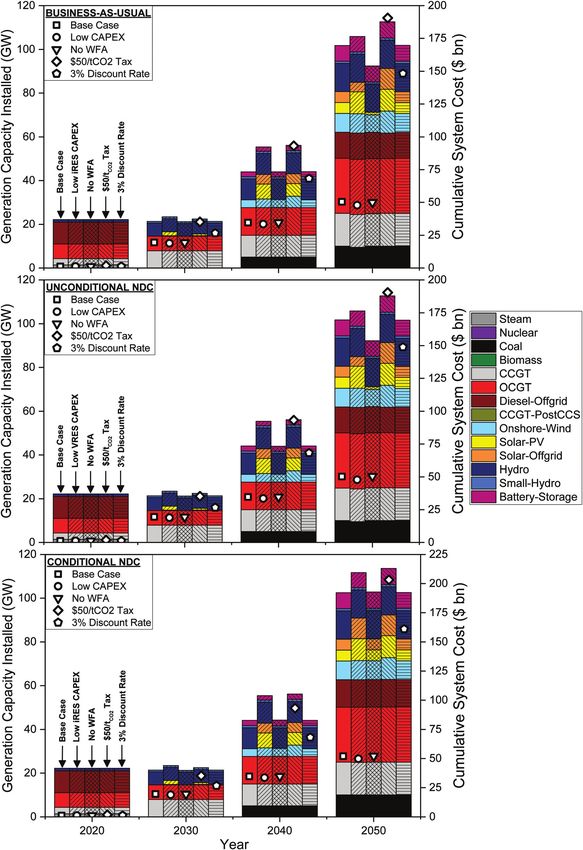
Energy & Environmental Science - PAPER
View Article Online

                                                                                                                Paper                                                                                                Energy & Environmental Science

                                                                                                                and non-maintenance has also rendered many transmission                Table 1   GHG reduction potential of key mitigation measures in 203043
                                                                                                                lines non-operational. 98 of the 114 inter-state high voltage
                                                                                                                                                                                                                                     Potential GHG reduction
                                                                                                                lines were built before 2000.34 The radial structure of the                                                          (million tonnes of
                                                                                                                network and single line contingency also leaves the system             Measure                                       CO2e per year in 2030)
            This article is licensed under a Creative Commons Attribution-NonCommercial 3.0 Unported Licence.

                                                                                                                prone to failure as alternative routing is not available.35 Finally,   Economy-wide energy efficiency                  179
                                                                                                                the long length (4300 km) of many lines results in significant         Efficient gas power stations                    102
                                                                                                                network losses which have been estimated at 14–20% of                  Work towards ending of gas flaring             64
                                                                                                                                                                                       Climate smart agriculture                      74
                                                                                                                electricity generated.25,31,35                                         Reduced transmission losses                    26
                                                                                                                    The lack of financial viability of the power sector has            Renewable energy                               31
                                                                                                                deterred domestic and foreign investment. This is principally
Open Access Article. Published on 19 May 2021. Downloaded on 10/13/2021 11:44:36 AM.

                                                                                                                due to the absence of a cost-reflective tariff; significant collec-
                                                                                                                tion losses by distribution companies (DisCos) because of non-         per person. The NDC identified several measures, shown in
                                                                                                                metering and non-payment of bills by consumers; and capped             Table 1, as the largest potential sources of GHG emissions
                                                                                                                domestic gas prices that drive producers to export                     reductions. It is seen that the power sector is considered most
                                                                                                                markets.25,32,33,36,37 Electricity tariffs are set by the Nigerian      critical to climate change mitigation, with a GHG reduction
                                                                                                                Electricity Regulatory Commission (NERC), the power sector’s           potential of 159 MtCO2 from more efficient gas power plants,
                                                                                                                regulator. For reasons of political expediency (to avoid the loss      reduced transmission network losses and increased utilisation
                                                                                                                of public support), Nigerian legislators have repeatedly blocked       of renewable energy sources.44 This figure does not include
                                                                                                                an increase in tariffs.38 Broader issues such as the perceived          further mitigation from the ending of gas flaring and improved
                                                                                                                high risk investment environment due to security issues, wide-         economy-wide energy efficiency, some of which include the
                                                                                                                spread corruption, a multiple-rate foreign exchange regime,            power sector.
                                                                                                                and political instability have deterred investment in the                  Power sector decarbonisation targets have not been legis-
                                                                                                                economy.39                                                             lated in Nigeria so the annual GHG emissions allowances for
                                                                                                                    The lack of appropriate regulatory frameworks for alterna-         the sector were determined as follows. The BAU GHG emissions
                                                                                                                tive energy technologies, such as power purchase agreements            projections were defined in the Nigeria’s NDC, which also
                                                                                                                (PPAs) for renewable energy suppliers, discourages investment          states that approximately 60% of emissions reductions by
                                                                                                                in the power system.29 Additionally, standards for equipment           2030 are achieved from electricity generation in an Uncondi-
                                                                                                                such as solar panels also have not been defined by the govern-         tional NDC scenario. With this, a BAU projection for the power
                                                                                                                ment. This is largely due to poor coordination between the             sector was derived and the mitigation potential estimates were
                                                                                                                relevant ministries, departments and agencies (MDAs), and a            used to determine the emissions reductions delivered by the
                                                                                                                general lack of competence within those authorities.40 Finally,        sector in 2030 given the NDC commitments. Having deter-
                                                                                                                the inability of government to enforce the rule of law to ensure       mined the sector’s carbon budget from 2015 to 2030, linear
                                                                                                                bill payment and to prevent illegal connections to the grid            extrapolation was used to estimate the carbon budget until
                                                                                                                hampers the sector.40 The lack of public trust in DisCos and,          2050. The carbon budget—that is, the amount of GHG emis-
                                                                                                                more generally, the government greatly limits the latter’s ability     sions allowed from the sector—under BAU, Unconditional NDC
                                                                                                                to implement necessary reforms in the sector.38,41                     and Conditional NDC scenarios are illustrated in Fig. 3. In the
                                                                                                                                                                                       BAU scenario, electricity is expected to contribute 639 MtCO2 per
                                                                                                                1.2 Nigeria’s nationally determined contributions to the Paris         year to economy-wide GHG emissions by mid-century. In the
                                                                                                                Agreement                                                              Unconditional and Conditional NDC scenarios, this is expected
                                                                                                                For the purpose of developing Nigeria’s NDC, a Low Emissions
                                                                                                                Analysis Platform (LEAP) model of the economy was developed
                                                                                                                and a business-as-usual (BAU) GHG emissions projection was
                                                                                                                determined.42,43 LEAP uses a bottom-up approach to modelling
                                                                                                                that is grounded in sector-based analysis. With the founda-
                                                                                                                tional assumption of an average annual economic growth rate
                                                                                                                of 5% until 2030, the model estimated that economy-wide GHG
                                                                                                                emissions will rise to 900 million tonnes of CO2e per year by
                                                                                                                2030 in a business-as-usual (BAU) scenario; this would be
                                                                                                                equivalent to per capita emissions of 3.4 tCO2e per person.43 In
                                                                                                                its first NDC submission, Nigeria committed to an uncondi-
                                                                                                                tional reduction of 20% of economy-wide GHG emissions
                                                                                                                relative to the BAU scenario, and a conditional reduction of
                                                                                                                45% relative to BAU if provided with sufficient international
                                                                                                                support ‘‘in the form of finance and investment, technology
                                                                                                                and capacity building’’.43 Under the Conditional NDC, per              Fig. 3 Emissions scenarios for Nigeria’s nationally determined contribu-
                                                                                                                capita emissions are expected to remain constant at 2 tCO2e            tions to the Paris Agreement.

                                                                                                                This journal is © The Royal Society of Chemistry 2021                                     Energy Environ. Sci., 2021, 14, 4018–4037 | 4021
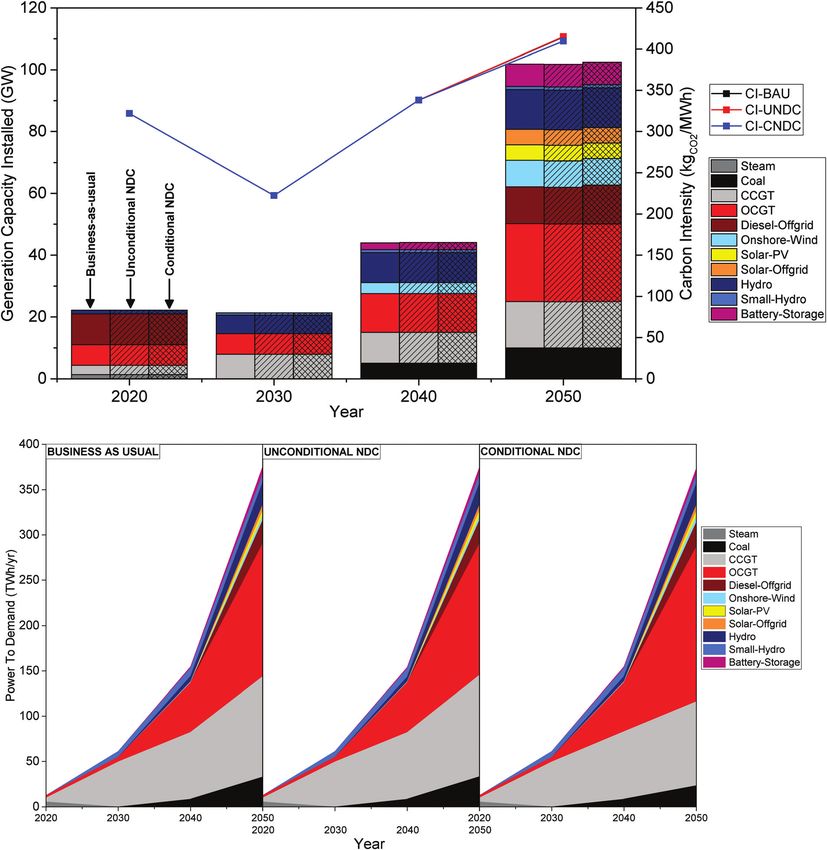
Energy & Environmental Science - PAPER
View Article Online

                                                                                                                Energy & Environmental Science                                                                                                         Paper

                                                                                                                Table 2   Nigeria’s fossil fuel reserves and annual production rates49

                                                                                                                                                                                                                                      Years of remaining at
                                                                                                                Fossil fuel                         Total proved reserves (end of 2018)         Annual production (2018)              current extraction rates
            This article is licensed under a Creative Commons Attribution-NonCommercial 3.0 Unported Licence.

                                                                                                                Crude oil                           37.5 billion barrels                        2.051 million barrels per day         50 years
                                                                                                                Natural gas                         5.3 trillion cubic metres                   49.2 billion cubic metres             108 years
                                                                                                                Coal (total recoverable)            209.4 million short tonnes                  n/a                                   n/a

                                                                                                                to fall to 414 and 134 MtCO2 per year, respectively, by 2050. In          allowed, minimum reserve capacity and minimum system
                                                                                                                all scenarios, there is a significant increase in electricity-            inertia required are specified for the whole system.
Open Access Article. Published on 19 May 2021. Downloaded on 10/13/2021 11:44:36 AM.

                                                                                                                derived GHG emissions, which are currently estimated at                       Owing to the computational difficulty of running the
                                                                                                                23.5 MtCO2 per year.45                                                    model with perfect foresight, myopic foresight of two planning
                                                                                                                                                                                          periods of 20 years is assumed. This is implemented by first
                                                                                                                1.3   Energy resources for power generation                               solving the model for two planning periods (2020–2030 and
                                                                                                                Nigeria’s significant reserves and production of fossil fuel              2030–2040). The solutions of the first iteration are then fixed as
                                                                                                                resources are detailed in Table 2. Despite the abundance of               input parameters for the final iteration (2040–2050).
                                                                                                                natural gas in the country, dedicated exploration for the fuel                Initial transmission network is specified according to the
                                                                                                                has never occurred. The production figures shown below                    existing 132 kV and 330 kV lines across the country (see ESI†). It
                                                                                                                consist solely of associated petroleum gas.25 Nigeria’s coal,             is assumed that power flow is between the centroid of each
                                                                                                                concentrated in Kogi and Enugu states, is mainly lignite and              zone i.e., demand is concentrated at each transmission node.
                                                                                                                sub-bituminous types with small quantity of high volatile                 Power distribution to consumers is not considered. Power
                                                                                                                bituminous coal.46 Hydro power potential has been estimated               transmission is assumed to be possible between bordering
                                                                                                                at 12 220 MW.47 The technical potentials of other renewable               zones only.
                                                                                                                energy sources are appreciable: small hydro (735 MW), solar                   Optimal power flow is modelled as direct current (DC)
                                                                                                                CSP (36 683 MW), solar PV (492 471 MW), biomass (7291 MW),                flow, assuming constant current, generator voltages, angles and
                                                                                                                and wind (44 024 MW).48                                                   power factor (VAr/Watt ratio). Energy losses are a function of
                                                                                                                                                                                          transmission line length and power flow.24
                                                                                                                                                                                              Owing to the relatively small size of Nigeria’s neighbouring
                                                                                                                2. Methods                                                                countries to which it exports electricity, electricity import
                                                                                                                2.1   Modelling the Nigerian electricity system                           potential was not considered.
                                                                                                                                                                                              Unmet electricity demand is penalised through the Value
                                                                                                                The Nigerian electricity system was modelled using the ESONE              of Lost Load (VoLL) – an added system cost of $10 000 per MW h.
                                                                                                                model. The ESONE is a spatially-disaggregated version of the                  Maximum power flow between zones, transmission line
                                                                                                                Electricity System Optimisation modelling framework.24,50 It is           build rate, and maximum transmission capacity between states
                                                                                                                a mixed integer linear optimisation problem (MILP) that com-              are all specified.
                                                                                                                bines generation expansion planning and unit commitment                       To reduce computation time to less than a day per model
                                                                                                                model formulations to determine the lowest-cost system design             run, technology cost learning is implemented exogenously i.e.,
                                                                                                                and electricity dispatch pattern over a planning horizon, sub-            capital costs vary temporally irrespective of their deployment
                                                                                                                ject to a set of constraints that maintain power system relia-            level within the system. The cost projections input into the
                                                                                                                bility, operability and limit GHG emissions. The spatial                  model are detailed in the ESI.†
                                                                                                                disaggregation allows for both generation and transmission                    No shadow carbon price is included in the model.
                                                                                                                capacity expansion planning, where the transmission network
                                                                                                                is modelled as power flow between zones. The detailed math-
                                                                                                                ematical formulation of the model has been described                      2.2   ESONE-Nigeria model inputs
                                                                                                                previously.24 The key features of the model are provided below.              Future electricity demand. In 2015, the National Control
                                                                                                                     The country (for the purpose of this study, Nigeria) has            Centre (NCC) Osogbo, part of the Transmission Company of
                                                                                                                been discretised into 37 zones. These correspond to the 36                Nigeria, released a daily operational report that showed a peak
                                                                                                                states and the Federal Capital Territory, which are semi-                 generation of 4885 MW and a peak demand (connected +
                                                                                                                autonomous regions in the Nigerian federation.                            suppressed load) forecast of 14 630 MW.31 This shows that
                                                                                                                     The initial year in the model is 2020. Optimal system               Nigeria was then meeting only a third of estimated demand.
                                                                                                                design—both generation and transmission capacity—are deter-               Thus, power generation and transmission network must be
                                                                                                                mined in time steps each of 10 years duration.                            expanded to both reduce suppressed load and cater to addi-
                                                                                                                     Initial capacity availability, maximum deployment, and              tional demand resulting from population and economic
                                                                                                                electricity demand are specified for each zone. Wind, solar and           growth. The results presented above assume that suppressed
                                                                                                                hydro resource availability is specified for each zone. Other             demand decreases exponentially until 2050 when it is zero. This
                                                                                                                system-wide constraints such as annual carbon emissions                   matches the historical evolution of electrification rates across

                                                                                                                4022 | Energy Environ. Sci., 2021, 14, 4018–4037                                        This journal is © The Royal Society of Chemistry 2021
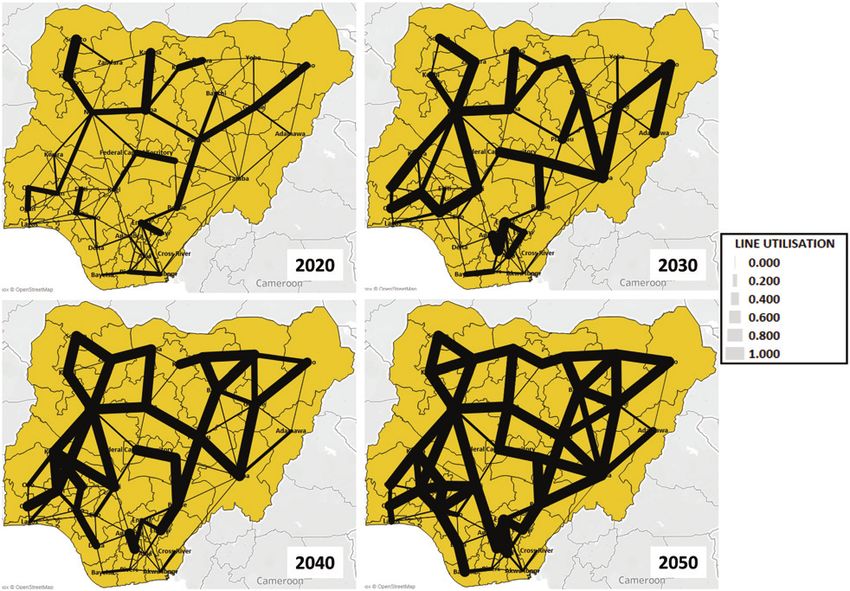
Energy & Environmental Science - PAPER
View Article Online

                                                                                                                Paper                                                                                          Energy & Environmental Science

                                                                                                                sub-Saharan countries since the 1990s.6 A study by the Trans-       centroid (arithmetic mean of all data points in that cluster) is
                                                                                                                mission Company of Nigeria showed that total electricity            minimised. Temporal data were clustered into 11 clusters
                                                                                                                demand is expected to rise to approximately 70 GW by 2050.          (10 groups and the peak day). The algorithm implemented in
                                                                                                                This projection and the daily electricity dispatch profile          R is detailed in the ESI.†
            This article is licensed under a Creative Commons Attribution-NonCommercial 3.0 Unported Licence.

                                                                                                                assumed in this study have been taken from that report (see
                                                                                                                ESI†).
                                                                                                                    System reliability and operability requirements. Currently,     3. Results and discussion
                                                                                                                the Nigerian power system’s frequency and reserve require-
                                                                                                                ments are well-below international security and reliability         The ESONE model (detailed in the Methods section) was used
                                                                                                                standards.28 A minimum reserve margin of 5% and dynamic             to determine the lowest-cost power systems that deliver the
                                                                                                                                                                                    three sets of emissions scenarios illustrated in Fig. 3. Initial
Open Access Article. Published on 19 May 2021. Downloaded on 10/13/2021 11:44:36 AM.

                                                                                                                reserve (added capacity reserve due to increasing penetration of
                                                                                                                IRES) of 15% of IRES generation is implemented in the ESONE         model simulations revealed that historical rates of technology
                                                                                                                model. This is based on the standards for the UK electricity        deployment are insufficient to deliver 100% energy access by
                                                                                                                system. A discount rate of 10% is applied to all future cash        mid-century. Instead, technology deployment rates of at least
                                                                                                                flows, and transmission network losses are assumed to be            0.5 GW per year—twice the fastest rate at which Nigeria has but
                                                                                                                15%.31                                                              power plants historically—are necessary. The results shown
                                                                                                                    Wind, solar and hydro availabilities. The spatial and tem-      subsequently assume that this build rate increase is feasible.
                                                                                                                poral variation in the capacity factors of wind, solar and hydro
                                                                                                                power were considered in the ESONE model. Hydro availability        3.1   Cost-optimal decarbonisation pathways
                                                                                                                was calculated based on the daily generation profiles of the        We observe that, until 2050, the least-cost system design for all
                                                                                                                three operational hydroelectric power stations in the country:      three emissions scenarios is the same (within model error).
                                                                                                                Kainji, Shiroro and Jebba dams, all located in Niger state (see     That is, a business-as-usual power system is sufficient to deliver
                                                                                                                ESI†). The availability factor was calculated by daily peak         even the conditional NDC under the Paris Agreement (see
                                                                                                                generation for the year by the daily generation. Hourly avail-      Fig. 4). Such a system sees an aggressive expansion of thermal
                                                                                                                ability of wind and solar were obtained from Renewables ninja, a    generation from coal, gas and hydro power plants. Between
                                                                                                                tool which uses weather data from global reanalysis models          2030 and 2050, CCGT capacity rises by 417% to 15 GW, OCGT
                                                                                                                and satellite observations to simulate the output of wind and       capacity almost quadruples to 25.2 GW, and hydro capacity
                                                                                                                solar power plants.51–55                                            (both large-scale and smaller run-of-the-river scale) increases
                                                                                                                    Power plant build rates. Historical data was used to deter-     twelvefold to its geographically-constrained maximum of
                                                                                                                mine the maximum rate at which Nigeria has added generation         13.9 GW. Gas and hydro generation are maximally-deployed
                                                                                                                capacity historically was calculated. This was found to be          i.e., as much is built as allowed by the build rate constraints or
                                                                                                                0.63 GW per year for OCGTs, 0.25 GW per year for CCGTs              geographic potential in the case of hydro. However, the
                                                                                                                and gas-fired and 0.24 GW per year for hydroelectric power          expanded capacity is insufficient to meet nationwide demand
                                                                                                                stations—the only power technologies that have been deployed        which peaks at 69.3 GW in 2050. The initial stock of diesel
                                                                                                                at scale. Initial ESONE model simulations revealed that tech-       generators (10 GW) which reached their end-life in 2030 is
                                                                                                                nology build rates need to be at least 0.5 GW per year for the      replaced in 2050 when 11.9 GW are deployed. New technologies
                                                                                                                universal energy access target to be met by 2050. Consequently,     are also relied upon to meet peak demand: coal (10 GW), solar-
                                                                                                                all technology build rates were set to 0.5 GW per year except for   PV (5 GW), off-grid solar (5 GW), and onshore wind (8.6 GW)
                                                                                                                OCGT and diesel generators (1.26 GW per year) which have had        and battery storage (7.3 GW). Batteries compensate for the
                                                                                                                higher build rates historically.                                    variability in IRES supply and store energy from thermal gen-
                                                                                                                    Technology costs. For ease of computation, the ESONE            erators during low demand hours for peak times.
                                                                                                                model considers technology cost learning exogenously. Current           Gas generation has the largest share of actual electricity out-
                                                                                                                and future technology cost assumptions are taken from the           put owing to its low CAPEX and OPEX. The Nigerian govern-
                                                                                                                International Energy Agency World Energy Outlook 2018.56 The        ment mandates natural gas price caps and domestic quotas
                                                                                                                emissions associated with electricity generation from different      from producers which keeps the fuel cheap.25 In contrast, the
                                                                                                                technologies are provided in the ESI.† Upstream methane (CH4)       diesel market was deregulated in 2013 so it is a relatively
                                                                                                                emissions for fossil fuel generation are not included in the        expensive fuel. Consequently, diesel’s share of actual genera-
                                                                                                                system emissions calculation.                                       tion is approximately half of its share of capacity installed
                                                                                                                    Data clustering. For ease of model computation, temporal        (12.5%). Owing to their low availabilities, IRES share of total
                                                                                                                data implemented in the model (electricity demand, import           demand met is low despite contributing 20% of installed
                                                                                                                prices, and wind, solar and hydro availabilities) were clustered    capacity in 2050. The amount of CO2 emitted per MW h of
                                                                                                                using the k-means clustering algorithm. The algorithm is an         electricity generated is seen to fall sharply between 2020 and
                                                                                                                iterative one which seeks to partition a dataset into distinct      2030, mainly due to the temporary diesel phase-out. However,
                                                                                                                sub-groups where each data point belongs to only one group.         increased unabated fossil fuel use results in rising carbon
                                                                                                                Data points are assigned to a cluster such that the sum of the      intensity (CI) until 2050. Although power generation capacity
                                                                                                                squared distance between the data points and the cluster’s          rises by 325% over the planning horizon, the utilisation of

                                                                                                                This journal is © The Royal Society of Chemistry 2021                                Energy Environ. Sci., 2021, 14, 4018–4037 | 4023
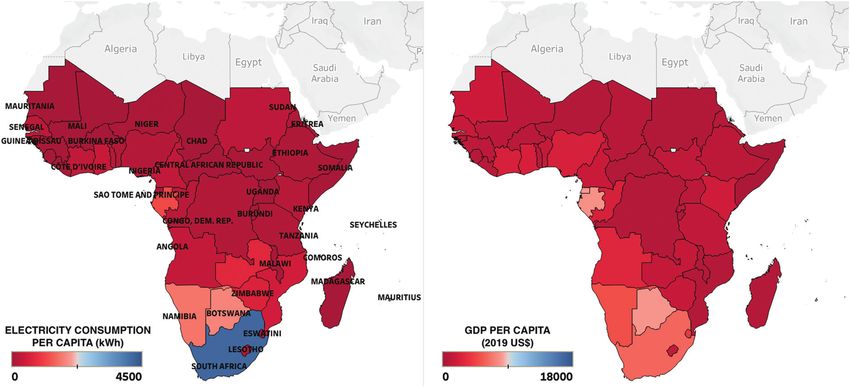
Energy & Environmental Science - PAPER
View Article Online

                                                                                                                Energy & Environmental Science                                                                                                                     Paper
            This article is licensed under a Creative Commons Attribution-NonCommercial 3.0 Unported Licence.
Open Access Article. Published on 19 May 2021. Downloaded on 10/13/2021 11:44:36 AM.

                                                                                                                Fig. 4 Optimal power generation mix (above) and electricity dispatch (below) for the Nigerian electricity system from 2020 to 2050 for different
                                                                                                                emissions targets, under base case assumptions for technology costs and build rates. The three emissions scenarios investigated are: ‘Business-as-usual
                                                                                                                (BAU)’, ‘Unconditional NDC’, and ‘Conditional NDC’; the emissions levels in each of these scenarios are illustrated in Fig. 3. The figure above also shows
                                                                                                                the carbon intensity of electricity generated in each year (right y-axis).

                                                                                                                relatively low-carbon natural gas results in only a 29% increase              least-cost power system, irrespective of the emissions target.
                                                                                                                in carbon intensity.                                                          Gas plants are concentrated in the south of the country where
                                                                                                                   3.1.1 Spatial distribution of power generation. Owing to                   the oil and gas fields are located, and pipelines exist. The state
                                                                                                                the complexity and fragility of Nigeria’s geopolitical landscape,             of Lagos which contributes a fifth of national demand has the
                                                                                                                the spatial distribution of power infrastructure—and thus                     highest generation capacity installed (10 GW). Its only border-
                                                                                                                investment and job creation in the sector—between states                      ing state Ogun has the third highest capacity per state (5.6 GW)
                                                                                                                and geopolitical zones is particularly important. Fig. 5 maps                 and is the largest state-exporter of power, mostly to Lagos. With
                                                                                                                the distribution of generation and transmission infrastructure                the exception of the Ogun–Lagos line, south–south transmis-
                                                                                                                for the systems shown in Fig. 4. As highlighted previously,                   sion is limited as states have gas plants that serve domestic
                                                                                                                natural gas-fired power plants dominate the energy mix in a                   demand, thereby minimising the need for imports. In the

                                                                                                                4024 | Energy Environ. Sci., 2021, 14, 4018–4037                                               This journal is © The Royal Society of Chemistry 2021
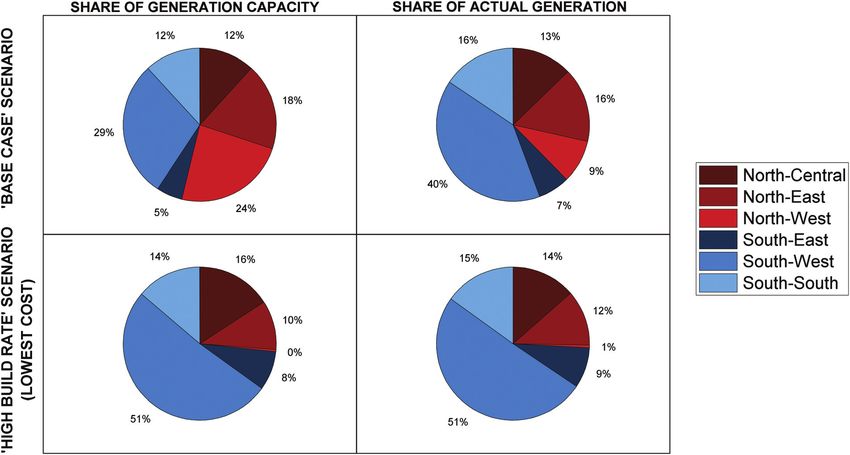
Energy & Environmental Science - PAPER
View Article Online

                                                                                                                Paper                                                                                                  Energy & Environmental Science
            This article is licensed under a Creative Commons Attribution-NonCommercial 3.0 Unported Licence.
Open Access Article. Published on 19 May 2021. Downloaded on 10/13/2021 11:44:36 AM.

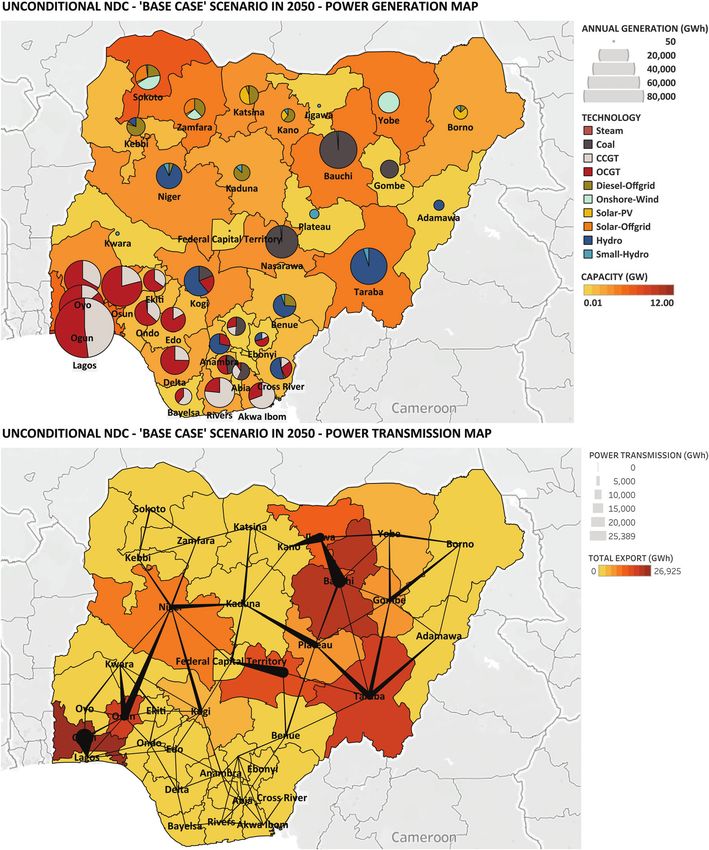
                                                                                                                Fig. 5 Map showing power generation capacity and transmission by state and by technology in 2050 under Nigeria’s Unconditional NDC scenario. Base
                                                                                                                case technology costs and build rates are assumed.

                                                                                                                South-East, the added availability of coal and hydro generation           oil and gas infrastructure has rendered such a project to be
                                                                                                                in several states further diminishes the need for electricity             considered as a security risk. In the absence of gas generation,
                                                                                                                imports and added transmission lines.                                     large hydro (10.7 GW), small hydro (1 GW), onshore wind (8.6
                                                                                                                   The unavailability of natural gas in the northern states and           GW), solar (8.2 GW), coal (4.8 GW), diesel (9.6 GW) and batteries
                                                                                                                the lack of pipelines from production areas means that a                  (4 GW) are deployed across 14 states to meet demand. Solar and
                                                                                                                diverse mix of energy sources is utilised to meet regional                wind plants are mainly built in the Sahelian parts (Sokoto,
                                                                                                                demand. Historically, the extension of the existing pipeline              Zamfara, Borno) of the country where availabilities are highest.
                                                                                                                network has proved infeasible because of the large distances                 The North-West (NW), which accounts for a quarter of the
                                                                                                                that need to be overcome. Additionally, a history of attacks on           country’s population, still experiences unmet demand. This is

                                                                                                                This journal is © The Royal Society of Chemistry 2021                                       Energy Environ. Sci., 2021, 14, 4018–4037 | 4025
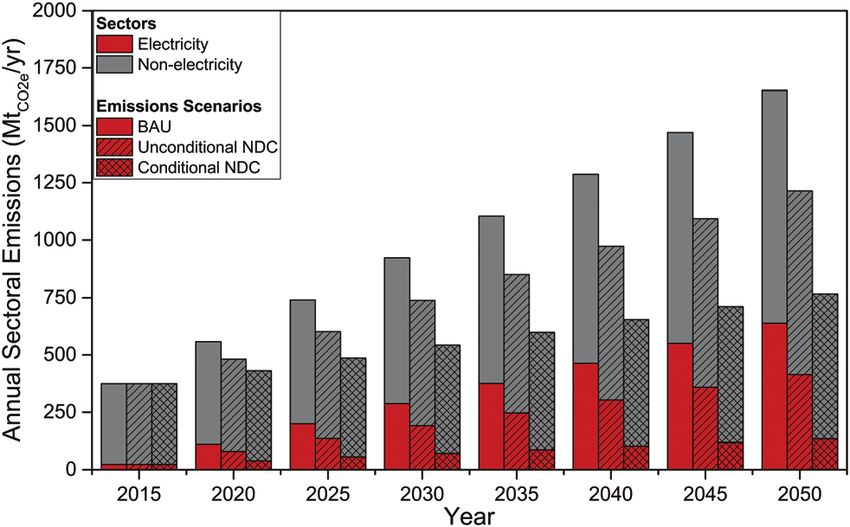
Energy & Environmental Science - PAPER
View Article Online

                                                                                                                Energy & Environmental Science                                                                                                                  Paper
            This article is licensed under a Creative Commons Attribution-NonCommercial 3.0 Unported Licence.
Open Access Article. Published on 19 May 2021. Downloaded on 10/13/2021 11:44:36 AM.

                                                                                                                Fig. 6 Optimal power generation capacity mix (left y-axis) and cumulative system cost (right y-axis) of the Nigerian power system under different
                                                                                                                emissions scenarios and modelling assumptions. Cumulative system cost in year a is the total capital and operating costs invested into the system until
                                                                                                                year a. The three emissions scenarios investigated are: ‘Business-as-usual (BAU)’, ‘Unconditional NDC’, and ‘Conditional NDC’; the emissions levels in
                                                                                                                each of these scenarios are illustrated in Fig. 3. The different sets of modelling assumptions are described in Section 3.2.

                                                                                                                4026 | Energy Environ. Sci., 2021, 14, 4018–4037                                             This journal is © The Royal Society of Chemistry 2021
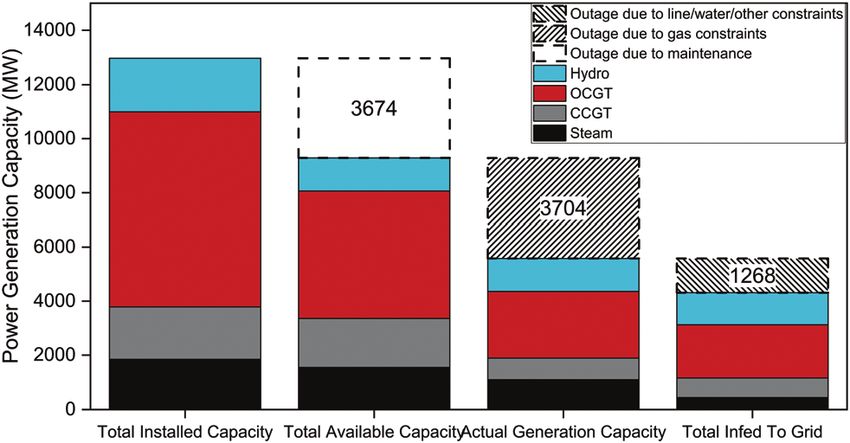
Energy & Environmental Science - PAPER
View Article Online

                                                                                                                Paper                                                                                                        Energy & Environmental Science

                                                                                                                satisfied with imports from southern states (via Osun and                         century falls from 10 to 4.5 GW. Thus, it is possible to deliver
                                                                                                                Niger) and 4 GW of battery storage which shift excess supply                      Nigeria’s unconditional NDC without the deployment of IRES,
                                                                                                                to the evening peak. For the North-East region, it proves                         and with the deployment of coal power.
                                                                                                                cheaper to rely on coal than on diesel generation (because of                         The availability of advanced generation technologies has no
            This article is licensed under a Creative Commons Attribution-NonCommercial 3.0 Unported Licence.

                                                                                                                its high OPEX) or other imports (because of the additional                        significant impact on the total system cost (within the model
                                                                                                                investment required in transmission capacity over long dis-                       error) however total installed capacity in 2050 falls by 12%. By
                                                                                                                tances). High-utilisation coal plants in Bauchi (4 GW), Nasar-                    mid-century, nuclear (10.8 GW), biomass (4 GW) and CCGT-
                                                                                                                awa (3 GW) and Gombe (1 GW)—all states with relatively low                        CCS (6 GW) are built. The higher availabilities of these baseload
                                                                                                                demand—make them the largest state-exporters of electricity to                    low-carbon generators displace the need for any solar, which
                                                                                                                neighbouring states. Inter-state power transmission, and thus                     has low availability and requires added grid flexibility, and
Open Access Article. Published on 19 May 2021. Downloaded on 10/13/2021 11:44:36 AM.

                                                                                                                cooperation, is crucial to delivering electricity at least cost.57                diesel, which has a high OPEX thus is only used during peak
                                                                                                                    Optimal system design differs significantly by region                          hours. Onshore wind capacity is also displaced but 0.9 GW
                                                                                                                because of resource availability and geography. Southern states                   remain in 2050. Thus, the availability of advanced technologies
                                                                                                                rely on natural gas-fired plants and minimal inter-state/regio-                   could reduce the amount of infrastructure that needs to be
                                                                                                                nal transmission lines. Despite the abundant landmass and                         built to meet demand, however their relatively high capital
                                                                                                                relatively high availability of IRES in the north, they are                       costs means that lower total installed capacity does not trans-
                                                                                                                insufficient to meet domestic demand. Electricity imports from                      late to reduced system costs.
                                                                                                                states with large hydro and coal generation capacities are                            When gas- and coal-fired power plants can be built in states
                                                                                                                critical to meet the shortfall in demand. Off-grid generation                      that do not have the resource, the total system cost and
                                                                                                                via diesel, solar and small-scale hydro is also necessary.                        installed capacity in 2050 both fall by 4%. These fossil plants
                                                                                                                                                                                                  are deployed in the North-West and North-East regions of the
                                                                                                                3.2   Cost of delivering the Paris Agreement                                      country, where they displace some off-grid solar and onshore
                                                                                                                                                                                                  wind capacity.
                                                                                                                There is considerable uncertainty in the ESONE-Nigeria model                          3.2.2 Conditional NDC. Under the Conditional NDC emis-
                                                                                                                parameters including technology costs, build rates and avail-                     sions pathway, faster power plant build rates result in a 30%
                                                                                                                abilities, owing to a lack of historic precedent. Consequently,                   increase in total installed capacity in 2050. Total system cost,
                                                                                                                the implications of a range of modelling assumptions for                          however, decreases by 6%. Gas-fired and IRES generation
                                                                                                                system design and decarbonisation costs were investigated                         capacities increase by 74% and 141%, respectively. No coal or
                                                                                                                (see Fig. 6 and 8). The cumulative system cost (CSC) in year a                    diesel generation is built throughout the planning horizon as
                                                                                                                is the total capital and operating costs incurred by the system                   their high carbon intensities prove incompatible with the more
                                                                                                                from the initial planning year (2020) until year a. Henceforth,                   stringent 45% emissions reduction target. No off-grid solar is
                                                                                                                system costs will be presented relative to the BAU cost.                          built as cheaper grid-scale solar PV is preferred. Despite the
                                                                                                                    In the unconditional NDC scenarios, the CSC in 2050 is                        increase in IRES, battery storage capacity in 2050 falls by 52% to
                                                                                                                100% of the BAU cost (applying a 10% discount rate to future                      3.5 GW as gas peakers increasingly provide flexibility to the
                                                                                                                cash flows).¶ For the conditional NDC target, the CSC is 104%                     system.
                                                                                                                of the BAU case. Three alternative modelling assumptions are                          As previously observed, the deployment of high-availability,
                                                                                                                investigated: (1) a ‘High Build Rate’ scenario in which technol-                  low-carbon generators decrease capacity installed by 9% but
                                                                                                                ogy deployment rates are increased to 2.5 GW per year; (2) an                     their higher CAPEX means that total system cost remains
                                                                                                                ‘Advanced Tech Available’ scenario in which nuclear, biomass                      unchanged.
                                                                                                                and CCS technologies are available for deployment throughout                          Additionally, the deployment of fossil generation in the
                                                                                                                the planning horizon; and (3) an ‘All Tech In All States’ scenario                north results in the displacement of some onshore wind
                                                                                                                in which fossil generation (Coal, CCGT, OCGT) can be built in                     capacity which falls from 8.6 GW to 5.7 GW in 2050. In contrast,
                                                                                                                states where the resource is not available and pipelines do not                   battery storage capacity rises by 10% to 8 GW. Increased energy
                                                                                                                exist. The implications of these for decarbonisation costs are                    storage is required to supplement gas generation during peak
                                                                                                                discussed below.                                                                  hours in the North-West and North-East; batteries store surplus
                                                                                                                    3.2.1 BAU and unconditional NDC. The BAU and Uncondi-                         electricity from coal and gas during low demand hours. The
                                                                                                                tional NDC scenario results are identical throughout the plan-                    rest of the energy mix remains unchanged. Total system cost
                                                                                                                ning horizon (see Fig. 6). Increased power plant build rates                      and capacity installed also remain unchanged within the
                                                                                                                reduce decarbonisation costs by 9%. This is mainly due to                         model error.
                                                                                                                increased gas generation which displaces the need for any
                                                                                                                IRES, diesel generators and battery storage in the system.                        3.3   Delivering Nigeria’s NDC at lowest cost
                                                                                                                Additionally, the amount of coal generation necessary by mid-                     Fig. 6 shows that faster power plant build rates are most critical
                                                                                                                                                                                                  to driving down the costs of delivering the Paris Agreement.
                                                                                                                ¶ Typically, a lower discount rate (1–3%) is used for developed countries.
                                                                                                                However, higher discount rates are used when there is a greater level of risk/
                                                                                                                                                                                                  We find that increased technology deployment rates could mean
                                                                                                                uncertainty associated with an investment and its future cash flows, such as in   that intermittent renewable energy sources are not critical to
                                                                                                                Nigeria.                                                                          delivering Nigeria’s unconditional NDC, and coal-fired generation

                                                                                                                This journal is © The Royal Society of Chemistry 2021                                              Energy Environ. Sci., 2021, 14, 4018–4037 | 4027
View Article Online

                                                                                                                Energy & Environmental Science                                                                                                      Paper

                                                                                                                could yet be part of a Paris Agreement-compliant electricity         deployment capacity of CCGTs is reached in a state. The lack of
                                                                                                                system. Fig. 7 shows the spatial distribution of power generation    IRES, especially solar PV, in a least-cost electricity mix occurs for
                                                                                                                and transmission infrastructure in 2050 in such a ‘High Build        two reasons.
                                                                                                                Rate’ scenario. In this system, it proves sufficient to meet all          First, Nigeria has not enjoyed the cost reductions in solar
            This article is licensed under a Creative Commons Attribution-NonCommercial 3.0 Unported Licence.

                                                                                                                demand and the unconditional NDC by utilising only natural gas       and wind power seen elsewhere globally as no grid-scale
                                                                                                                (75.1 GW), coal (4.5 GW) and hydro (13.6 GW) generation. CCGTs       projects have been completed and investment has not been
                                                                                                                are preferred over OCGTs because of their lower OPEX and higher      de-risked58—solar PV ($2180–2580 per kW) and wind ($1860–
                                                                                                                availabilities; the latter is only deployed when the maximum         3900 per kW) CAPEX are still more expensive than natural gas-
Open Access Article. Published on 19 May 2021. Downloaded on 10/13/2021 11:44:36 AM.

                                                                                                                Fig. 7 Map showing power generation capacity and transmission by state and by technology in 2050 under the lowest-cost unconditional NDC
                                                                                                                scenario. In this scenario, technology deployment rates of up to 2.5 GW per year are possible.

                                                                                                                4028 | Energy Environ. Sci., 2021, 14, 4018–4037                                    This journal is © The Royal Society of Chemistry 2021
View Article Online

                                                                                                                Paper                                                                                                           Energy & Environmental Science
            This article is licensed under a Creative Commons Attribution-NonCommercial 3.0 Unported Licence.
Open Access Article. Published on 19 May 2021. Downloaded on 10/13/2021 11:44:36 AM.

                                                                                                                Fig. 8 Optimal power generation capacity mix (left y-axis) and cumulative system cost (right y-axis) of the Nigerian power system under different
                                                                                                                emissions scenarios and policy interventions. Cumulative system cost in year a is the total capital and operating costs invested into the system until year a.
                                                                                                                The three emissions s scenarios investigated are: ‘Business-as-usual (BAU)’, ‘Unconditional NDC’, and ‘Conditional NDC’; the emissions levels in each of
                                                                                                                these scenarios are illustrated in Fig. 3.

                                                                                                                This journal is © The Royal Society of Chemistry 2021                                               Energy Environ. Sci., 2021, 14, 4018–4037 | 4029
View Article Online

                                                                                                                Energy & Environmental Science                                                                                                    Paper

                                                                                                                fired generation ($400–700 per kW) (see ESI†). Additionally,        African countries that have trialled carbon pricing mechanisms
                                                                                                                IRES have much lower availabilities than fossil generators and      suggests a tax of $8 per tCO2 for Nigeria’s oil and gas industry.60
                                                                                                                often require energy storage to compensate for the variability in   Another study by Ricke et al. estimated a social cost of carbon
                                                                                                                their supply. Consequently, when build rates are not limited, it    (SCC) of $20–50 per tCO2 for the country.61 We assess the effects
            This article is licensed under a Creative Commons Attribution-NonCommercial 3.0 Unported Licence.

                                                                                                                proves cheaper to deliver dispatchable electricity using gas-       of penalising CO2 emissions from power generation on optimal
                                                                                                                fired power plants instead of IRES.                                 system design. The implementation of a $50 per tCO2 results in
                                                                                                                    Heavy reliance on natural gas, as described above, leads to     the increased deployment of IRES. Solar and onshore wind total
                                                                                                                the concentration of generation in the south. Thus, inter-          capacity in mid-century rises by 59% to 30 GW. This additional
                                                                                                                regional transmission becomes critical to meeting demand.           IRES capacity however does not reduce the demand for fossil
                                                                                                                Northern states such as Kwara, Kogi and Niger that border           fuel power plants; instead, the utilisation of coal and diesel
Open Access Article. Published on 19 May 2021. Downloaded on 10/13/2021 11:44:36 AM.

                                                                                                                regions with gas generation are key conduits for power trans-       plants falls slightly. By 2050, 77% of annual electricity genera-
                                                                                                                mission. In addition to its proximity to the gas-rich South-West,   tion is derived from fossil fuels: coal (12%), natural gas (61%)
                                                                                                                its large hydro generation makes Niger state the largest exporter   and diesel (5%). The carbon tax yields a threefold increase in
                                                                                                                of power, principally serving states in the North-West. The         the total system cost. Thus, whilst carbon pricing—at the level
                                                                                                                availability of coal plants in Bauchi and Gombe, and hydro in       assumed—promotes the deployment of IRES, it fails to dis-
                                                                                                                Taraba reduces the region’s reliance on imports but they            courage the use of fossil fuels. The tax instead greatly increases
                                                                                                                remain important for meeting domestic demand. Whilst the            the operating costs of fossil power plants, and thus the whole
                                                                                                                geographic concentration of power infrastructure (and thus          system.
                                                                                                                investment and jobs) may deliver a cost-optimal electricity             3.4.3 Other factors. The weighting factor parameter
                                                                                                                system, such a system is likely to be infeasible as Nigeria’s       (‘WFA’) included in the ESONE model is used to address end-
                                                                                                                political landscape mandates the equitable distribution of          of-horizon effects. It is used to discount the CAPEX of a
                                                                                                                economic resources across geopolitical zones.                       technology that will continue to operate outside the time period
                                                                                                                                                                                    modelled. The WFA in year a is the technology’s lifetime as a
                                                                                                                3.4   Facilitating Nigeria’s energy transition                      fraction of the remaining planning horizon. With the exception
                                                                                                                Many countries, including Nigeria have implemented policies         of the conditional NDC scenarios, we found that without the
                                                                                                                to promote the use of low-carbon energy sources and drive           WFA, IRES deployment falls significantly.
                                                                                                                down their costs. Since the adoption of the 2015 National               In all the scenarios assessed, the amount of fossil fuel
                                                                                                                Renewable Energy and Energy Efficiency Policy (NREEEP),               generation capacity required is unchanged even when IRES
                                                                                                                Nigeria has developed feed-in tariff and mini-grid regulation,       deployment rises. This highlights the importance of dispatch-
                                                                                                                provided tax incentives for solar panels, and made available        ability in a power system that needs to scale rapidly whilst
                                                                                                                investment grants for low-carbon energy sources.44,59 A biofuels    maintaining grid reliability and operability. Fossil generation
                                                                                                                blending mandate and an act to establish the Rural Electrifica-     remains critical to delivering universal energy access because of
                                                                                                                tion Fund came into force in 2007 and 2014, respectively.59         its higher availability, dispatchability and, in the case of natural
                                                                                                                Owing to a poor macroeconomic environment that has deterred         gas plants, relatively low capital costs.
                                                                                                                investment, the effects of these policies are yet to be seen. We
                                                                                                                assess the effectiveness of common ‘green policies’ on optimal       3.5   Low-carbon barriers and opportunities
                                                                                                                system design (see Fig. 8).                                         An extensive literature exists on the sectoral reforms necessary
                                                                                                                   3.4.1 Renewable energy subsidies. Cheaper IRES costs can         to improve Nigeria’s power sector.25,32,33 Delivering universal
                                                                                                                be realised through initial investment that de-risks future         energy access alongside its Paris Agreement commitments
                                                                                                                projects, subsidies, or other development aid and assistance.       poses additional challenges and considerations for the design
                                                                                                                Consequently, we assessed a ‘Low CAPEX’ scenario in which the       of these reforms.
                                                                                                                CAPEX of low-carbon generation technologies was assumed to             3.5.1 Commercial viability of power infrastructure. The
                                                                                                                be the global lower-bound estimates. This is typically the over-    privatisation of the transmission segment of the power value
                                                                                                                night cost of the technology in China.56 It was found that lower    chain is currently being pursued to complete the deregulation
                                                                                                                IRES CAPEX results in a doubling of solar PV capacity (both         of the sector.62 Development of the sector will therefore be
                                                                                                                grid-scale and off-grid) to 20 GW by 2050. Onshore wind              dependent on its ability to attract private investment. Private
                                                                                                                capacities remain unchanged, principally because of the rela-       sector capital typically seeks higher returns than public finan-
                                                                                                                tively poor wind resources in Nigeria. Total system cost falls by   cing. Fig. 9 illustrates the utilisation factors of inter-state
                                                                                                                4–5% despite an increase in the total capacity installed by 4%.     transmission lines under the base case unconditional NDC
                                                                                                                Added solar capacity does not displace fossil fuel generation       scenario. The utilisation factor is the ratio of the amount of
                                                                                                                capacity however, instead coal and diesel plants experience         power transmitted through a line to the maximum amount
                                                                                                                lower utilisation factors as lower-OPEX solar is preferentially     of power that can be transmitted annually. We find that
                                                                                                                deployed when available.                                            between 2020 and 2050, 49–92% of transmission lines have
                                                                                                                   3.4.2 Carbon pricing. Owing to a lack of data and technical      utilisation factors of less than 0.5. That is, less than 50% of
                                                                                                                capacity, there is a lack of literature on the economic costs of    their available annual transmission capacity is being used. This
                                                                                                                climate change in the Nigerian context. A comparative study on      high likelihood of asset underutilisation would almost certainly

                                                                                                                4030 | Energy Environ. Sci., 2021, 14, 4018–4037                                   This journal is © The Royal Society of Chemistry 2021
View Article Online

                                                                                                                Paper                                                                                                        Energy & Environmental Science

                                                                                                                                                                                             value chain,8 and government financial support will remain
                                                                                                                                                                                             necessary—government subsidies to the power sector drain re-
                                                                                                                                                                                             sources from other critical sectors of the economy such as
                                                                                                                                                                                             education and healthcare.64,66 In addition to higher tariffs,
            This article is licensed under a Creative Commons Attribution-NonCommercial 3.0 Unported Licence.

                                                                                                                                                                                             policies that incentivise the resolution of other sources of poor
                                                                                                                                                                                             revenue collection rates, including poor metering and non-
                                                                                                                                                                                             payment of bills by consumers, need to be implemented.
                                                                                                                                                                                             According to NERC, 4.09 million of the 7.38 million DisCo
                                                                                                                                                                                             customers (54.7%) are unmetered.67 Furthermore, 50% of the
                                                                                                                                                                                             3.39 million metered customers have faulty or obsolete meters.
Open Access Article. Published on 19 May 2021. Downloaded on 10/13/2021 11:44:36 AM.

                                                                                                                                                                                             This has led to the practice of estimated billing by DisCos—this
                                                                                                                                                                                             involves billing customers according to average service delivery
                                                                                                                                                                                             to the region, not individual consumption. Owing to high
                                                                                                                                                                                             incidence of electricity theft, many customers are overcharged
                                                                                                                Fig. 9 Inter-state transmission line utilisation factors from 2020 to 2050   for their power consumption, and refuse to pay bills which adds
                                                                                                                under the Unconditional NDC base case scenario. Utilisation factors range    to the losses incurred by DisCos. The Credited Advance Pay-
                                                                                                                from 0 to 1, with the upper-bound representing 100% utilisation of           ment Metering Implementation programme (2013) was
                                                                                                                available power transmission capacity.
                                                                                                                                                                                             designed to end estimated billing by allowing customers to
                                                                                                                                                                                             purchase meters from DisCos with the promise of reduced fixed
                                                                                                                discourage private investment in those parts of the transmis-                costs on future bills, however DisCos failed to deliver pur-
                                                                                                                sion network, and therefore a significant public sector invest-              chased meters.** 68 The Meter Asset Provider regulation
                                                                                                                ment is likely to be required in order to realise this outcome.              (2018) enacted allows for other independent companies to
                                                                                                                There is a history of reactive public investment in the Nigerian             provide metering services, but positive results are yet to be
                                                                                                                power sector. Since 2015, the government has provided three                  seen.68 High upfront installation costs and poor service delivery
                                                                                                                bailouts totalling NGN 1.5 trillion ($4.9 billion at the then                have deterred the reduction of the unmetered population in the
                                                                                                                official exchange rate of 305 NGN per $63) to the electricity                power sector. Better financing models and disincentives for
                                                                                                                sector to compensate for revenue shortfalls in GenCos and                    poor service delivery need to be implemented.
                                                                                                                DisCos.64 Public financing could be made more proactive to                      3.5.2 Expansion of natural gas production and distribu-
                                                                                                                deliver better value by retargeting it into the development of               tion. Natural gas-fired power plants dominate the optimal
                                                                                                                transmission infrastructure.                                                 energy mix for the power generation in all the scenarios that
                                                                                                                    Electricity tariffs are currently pre-determined by the sector’s          were assessed in this study, irrespective of the emissions target.
                                                                                                                regulator, NERC, through the Multi-Year Tariff Order. The most                Consequently, the availability of natural gas is likely to be
                                                                                                                recent revision of the MYTO sets prices at NGN 4–66 per kW h                 crucial to achieving universal energy access by mid-century.
                                                                                                                ($11–184 per MW h at the current official exchange rate of 360.5             In 2018, Nigeria produced 44.3 billion cubic metres (bcm) of
                                                                                                                NGN per $) depending on the type and scale of the consumer.65                natural gas (NG) annually, of which 28.6 bcm was exported.69
                                                                                                                Owing to the dearth of industrial and commercial users,                      Fig. 10 compares the historical production rates with the
                                                                                                                majority of the electricity consumers are smaller-scale house-               projected consumption for electricity generation according to
                                                                                                                holds that are charged at the lower-bound of the tariff range.               the ESONE model. We observe that in the base case scenarios,
                                                                                                                These prices are a third of the current and projected marginal               there is a 14-fold increase in NG consumption from 2020 to
                                                                                                                costs of generation according to the ESONE model. The highest-               2050. By mid-century, the amount of NG required for electricity
                                                                                                                OPEX generators which typically set the marginal cost of elec-               per year is 60% greater than the current total production. In the
                                                                                                                tricity are OCGT ($37 per MW h) and diesel ($155 per MW h)                   upper-bound scenario, 79.9 bcm per year of NG is required by
                                                                                                                plants. Therefore, if tariffs are not increased, GenCos and DisCos           2050—this is almost a twofold increase from today’s marketed
                                                                                                                will continue to face significant revenue shortfalls and invest-             production.
                                                                                                                ment in additional generation capacity will be deterred. Histori-               The above highlights that current NG production is insuffi-
                                                                                                                cally, tariff increases have proved difficult owing to a range of            cient to meet the needs of the power sector (and others) by
                                                                                                                socio-political factors—political actors resist price hikes to avoid         2050. An expansion of domestic production and a reduction of
                                                                                                                using public support. This is likely to remain the case as long as           exports is therefore necessary. Currently, the Nigerian gas
                                                                                                                the government retains price-setting control through the                     industry export-oriented because international LNG netback
                                                                                                                regulator.
                                                                                                                    Market-driven electricity prices can be achieved in Nigeria              8 The inability of DisCos to receive complete payments from consumers for the
                                                                                                                through two means: (1) an upward revision of tariffs by NERC,                 electricity service they provide means that they cannot pay GenCos for the
                                                                                                                                                                                             electricity generated. Similarly, GenCos (principally gas-fired power plants)
                                                                                                                or (2) the creation of a competitive market for electricity
                                                                                                                                                                                             cannot pay gas suppliers, thereby creating a liquidity crisis across the power
                                                                                                                through liberalisation of the entire power sector value chain.               value chain.
                                                                                                                Without either of these, DisCos will continue to experience the              ** Customers had previously paid for meters through the fixed charge compo-
                                                                                                                revenue shortfalls that create illiquidity across the entire power           nent of their energy bills.

                                                                                                                This journal is © The Royal Society of Chemistry 2021                                            Energy Environ. Sci., 2021, 14, 4018–4037 | 4031
You can also read