Review of Ecodesign and Energy Labelling Regulations for Televisions and Draft Regulation for Electronic Displays: Discussion Paper - 10 November 2014
←
→
Page content transcription
If your browser does not render page correctly, please read the page content below
Review of Ecodesign and Energy
Labelling Regulations for Televisions
and Draft Regulation for Electronic
Displays: Discussion Paper

10 November 2014

Bob Harrison
Mike Scholand

CLASP European Programme
Discussion Paper on Ecodesign and Energy Labelling of Electronic Displays

Contents
1. INTRODUCTION ............................................................................................................................................. 1
 1.1. EUROPEAN REGULATIONS AND DECISIONS FOR DISPLAYS...........................................................................................2
 1.1.1. Television Ecodesign Regulation 642/2009 .........................................................................................2
 1.1.2. Television Energy Labelling Regulation 1062/2010 .............................................................................3
 1.1.3. Television Eco-label (2009/300/EC) .....................................................................................................6
 1.2. ENERGY STAR LABELLING IN THE US ..................................................................................................................7
 1.2.1. Television ENERGY STAR labelling (v.6.1) ............................................................................................7
 1.2.2. Computer monitor Eco-label (2011/337/EU) .......................................................................................8
 1.2.3. Television ENERGY STAR labelling (v.6.1) Computer monitor ENERGY STAR labelling (version 6.0 and
 EU Decision 202/2014) ..........................................................................................................................................9
2. EUROPEAN MARKET OVERVIEW .................................................................................................................. 12
 2.1. SHIPMENTS AND SCREEN SIZE ............................................................................................................................12
 2.2. RELATIONSHIP BETWEEN COST AND ENERGY EFFICIENCY LEVEL ................................................................................14
 2.3. AVERAGE ENERGY CONSUMPTION ......................................................................................................................15
 2.4. CHANGING TV TECHNOLOGIES ..........................................................................................................................16
 2.5. IMPACT OF THE COMMISSION REGULATIONS ........................................................................................................17
3. ISSUES TO BE ADDRESSED IN A REVISION OF THE REGULATIONS ................................................................ 20
 3.1. TECHNOLOGY EFFICIENCY TRENDS .......................................................................................................................20
 3.1.1. Organic Light Emitting Diode Televisions ..........................................................................................21
 3.1.2. Quantum-dot LED TVs .......................................................................................................................21
 3.2. PRODUCT FEATURES ........................................................................................................................................23
 3.2.1. Three Dimensional (3D) Screens ........................................................................................................23
 3.2.2. Internet-connected televisions ..........................................................................................................24
 3.2.3. Automatic Brightness Control............................................................................................................25
 3.2.4. Enhanced Reactivation and Mode Control Options ...........................................................................26
 3.2.5. Ultra High Definition TVs ...................................................................................................................27
4. REGULATORY REQUIREMENTS .................................................................................................................... 30
 4.1. DATABASE PROVIDED BY DIGITALEUROPE.............................................................................................................30
 4.2. PROPOSAL FOR ECODESIGN REQUIREMENTS .........................................................................................................32
 4.2.1. Auxiliary Functions ............................................................................................................................43
 4.2.2. Power management and other modes ..............................................................................................44
 4.2.3. Peak luminance ratio .........................................................................................................................44
 4.2.4. Other (non-energy) requirements......................................................................................................45
 4.3. ENERGY LABELLING ..........................................................................................................................................45
 4.4. CENELEC HARMONISED EUROPEAN MEASUREMENT STANDARD ..............................................................................48
ANNEX A. DIGITALEUROPE COMMENTS ON THE DISPLAY REGULATION REVISION .............................................. 49
REFERENCES......................................................................................................................................................... 63

 ii
Discussion Paper on Ecodesign and Energy Labelling of Electronic Displays

Tables
TABLE 1-1. TELEVISION ECODESIGN ON-MODE POWER REQUIREMENTS FROM REGULATION 642/2009..............................................3
TABLE 1-2. TELEVISION ENERGY EFFICIENCY CLASSES FROM EU NO 1062/2010 ............................................................................5
TABLE 1-3. ENERGY STAR V.5.0 REQUIREMENTS FOR ON-MODE POWER CONSUMPTION ...............................................................9
TABLE 1-4. ENERGY STAR LABELLING REQUIREMENTS FOR MAXIMUM ON-MODE POWER CONSUMPTION (PON_MAX) ............................10
TABLE 3-1. EFFICIENCY IMPROVEMENT OPTIONS IN LCD TELEVISIONS AND DIGITAL DISPLAYS...........................................................20
TABLE 3-2. COMPARISON OF HD AND NEW UHD DISPLAYS .....................................................................................................28
TABLE 3-3. 4K UHD RESOLUTIONS, ASPECT RATIOS AND NUMBER OF PIXELS .............................................................................29
TABLE 4-1. ELECTRONIC DISPLAY RESOLUTIONS IN DIGITALEUROPE DATABASE .............................................................................30
TABLE 4-2. VARIABLES IN THE MAXIMUM ON POWER EQUATION – DRAFT EUROPEAN CURVES ......................................................34
TABLE 4-3. MODELS FROM THE 2014 DATABASE THAT PASS THE THREE TIER LEVELS, GROUPED BY SCREEN SIZE ...............................36
TABLE 4-4. DIGITAL EUROPE’S PROPOSAL FOR EEI VALUES AND FUNCTIONS ................................................................................38
TABLE 4-5. MODELS FROM THE 2014 DATABASE THAT PASS THE DIGITAL EUROPE PROPOSED THREE TIER LEVELS .............................39
TABLE 4-6. HYPOTHETICAL PASS-RATE PROJECTING PERFORMANCE IMPROVEMENT FOR DISPLAYS TO 2020 .....................................43
TABLE 4-7. EXISTING AND SUGGESTED NEW ENERGY LABEL CLASSES AND DISTRIBUTION OF 2014 MODEL DATABASE ........................46

Figures
FIGURE 1-1. EUROPEAN ECODESIGN REQUIREMENTS, TIER 1 AND 2 (EC NO 642/2009) FOR FULL HD TVS .......................................3
FIGURE 1-2. EUROPEAN ENERGY LABEL CLASSES F THROUGH A+++ FOR TELEVISIONS, EU NO 1062/2010 .........................................5
FIGURE 1-3. EUROPEAN ECO-LABEL FOR TELEVISIONS (2009/300/EC) ........................................................................................6
FIGURE 1-4. COMPARISON OF US ENERGY STAR MAXIMUM ON-MODE POWER FOR V.6 AND (DRAFT) V.7 .....................................8
FIGURE 1-5. ENERGY STAR LABELLING REQUIREMENTS FOR MAXIMUM ON-MODE POWER CONSUMPTION (PON_MAX) ..........................11
FIGURE 2-1. INCREASING SCREEN SIZE IN EU-24, SALES OF TELEVISIONS FROM 2007 – 2013. DATA: GFK, PUBLISHED IN TOPTEN, 2014.
 .................................................................................................................................................................13
FIGURE 2-2. AVERAGE SALES PRICES OF TV BY ENERGY LABEL CLASS, HOLDING SCREEN SIZE CONSTANT. DATA: GFK, PUBLISHED IN
 TOPTEN, 2014. ............................................................................................................................................14
FIGURE 2-3. AVERAGE SALES PRICES OF TVS BY SCREEN SIZE, FOR A-CLASS ONLY AND ALL ENERGY LABEL CLASSES. DATA: GFK,
 PUBLISHED IN TOPTEN, 2014. ......................................................................................................................... 15
FIGURE 2-4. SALES-WEIGHTED AVERAGE TV ENERGY CONSUMPTION IN EU-24, 2007 – 2013. DATA: GFK, PUBLISHED IN TOPTEN,
 2014. ........................................................................................................................................................16
FIGURE 2-5. TV TECHNOLOGY CHANGES IN EU-24, 2007 – 2013. DATA: GFK, PUBLISHED IN TOPTEN, 2014. ................................17
FIGURE 2-6. AVERAGE POWER CONSUMPTION OF MODELS SOLD IN EU-24 COMPARED TO ECODESIGN TIERS. DATA: GFK, PUBLISHED IN
 TOPTEN, 2014. ............................................................................................................................................18
FIGURE 2-7. EFFICIENT TELEVISION MODELS ON THE EUROPEAN MARKET, JAN 2010 – MAY 2014. SOURCE: TOPTEN.........................19
FIGURE 3-1. QUANTUM-DOT SIZE RELATES TO EMISSION WAVELENGTH .......................................................................................22
FIGURE 3-2. EXAMPLE OF POSSIBLE SMART TELEVISION SCREEN SIZE CHANGE ...............................................................................25
FIGURE 3-3. COMPARISON OF RELATIVE DISPLAY RESOLUTIONS ................................................................................................27
FIGURE 4-1. SCATTER PLOT OF 2014 EUROPEAN MODEL DATA AND 642/2009 MEPS LEVELS .....................................................31
FIGURE 4-2. ENERGY LABEL CLASS PROGRESSION BETWEEN 2012 AND 2014, MODEL DATABASE (NOT SALES) .................................32
FIGURE 4-3. PROPOSED MEPS CURVES AND 2014 DATA, DIFFERENTIATING BETWEEN UHD AND NON-UHD MODELS .......................35
FIGURE 4-4. PROPOSED MEPS CURVES AND 2014 DATA, FOCUS ON SMALL SCREEN SIZES ...........................................................36
FIGURE 4-5. PROPOSED MEPS CURVES AND 2014 DATA, WITH US ENERGY STAR CURVES ........................................................37

 iii
Discussion Paper on Ecodesign and Energy Labelling of Electronic Displays

FIGURE 4-6. PROPOSED MEPS CURVES AND 2014 DATA, WITH ENERGY STAR CURVES; SMALL SCREEN SIZE ................................38
FIGURE 4-7. PROPOSED MEPS CURVES AND 2014 HD ONLY DATA WITH DIGITALEUROPE PROPOSED MEPS ..................................39
FIGURE 4-8. PROPOSED MEPS CURVES AND 2014 HD ONLY DATA WITH DIGITALEUROPE 4K PROPOSED MEPS .............................40
FIGURE 4-9. COMPARISON OF THE PROPOSED 2014 MEPS LEVELS WITH THE DRAFT 2012 MEPS CURVES .......................................41
FIGURE 4-10. COMPARISON OF THE PROPOSED 2014 MEPS LEVELS AND 2012 LEVELS, SMALLER SCREEN SIZES ................................42
FIGURE 4-11. EXISTING ENERGY LABEL CLASSES WITH PROPOSED MEPS AND 2014 DATABASE ......................................................47
FIGURE 4-12. PROPOSED NEW ENERGY LABEL CLASSES WITH PROPOSED MEPS AND 2014 DATABASE ............................................47

 iv
Discussion Paper on Ecodesign and Energy Labelling of Electronic Displays

 Abbreviations
3D Three Dimensions EU European Union
4K 4000 pixels in horizontal dimension (a high GfK Gesellschaft für Konsumforschung
 resolution digital video format) HD High Definition
A Area HDD Hard Disk Drive
ABC Automatic Brightness Control HDMI High-Definition Multimedia Interface
APD Auto Power Down IEC International Electrotechnical Commission
APL Average Picture Level IEEE Institute for Electrical and Electronics
BRD Blu-RayDisc Engineers
CCFL Cold Cathode Fluorescent Lamp JRC Joint Research Council (EC)
CDV Committee Draft for Voting kWh kilowatt-hour
CF Consultation Forum established under LBNL Lawrence Berkeley National Laboratory
 Article 18 of the Ecodesign Directive (USA)
CEN European Committee for Standardisation LED Light Emitting Diode
CENELEC European Committee for Electrotechnical LCD Liquid Crystal Display
 Standardisation MEPS Minimum Energy Performance Standards
CRT Cathode Ray Tube MOCVD Metal Organic Chemical Vapour Deposition
DBEF Dual Brightness Enhancement Film MP Megapixel
dm decimetre NVRAM Non-Volatile Random-Access Memory
DOE US Department of Energy OLED Organic Light Emitting Diode
DPF Digital Picture Frame OJ Official Journal of the European Union
DVD Digital Versatile Disc PDP Plasma Display Panel
DVI Digital Visual Interface PO Power On-mode
EC European Commission SCART Syndicat des Constructeurs d'Appareils
EEA European Economic Area Radiorécepteurs et Téléviseurs
EEI Energy Efficiency Index TV Television
EN European Norm USB Universal Serial Bus
ENTR Directorate-General for Enterprise and VCR Video Cassette Recorder
 Industry (European Commission) VGA Video Graphics Array
EPA Environmental Protection Agency (USA) W Watt
ErP Energy related Products

 v
Discussion Paper on Ecodesign and Energy Labelling of Electronic Displays

1. Introduction

According to Article 6 of the Commission Regulation (EC) No 642/2009 of 22 July 2009 implementing
Directive 2005/32/EC of the European Parliament and of the Council with regard to ecodesign
requirements for televisions1, the Commission shall review this Regulation in the light of technological
progress and shall present the results of this reviews to the Ecodesign Consultation Forum.

Furthermore, according to Article 7 of the Commission Delegated Regulation (EU) No 1062/2010 of 28
September 2010 supplementing Directive 2010/30/EU of the European Parliament and of the Council
with regard to energy labelling of televisions2, the Commission shall review this Regulation in the light of
technological progress.

 • The main objective of this discussion paper is to present to the Commission the results of the
 evaluation of the application of the above mentioned Ecodesign and Energy Labelling
 Regulations on televisions.

Furthermore, for displays other than televisions and television monitors (ENER Lot 3), a draft of the
ecodesign Working Document on displays was discussed at a Consultation Forum meeting in October
2009. Designing a separate measure for displays, has proven to be difficult because the convergence of
products has made it difficult to clearly define separate product categories. Traditional product category
definitions relied on different input signals and the presence of a tuner for televisions. But today, any
display can be designed to accept a variety of input signals, including broadcast signals for which a tuner
(even an external tuner) is required. Also, the amount of energy consumed by the tuner/receiver has
decreased significantly. Furthermore, the experience with the current definitions on televisions and
television monitors in the Regulations does not provide a sufficiently clear distinction for products on
the market.

Therefore, the European Commission is envisaging to merge the review work on the television
regulations with the work on the draft regulation on display products and to prepare one set of
ecodesign and energy labelling requirements for all electronic displays, including televisions, computer
monitors and digital photo frames.

 • The second objective of this discussion paper is to present proposals in view of the review of
 Regulations on Televisions and television monitors that will lay down ecodesign and energy
 labelling requirements for electronic displays for the consumer market, including televisions,
 computer monitors and digital photo frames.

This report has been prepared by CLASP with input from stakeholders (including industry) and is
presented to the European Commission and the Consultation Forum as an independent contribution to
the development of ecodesign and energy labelling criteria for electronic displays.

1
 OJ L 191, 23.07.2009, p. 42
2
 OJ L314, 30.11.2010, p.64

 1
Discussion Paper on Ecodesign and Energy Labelling of Electronic Displays This discussion paper is structured as follows: Chapter 1 provides an introduction to this report, including a statement of the objectives and a summary of the European regulatory and voluntary measures that apply to electronic displays. It also includes some discussion on the United States’ Energy Star programme for televisions. Chapter 2 provides an overview of the European market, including information on models and trends around screen size and average energy consumption. This chapter also addresses changes in television technologies and assesses the impact of the Commission regulation. Chapter 3 discusses the issues for consideration in the revision of the Regulation. This includes trends in energy efficiency and product features such as 3D screens, internet-connected TVs, automatic brightness control, ultra-high definition displays and more. Chapter 4 presents the proposed Ecodesign requirements for electronic displays. This includes a presentation of the database provided by DigitalEurope and our analysis of three different potential minimum energy performance standards. The rationale for this proposal is provided. Annex A provides the DigitalEurope proposal provided to CLASP in July 2014. In addition to this discussion paper, an Excel spreadsheet is also available which contains the anonymous database that was used for this analysis (with no manufacturer names). This spreadsheet is available for download on the CLASP website. 1.1. European Regulations and Decisions for displays This section provides a summary of energy-related requirements of each of the currently applicable Commission Regulations and Decisions, as well as an overview of the United States’ ENERGY STAR programme for televisions – both current (v. 6.1) and draft proposed (v. 7.0). For each regulation or programme, a table is included summarising the energy requirements of these policy initiatives. 1.1.1. Television Ecodesign Regulation 642/2009 The maximum on-mode energy consumption levels for televisions under the ecodesign requirements are presented below. The Regulation includes two minimum energy performance requirement (MEPS) levels, one that took effect in 2010 and one that took effect in 2012. Starting on 20 August 2010, the on-mode power consumption of a television with visible screen area A (expressed in square decimetres, dm2) shall not exceed the levels shown as Tier 1 in Table 1-1. Starting on 1 April 2012, the on-mode power consumption shall not exceed the levels shown as Tier 2 in Table 1-1. 2
Discussion Paper on Ecodesign and Energy Labelling of Electronic Displays

Table 1-1. Television Ecodesign on-mode power requirements from Regulation 642/2009

 Regulatory Tier Product Full HD resolution All other resolutions
Tier 1 Television sets 20 + A x 1.12 x 4.3224 20 + A x 4.3224
(20 Aug 2010)
 Television monitors 15 + A x 1.12 x 4.3224 15 + A x 4.3224
Tier 2 Television sets 16 + A x 3.4579
(1 April 2012)
 Television monitors 12 + A x 3.4579

The basic formula established at Tier 1 for television sets at “All other resolutions” represents an EEI of
1.00, which was the 2007 market average. The Tier 2 efficiency level for television sets at Full HD and all
other resolutions is equivalent to an EEI of 0.8 because 0.8 x (20 + A · 4.3224) = 16 + A x 3.4579.

Figure 1-1. European ecodesign requirements, Tier 1 and 2 (EC No 642/2009) for full HD TVs

1.1.2. Television Energy Labelling Regulation 1062/2010
The Energy Labelling Regulation for Televisions (EU No 1062/2010) uses a similar equation to the Tier 1
requirements for television ecodesign requirements. There is one general equation for television energy
labelling that varies slightly with some of the features incorporated into a television set. For example,
slightly higher energy consumption is allowed for television sets with a hard disc or more than one
tuner/receiver.

The equation and various input constants below are used for calculating the EEI in the television Energy
Labelling Regulation are given below. The EEI is calculated as EEI = P/Pref (A), where:

 3
Discussion Paper on Ecodesign and Energy Labelling of Electronic Displays

 Pref (A) = Pbasic + A x 4.3224
 where:
 Pbasic = 20 W for television sets with one tuner/receiver and no hard disc,
 Pbasic = 24 W for television sets with hard disc(s),
 Pbasic = 24 W for television sets with two or more tuners/receivers,
 Pbasic = 28 W for television sets with hard disc(s) and two or more tuners/receivers,
 Pbasic = 15 W for television monitors, and
 A is the visible screen area expressed in dm2; and
 P is the on-mode power consumption of the television in W measured in accordance with
 Annex VII, rounded to one decimal place.

The annual on-mode energy consumption “E” which is calculated in kWh of electricity consumption is
defined in the energy labelling regulation as:

 E = 1.46 × P

 where:
 1.46 is the multiplier used to represent annual energy consumption based on an assumption
 of four hours of use per day; i.e., (365 days/year x 4 hours/day) x (1 kilo / 1000) =
 1.46 kilohours/year for televisions in on-mode.
 P is the on-mode power consumption of the television in W measured in accordance with
 Annex VII, rounded to one decimal place.

For televisions with automatic brightness control, the EEI and the annual on-mode energy consumption
is reduced by 5% if the following conditions are fulfilled when the television is placed on the market:

 (a) television luminance in the home-mode or the on-mode condition as set by the supplier is
 automatically reduced between an ambient light intensity of at least 20 lux and 0 lux;
 (b) the automatic brightness control is activated in the home-mode condition or the on-mode
 condition of the television as set by the supplier.

Table 1-2 presents the energy-efficiency classes for televisions, as adopted by the Television Energy
Labelling Regulation 1062/2010. The regulation presents four label designs, each with a different range
of energy efficiency classes, because only seven classes may appear at any one time. Thus, original label
is from A to G (from 30 November 2011), followed by a scale of A+ to F (from 1 January 2014), followed
by A++ to E (from 1 January 2017) and finally A+++ to D (1 January 2020).

 4
Discussion Paper on Ecodesign and Energy Labelling of Electronic Displays

Table 1-2. Television energy efficiency classes from EU No 1062/2010

 Energy efficiency class Energy Efficiency Index
 A+++ (most efficient) EEI < 0.10
 A++ 0.10 ≤ EEI < 0.16
 A+ 0.16 ≤ EEI < 0.23
 A 0.23 ≤ EEI < 0.30
 B 0.30 ≤ EEI < 0.42
 C 0.42 ≤ EEI < 0.60
 D 0.60 ≤ EEI < 0.80
 E 0.80 ≤ EEI < 0.90
 F 0.90 ≤ EEI < 1.00
 G (least efficient) 1.00 ≤ EEI

The graph below presents the plot of the energy label classes presented in the table above, with each
line representing the maximum energy consumption or threshold-value for that labelling class.

Figure 1-2. European energy label classes F through A+++ for televisions, EU No 1062/2010

 5
Discussion Paper on Ecodesign and Energy Labelling of Electronic Displays 1.1.3. Television Eco-label (2009/300/EC) The Eco-label is a voluntary programme intended to recognise products meeting ambitious levels of environmental performance, and to inform consumers that these products are among the best in their class. The Eco-label for televisions3 has seven requirements that must be met to qualify for the label. The criteria related to power consumption increase in stringency over time and use the visible screen area (A, expressed in dm2) as the key variable in calculating the maximum power consumption. The requirements concerning energy consumption are as follows: Until 31 December 2010, televisions placed on the market bearing the Eco-label shall have an on-mode power consumption equal to or lower than 0,64 x (20 + A x 4.3224 W/dm²). From 1 January 2011, until 31 December 2012 televisions placed on the market bearing the Eco-label shall have an on-mode power consumption equal to or lower than 0,51 x (20 + A x 4.3224 W/dm²). From 1 January 2013, televisions placed on the market bearing the Eco-label shall have an on- mode power consumption equal to or lower than 0,41 x (20 + A x 4.3224 W/dm²). Because these three equations given for the Eco-label are all based on the same basic formula of (20 + A x 4.3224 W/dm²) which itself represents a 2007 market average EEI of 1.00, the Eco-label threshold values are equivalent to an EEI of 0.64 in 2010, an EEI of 0.51 in 2011 and 2012, and an EEI of 0.41 from 2013 onwards. Figure 1-3. European eco-label for televisions (2009/300/EC) 3 Commission Decision of 12 March 2009 establishing the revised ecological criteria for the award of the Community Eco-label to televisions (notified under document number C(2009) 1830) (Text with EEA relevance) (2009/300/EC) 6
Discussion Paper on Ecodesign and Energy Labelling of Electronic Displays 1.2. ENERGY STAR labelling in the US The ENERGY STAR programme is a voluntary labelling scheme for manufacturers of energy-efficient products to obtain recognition for those products that meet specific performance requirements. The US Environmental Protection Agency (EPA) has offered the market an ENERGY STAR labelling scheme for televisions since 2001. 1.2.1. Television ENERGY STAR labelling (v.6.1) The current specification for ENERGY STAR Televisions is version 6.1, which was issued on 22 January 2014. Version 6.0 became effective on 1 June 2013, and was slightly revised on 22 January 2014, but this revision did not change the energy-efficiency requirements shown above. Revision 6.1 is built upon the previous version (6.0), but had a few changes including: incorporates the US Department of Energy’s (DOE’s) Test Procedure Final Rule for Television Sets (78 FR 63823), published on Oct. 25, 2013,4 requires the measurement for on-mode testing with ABC enabled by default, and changed the required sample size for testing. The following italicised text provides the energy-efficiency requirements of ENERGY STAR version 6.1.5 On Mode Power Consumption Requirements: PON_MAX = 100 x tanh(0.00085 x (A - 140) + 0.052) + 14.1 Where: PON_MAX is the maximum allowable On Mode Power consumption in W A is the viewable screen area of the product in square inches, calculated by multiplying the viewable image width by the viewable image height tanh is the hyperbolic tangent function. However, the EPA’s ENERGY STAR programme for televisions is currently under review, with a draft specification (version 7.0) that was issued in September 2014. The requirements are presented below, and curves that correspond to these requirements are shown in the figure that follows. Maximum On Mode Power Requirement PON_MAX = 71 x tanh(0.0005 x (A – 140) + 0.045) + 14 Where: PON_MAX is the maximum allowable On Mode Power consumption in watts; A is the viewable Screen Area of the product in square inches; and tanh is the hyperbolic tangent function. 4 Appendix H to Subpart B of 10 CFR Part 430 along with 10 CFR Part 429.25; the Final Rule for which can be found here: http://www.regulations.gov/#!documentDetail;D=EERE-2010-BT-TP-0026-0076 5 Taken from the EPA’s website: http://www.energystar.gov/index.cfm?c=tv_vcr.pr_crit_tv_vcr 7
Discussion Paper on Ecodesign and Energy Labelling of Electronic Displays

The figure below presents a comparison of the on-mod power requirements of EPA Energy Star version
6.0 and (draft) 7.0. There is less ambition at the very small screen sizes (
Discussion Paper on Ecodesign and Energy Labelling of Electronic Displays

 (iv) computer monitor off mode power shall not exceed 0,5 W.

The Energy Star v5.0 energy performance requirements state that when operating, the display must not
exceed the maximum on-mode power consumption (PO or PO1). The maximum on-mode power
consumption is expressed in watts and calculated based on the megapixel (MP) display resolution and
the viewable screen area (A), and rounded to the nearest tenth of a watt.

Table 1-3. ENERGY STAR v.5.0 requirements for on-mode power consumption

 Maximum on-mode
 Display category
 power consumption (W)
 Diagonal screen size < 30 inches
 PO = 6 x MP + 0.05 x A + 3
 Screen resolution ≤ 1.1 megapixel
 Diagonal screen size < 30 inches
 PO = 9 x MP + 0.05 x A + 3
 Screen resolution > 1.1 megapixel
 Diagonal screen size 30 – 60 inches7
 PO = 0.27 x A + 8
 All screen resolutions

For displays shipped with automatic brightness control (ABC) enabled by default, an alternate
calculation is used that assumes the display will be in low ambient lighting conditions 20% of the time.
To calculate maximum on-mode power consumption in W rounded to the nearest tenth of a Watt (PO1):

 PO1 = (0.8 x PH) + (0.2 x PL)

 Where:
 PH is the on-mode power consumption in high ambient lighting conditions, and
 PL is the on-mode power consumption in low ambient lighting conditions.

1.2.3. Television ENERGY STAR labelling (v.6.1) Computer monitor ENERGY STAR labelling (version 6.0
 and EU Decision 202/2014)
The typical products that would be eligible for qualification under this scheme include the following:
(a) Computer Monitors, (b) Digital Picture Frames, (c) Signage Displays, and, (d) Additional products
including monitors with keyboard, video and mouse (KVM) switch functionality, and other industry-
specific displays that meet the definitions and qualification criteria in this specification. Certain products
are excluded from participation in this programme, including for example products with a viewable
diagonal screen size greater than 61 inches; products with an integrated television tuner; and products
that are marketed and sold as televisions, including products with a computer input port (e.g., VGA) that
are marketed and sold primarily as televisions (other exclusions apply).

The maximum on-mode power consumption is defined according to the resolution of the display, as
presented in the table below. The products are divided by diagonal screen size (given in inches), and

7
 Monitors with a diagonal screen size > 60 inches do not qualify for ENERGY STAR.

 9
Discussion Paper on Ecodesign and Energy Labelling of Electronic Displays

have PON_MAX requirements for normal and high-resolution displays. The resolution density, DP is defined
in pixels / in2, and is equal to (r x 106) / A where r is the screen resolution in megapixels and A is the
viewable screen area in inches square. If DP exceeds 20,000 pixels per square inch, then the High
Resolution column is used where two terms are calculated for the PON_MAX equation – r1 and r2. The term
r1 is calculated as (20,000 x A) / 106 and r2 is calculated as ((DP – 20,000) x A) / 106. These two terms are
then plugged into the High Resolution equations to calculate the PON_MAX for those displays.

Table 1-4. ENERGY STAR labelling requirements for Maximum on-mode power consumption (PON_MAX)

 Product Type1 PON_MAX for Normal Resolution2 PON_MAX for High Resolution3
 d < 12,0 (6,0 x r) + (0,05 x A) + 3,0 (6,0 x r1) + (3,0 x r2) + (0,05 x A) + 3,0
 12,0 ≤ d < 17,0 (6,0 x r) + (0,01 x A) + 5.5 (6,0 x r1) + (3,0 x r2) + (0,01 x A) + 5,5
 17,0 ≤ d < 23,0 (6,0 x r) + (0,025 x A) + 3,7 (6,0 x r1) + (3,0 x r2) + (0,025 x A) + 3,7
 23,0 ≤ d < 25,0 (6,0 x r) + (0,06 x A) - 4,0 (6,0 x r1) + (3,0 x r2) + (0,06 x A) - 4,0
 25,0 ≤ d ≤ 61,0 (6,0 x r) + (0,1 x A) - 14,5 (6,0 x r1) + (3,0 x r2) + (0,1 x A) – 14,5
 25,0 ≤ d ≤ 61,0 for
 (0,27 x A) + 8,0 (0,27 x A) + 8,0
Signage Displays Only
1
 d is the diagonal screen size in inches
2 2
 Normal resolution is DP ≤ 20,000 pixels/in where r is screen resolution in megapixels, A is viewable area in square
 inches and the result is rounded to the nearest tenth of a watt (W)
3 2
 High resolution is DP > 20,000 pixels/in where r is screen resolution in megapixels, A is viewable area in square
 inches and the result is rounded to the nearest tenth of a watt (W)
Note: the numbers appearing in red have been corrected from the original OJEU notice, which when compared to
 the original source document for this table – US EPA Energy Star Program Requirements for Displays, version 6.0
 8 9
 revision January 2013 has typographical errors for two categories of product.

For example, consider a 19-inch diagonal screen with a viewable area of 162 square inches (10.45 dm 2).
This display has a resolution of 1440 x 900, or 1,296,000 pixels, thus having a DP value of 8000, so it
would fall into the normal resolution column. Applying the equation for a 19 inch diagonal display ((6,0 x
r) + (0,025 x A) + 3,7) and plugging into that equation, the PON_MAX is 15.5 Watts, when rounded to the
nearest tenth of a Watt.10

The above equations are presented graphically below, assuming an aspect ratio of 16:9. All sizes were
converted into dm2 for clarity and comparison to other graphs in this section. The normal resolution
curve is based on the maximum resolution of a DP value equal to 20,000 pixels per in2. For a 19 inch
computer monitor, that equates to 3.1 megapixels. The high resolution curve is based on a resolution of
30,000 pixels per in2, which for a 19 inch computer monitor corresponds to 4.7 megapixels.

8
 http://www.energystar.gov/sites/default/files/specs//private/Final_Version_6%200_Displays_Program_Requirements.pdf
9
 OJ L 114, 16.04.2014, p.75
10
 If the television equation were applied to this computer monitor example, it would be: EEI= 15.5 / (15 + 10.45 x 4.3224) =
0.26, which would correspond to a television Energy Class rating of A.

 10
Discussion Paper on Ecodesign and Energy Labelling of Electronic Displays

Figure 1-5. ENERGY STAR labelling requirements for Maximum on-mode power consumption (PON_MAX)

For products that meet the definition of an Enhanced-Performance Display, an extra power allowance
(PEP) is calculated and added to PON_MAX as calculated in Table 1-4. The sum of the PEP and PON_MAX
represents the maximum allowable power under this scheme for enhanced performance displays.
There are two extra power allowance equations, one for screens with a diagonal screen size less than 27
inches and one for screens with a diagonal measurement of 27 inches and greater.

 PEP
Discussion Paper on Ecodesign and Energy Labelling of Electronic Displays 2. European Market Overview The Lot 5 Preparatory Study on televisions was completed and published in August 2007, just prior to a technological revolution in television technology. At the time when the preparatory study was conducted, LCD televisions with LED backlighting were considered an expanding niche market. Since that time, the rapid development and market adoption of this technology and other energy saving technologies resulted in industry-led energy efficiency improvements that were faster than had been originally anticipated. A market monitoring report published in July 201411 concluded that “these improvements [in efficiency] were not mainly caused by the Ecodesign and Labelling regulations” (Topten, 2014). They concluded that the improvements were a result of natural technology development which happened much faster than the Commission had anticipated when setting the regulation in 2009. However they point out that the discussions surrounding the energy-efficiency measures in combination with the energy label may have put this aspect of the design into focus and accelerated the introduction of more efficient models. The total energy consumption of televisions (and to a large extent computer monitors) in Europe has been affected by a number of parameters, including: a higher number of display devices per household (i.e., higher market penetration rates), longer daily use of the display devices (N.B., not only for watching programmes but also playing games, web browsing, etc.), an overall increase in the average size of television screens and computer monitors, the adoption of new features (e.g., Internet access, tuners, storage devices), the development of more energy efficient technologies for televisions and computer monitors. While these would be excellent data to fully understand, in order to have a better assessment of the actual installed energy use of electronic displays across Europe, these data are difficult to estimate and in some cases are unknown or proprietary. For the purposes of this discussion paper, the market assessment will instead concentrate on understanding the changes and evolution of the European television market as this is the most prevalent of the products covered in regulation EC No 642/2009. 2.1. Shipments and Screen Size According to the Topten European Market study, the annual sales of televisions in the EU-24 grew from 41 million units in 2007 to a peak of 56 million units in 2010 (Topten, 2014). Shipments then gradually declined to 54 million units in 2011, 47 million units in 2012 and 41 million units in 2013. The 2013 level of shipments is equal to the estimated shipments for 2007 of 41 million. Two factors that contributed to this significant (37%) increase in sales in 2010 relative to 2007 were (1) the gradual switch across Europe 11 European TV market 2007-2013; Energy efficiency before and during the implementation of the Ecodesign and Energy Labelling regulation; Second report with 2013 sales data; Anette Michel, Sophie Attali, Eric Bush, Topten International Services, Zurich, Switzerland, 7 July 2014. http://www.topten.eu/uploads/File/European_TV_market_2007–2013_July14.pdf 12
Discussion Paper on Ecodesign and Energy Labelling of Electronic Displays

from analogue to digital broadcast and (2) the introduction of flat-screen, smaller-footprint and better
performing televisions.

In contrast to the rise and fall of television sales between 2007 and 2013, over this same time period,
there was a steady increase in the demand for larger screen-sizes in televisions. Consumers were
purchasing increasingly large television screens as shown through the sales data for the EU-24 presented
in the Topten market report. Figure 2-1 shows the relative proportion of the market by screen size
changing over a seven year time period for the EU-24 (Topten, 2014). In 2007, for example, televisions
sized 40-50” (i.e., 102 cm – 127 cm diagonal) were approximately 15% of the market; but by 2013, their
market share had more than doubled to 32%. And in contrast with that, televisions
Discussion Paper on Ecodesign and Energy Labelling of Electronic Displays

2.2. Relationship Between Cost and Energy Efficiency Level
The Topten market report also assessed whether the market trends and consumer choices were having
an impact on the price of televisions in the European Market (Topten, 2014). The report analysed the
GfK sales and price data for 2012 and 2013 and compared the trends across screen-size categories and
across energy label class categories. In other product groups regulated under ecodesign like
refrigerators and electric motors, products typically become more expensive as they increase in
efficiency. However the data showed that this was not the case for televisions. Instead, it was found that
there was no relationship between cost and efficiency, thus indicating that there is a negative life-cycle
cost (i.e., financial savings to consumers) associated with purchasing more energy-efficient models.

There are two sets of graphs reproduced here from the Topten market report which clearly illustrate the
lack of any relationship between cost and efficiency. Figure 2-2 shows the average sales prices across
the EU-24 in 2012 and 2013 for all televisions between 30” and 40” diagonal, and between 40” and 50”
diagonal (please note a different Y-axis scale in these two figures) (Topten, 2014). The efficiency of the
television in the sample increases as the models move from D class to A++ class. The average price paid
(Euros) for each label class of the two size categories is shown underneath the bars. In both figures,
there is no discernible correlation between price and efficiency (as connoted by energy label class). Thus
the data seem to indicate that efficiency gains incorporated into new television models are being
achieved without having a clear or measurable impact on price.

 Figure 2-2. Average Sales Prices of TV by Energy Label Class, Holding Screen Size Constant. Data: GfK,
 published in Topten, 2014.

In stark contrast to the above figures, the Topten market report analysed the impact on price that is
associated with screen size. Figure 2-3 illustrates the price trend in 2012 and 2013 where the energy
label class is held constant (i.e., all A-class TVs in figure (a)) and where all energy label classes are
combined and the database is only differentiated on screen size (b) (Topten, 2014). These two figures
show a very clear trend in increasing price correlated with television screen size – the larger the screen,
the more expensive the television. Please note that there are different Y-axis scales used in figures (a)
and (b) below.

 14
Discussion Paper on Ecodesign and Energy Labelling of Electronic Displays

 Figure 2-3. Average Sales Prices of TVs by Screen Size, for A-Class Only and All Energy Label Classes.
 Data: GfK, published in Topten, 2014.

From a policy-making perspective, it is very relevant to understand that in the European television
market, higher efficiency does not involve higher cost for the consumer. Television screen size has a
much larger influence on price, as will other aspects related to the television performance such as
resolution or colour quality.

The data show, however, that energy label class which is a surrogate for energy-efficiency does not have
an impact on price, and thus moving the market to higher efficiency televisions has a negative life-cycle
cost benefit for consumers. This finding means that moving to higher efficiency models of electronic
displays will bring immediate benefits (i.e., financial savings) to consumers. For this reason, no life-cycle
cost assessment was conducted as part of this review.

2.3. Average Energy Consumption
For many other products, a trend of increasing average size would tend to increase energy consumption,
but the technological improvements being incorporated into electronic displays have been found to
more than off-set the increase in size. The graph below depicts the sales-weighted average on-mode
power consumption of televisions in the EU-24 and for a 40-43 inch (101-109 cm) television. These 2007
to 2013 values represent sales-weighted averages for the EU-24 based on GfK data (Topten, 2014).

 15
Discussion Paper on Ecodesign and Energy Labelling of Electronic Displays

 Figure 2-4. Sales-Weighted Average TV energy consumption in EU-24, 2007 – 2013. Data: GfK,
 published in Topten, 2014.

The red line in the above figure shows the reduction in power consumption for a 40-43 inch television
between 2007 and 2013. Over that time period, the power consumption for the same size screen drops
from 250 Watts to around 70 Watts, which represents a reduction of approximately 72%. Across all
televisions sold over that same time period (the blue line in Figure 2-4), the reduction in power
consumption is approximately 63%. One of the reasons that the reduction in all sizes is not as large as
the reduction for one specific size category is due to the trend toward larger screen sizes in the sales
mix.

2.4. Changing TV Technologies
The principal driver behind the improvement in energy-efficiency of televisions has been the change in
the underlying technologies being incorporated into these products. Once the dominant technology in
televisions, between 2007 to 2013 cathode ray tube (CRT) technology experienced rapidly declining
sales and is now virtually non-existent in the EU market. The new technologies that entered the market,
replacing CRTs are flat-screen technologies such as plasma and liquid-crystal display (LCD). The first
generation of LCD technology incorporated cold cathode fluorescent lamps (CCFL), and these have now
been all but replaced by light emitting diodes (LED) lamps for backlighting the LCD screen.

CRT TVs were 89% of the market in 2004, and only seven years later their shipments had dropped to
nearly zero (Topten, 2014). LCD TV’s, in contrast went from 8% of sales in 2004 to 87% in 2009. LCD TV’s
were originally illuminated with CCFL technology, which was eventually replaced with LED back-lit units.
By 2013, LCD TVs with CCFL back-lighting had dropped to 4% of sales, with LED being the dominant
technology. Plasma technology was considered to have a promising future in the large TV sizes, such as

 16
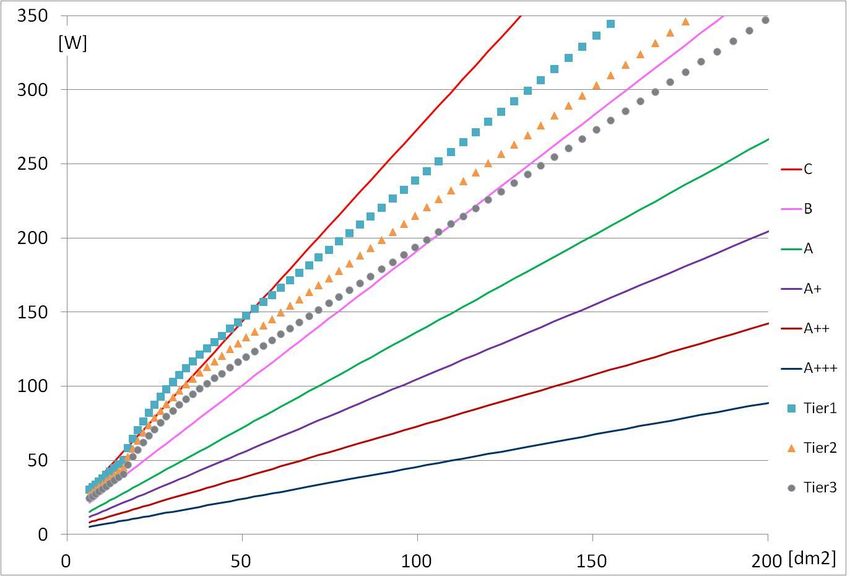
Discussion Paper on Ecodesign and Energy Labelling of Electronic Displays

36” and greater. However this technology never achieved greater than 10% of sales; and in 2013
Panasonic announced it would stop producing plasma TVs from March 2014, Samsung announced that it
would stop of production from the end of 2014 and LG is reported as moving in the same direction. Rear
projection TVs had been on the European market as early as 2000, but by 2012 the last manufacturer
(Mitsubishi) announced it would stop production. Rear projection TVs were for large screen formats
and have never really achieved more than 1% of market share.

Figure 2-5 shows how the television technologies have been changing over time in Europe (EU-24), with
relative proportions of sales of the total market in each year. These data are GfK sales data for the EU-24
(Topten, 2014).

 Figure 2-5. TV Technology Changes in EU-24, 2007 – 2013. Data: GfK, published in Topten, 2014.

2.5. Impact of the Commission Regulations
Different studies (Coolproducts for a Cool Planet12; Topten 2014; CSES, 2012) indicate that the energy-
efficiency improvements in televisions are due in large part to the unanticipated rapid pace of
technological change. The ecodesign mandatory efficiency requirements are thought to have had little
impact on the market. Figure 2-6 shows how the sales-weighted market average for specific size
categories was well ahead of the requirements in EC No 642/2009 (Topten, 2014). The figures present
data for the two most popular size categories in Europe – 32 inch and 40-43 inch screens.

12
 Link to the Coolproducts for a Cool Planet homepage: http://www.coolproducts.eu/

 17
Discussion Paper on Ecodesign and Energy Labelling of Electronic Displays

Figure 2-6. Average Power Consumption of Models Sold in EU-24 Compared to Ecodesign Tiers. Data:
 GfK, published in Topten, 2014.

For the 32 inch television, when the regulation was introduced in August 2010, the market average was
already 15-24% below the maximum allowable on-mode power consumption. Similarly, when Tier 2
took effect in April 2012, the market average for 32 inch TVs was 40% below the maximum allowable
level. For the popular 40-43 inch televisions, the market average was already more efficient than the
maximum allowable on-mode power – the average was 24-31% more efficient than Tier 1 in 2010 and
51% more efficient than Tier 2 in 2012.

The rapid evolution of television technology also exceeded the expectations on the Energy Labelling
Regulation. Figure 2-7 below shows the energy class trend over time of the televisions offered on the EU
Market (Topten, 2012). Energy class A++ products (defined as 0.10 ≤ EEI < 0.16) had been planned to be
introduced to the European market in 2017, but it had already started to appear on the European
market in 2012, and reached 68 models by May 2014 (Topten, 2014).

 18
Discussion Paper on Ecodesign and Energy Labelling of Electronic Displays

Figure 2-7. Efficient television models on the European market, Jan 2010 – May 201413. Source: Topten

13
 European TV market 2007-2013; Energy efficiency before and during the implementation of the Ecodesign and Energy
Labelling regulation; Second report with 2013 sales data; Anette Michel, Sophie Attali, Eric Bush, Topten International Services,
Zurich, Switzerland, 7 July 2014. http://www.topten.eu/uploads/File/European_TV_market_2007–2013_July14.pdf

 19
Discussion Paper on Ecodesign and Energy Labelling of Electronic Displays 3. Issues to be addressed in a revision of the Regulations This chapter discusses some of the key issues that relate to digital displays, specifically (1) technology efficiency trends; and (2) product features (e.g., 3D screens, Internet-connected displays, automatic brightness control, enhanced reactivation and mode control options, ultra-high definition). Each of these issues is discussed in more detail in the subsequent subsections. 3.1. Technology efficiency trends Although very significant gains in energy-efficiency have been achieved for televisions in the last 5-10 years, there are technologies that can be employed that will further improve their performance in the coming 5-10 years. Table 3-1. Efficiency improvement options in LCD televisions and digital displays Components Expected improvement options Cost / Effect on efficiency / availability Cost increase but adopted by manufacturers CCFL to LED due to improved quality Backlight Overall cost reduction in the longer term Source Backlight Unit High LED efficacy Thermal management challenge; and near term higher cost of better LEDs Optimized combination of films Trade-offs in material cost, ease of Multi-function film Optical manufacture, and efficiency e.g., prism + diffuser films Reflective polarizer (e.g., Dual Cost increase, proprietary technology Brightness Enhancement Film) Improvement in transmittance by Proprietary technology optimizing pixel design, functional LCD Panel R&D investment required but driven by total layers, e.g., polarizer, colour filter, cost reduction. and data line Cost increase, but can save up to 50% of backlight power (Shiga et al 2008) Backlight dimming in relation to Backlight structure, input images, and picture content, i.e. black colours algorithm but with direct LED backlight and 2- Power edge LED backlight management Backlight dimming in relation to Cost increase ambient light, i.e., Auto The effect varies with default manufacturer Brightness Control (ABC) settings and ambient light levels. Presence detectors Trade-off in cost and efficiency and already Power Supply Unit (PSU) operating at over 80% efficiency in volume Efficiency production products Other Trade off with efficiency using filters but now Colour gamut (by colour filter or through Quantum-dot LED technology light source) providing an efficiency gain of potentially 20% Source: LBNL, 2012 with some minor modifications. 20
Discussion Paper on Ecodesign and Energy Labelling of Electronic Displays

3.1.1. Organic Light Emitting Diode Televisions
Organic Light Emitting Diodes (OLEDs) are made from carbon-based organic materials that emit light
when electricity is applied. Due to the fact that OLEDs produce their own coloured light directly, OLED
displays do not require a backlight and filters (unlike LCD displays), thus they can achieve gains in
efficiency as well as be being simpler to manufacture and much thinner. OLEDs offer great picture
quality, high contrast ratios, vibrant colours, fast response rates and a wide viewing angle.

The OLED is structured around a cathode (that injects the electrons), an emissive layer and an anode
(that removes the electrons). Research in OLED displays is on-going as this technology is being
commercialised. For instance, there are small-molecule OLED displays and large-molecule (or polymer)
OLED displays. Another technology division is between fluorescent and phosphorescent materials. The
fluorescent materials last longer but are much less efficient than phosphorescent materials, although
there are still some research and development challenges, such as developing a stable blue
phosphorescent OLED.

In terms of commercialised OLED displays, are Passive-Matrix (PMOLED) and Active-Matrix (AMOLED)
designs, based on a difference in the driving electronics, either passive matrix of active matrix. A
PMOLED uses a simple control scheme that addresses each row (or line) in a display sequentially. This
circuit does not contain a storage capacitor, so the pixels in each line are off most of the time. To
compensate for this, more voltage is needed to make them brighter which affects their efficiency and
there are restrictions on resolution and size. PMOLED displays are usually small and can be found in
products like MP3 players, mobile phones and car radios. AMOLED displays, on the other hand, are
driven by a thin-film transistor (TFT) which contains a storage capacitor that maintains the line pixel
states, enabling large screens and higher resolution displays. AMOLED displays were first introduced to
the market in 2007/08 and have been used on digital cameras, mobile phones and OLED TVs.

Global shipments of OLED televisions are expected to reach 2.7 million units in 201514 compared with
260 million LED-LCD televisions. LCD televisions are expected to dominate world shipments of
televisions from 2012 until OLED televisions become price competitive (earliest predicted date 2016).
There will be a subsequent two to three year transition period before OLED televisions dominate large
screen shipments.

3.1.2. Quantum-dot LED TVs
One of the new technologies that the industry is developing to differentiate and improve energy-
efficiency of displays are quantum dots, which promise high colour gamut performance, enabling LCD
displays to offer similar colour gamut performance to AMOLED displays.

LCD televisions consist of two major components - a backlight unit which provides light and a liquid-
crystal module which creates the image. The liquid-crystal module contains millions of pixels, each of
which contains three subpixels, one each for blue, green and red light. By controlling the amount of light
each subpixel allows to pass through the pixel, a broad range of colours is created. The quality of the

14
 “AMOLED Televisions Presented at CES, but Volume Remains Limited”, IHS Technology; January 21, 2013” See:
https://technology.ihs.com/419547/amoled-televisions-presented-at-ces-but-volume-remains-limited

 21
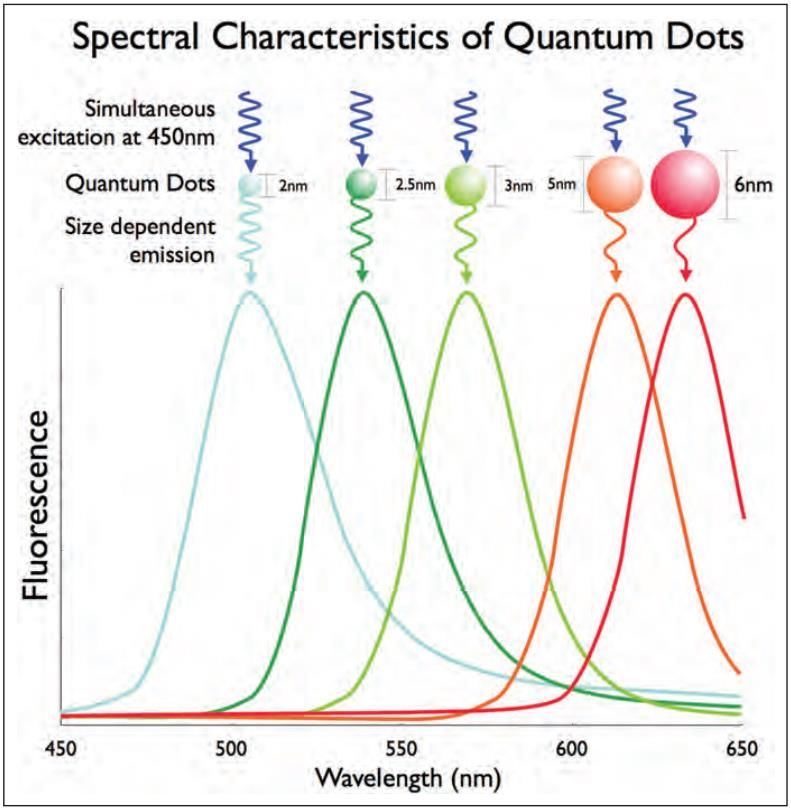
Discussion Paper on Ecodesign and Energy Labelling of Electronic Displays

colours produced by the LCD television is then a function of the spectral energy of the white light in the
backlight unit and the effectiveness of the colour filter at the subpixel level.

Quantum dots are a new material class that can be tuned to emit light very efficiently at precise red,
green and blue wavelengths, thus creating an ideal light spectrum for LCD displays. Quantum dots can
be fabricated to convert short-wavelength light (e.g., blue light) to nearly any colour in the visible
spectrum. The spectral output of the quantum dot is based on its size, with smaller dots producing
shorter wavelengths (i.e., blue light) and larger dots producing longer wavelengths (i.e., red light); and
medium-sized dots covering the wavelengths in between. The best quantum dots available today emit
light with over 90% efficiency, within a very narrow spectral distribution. Ranging in size from 2 to
6 nanometers, quantum dots manufactured from the same material emit different colours of light just
due to their differences in size, as shown in the figure below.15

 Figure 3-1. Quantum-dot size relates to emission wavelength

Some early adopters of quantum dot technology include Amazon’s Kindle Fire HDX tablet PC and Sony’s
Triluminos TV in 2013.16 However, quantum dots to date have had issues that prevented faster market
penetration. One problem is Cadmium which most of the dots contain and the other is the high price of
the materials, driven in part by the high R&D investment that was necessary to commercialise them.
Quantum dot manufacturers are working to address these barriers, for example Nanoco has produced
Cadmium-free quantum dot materials, and while other manufacturers obtained a temporary exemption
in Europe for Cadmium in products with quantum dot-based displays. Regarding the cost of materials,
many manufacturers are entering the market, especially from Korea including Samsung, LG, Sangbo,
LMS, Hanwha and SKC-Haas. Increased competition is expected to lower prices in the near future and
accelerate the market adoption.

15
 “Quantum-Dot Displays: Giving LCDs a Competitive Edge through Color”, by Jian Chen, Veeral Hardev, and Jeff Yurek from
Nanosys. Information Display, January 2013.
16
 Source: http://www.displaysearchblog.com/2014/08/is-quantum-dot-the-next-step-in-lcd-tv-evolution/#more-5707

 22
You can also read