Plugging Ontario Into A Green Future - A Renewable is Doable Action Plan - and Roger Peters - Pembina Institute
←
→
Page content transcription
If your browser does not render page correctly, please read the page content below

Plugging Ontario
Into A Green Future
   A Renewable is Doable Action Plan

         Cherise Burda, THE PEMBINA INSTITUTE
                  and Roger Peters

                  NOVEMBER 2008

                                                CANADIAN ENVIRONMENTAL LAW ASSOCIATION
                                                 L’ASSOCIATION CANADIENNE DU DROIT DE L’ENVIRONNEMENT

Plugging Ontario
Into A Green Future
A RENEWABLE IS DOABLE ACTION PLAN

    Cherise Burda, The Pembina Institute
             and Roger Peters

              NOVEMBER 2008

                                  CANADIAN ENVIRONMENTAL LAW ASSOCIATION
                                   L’ASSOCIATION CANADIENNE DU DROIT DE L’ENVIRONNEMENT
Burda, Cherise and Peters, Roger
                            Plugging Ontario into a Green Future
                            1st Edition, published November 2008
                            Printed in Canada
                            Production management: Lori Chamberland
                            Editor: Margaret Chandler
                            Design/Layout: J & W Communications
                            Cover Photo: National Renewable Energy Laboratory
                            ©2008 The Pembina Foundation
                            ISBN 1-897390-17-3
                            For more information about this report please contact
                            The Pembina Institute
                            Suite 415 - 215 Spadina Avenue
                            Toronto, Ontario
                            Canada, M5T 2C7
                            Phone: 416-644-1016
                            Email: info@pembina.org
                            Download additional copies of this publication from the Pembina
                            Institute website: www.pembina.org and renewableisdoable.com.

About Renewable             Renewable Is Doable is a joint inititative of the Pembina Institute
                        s

       Is Doable            and World Wildlife Fund. It has now grown to include the
                            David Suzuki Foundation, Greenpeace, Sierra Club and the
                            Canadian Environmental Law Association. For more information
                            about this publication and the Renewable is Doable campaign
                            visit www.renewableisdoable.com.

                                                           CANADIAN ENVIRONMENTAL LAW ASSOCIATION
                                                            L’ASSOCIATION CANADIENNE DU DROIT DE L’ENVIRONNEMENT

                   ii       P L U G G I N G O N TA R I O I N TO A G R E E N F U T U R E
About the         Cherise Burda

                      s
     Lead Authors         Cherise joined Pembina after over 14 years working on environ-
                          mental policy and legislative solutions in British Columbia. Now in
                          Ontario, Cherise directs research and implementation strategies
                          for sustainable energy solutions in Ontario, including green supply
                          options for the Ontario electricity sector and policy initiatives for
                          urban sustainability. Cherise holds a B.Sc. in Environmental Science,
                          an MA in environmental law and policy, and a B.Ed.

                          Roger Peters
                          Roger Peters is a Senior Policy Advisor to the Pembina Institute,
                          a Canadian policy research and advocacy organization specializing
                          in sustainable energy solutions. Roger has 30 years experience in
                          energy efficiency and renewable energy as a consultant, researcher,
                          writer, policy advisor, and advocate. In 2005, Roger helped to
                          create the Canadian Renewable Energy Alliance, a joint initiative
                          of Canadian NGOs who support a global transition to renewable
                          energy. The Alliance published a model Canadian Renewable
                          Energy Strategy in 2006 and is actively engaged in prompting more
                          Canadian support for renewable energy. Roger has significant in-
                          ternational experience in Asia, Latin America and Africa on energy
                          efficiency and rural energy projects.

Acknowledgements          We wish to thank the following peer reviewers who gave generously
                      s

                          of their time in providing information and advice: Ralph Torrie, Marion
                          Fraser and David Poch. Special acknowledgement goes to our project
                          partners Keith Stewart of WWF-Canada and Shawn-Patrick Stensil of
                          Greenpeace for detailed contribution and ongoing guidance.
                          Thank you to Graham Haines of the Pembina Institute for his
                          research and to Rob Ewaschuk who volunteered his time to
                          editing and photo-hunting.
                          We would like to acknowledge those who provided valuable
                          comments: Mark Lutes, Deborah Doncaster, Mark Winfield,
                          Tim Weis and Kai Millyard.
                          Finally, we would like to thank the Oak Foundation for their
                          generous support of this project.

                          Any errors or omissions remain the responsibility of the authors.

                iii       P L U G G I N G O N TA R I O I N TO A G R E E N F U T U R E
Plugging Ontario Into A Green Future
                         A R E N E WA B L E I S D OA B L E AC T I O N P L A N

Contents            Executive Summary............................................................................... 1

                s
                    1 Part One: Keeping Ontario’s Green Promises................... 5
                    		 Introduction....................................................................................... 5
                    		 The Opportunity.............................................................................. 5
                    		 Averting GHG Pollution................................................................. 7
                    		 The Case of Pickering B.................................................................. 7
                    		 The Case of Bruce B........................................................................ 8
                    		 Increasing GHG Emissions............................................................. 8
                    		 Falling Short of Ontario’s Emission Reduction Targets.......... 10
                    		 Crowding Out Green Options.................................................... 11
                    		 Getting More Green in the Mix.................................................. 12

                    2 Part Two: The Renewable Is Doable Portfolio:
                      Reduce. Renew. Recycle................................................................ 13
                    		 Introduction..................................................................................... 13
                      REDUCE................................................................................................. 16
                    		 CDM Is Cost-Effective................................................................... 18
                    		 CDM Is Quick to Deploy............................................................. 19
                    		 Conservation Is Clean................................................................... 19
                    		 CDM Is Market Ready................................................................... 20
                    		 Making It Happen............................................................................ 20
                      RENEW................................................................................................... 21
                    		 Wind Power..................................................................................... 22
                    		 Solar Power...................................................................................... 24
                    		 Wind and Solar Can Be Cost-Effective..................................... 25
                    		 Wind and Solar Are Quick to Deploy....................................... 25
                    		 Wind and Solar Are Clean............................................................ 25
                    		 Wind and Solar Are Market Ready............................................. 25
                    		 Making It Happen............................................................................ 26
                    		 Needed: A Smart Green Grid...................................................... 27

           iv       P L U G G I N G O N TA R I O I N TO A G R E E N F U T U R E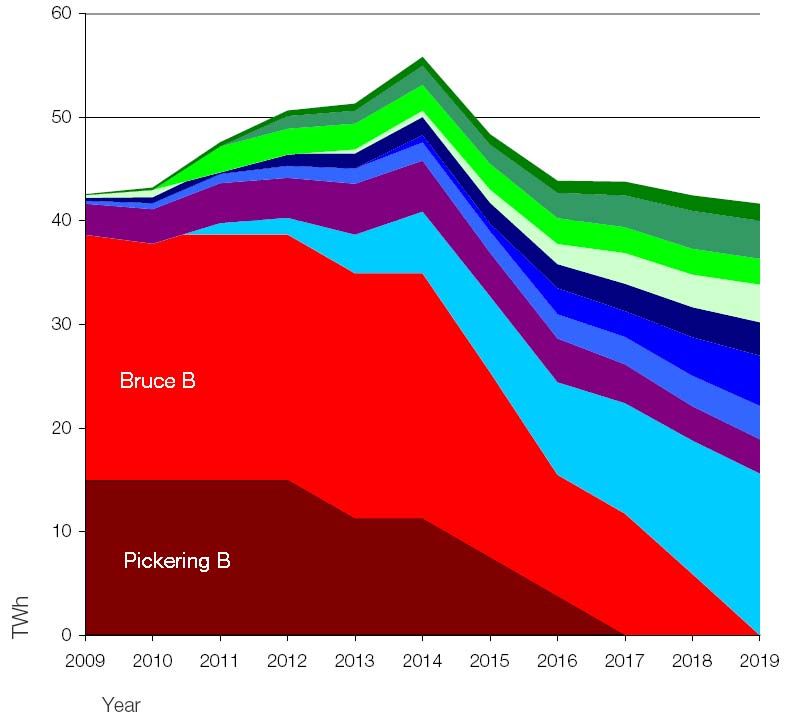
RECYCLE AND RECOVER................................................................ 28
      		       Generating “Free” Power with Waste Heat Recycling........... 28
     		        Waste Heat Recycling Is Cost-effective,
     		        Quick to Deploy, Clean and Market Ready.............................. 29
     		        Making It Happen............................................................................ 30
     		        Increasing the “Smart Use” of Natural Gas
     		        through Combined Heat and Power.......................................... 30
     		        CHP Is Cost-Effective.................................................................... 33
     		        CHP Is Quick to Deploy............................................................... 33
     		        CHP Is Clean................................................................................... 33
     		        CHP Is Market Ready.................................................................... 33
     		        Making It Happen............................................................................ 33

     3 Part Three: A Seven-Step Action Plan for Green Energy
     		 ............................................................................................................ 34

     APPENDIX 1:
       Spreadsheets,Tables and Graphs............................................. 36
     		        Appendix 1.A – Emissions Factors............................................. 36
     		        Appendix 1.B – Scenario Data.................................................... 38

     APPENDIX 2:
     		 Detailed List of Policy Recommendations.................... 41

     Notes:
     		 Footnotes 1-93................................................................................ 44

	   P L U G G I N G O N TA R I O I N TO A G R E E N F U T U R E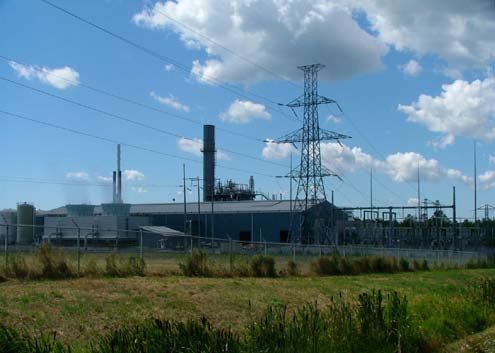
List of Figures            Figure 1: Filling the Gap with Quick-To-Deploy

                       s
                                     Green Energy Options...............................................................3
                           Figure 2: Increase in GHG Pollution Due to Fossil-Fuel
                                     Replacement of Pickering B Nuclear Station........................7
                           Figure 3: Comparison of the Historical Nuclear Production
                                     with the IPSP Nuclear Forecast...............................................8
                           Figure 4: Increase in GHG Emissions in Ontario Under
                                     the OPA Electricity Plan with Applied Historical
                                     Performance of Nuclear Reactors..........................................9
                           Figure 5: Filling the Gap with Quick-To-Deploy
                                     Green Energy Options............................................................ 13
                           Figure 6: Estimated Recycled Energy Potential
                                     from Ontario Stacks >50m above grade............................ 29

 List of Tables            Table 1:      The Renewable Is Doable Portfolio
                       s

                                         of Additional Green Resources............................................. 14
                           Table 2:      Conservation and Demand Management
                                         (CDM) for 2014 and 2019..................................................... 16
                           Table 3:      Renewable Power Sources for 2014 and 2019................. 21
                           Table 4:      Waste Heat Recycling (CDM) for 2014 and 2019........... 28
                           Table 5:      Combined Heat and Power (CHP)
                                         for 2014 and 2019.................................................................... 31

                  vi       P L U G G I N G O N TA R I O I N TO A G R E E N F U T U R E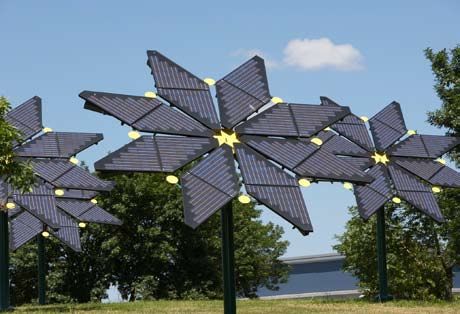
Plugging Ontario Into A Green Future
                    A R E N E WA B L E I S D OA B L E AC T I O N P L A N

  Executive
                             O
                                       n September 17, Ontario Energy Minister
                                       George Smitherman directed the Ontario
  Summary                              Power Authority (OPA) to “revisit” its
                             20-year electricity plan to see how the contribu-
                             tions of renewable energy, conservation and
     Ontario’s potential     distributed generation could be “enhanced”. 1
  for renewable energy
   is much greater than      Plugging Ontario Into A
       our energy needs.     Green Future lays out an
      The Renewable Is       action plan for achieving
     Doable portfolio is     this goal and shows
   feasible and requires     how doing so will assist
no significant upgrades      Ontario in meeting
          to the current     its climate targets and
    transmission system.     create new green jobs.
                             It also identifies the major
                             barrier to achieving these
                             goals: the province’s com-
                             mitment to nuclear power.
                             Despite the intent of the
                             McGuinty government’s
                             original supply mix direc-
                             tive which set a minimum
                             target for renewable en-
                             ergy, the OPA’s electricity
                             plan effectively “caps” the
                             development of renewable
                             energy because of its focus
                             on large, centralized gener-
                             ation stations, particularly
                             nuclear generators.

                                                     PHOTO:
                                        NATIONAL RENEWABLE
                                         ENERGY LABORATORY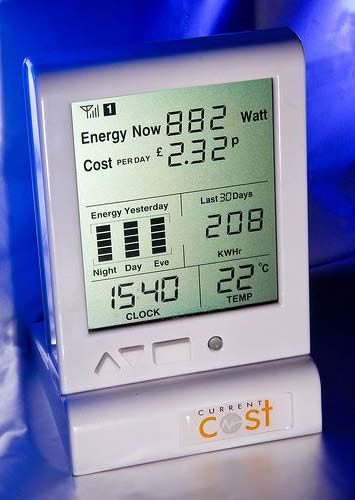
E X E C U T I V E S U M M A RY

         The
                                   T
                                          he best opportunity to ‘get more green’
                                          into Ontario’s electricity supply mix is to
  Opportunity                             allow clean, sustainable sources of power
                                   to replace ageing nuclear reactors when they
                                   reach the end of their operational lives.
         There is a better
   option: Replace end-            According to the OPA, the Ontario government must decide
 of-life nuclear reactors          early in 2009 whether to rebuild or replace the Pickering B nuclear
   with quick to deploy            station scheduled to come offline in 2013. A similar decision about
   green energy sources            the Bruce B nuclear station must be made within the mandate of
       and conservation.           this government as well. 2 However, by framing these two decisions
                                   as “either rebuild or replace” nuclear stations, the OPA has failed
         PHOTO: SAULT STE. MARIE   to consider the option of expanding renewable energy beyond the
          WIND FARM. COURTESY
                  WWF-CANADA       minimum in the supply mix directive.
 INSET PHOTO: PICKERING NUCLEAR
STATION. COURTESY OF GREENPEACE    Instead, the OPA has given the government an unpalatable choice:
                                   rebuild old reactors at high cost and high risk or build new nuclear
                                   plants by 2020. Both options increase fossil generation until
                                   reactors are refurbished or built, resulting in the risk of higher
                                   greenhouse gas emissions.
                                   There is a better option: Replace these aged nuclear reactors with
                                   quick-to-deploy green energy sources and conservation.

                         	        P L U G G I N G O N TA R I O I N TO A G R E E N F U T U R E
E X E C U T I V E S U M M A RY
The
R
enewable is Doable presents a portfolio of
green energy options which can replace
Renewable the generating capacity of both the Pickering
is Doable B and the Bruce B stations as they retire beginning
Portfolio in 2013.
By immediately ramping up clean energy options, Ontario can
reduce reliance on natural gas generation and coal-fired imports
and avoid the well established pattern in refurbishing old nuclear
reactors: cost overruns and lengthy delays.
Figure 1 below shows the schedule for retiring the units at the
The portfolio of Pickering B and Bruce B (red and orange wedges) and presents a
green resources suite of green resources that can fill this gap. These green resources
provides more than are in addition to the clean options currently in the OPA plan,
enough generation demonstrating that Ontario can go far above and beyond what
to replace effective the OPA is proposing for conservation, renewables, Combined
baseload capacity.
Heat and Power (CHP) and other clean, quick to deploy sources.
The portfolio of green resources provides more than enough
generation to replace effective baseload capacity.
FIGURE 1
Filling the Gap with
Quick-To-Deploy Green
Energy Options
P L U G G I N G O N TA R I O I N TO A G R E E N F U T U R EE X E C U T I V E S U M M A RY
A Seven-Step
T
he McGuinty government is serious about
expanding green energy in Ontario. To do so,
Action Plan for however, it must take the following seven
Green Energy steps over the next 24 months:
REPLACE Make room for renewables by choosing green power over
dirty energy
1 Replace Pickering B and Bruce B nuclear reactors with green power,
s
as these reactors come to the end of their lives over the next decade.
REDUCE Start first with all cost effective conservation to reduce
baseload
2 Direct the OPA to acquire all cost effective Conservation and De-
s
mand management (CDM) resources as per the intent of the Supply
Mix Directive, rather than treating the minimum target for CDM as
a cap. And direct the OPA to change its approach to conservation
from going after the “low hanging fruit” to acquiring deep energy
efficiency savings as per the recommendations submitted to the On-
tario Energy Board hearing on behalf of the Green Energy Coalition.
RENEW Then increase renewable energy sources
3 Transform the Renewable Energy Standard Offer Program (RESOP)
s
into an effective Advanced Renewable Tariff system (ARTs) to
include: prices differentiated by technologies, tiered pricing within
technologies, prices set according project costs and reasonable
return on investment, 20 year contracts, no caps on project size
or the program, and guaranteed access to the grid.
4 Use ARTs as the primary procurement mechanism for renewable
s
energy, empowering all Ontarians to become generators and
conservers at a fair price.
5 Direct Hydro One to develop and implement a Smart Green Grid
s
Upgrade Plan which gives renewable energy priority in Ontario’s
transmission and distribution system. In parallel, enable a regulatory
regime that encourages local distribution companies to acquire the
technical and financial resources to upgrade their systems to accom-
modate distributed energy from clean and renewable sources.
6 Embed these items in legislation via a Green Energy Act that in-
s
cludes an obligation for grid connections for green energy.
RECYCLE Use conventional fuels more efficiently with more CHP and
waste heat recovery
7 Implement the Clean Energy Standard Offer Program for cogenera-
s
tion and recycled energy but without capacity limits and with a feed
in tariff that provides a reasonable return for investors.
P L U G G I N G O N TA R I O I N TO A G R E E N F U T U R EKeeping Ontario’s
Part
One 1 Green Promises
The OPA’s current
plan relegates new
renewable energy to
a marginal role.
PHOTO: TEACHANDLEARN
ON FLICKR
O
ntario’s Ministry of Energy and
Introduction Infrastructure recently made a
commitment to enhance renewable
energy and conservation efforts in the province
and directed the OPA to adopt more ambitious
targets in these areas.3
However, it is not clear at this time how aggressive these new tar-
gets for renewable energy will be or where the “space” for more
green energy is going to come from within the proposed electricity
plan currently before the Ontario Energy Board.
Ontario’s existing and projected electricity supply mix is dedicated
almost fully to large, centralized power plants such as nuclear, coal
and gas plants (as well as hydro).4 The OPA’s current plan relegates
new renewable energy to a marginal role in meeting Ontario’s
electricity needs and leaves no room for green energy, including
conservation, to grow beyond the minimum level required by the
government’s directive.
The Opportunity The best opportunity to develop a green energy economy in Ontario
s
is to allow these sustainable sources of power to replace ageing nuclear
reactors when they are scheduled to shut down beginning in 2013.
To take advantage of this opportunity, however, the Ontario govern-
ment must forgo the advice of its electricity-planning agency. The OPA
has given the government an unpalatable choice: rebuild old reactors
at high cost and high risk or build new nuclear plants by 2020. Both
options increase fossil generation until reactors are refurbished or
built, resulting in the risk of higher greenhouse gas emissions.
P L U G G I N G O N TA R I O I N TO A G R E E N F U T U R EPA RT 1 : K E E P I N G O N TA R I O ’ S G R E E N P RO M I S E S
The imminent closure of the Pickering B and Bruce B nuclear sta-
tions provides space for green energy economy to grow in Ontario.
A decision to rebuild or replace these nuclear stations with addi-
tional nuclear stations post-2020 will foreclose any significant ex-
pansion of green power in the province. OPA’s own evidence dem-
onstrates that a higher commitment to energy efficiency requires a
reduced commitment to nuclear generation on line in 2018.5
To meaningfully and fully develop a green energy economy in
Ontario, the provincial government should take advantage of the
near-term closure of Ontario’s nuclear stations to make space for
renewable energy to grow, creating a ready market for new green
economic development.
Ontario could fall short
of meeting its GHG
reduction targets if it
continues to depend
on ageing nuclear
power plants in the
hope that they will
operate better than
they have in the past.
PHOTO: CLIPART
Averting GHG Pollution
This approach would also ensure that Ontario maintains its targets
to reduce greenhouse gas (GHG) pollution. The province could
fall short of meeting its GHG reduction targets if it continues to
depend on ageing nuclear power plants operating better than they
have in the past.
Should the operational problems and delayed refurbishments that
have plagued nuclear reactors in the past fifteen years persist over
the next decade, the result will be more – not less – GHG pollution.
The problem stems from the OPA’s plan to replace any shortfall in
nuclear generating capacity by burning more natural gas in inefficient
centralized plants and importing more coal-based power from the
U.S.6 The Province’s promise to phase out coal could be compro-
mised even if the nuclear fleet is able to match its less than stellar
performance of the last 15 years when it was plagued by operational
problems, delays and cost overruns.
P L U G G I N G O N TA R I O I N TO A G R E E N F U T U R EPA RT 1 : K E E P I N G O N TA R I O ’ S G R E E N P RO M I S E S
This report presents a short-term suite of feasible green energy
options to effectively replace the generating capacity of both the
Pickering B and the Bruce B stations. By immediately ramping up
clean energy options, Ontario can ensure enough power online by
2014 to ensure the phase-out of coal, reduce reliance on centralized
gas generation and imports, and avert the delays and cost overruns
of refurbishing old reactors.
The Case of Pickering B
The four reactors at the Pickering B nuclear station are scheduled
to come offline between 2013 and 2016. In 2009, the government
must decide whether or not it risks rebuilding the four Pickering
reactors or closes them permanently.
In its long-term electricity plan, the OPA provides contingencies
if Pickering B cannot be refurbished: increasing fossil generation
or trying to run the ageing reactors longer until new replacement
reactors can be built by 2020.
Figure 2 illustrates how GHG emissions fall dramatically in 2014
due to the anticipated coal phase-out but rise again in the event
that Pickering B is not refurbished. This is because of a heavily
fossil-dependent plan created for that scenario whereby increased
natural gas generation and fossil-based imports replace the capacity
of Pickering B.7
45
FIGURE 2
40
Increase in GHG
35
Pollution Due to
Fossil-Fuel Replace-
30 ment of Pickering B
Nuclear Station 8
25
20
15
10
Pickering B - No Refurbishment -
5 IPSP + Extra Imports
Mt CO2e
Baseline
0
2009 2010 2011 2012 2013 2014 2015 2016 2017 2018 2019
Year
P L U G G I N G O N TA R I O I N TO A G R E E N F U T U R EPA RT 1 : K E E P I N G O N TA R I O ’ S G R E E N P RO M I S E S
The Case of Bruce B
The four reactors at Bruce B nuclear station are scheduled to begin
shutting down for life-extension repairs or permanent closure in
2015, the year after the coal phase-out date.
The OPA’s plan does not include a contingency if life extension re-
pair is not an option and Bruce B is shut down.Yet, if this is the case,
developing replacement generation would need to begin now.
In 2006, Bruce Power claimed it could build new reactors quickly
enough to replace the ageing Bruce B reactors beginning in 2014.9
In 2007, however, the OPA plan assumes: “... the earliest in-service
date for new nuclear generation is 2018.”10
An early decision to close all the four Bruce B reactors at the end
of their life provides an opportunity to immediately take the cap off
of renewable energy development in the Bruce area, which is cur-
rently limited to 700 MW11 because of the priority given to Bruce
Power on transmission lines. The Bruce region has one of the great-
est potentials for cost-effective wind development in the province.12
Increasing GHG Emissions
The OPA’s assumption
that Ontario’s ageing The OPA’s optimistic assumption that Ontario’s nuclear fleet will
nuclear fleet will perform significantly better in the future than it has in the past is
perform better in the shown in Figure 3 below. This is very optimistic given that there will
future is unrealistic. be no new reactors built for at least a decade. Therefore, the OPA
is assuming that the performance of existing reactors will improve
significantly as they age, in spite of their past history.
FIGURE 3
Comparison of the
Historical Nuclear
Production with the
IPSP Nuclear Forecast 13
P L U G G I N G O N TA R I O I N TO A G R E E N F U T U R EPA RT 1 : K E E P I N G O N TA R I O ’ S G R E E N P RO M I S E S
In response to questions from interveners in the Integrated Power
System Plan hearing currently before the Ontario Energy Board,
the OPA modelled what would happen if future nuclear perfor-
mance matches past performance. The result was that the amount
of energy generated from Ontario’s reactors would be roughly 30%
lower than predicted between 2009 and 2019.
Consequently, any nuclear generation shortfalls over this period –
whether it be from refurbishment delays or operational shortcomings
– will be replaced by increases in both gas-fired generation and coal-
based imports from the U.S.The resulting GHG emissions due to applied
historical nuclear performance are presented in Figure 4 below.
FIGURE 4
Increase in GHG Emissions in Ontario Under the OPA Electricity
Plan with Applied Historical Performance of Nuclear Reactors14
P L U G G I N G O N TA R I O I N TO A G R E E N F U T U R EPA RT 1 : K E E P I N G O N TA R I O ’ S G R E E N P RO M I S E S
Falling Short of Ontario’s GHG Emission
Reduction Targets
The OPA’s plan forms the basis of the province’s greenhouse gas
emission forecasts as presented in Ontario’s Go Green Climate Action
Plan. If these overly optimistic assumptions are wrong, Ontario will
fail to meet its GHG targets.
In fact, according to this modelling, GHG emissions from the elec-
tricity sector in 2014 would increase by 26MT – that’s one-third of
Ontario’s entire Go Green GHG emission reduction target of 61MT
and an amount equivalent to all the GHGs produced by Ontario’s
residential and agricultural sector in 2004.
Even though Ontario has passed a regulation to phase out coal, this
effort may be undermined by “outsourcing” coal generation else-
where (importing coal-based imports from the U.S.) and by burning
more natural gas here at home. An additional 26MT of GHGs would
also negate the positive benefits of phasing out coal, which is ex-
pected to eliminate 28MT by 2014.
At worst, significant delays and cost overruns in rebuilding old
nuclear reactors could put the coal phase-out date in jeopardy. In
2005, for example, the refurbishment of Pickering A was finally aban-
doned after the costs reached four times the original estimates;16 in
2005, the Province broke its promise to phase out coal in 2007. The
subsequent promise to phase out coal in 2009 was broken in 2006.17
Crowding Out Green Options
The Ontario government’s Supply Mix Directive has set minimum
targets for conservation and renewable energy.18 The OPA’s plan
clearly interprets the directives as maximums and places limits on
both CDM and renewable energy.19
In addition, the OPA plan and its current slate of CDM programs are
focused on reducing peak demand in the summer rather than address-
ing the potential to reducing baseload requirements. Reducing baseload
has significant additional customer and environmental benefits through
lower overall energy consumption, but it also reduces peak demand.
The OPA also interpreted the directive’s maximum of 14,000 MW
of nuclear capacity as a target resulting in a plan for Ontario’s grid –
transmission and distribution – designed around these minimal roles
for CDM, renewable power, and combined heat and power, and a
maximum role for nuclear power. Analysis of grid development in
other countries confirms any power system based on nuclear
power is so highly centralized that it effectively precludes distributed
energy sources from ever becoming major power sources.20
10 P L U G G I N G O N TA R I O I N TO A G R E E N F U T U R EPA RT 1 : K E E P I N G O N TA R I O ’ S G R E E N P RO M I S E S
Thus, the OPA’s plan effectively imposes a “nuclear ceiling” over the
renewable energy industry in Ontario, sending a message to the
market that opportunities for renewable and conservation indus-
tries in Ontario are limited. Already, renewable energy developers
The OPA imposes a have left Ontario to invest elsewhere.21 CHP projects in Ontario
“nuclear ceiling” over
green energy and have been abandoned and significant investment has been lost due
conservation industries to the delay and continuing uncertainty surrounding the Clean En-
in Ontario. ergy Standard Offer Program (CESOP) that the Minister of Energy
asked the OPA to develop in August of 2005.
The Minister of Energy and Infrastructure’s most recent directive
asks the OPA to increase the amount and diversity of renewable
energy sources in the supply mix. The only way to do this is to make
room for significant expansion of renewable energy via the per-
manent retirement of these old reactors and allowing them to be
replaced with green energy.
The amendment also asks the OPA to consider the viability of
accelerating the achievement of stated conservation targets, but
not increasing conservation and energy efficiency to its maximum
potential.
Getting More Green in the Mix
The Independent Electricity System Operator has already noted
that the OPA’s current plan already has a problem of too much
“baseload” production at times of low demand.22 This creates a fur-
ther disincentive for comprehensive conservation because the exist-
ing plan may already require nuclear plants to be turned off at vari-
ous points during the year, which is difficult and risky to do quickly.
The only way to lift the cap on conservation is to make room for
its expansion as a baseload energy source by reducing baseload,
i.e. nuclear sources elsewhere.
So ultimately, the province must choose between green energy
The province must (conservation/ renewables/ CHP) and nuclear. Given the cost over-
choose between green runs, performance problems, refurbishment delays and consequent
energy and nuclear. GHG emission increases, and life extension risks associated with
nuclear power, the greener choice is the better choice.
This report presents a portfolio of clean, reliable quick-to-deploy
energy options that the province of Ontario should aim to have
in place by 2014 in time for both the retirement of these nuclear
reactors and the phase-out of coal and up to 2019 – effectively
filling the gap period between the retirement of old reactors and
the proposed building of new reactors.
11 P L U G G I N G O N TA R I O I N TO A G R E E N F U T U R EPA RT 1 : K E E P I N G O N TA R I O ’ S G R E E N P RO M I S E S
This Renewable Is Doable portfolio shows how green energy
sources can address Ontario’s electricity needs and obligations
to fight climate change where nuclear energy cannot.
We do not want to find ourselves in a situation where the province
Ontario can ensure cannot meet its climate commitments or has to break its promise
enough green power to phase out coal for a third time.23 Clearly, Ontario needs a better
online by 2014 to short-term energy strategy to ensure the following:
guarantee the phase-out
of coal, reduce GHG z Provide the base for long term development of renewable
emissions, and avert power sources
the delays and cost z Decrease dependence on natural gas and coal-based imports;
overruns of refurbishing
z Ensure that Ontario meets its climate commitments.
old reactors.
z Guarantee the phase-out of coal; and,
It’s a smart, sensible
solution. And it’s doable. z Guard against uncertainties;
Choosing to “get more green” into the energy supply mix will foster
serious investment in, and development of, the renewable energy and
energy efficiency industry and help diversify Ontario’s energy mix.
By immediately ramping up clean energy options, Ontario can ensure
enough power online by 2014 to guarantee the phase-out of coal,
reduce reliance on inefficient centralized gas generation and imports,
and avert the delays and cost overruns of refurbishing old reactors.
It’s a smart, sensible solution. And it is doable.
12 P L U G G I N G O N TA R I O I N TO A G R E E N F U T U R EPart
Two 2 The Renewable Is
Doable Portfolio:
Reduce. Renew. Recycle.
Introduction
T
he following scenario shows that it is
possible to replace ageing baseload nuclear
facilities with a diversified mix of low-carbon
and safe energy options.
The benefits of such a portfolio are broad: developing a green
1.1 energy industry, developing green jobs in communities across the
province and diversifying supply.
Introduction Figure 5 illustrates the gap in power production created as Pickering
B and Bruce B (in red and orange) come offline beginning in 2013
and presents how clean options fill this gap. The graph shows that
the portfolio provides more than enough generation capacity to
replace effective baseload capacity.
FIGURE
Filling the Gap with
Quick-To-Deploy Green
Energy Options 24
1 P L U G G I N G O N TA R I O I N TO A G R E E N F U T U R EP A RT 2 : T H E R E N E W A B L E I S D O A B L E P O RT F O L I O
The McGuinty government has set relatively ambitious conservation
and green energy capacity targets until 2010 but the OPA’s electric-
ity plan reigns in the development of conservation and renewables
after 2010 to leave space for nuclear projects with long lead times.
Renewable Is Doable, however, builds on the government’s achieve-
ments and ramps up clean energy options.
This portfolio of clean options is in addition to the clean options
currently in the OPA plan, demonstrating that Ontario can go far
above and beyond what the OPA is proposing for conservation,
renewables, combined heat and power and other clean, quick to
deploy sources. In fact, Renewable Is Doable provides an extra small
cushion of green power to provide options to avoid some of the
expensive natural gas generation in OPA’s plan.25
A number of recent expert studies suggest far greater economic
potential for energy efficiency, combined heat and power and
renewable energy can be realized, allowing even more of the
Province’s future power demands to be met from these sources.26
In fact, the Renewable Is Doable portfolio may be considered moder-
ate in comparison to what is actually possible.
For example, the Alliance for Clean Technology (ACT) identified
a potential for 11,400MW of CHP in Ontario.27 The Renewable Is
Doable portfolio, while proposing to increase over that planned by
the OPA, calls for a total 2831MW of installed CHP – less than 25%
TABLE 1
of the identified potential.
The Renewable Is Doable
Portfolio of Additional Table 1 summarizes the total amount of additional clean options that
Green Resources** can be online by 2014 and 2019 according to Renewable Is Doable.
Supply Source Online By 2014 By 2019
TWh Peak MW TWh Peak MW
Reducing Consumption and Demand with
7.2 1367 17.9 3859
Conservation and Energy Efficiency
Recycled Energy and Waste Heat Recovery 1.8 285 3.2 523
Industrial and Plant CHP 5.5* 122 8.3* 828
Building Scale CHP 0.6 120 0.9 243
Wind – Onshore 0.6 -67 3.6 159
Wind – Offshore 2.5 188 2.5 188
Wind with Storage 1.8 195 3.7 390
Solar 0.9 722 1.6 1397
TOTAL 21.0 2932 41.7 7586
* Industrial and Plant CHP includes TWh gained from building additional CHP plants and from
increasing the capacity factor of CHP plants (existing, contracted and planned) from 41% to 67%.
** The complete Renewable is Doable data and spreadsheets can be found at
www.renewableisdoable.com.
14 P L U G G I N G O N TA R I O I N TO A G R E E N F U T U R EP A RT 2 : T H E R E N E W A B L E I S D O A B L E P O RT F O L I O
Renewable Is Doable involves tapping into efficiency, fuel switching
and conservation resources already identified as cost-effective by the
OPA. It also involves using natural gas more efficiently in combined
heat and power plants, rather than in large peaking plants and taking
advantage of high temperature “recycled” heat from industry to
produce power that requires no extra fuel costs or GHG emissions.
The Renewable Is Doable portfolio meets
the following criteria:
COST-EFFECTIVE Economic modelling done for the Ontario Energy Board hearing
s
on the IPSP found that a green portfolio would be up to 24% less
expensive than the nuclear-dominated IPSP. 28
QUICK TO DEPLOY More than 20 TWh/yr of additional demand reduction and supply
s
can be online by 2014 to fill the gap, ramping up to at least 41 TWh
by 2019.
CLEAN The portfolio reduces GHG emissions and other pollution, as well
s
as environmental and health costs associated with fuel acquisition
from traditional sources.
MARKET READY Developers and other stakeholders are interested and ready to
s
produce and market supply.
15 P L U G G I N G O N TA R I O I N TO A G R E E N F U T U R EP A RT 2 : T H E R E N E W A B L E I S D O A B L E P O RT F O L I O
Start first with all cost REDUCE
s
effective conservation Even before investing in new green energy supplies, it is essential
to reduce baseload that energy is used wisely and efficiently. Energy efficiency, con-
servation, fuel switching and demand response not only reduce
peak demand but can also permanently reduce baseload demand,
essentially generating “new supply.”
Energy efficiency means using more efficient products like Energy
Star refrigerators and fluorescent lamps so that it takes less energy
to do the same job. Conservation means being more careful with
energy e.g., making sure lights are off when not needed or making
sure energy-using equipment is well maintained.
Fuel switching is using an alternative fuel such as natural gas or
solar energy to meet our heating needs instead of electricity. Utili-
ties and governments can use a combination of incentives, regula-
tions and other measures to help customers make the right choice.
Demand response is the use of pricing, incentives and other
measures to encourage customers to switch power-using activities
to off peak times. Smart meters are used to provide the necessary
information to customers, or customers agree to have the power
load limited at peak times.
Conservation and
Demand Management
2014 2019
Efficiency/Conservation TWh/yr Peak MW TWh/yr Peak MW
Renewable Is Doable Portfolio 14.0 2613 26.2 5314
OPA 8.8 1675 12.3 2424
Additional 5.2 938 13.9 2890
Fuel Switching TWh/yr Peak MW TWh/yr Peak MW
Renewable Is Doable Portfolio 6.2 206 9.2 397
OPA 4.2 139 5.2 194
Additional 2.0 67 4.0 203
Demand Response TWh/yr Peak MW TWh/yr Peak MW
Renewable Is Doable Portfolio 0.1 1090 0.2 1640
OPA 0.1 728 0.2 874
Additional 0.0 362 0.0 766
TOTAL 7.2 1367 17.9 3859
TABLE 2
Conservation and Demand Management (CDM) for 2014 and 2019
16 P L U G G I N G O N TA R I O I N TO A G R E E N F U T U R EP A R T 2 : T H E R E N E W A B L E I S D O A B L E P O RT F O L I O
Renewable Is Doable proposes to mobilize 75% more energy efficien-
cy, conservation, fuel switching and demand response by 2019 than
the OPA’s current plan. This is well within the cost-effective range
estimated by consultants.
First, OPA’s own studies shows the achievable and cost-effective
potential for 10,000 MW of savings in 2020 via CDM (including on
site generation29), yet only 6300MW (by 2027) has been accounted
for in the IPSP – as that was the minimum required to meet the gov-
ernment’s directive.30 No technical or market reasons are given for
limiting CDM to 6300 MW, and there is strong evidence supporting
the achievability of this full potential,31 so Renewable Is Doable starts
with utilizing that full potential.
In addition, the OPA’s Robustness Study, Case 3A and 3B, shows
that by adding 50% of additional conservation resources up to 3200
MW of new supply could be eliminated.32 The option clearly exists to
maximize attainable demand management resources that are cheap-
er than all other supply options.
Finally, separate analyses of energy efficiency and fuel switching
potential by ICF (2006)33, Marbek (2006)34, MKJA (2006)35 36 and The
Pembina Institute (2004)37 show that with the right policies and an
objective to achieve as much cost-effective CDM as possible, even
PHOTO: ALEXIS BIRKILL ON FLICKR
higher potential savings could be achieved. The savings can also be
achieved much faster than the OPA is proposing and would address
both baseload and peak demand reductions.
Renewable Is Doable’sproposal to achieve 17.9 TWh/yr of additional
CDM by 2019 through energy efficiency, fuel switching and demand
response has received additional confirmation from a new report
from the Vermont Energy Investment Corporation (VEIC) that this is
38
definitely doable. VEIC has analyzed the broader market and sector
growth potential for CDM in Ontario and concludes that we can go
much further than the OPA’s 6300 MW cap.
The VEIC report studies CDM potential and success in other juris-
dictions and concludes that Ontario is in an excellent position to
achieve comparable (if not better) results.39 Ontario has an estab-
lished conservation bureau, a RESOP program and a favourable
market and investment climate. Their study concludes that with a
relatively unaggressive approach, Ontario can achieve an additional
22 TWh of CDM (including small-scale on-site generation) savings
by 2019 over what is currently planned by the OPA. This is approxi-
mately twice the CDM than the OPA has planned and 23% more
than the OPA identified as potential.
1 P L U G G I N G O N TA R I O I N TO A G R E E N F U T U R EP A RT 2 : T H E R E N E W A B L E I S D O A B L E P O RT F O L I O
By including the Renewable Is Doable recommended additional on-
site generation of 0.9 TWh from micro-turbines by 2019 (see Sec-
tion 3.2.3) to the proposed additional 17.9 TWh for efficiency, fuel
switching and demand response, Renewable Is Doable’s comparable
CDM portfolio provides 18.8 TWh of additional demand side savings
– very close to the VEIC medium estimate on the conservative side.
CDM Is s
The OPA’s plan estimates that spending $7 billion on conserva-
tion programs over the next 20 years will eliminate a cost of $15.9
Cost-Effective billion to build and run generators and transmission capacity that
otherwise would have been used – a savings of $2.27 for every dol-
lar spent on conservation.40 Conservation savings are achieved at an
average cost of less than 3 cents/kWh.41 Increasing the contribution
of conservation programs up to their cost-effective limits would
therefore not only reduce demand but also save Ontarians billions
of dollars.
The cost-effectiveness of demand-side resources improves with
any increase in supply-side costs such as nuclear and natural gas.
Recent evidence points to much higher construction and fuel
costs for nuclear power 42 leading to costs for new nuclear of
14.2 cents/kWh, compared to 11.7 cents/kWh for combined
cycle gas turbines and 10.1 and 10.5 cents/kWh for onshore and
offshore wind (respectively).43 The potential for cost savings via
efficiency, fuel switching and demand management are therefore
even greater by comparison.
Many jurisdictions set their targets to achieve all cost-effective
demand side resources through market transformation – taking
steps to make sure that all inefficient equipment and practices are
replaced.44 To achieve this market transformation, the Government
of Ontario should direct the OPA to achieve greater savings.
In Vermont, similar actions led to enough electricity savings
sufficient to turn load growth negative.45
Moreover, energy efficiency and conservation will significantly
improve the province’s economic competitiveness as well as create
many jobs across the province. In 2006, the United States energy
efficiency industry had nearly $1 trillion in revenues and provided
3.5 million direct jobs and another 8 million indirect jobs.46 A recent
study by the American Council for an Energy-Efficient Economy
(ACEEE) reports that by adopting energy efficient strategies, Florida
will save $28 billion, offset the state’s entire future growth in electric
demand by 2023 and create more than 14,000 jobs in 2023.47
CDM Is Quick Energy efficiency improvements do not require the building of new
s
electricity generation sources, transmission lines and natural gas
to Deploy facilities. They can be deployed in all parts of the province by a wide
variety of professions and trades, creating employment in all regions
(see below).
18 P L U G G I N G O N TA R I O I N TO A G R E E N F U T U R EP A RT 2 : T H E R E N E W A B L E I S D O A B L E P O RT F O L I O
The only limit to the deployment of efficiency and fuel-switching
measures is the stock turnover rate (how often something needs
to be changed). The life of most equipment is less than 20 years and,
on average, homes and commercial buildings are renovated every
10 years. Even after that, new technologies, processes and codes
and standards will continue to deliver additional energy savings not
conceived of today. California has been implementing conservation
programs since 1975 and continues to still lead the way.48
Conservation Energy efficiency improvements are the lowest cost option to
s
reduce greenhouse gases (GHG) and meet the province’s climate
Is Clean protection goals.
CDM Is The OPA laid out its plans for CDM (Conservation Demand Man-
s
agement) in IPSP Discussion Paper No. 3 in 2006. The stated objec-
Market Ready tive was to acquire the maximum cost-effective CDM resources
through programs that focused on market transformation, building
CDM capacity and direct resource acquisition. However, as noted
above, the OPA is only pursuing 65% of the CDM potential it has
identified as cost-effective and market ready.
As noted above, many other jurisdictions in North America and
Europe have set significant “stretch” targets for energy efficiency
and are implementing market transformation programs that demon-
strate international confidence in an energy efficiency market that is
both large and ready to be tapped. California has and is still leading
the way.49
Making Energy efficiency, conservation and demand management are the
s
most cost-effective energy supply option. However, a number of fac-
It Happen tors impede the OPA from reducing energy demand and generating
maximum “new supply” via conservation and efficiency.
The Supply Mix Directives to the OPA set quite modest targets for
CDM and encouraged OPA to focus on reducing peak demand. The
current OPA target for CDM is therefore interpreted by the OPA
as a ceiling and precludes the full potential for long-term energy
efficiency and conservation programs that result in significant
permanent reductions in baseload demand. Moreover, the focus
on peak reduction decreases the opportunity to reduce greenhouse
gas emissions, which are produced by hours of use, not peak use;
put another way, they decrease the required peak capacity, but not
the overall power produced. Focusing on one dimension of energy
benefits – peak reduction – misses opportunities to transform
markets and build capacity.50
19 P L U G G I N G O N TA R I O I N TO A G R E E N F U T U R EP A RT 2 : T H E R E N E W A B L E I S D O A B L E P O RT F O L I O
The Supply Mix Directive for CDM needs to be interpreted as a
minimum target, rather than as a cap to maximize the acquisition
of all cost-effective CDM resources. These minimum targets need
to be increased to the achievable and effective long-range potential
identified by current studies.
The Government of Ontario must play a major role in ensuring
that all cost-effective energy efficiency, fuel switching and demand
response opportunities are taken. It must develop a comprehensive
action plan to transform all energy end use markets in Ontario and
build the capacity to deliver this plan through the OPA and a wide
variety of other channels.
While the OPA describes the importance of building capability to
deliver efficiency and having long-term market transformation plans
in place to ensure all cost-effective efficiency is realized, this is not
reflected either in its Plan or the current CDM portfolio. In par-
ticular, the OPA plan ramps up CDM quite aggressively to 2010 and
then shows a steady decline, thereby prohibiting the opportunity for
real and effective market transformation to take place.51
The Renewable Is Doable portfolio and the VEIC study referenced
above propose a sustained level of CDM development and acquisi-
tion, which results in greater, not fewer, savings after 2010. Therefore,
market transformation programs are necessary, along with the hiring
of necessary staff and expertise from other jurisdictions to imple-
ment these programs.
Another factor limiting the use of efficiency resources is the lack
of coordination of conservation efforts in the province among
the various energy forms and players in the market place: govern-
ments of all levels, agencies, utilities, training organizations and
trade associations.
By choice, the OPA and the Chief Energy Conservation Officer
focus on electricity CDM although end-uses employing other fuels
or water systems all consume electricity as well.
A complete list of recommendations for CDM development in
Ontario is presented in Appendix 2.
20 P L U G G I N G O N TA R I O I N TO A G R E E N F U T U R EP A RT 2 : T H E R E N E W A B L E I S D O A B L E P O RT F O L I O
RENEW
Increase renewable energy resources
Wind Power The Renewable Is Doable portfolio proposes accelerating the
s
deployment of wind power so that a total of 8000 MW are in
place by 2019. This is within the bounds of the Ontario Wind
Integration study cited by the OPA, which states:
The results of the regulation analysis show that the incremental regulation
required to maintain the current performance is small.... [W]e believe that the
impact on regulation of 10,000 MW of wind generation by the year 2020 is
modest and can be accommodated with little or no changes to existing operat-
ing practices. (OPA Exhibit D-5-1, Attachment 2, p. 74)
Renewable Energy 2014 2019
Onshore Wind Installed MW TWh Installed MW TWh
Renewable Is Doable Portfolio 3250 8.0 5750 12.9
OPA 3005 7.4 4270 10.5
Additional 245 0.6 1480 3.6
Offshore Wind Installed MW TWh Installed MW TWh
Renewable Is Doable Portfolio 750 2.5 750 2.5
OPA 0 0 0 0
Additional 750 2.5 750 2.5
Wind with Storage Installed MW TWh Installed MW TWh
Renewable Is Doable Portfolio 750 1.8 1500 3.7
OPA 0 0 0 0
Additional 750 1.8 1500 3.7
Solar PV Installed MW TWh Installed MW TWh
Renewable Is Doable Portfolio 900 0.9 1650 1.7
OPA 88 0.1 88 0.1
Additional 812 0.9 1562 1.6
TABLE 3
Renewable Power Sources for 2014 and 2019
21 P L U G G I N G O N TA R I O I N TO A G R E E N F U T U R EP A RT 2 : T H E R E N E W A B L E I S D O A B L E P O RT F O L I O
This wind farm near Sault
Ste. Marie was built on-
time and on-budget, and
now produces enough
power for 40,000 homes.
PHOTO: WWF-CANADA
The portfolio proposes that the installed total of all wind
resources grow by a rate of 500 to 750MW per year from 2011
onwards. This is in line with the OPA’s current installation rate
for wind 52 but continues well beyond OPA’s planned “ceiling”
of 5000 MW. To provide a diversity of wind resources that has
the flexibility to meet varying demand, we propose the following
mix by 2019:
z Onshore Wind Farms: A total of 5750MW of regular
onshore wind is acquired at current annual acquisition rates.
z Offshore Wind Farms: A total of 750MW of offshore wind
is acquired, in-line with current proposals.
z Wind Farms with Storage: An additional 1500MW of
onshore wind are installed with storage to all the energy to
be dispatched as needed.
This amount of wind resource is feasible and prudent and can be
achieved by building on the current Ontario market and emulating
successes in other countries. As of 2007, both Germany and Den-
mark generate close to 15% of their annual electricity from wind.
On a particularly windy day in March 2008, Spain reached a point
where 40% of its power was coming from the wind.53
22 P L U G G I N G O N TA R I O I N TO A G R E E N F U T U R EP A RT 2 : T H E R E N E W A B L E I S D O A B L E P O RT F O L I O
OPA’s own assessments of onshore wind potential within close
proximity to existing transmission corridors is 22,000 MW.54 Recent
studies of offshore wind in the Great Lakes indicate that there is
another 35,000 MW of potential at capacity factor 50% better than
onshore sites.55 There is also considerable interest in Great Lakes
wind in the U.S. States south of the lakes,56 and there are already
plans for an offshore wind farm off of Prince Edward County.57
Currently Ontario has 1650 MW of wind generation in place or
under contract with an additional 5000 MW of capacity in the
Hydro One queue for a connection impact assessment.58 However,
OPA’s Plan only includes the purchase an additional 3000 MW of
new wind over the next 20 years at a relative slow rate with very
few additions beyond 2018. Its very modest plan is based on its
assumption that no more than this level is needed to meet the
government’s Renewable Energy Directive, and any more is not
cost-effective compared to its comparison of the long run levelized
unit cost of wind with its overly optimistic assumptions of the cost
of new natural gas and nuclear energy.59
Adding 2 MW of storage with five to eight hours of capacity to
every 10 MW of wind can turn a wind farm’s variable output into
firm delivered power. Storage technologies will add up to 40% 60
of the cost of wind, but storage can be installed in small increments
providing flexibility and manageable cash flow.
Storage has three benefits:
1. Overcoming the problem of predicting the temporal behaviour
of wind farms allowing day-ahead contracts; 61
2. Improving quality of power fed into the grid; and
3. Sizing grid connections to average rather than peak output.
Other innovations that are making integration easier include
the following:
z New wind power generators that are more “grid friendly” and
produce higher quality power; 62 63
z Improved weather forecasting and prediction of power output
from renewable power sources; and
z Regulatory reform based on the use of new smart grid control
technologies.
23 P L U G G I N G O N TA R I O I N TO A G R E E N F U T U R EP A RT 2 : T H E R E N E W A B L E I S D O A B L E P O RT F O L I O
Solar Power Renewable Is Doable proposes as a minimum adding 150 MW of solar
s
power per year, both roof mounted and green field projects, or an
installed capacity of 1650 MW in 2019.64 CANSIA has presented
evidence in the OEB Hearing on the Integrated Power System Plan
that 3,754 MW to 5,343 MW of solar capacity could be reached in
Ontario by 2019.65
Solar power is poised to be the future for electricity.66 In 2006, glob-
al investment in solar PV was $20 billion with Germany and the U.S.
leading the way. Analysts predict that cost reductions will result from
mass production and innovation and make solar PV cost competitive
with grid electricity in many parts of the world by 2014.67
The OPA’s Plan proposes to acquire only 88 MW of large scale solar
PV and another 100 MW of on-site (roof top) generation by 2027
– far less than the 1000 MW Germany installed in one year (2006)
and less than the 700 MW of solar PV contracts already signed in
Ontario under RESOP.68 Rapid deployment of Solar PV will play a
major role in meeting Ontario’s increasing summer peak.
Private solar collection
site in Toronto.
The Renewable is
Doable plan keeps
solar installation rates
in line with those
achieved through the
RESOP program.
PHOTO: HOLLY PAGNA
ON FLICKR
24 P L U G G I N G O N TA R I O I N TO A G R E E N F U T U R EP A RT 2 : T H E R E N E W A B L E I S D O A B L E P O RT F O L I O
Wind and If more realistic estimates of the cost of natural gas and nuclear
s
power are taken in to account, much more that the 5000 MW of
Solar Can Be onshore wind capacity proposed by OPA would be cost-effective
Cost-Effective – particularly in the future.
And while the cost of offshore wind and wind with storage will be
higher than conventional wind, higher capacity and peak effective-
ness factors will more than compensate.
Solar PV technology costs are expected to show a rapid decline
in cost by 2014. It can play a major role in meeting Ontario’s peak
demand if a strong industry is built in Ontario, and policies are put
in place to build the distribution infrastructure to accommodate
significant solar capacity.
Wind and Solar Are Wind and solar power systems can be deployed in sizes from
s
a few kW to hundreds of MW. In all cases, installation can be
Quick to Deploy achieved in months.
Wind and Wind and solar power systems produce no emissions during
s
operations and have low life-cycle impacts. Siting issues must be
Solar Are Clean dealt with effectively and fairly, but there are many sites where
large wind and solar capacity are acceptable, particularly in smaller
or offshore applications.
Wind and Solar Onshore wind technology is market ready and already into its
s
second or third generation of blade, mechanical systems and grid
Are Market Ready friendly power generation technologies. Offshore wind has been
demonstrated in several key areas and will be fully market ready
very soon. Power storage is now being commercialized and prom-
ises to be fully market ready in a few years. Solar PV technology and
grid interconnection systems are well developed and market ready.
Major cost reductions will come through market expansion and
economies of scale.
Community solar rooftop
installations such as WISE
in Toronto provide a smaller-
scale community based
approach to increasing the
installed solar base.
PHOTO: WWF-CANADA
25 P L U G G I N G O N TA R I O I N TO A G R E E N F U T U R EP A RT 2 : T H E R E N E W A B L E I S D O A B L E P O RT F O L I O
Making It has been shown that Ontario’s potential for renewable energy
s
is much greater than our energy needs and certainly exceeds the
It Happen 10-year portfolio proposed in Renewable Is Doable. The Renewable
Is Doable portfolio is more than feasible and requires no signifi-
cant upgrades to the current transmission system; however, it does
require some policy modification to improve access to the grid for
distributed renewable energy.
To realize the full potential of renewable energy, Ontario’s Renew-
able Energy Standard Offer Program (RESOP) needs to be reformed
to allow for maximum uptake. The RESOP should become the
primary acquisition vehicle for all renewable power in Ontario. This
involves removing all caps and
restrictions from RESOP and
implementing advanced renew-
able tariffs (ARTs) – a pric-
ing system that differentiates
technology, scale, location and
type of generation69 in particu-
lar removing bottlenecks and
improving access to the grid.
Lack of access to the grid for
renewable energy developers
needs to be addressed in order
for the province to meet its
own renewable targets – and
to go beyond these targets and
achieve what is actually doable.
Germany’s EEC (Green Energy
Germany installed 5 times Act) provides a model for legislation that mandates priority access
more solar in 2006 than to the grid for renewable and distributed energy, with an obligation
Ontario plans to install over
to connect and interconnect costs put in the rate base.70
the next 20 years.
PHOTO: MISSISSAUGA
WATER TREATMENT PLANT,
Moreover, the retirement of Bruce B presents and opportunity for
COURTESY REGION OF PEEL the Ontario government to develop and commit to a green energy
plan for replacing the ageing Bruce B nuclear station, which starts
going offline in 2015, by unlocking priority access to nuclear stations
to the transmission corridor. The Bruce region has the best potential
for wind development in southern Ontario; however wind devel-
opment is severely limited in the region since transmission in the
region is already at capacity.71 Studies show that there is tremendous
potential for wind development in the Bruce region (1421MW 72),
and this potential could be realized without the need for new trans-
mission lines. The closure of Bruce B would make space for over
3000MW of transmission available for renewable energy.
Renewable Is Doable offers a suite of green energy options that
26 P L U G G I N G O N TA R I O I N TO A G R E E N F U T U R EYou can also read