GREEN POWER FOR MOBILE - THE GLOBAL TELECOM TOWER ESCO MARKET OVERVIEW OF THE GLOBAL MARKET FOR ENERGY TO TELECOM TOWERS IN OFF-GRID AND BAD-GRID ...
←
→
Page content transcription
If your browser does not render page correctly, please read the page content below
GREEN POWER FOR MOBILE
THE GLOBAL TELECOM TOWER ESCO MARKET
OVERVIEW OF THE GLOBAL MARKET FOR ENERGY TO TELECOM
TOWERS IN OFF-GRID AND BAD-GRID AREAS
December 2014
Table of Contents
Acknowledgements                                            3

List of figures                                             4

List of abbreviations                                       5

Executive summary                                           6
  Introduction                                              10
  Energy demand at telecom towers: What is the challenge?   13
  Major players and business models                         18
  Energy supply landscape and trends                        27
  Barriers and opportunities                                38

Annex                                                       47

Bibliography                                                51

                                                                 2
Acknowledgements
This full report was jointly commissioned by the IFC and the GSMA Green Power for Mobile (GPM) team and prepared under
the supervision of Ferdous Mottakin from GSMA and Hendrik Engelmann Pilger from the IFC. Satish Lunasvath and Ali Imron
from the GPM team provided substantial support and guidance during the study.
The report also benefited from the extensive inputs of more than 30 mobile network operators, tower infrastructure companies
and energy service companies that were interviewed over the course of the study, in March and April 2014.
The findings in the report were prepared by Dalberg Global Development Advisors under the leadership of Gaurav Gupta and
Vishnu Vasudev, and with support from a global team of researchers and writers including Kanishka Bhattacharya, Aurelien
Chu and Ninad Kulkarni.
For further information on this report, please contact Ferdous Mottakin, Program Manager, Green Power for Mobile at GSMA,
at fmottakin@gsma.com.
3List of figures
Figure 1: Total number of off-grid and bad-grid towers.............................................................................................................. 6
Figure 2: Annual industry cost savings due to transition green energy solutions ...................................................................... 7
Figure 3: Estimated share of the TESCO market in key countries in Asia and Africa ............................................................... 9
Figure 4: Global telecoms footprint (infrastructure and devices) ............................................................................................. 11
Figure 5: Key indicators for 10 focus countries ........................................................................................................................ 12
Figure 6: Total number of off-grid and bad-grid towers............................................................................................................ 13
Figure 7: Additional off-grid and bad-grid towers by region ..................................................................................................... 14
Figure 8: Growth in the number of off-grid and bad-grid towers for key countries in Africa and Asia ...................................... 15
Figure 9: Breakdown of energy consumption at a tower site with an outdoor BTS requiring cooling ...................................... 16
Figure 10: Rural under-electrification rates in developing regions ........................................................................................... 17
Figure 11: Growth in mobile coverage vs electrification rates for India - Illustrative ................................................................ 18
Figure 12: Top 15 MNOs in the world and their key focus markets ......................................................................................... 19
Figure 13: International telecom tower companies – TowerCos .............................................................................................. 20
Figure 14: International average revenue per user (ARPU) per month ................................................................................... 20
Figure 15: Estimated share of ownership of telecom towers in Africa and Asia ...................................................................... 21
Figure 16: Business models deployed at telecom tower sites ................................................................................................. 22
Figure 17: Illustration of the TESCO business model .............................................................................................................. 23
Figure 18: Share of a TowerCo's annual operating costs from energy and fuel expenses ..................................................... 24
Figure 19: Comparison of different IESCO contract types ....................................................................................................... 25
Figure 20: Illustration of IESCO business model in which the TowerCo is the primary energy buyer ..................................... 26
Figure 21: Illustration of a pass-through TowerCo business model ......................................................................................... 27
Figure 22: Current market share of different tower energy business models in key African and Asian mobile-phone markets
................................................................................................................................................................................................. 28
Figure 23: Cost of generation at a typical off-grid tower with 24-hours DG ............................................................................. 31
Figure 24: Operating cost of telecom towers by country (off-grid)1 .......................................................................................... 32
Figure 25: Sensitivity of the cost of generation to increasing hours of access to grid electricity ............................................. 32
Figure 26: Retail price of diesel in the world ............................................................................................................................ 33
Figure 27: Indirect costs of diesel ............................................................................................................................................ 34
Figure 28: Characteristics of prominent renewable energy solutions, when combined with diesel ......................................... 35
Figure 29: Comparison of the cost of generation of different solutions according to differential grid access .......................... 36
Figure 30: Global distribution of green and hybrid telecom tower sites ................................................................................... 37
Figure 31: Annual industry cost savings due to transition green energy solutions .................................................................. 37
Figure 32: Overview of major barriers...................................................................................................................................... 39
Figure 33: Differential impact of barriers on TESCOs and IESCOs......................................................................................... 40
4List of abbreviations
ARPU Average revenue per user
Bad-grid Locations that are connected to the grid, but face more than six hours of power cuts per day,
on average
CAGR Compound annual growth rate
CAPEX Capital expenditure
ESCO Energy Service Company
IESCO Independent Energy Service Company
kW/kWh/kWp kilowatt/ kilowatt hour/ kilowatt peak
MNO Mobile network operator
MSP Managed Service Provider
Off-grid Locations that receive zero hours of grid-electricity
OPEX Operational expenditure
PPA Power purchase agreement
REC Renewable Energy Certificates
TESCO Tower Company Energy Service Company
TowerCo Tower Company
5Executive summary
By 2020, estimates indicate that the global telecom industry will deploy approximately 390,000 telecom towers that are off-
grid, and 790,000 that are in bad-grid locations. This is an increase of 22% and 13%, respectively, from today.
Figure 1: Total number of off-grid and bad-grid towers
Towers (2014-2020, estimates)
+16%
1,180,600 Bad-grid towers Off-grid towers
1,021,100
791,000
(67%)
701,000
(69%)
389,600
320,100
(33%)
(31%)
2014 2020
Source: Dalberg Tower Estimation and Green Power Model
If these towers continue to use diesel, as is the case for more than 90% of all off-grid and bad-grid towers today:
Diesel consumption for telecom towers will increase by 13-15% from today’s levels, to over 150 million barrels per year.1
The resulting annual cost of diesel will be over US$ 19 billion in 2020, or US$ 5 per mobile-phone user per year.
About 45 million tons of CO2 per year will be released, which is more than 5 million tons higher than current levels.
Conversion to more efficient, greener alternative tower power solutions, which include diesel generator-advanced battery2 and
renewable energy hybrid systems, could save the industry US$ 13-14 billion annually, even after accounting for capital
expenditure (CAPEX). Adoption of these green technologies at scale also has the potential to generate approximately 40
million tons and US$ 100-500 million annually in carbon savings.3
1
Using current price of diesel, i.e. ~US$1/liter of diesel (globalpterolprices.com)
2
The cost and specifications of Lithium Ion batteries were used in developing estimates for plant-level economics and green savings potential
of the more efficient alternative tower power solutions mentioned above.
3
Carbon prices of US$ 2 per ton of CO2 (observed in some developing countries such as India, China), and US$ 10 per ton of CO2 (observed
in developed carbon markets like most of North America) were used to estimate potential for carbon savings.
6Figure 2: Annual industry cost savings due to transition to green energy solutions
Billion US$ (2020)
15.9
2.1
13.8
Annual OPEX savings Annual cost of CAPEX financing Annual industry savings in 2020
(1) For retrofits, capex refers to additional capex required to convert to green power solutions, while for new sites capex refers to total capex required
(2) We assume that all off-grid towers under business-as-usual would deploy DG solutions at off-grid sites to ensure uptime and low capex
(3) A 10% annual cost of financing is used to develop the cost saving estimates
Source: Interviews with MNOs, TowerCos and ESCOs (March-April 2014); Desk research; Dalberg Tower Estimation and Green Power Model (2014); Dalberg analysis
A crucial driver of the conversion to greener alternatives will be Energy Service Companies (ESCOs) that provide energy to
towers owned by Mobile Network Operators (MNOs) and dedicated Tower Companies (TowerCos).
• Many MNOs across the world, especially in Asia and Africa, are in the process of selling of their tower assets, including
the energy infrastructure, to third-party structures. This trend, brought on by a strong imperative to cut network deployment
and operating costs, is expected to intensify in the next six years.
• In a rapidly evolving tower energy landscape, that requires a high degree of customization across multiple tower sites and
specific technical expertise, MNOs are not best-positioned to drive energy efficiency. Moreover, MNOs have an incentive
to reduce complexity of non-revenue generating operations like power, in order to focus on revenue-generating parts of
their business
• MNOs place a priority on expanding networks and upgrading technology of active equipment.4 With finite funds for CAPEX,
MNOs will always favor investments in active radio equipment over investments in energy solutions.
There are two types of ESCOs in the market today, each facing specific challenges related to the transition of the industry to
greener tower energy solutions:
• TowerCo ESCOs (TESCOs): These are TowerCos that generate and provide electricity to their MNO tenants at telecom
tower sites. TESCOs typically bundle their energy services with other standard functions of dedicated TowerCos (e.g. site
4
Core radio equipment (including equipment) that is responsible for broadcasting mobile phone signals to users. Passive infrastructure, on
the other hand, includes the non-electronic equipment including the tower itself, energy infrastructure, etc.
7security, monitoring of active equipment and upgrade of passive infrastructure), and charge an all-inclusive fixed monthly
fee for all rendered services.
Critically, TESCOs own, operate, and bear all operating costs for the tower’s energy assets. Because energy generation
and provision can constitute up to 60% of all annual operating expenses, TESCOs are incentivized to continuously seek
long-term opportunities for energy efficiency, energy cost reduction, and cost predictability.
Their primary challenge is that historically, contracts between TowerCos and MNOs were structured in a way that provided
TowerCos no commercial or business incentives to prioritize energy cost reductions and energy efficiency, i.e. they had
incentives to be TESCOs.5 While the contracts have now reversed, inertia remains that works against greater adoption
green and renewable energy solutions, even though on paper they promise substantial cost reductions.
• Independent ESCOs (IESCOs): These are dedicated or pure-play energy companies that own and operate energy assets
at power telecom tower sites. IESCOs derive revenues from selling energy to MNOs as well as dedicated TowerCos,6 and
share similar incentives as TESCOs to reduce energy costs by upgrading energy assets.
Financing new energy generation assets, especially through debt financing at viable interest rates is the primary challenge
facing IESCOs today. The small size and low asset base of existing IESCOs and those looking to enter IESCO market,
has proved particularly limiting when banks evaluate funding applications. In addition, banks often have an incomplete
understanding and experience of IESCO business models, and often lack effective frameworks to assess funding needs
and requirements.
As the drive to decrease telecom tower energy costs gathers momentum over time, TESCOs are expected to develop
appropriate contract management structures in their dealings with MNOs, which would offer clear incentives for energy
efficiency, innovation and cost reductions.
This transition is already underway in key markets. For example, in India, TowerCos, which currently comprise about 60% of
the total market of 400k telecom towers, have switched from almost universally deployed ‘pass-through’ models to fixed-fee
contracts with their MNO tenants, all in the past 2-3 years.
5
This is changing rapidly as will be shown in the report. Pass-through models are now changing almost universally to fixed-fee contracts in
which MNOs pay an all-inclusive monthly rental to TowerCos for all tower-related services.
6
These are defined as TowerCos that outsource energy generation to IESCOs in order to focus purely on infrastructure management and
increasing tenancies.
8Figure 3: Estimated share of the TESCO market in key countries in Asia and Africa
Percentage of total tower estate
IESCO Vertically-integrated MNO TESCO Pass through
33,000 400,000 70,000 2,000 35,000 2,500 6,000 25,000 3,500 4,800
1%
24%
37%
48%
64%
83% 82%
100% 100% 100%
76%
62%
36%
17% 18%
Bangladesh India Indonesia Myanmar Pakistan Cameroon Kenya Nigeria Senegal Tanzania
Asia Africa
Source: GSMA Country Assessments (2013); TowerXchange (2013); Dalberg analysis
The role of IESCOs in providing additional impetus for adoption of green energy solutions is unclear and will depend primarily
on two factors:
• Funding opportunities: Their capacity to attract funding in order to win and service large contracts from MNOs and/or
TowerCos, typically for hundreds or thousands of towers at once.
• Value proposition to TowerCos and MNOs: Their ability to remain at the very edge of technological innovation and cost-
effectiveness, so that dedicated TowerCos, in particular, are incentivized to outsource their tower energy assets and
generation responsibilities to IESCOs, since employing a dedicated power company would expectedly be more efficient
than deploying in-house resources.
This market can be accelerated by providing the following major forms of support:
Banking and finance support: Commercially attractive financing mechanisms are a must, given the high CAPEX
requirements. Key needs include low collateral requirements, construction financing and longer repayment timelines of at least
7 years. To bring this into effect, it will be important to develop greater capacity within personnel to assess ESCO business
models for funding.
Entry of large ESCO players: Large players (Cummins Power, Caterpillar, SunEdison, etc.) will bring the ability to scale
aggressively through their enhanced asset bases, existing relationships with commercial lenders and focus on innovation and
product development.
Conducive policy and regulatory environment: Local policymakers and regulatory bodies require training and policy
development assistance on key issues such as the deployment of renewable-energy certificates (RECs) for green energy use
at telecom towers, elimination of diesel subsidies, and tax and tariff rebates in order to incentivize renewable energy use at
telecom towers.
Market intelligence and knowledge sharing: Greater data collection and effective information sharing is another important
intervention that can help accelerate the market. In particular, there is a need to disseminate key financial information that
would assist in making risk and return judgements for those looking to invest in or execute energy provision for off-grid and
bad-grid telecom towers.
91. Introduction
Why are we talking about the energy needs of the telecom industry?
In early 2014, for the first time, the number of mobile phone subscriptions in the world exceeded the global population.7 There
are now over 7 billion active mobile phone connections in the world, and this number continues to grow. Despite achieving this
high-water mark, almost 3.5 billion people in the world still remain without mobile phone handsets (the number of active
connections in the world typically outnumber the number of unique mobile phone users by a ratio of approximately 2). This
highlights a significant growth opportunity for the industry in the next six years.
Research from GSMA indicates that that future mobile subscriber growth will be concentrated in developing countries in Africa
and Asia among populations that are currently ‘unconnected’8 to mobile phone networks. These populations, estimated to grow
to approximately 2 billion by 2020,9 overwhelmingly inhabit rural areas where access to electricity is patchy and unreliable at
best. To illustrate, 30-40% of rural populations in developing countries lack access to grid-based electricity. This includes almost
600 million in Sub-Saharan Africa alone and another 600-625 million in Asia (about 300-350 million of whom are in India).
Therefore, over the next six years, as Mobile Network Operators (MNOs) and Tower Companies (TowerCos) stretch networks
into ever more remote locations to achieve universal coverage, the existing base of off-grid and bad-grid telecom towers is
expected to grow substantially at about 16% annually.10 Ensuring that these towers have continuous and sufficient access to
non-grid electricity is the clear industry priority; to do so in a cost-effective and commercially sustainable manner is the main
challenge.
Why would adoption of green and renewable energy solutions help?
Analysis indicates that energy costs already account for approximately 30% of network operating costs for a large MNO, and
upwards of 60% for a TowerCo. The high costs are due to an overdependence on diesel-generator-based solutions to
supplement or replace grid-based electricity at off-grid and bad-grid tower sites—almost 90% of these sites use diesel-
generators.11 Against a backdrop of rising global oil and energy prices there is a clear commercial imperative for MNOs and
TowerCos to explore and seriously consider alternative solutions that use green and renewable energy, several of which are
already producing electricity at a cheaper cost than diesel-generators.
Additionally, unless the routine practice of using diesel-generators does not change, the forecasted network expansion will be
increasingly carbon intensive. Emissions from the global telecom industry are expected to grow at a compounded annual growth
rate (CAGR) of 4.8%, from 151 million tons (Mt) CO2 in 2002 to reach 349 Mt CO2 in 2020 (see Figure 4). The majority of the
7
The number of mobile phone subscriptions in April 2014 was approximately 7.015 billion, according to the GSMA Intelligence website
(www.gsmaintelligence.com). The number of unique mobile subscribers, which provides a clearer picture of the number of independent
mobile phone users in the world, is much lower, at approximately 3.5 billion.
8
Globally there remains a share of the population without access to a mobile network–the (as of yet) ‘unconnected’ population. In addition,
there will always be a share of the population within an area of coverage who are not mobile subscribers for other reasons. For example,
within the youth, elderly, disabled, incarcerated or unemployed demographics, mobile subscriber penetration is likely to be lower than the
overall average.
9
GSMA (December 2012)
10
Off-grid implies the telecom towers is either completely disconnected from the grid, or receives no electricity from the grid. Towers that
face more than six hours of power outage per day, on average, are classified as bad-grid.
11
GSMA research.
10increase will be due to the expansion of mobile phone networks, and in particular, due to increased use of diesel at telecom
tower sites. Overhauling standard practices and systematically adopting green and renewable energy solutions in all off-grid
and bad-grid towers, has the potential to reduce the industry’s carbon footprint by up to 5 million tons of CO2 annually.12
Figure 4: Global telecoms footprint (infrastructure and devices)
Percentage of global telecom emissions (2002-20)
However, uncertainty exists over the true scale of the benefits that green and renewable energy solutions can offer. In addition,
there are several barriers that currently hinder their uptake. At the same time, there is a growing recognition from the industry
that some mature green and renewable energy technologies, most of which are solar-based, are approaching or have already
approached commercial viability. This has injected renewed momentum to the greening imperative.
What are the study’s objectives?
Given the significant scope and potential for the industry from the adoption of lower-cost, green and renewable energy solutions,
one primary objective of this report is to illustrate the commercial rationale and the environmental imperative for the
mobile phone industry to deploy green and renewable energy solutions at off-grid and bad-grid telecom tower sites.
Many of these alternative energy solutions are already cheaper than diesel-generator-only tower energy solutions, as we show
later in the report.
In addition to demonstrating the green potential in the industry, the report’s other main goal is to critically examine the
landscape of tower energy suppliers, and specifically, provide a perspective on the role and viability of the Energy
Service Company, or outsourced-generation model in initiating and accelerating this transition to green and renewable
energy technologies.
In the following sections, the report will first summarize the energy challenge for the industry by predicting the demand for non-
grid-based electricity from telecom tower sites over the next six years. Then it will provide an overview of the landscape of
12
Dalberg analysis.
11energy providers, including clearly defining and segmenting ESCOs and presenting a high-level discussion of key business
model elements. The report will also summarize trends and issues in the supply of energy to telecom towers, including an
examination of plant-level economics of different energy solutions, and provide forecasts on the potential of green power. In
conclusion, it will examine key barriers and opportunities for the industry transition to green and renewable energy solutions at
telecom tower sites.
What is the scope?
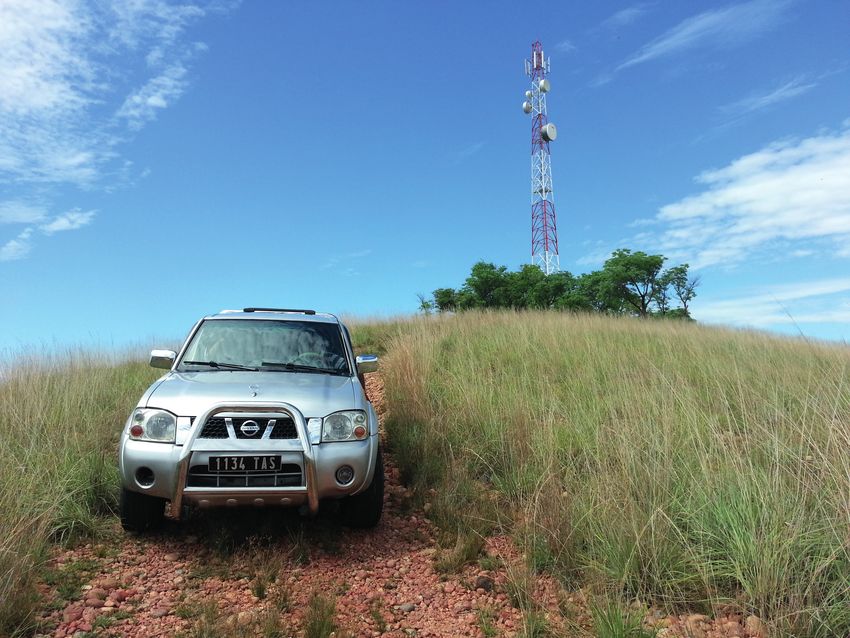
This report is focused on energy consumption of mobile phone towers in off-grid and bad-grid locations. To be able to provide
coverage for a user of a mobile handset, a mobile tower needs to be close enough to the customer to be able to receive and
send signals. In many cases, customers are located in areas that do not have any grid electricity; towers in these locations
need to use supplemental electricity, which historically has come from diesel-powered generators.
Demand estimates: Our market-sizing estimates will focus on assessing telecom towers in rural areas that suffer from no or
poor access to electricity, between now and 2020 (i.e. over the next four to six years). The overarching assumption we hold
to be true is that any additional towers in urban areas are likely to be grid-connected and will therefore be outside of the
purview of this report. (See annex for the detailed methodology and approach used to develop our estimates.)
Geographic scope: The report will aim to provide a global view of the mobile phone industry, with particular granularity on
the developing world (Africa and Asia), where access to grid-based electricity is most constrained. Many of our insights and
trends are based on interviews and discussions with key industry stakeholders across 10 focus countries that account for
approximately 60-70% of the global rural population without reliable access to electricity.
Figure 5: Key indicators for 10 focus countries13
Country Population Population Coverage Mobile Electrification
density Penetration
(million) (# per km2) (% of population) (% of population) (% of population)
Bangladesh 149 1,174 89% 63% 60%
Cameroon 20 45 68% 60% 54%
India 1,200 411 73% 69% 75%
Indonesia 240 135 65% 113% 73%
Kenya 41 74 95% 70% 19%
Myanmar 48 80 11% 10% 49%
Nigeria 158 180 72% 66% 48%
Pakistan 174 229 36% 68% 69%
Senegal 12.5 69 86% 82% 57%
Tanzania 45 52 76% 55% 15%
13
Represents latest available real data from independent data sources were used as a reference for the Dalberg Tower Estimation and Green
Power Model
121. Energy demand at telecom towers: What is the challenge?
By 2020, estimates indicate that the global telecom industry will deploy approximately 390,000 telecom towers that are
off-grid, and 790,000 that are in bad-grid locations. This is an increase of 22% and 13%, respectively, from today.
Currently there are around 1 million off-grid and bad-grid telecom towers in the world in total. These are expected to increase
by 16-17% to 1.2 million till 2020.14 About 70% of these million towers are in areas that can be classified as bad-grid (less than
18 hours of reliable grid access).
Figure 6: Total number of off-grid and bad-grid towers
Towers (2014-2020, estimates)
+16%
1,180,600 Bad-grid towers Off-grid towers
1,021,100
791,000
(67%)
701,000
(69%)
389,600
320,100
(33%)
(31%)
2014 2020
Source: Dalberg Tower Estimation and Green Power Model
The global split of off-grid to bad-grid towers is not expected to change significantly in the next six years. Overall, an additional
70,000 off-grid and 90,000 bad-grid towers are expected to be deployed between 2014 and 2020. As shown in Figure 7, Africa
and Asia will together account for almost 80% of this projected growth, with the remainder largely coming from Latin American
countries.
14
Dalberg Tower Estimation and Green Power Model
13Figure 7: Additional off-grid and bad-grid towers by region
Number of towers (2014-2020)
At the country level, India alone will be responsible for about 10% of the global in off-grid and bad-grid towers and about 30%
of the increase in Asia, with an estimated 16,500 deployments (in addition to its existing base of over 230,000 off-grid and bad-
grid towers) till 2020. Indonesia, Pakistan and Myanmar are other countries in Asia that are expected to add a substantial
number of off-grid and bad-grid towers in the same time period, approximately 10,000, 8,000 and 4,000 towers, respectively.
In Africa, it’s most populous country, Nigeria, tops the list, with an estimated 8,000 additional deployments in off-grid and bad-
grid regions, independently accounting for about 12% of the continent’s total growth. Tanzania and Kenya, will be the other
large growth markets in Africa. Countries such as Mozambique, Botswana, South Africa, Namibia and Angola are also likely to
see significant tower deployment by 2020. On-going conflicts and severe infrastructural challenges will limit the expansion of
coverage in some countries, such as Sudan and the Democratic Republic of Congo, although both countries have a large
population not covered by a mobile network.
14Figure 8: Growth in the number of off-grid and bad-grid towers for key countries in Africa and Asia
Number of towers (2014-20)
The major driver of the estimated growth in off-grid and bad-grid towers is the expected expansion of mobile networks
into rural regions in Africa and Asia, large parts of which face limited access to reliable electricity.
Rural network expansion
In most countries in Asia and Africa, network growth and hence tower growth, will be restricted to semi-urban and rural areas.
Based on interviews with sector stakeholders, almost all the 10 focus countries15 in the study have between 95-100% population
coverage in urban regions. With these urban markets almost completely saturated, MNOs have been compelled to expand into
semi-urban and rural areas to add new customers.
Rural connectivity to mobile-phone networks, on the other hand, has significant scope for improvement. In sub-Saharan Africa,
estimates indicate that around 30% of the rural population is not covered by any mobile network.16 In India, rural penetration is
estimated to be between 30-40% only,17 implying about 200 million people without mobile phone access in one country alone.
The impetus to improve rural coverage over the next six years will be driven by rising rural incomes and increased rural demand
for mobile phone services, especially as income-enhancement applications of mobile services continue to proliferate. In addition,
in most developing countries, MNOs are required to fulfil universal coverage obligations meant specifically to ensure mobile-
phone access even in those rural regions that have a limited commercial incentive. For example, in India, MNOs are mandated
by the government to provide up to 90% coverage in metros and 50% coverage in the rest of the country. Failure to do so can
result in termination of the MNO’s spectrum license.
15
Focus countries – Bangladesh, Cameroon, Ethiopia, India, Indonesia, Kenya, Myanmar, Nigeria, Pakistan, Senegal and Tanzania
16
Dalberg analysis
17
India Mobile Landscape 2013 – Telecomwatch
15It should be noted that some coverage growth and intensification is expected to occur in urban areas. First, the penetration of
new data services—i.e. 3G and 4G services—has increased network traffic, and second, with increasing levels of urbanization
in key developing markets will necessitate network upgrades. However, the demand for higher-intensity, higher-quality coverage
in urban areas is expected to be met through tower-sharing and technological improvements in Base Transceiver Stations
(BTSs),18 rather than by deploying new tower sites.19 Space and cost constraints as well as new safety regulations around
proximity of towers to residential areas are two important reasons why MNOs and TowerCos will seek to invest in tower-sharing
rather than new tower deployments, as explained in interviews.
Poor electrification levels
Telecom towers require 24/7 access to electricity in order for the installed ‘active’ (i.e. electronic) equipment to function and for
mobile phone users to be able to use their phones.20 Active components, comprising BTSs (the primary radio equipment), an
air conditioner (if required) and antennas and lighting, are the largest energy consumers at a tower site. As shown in Figure 9,
within an individual mobile phone tower, the BTS can account for approximately 50-80% of total energy consumption. On
average, interviews indicate that telecom tower with one BTS installed would require between 0.8-1.5 kWh of electricity per day.
That daily consumption rises to 2.5 to 6 kWh per day for sites with up to 3 tenants (i.e. 3 installed BTSs).
Figure 9: Breakdown of energy consumption at a tower site with an outdoor BTS requiring cooling
Share of total tower energy consumption
(5%-15%) 100
100
(10%-25%) 10%
90
(5%-10%) 18%
80 (50%-80%)
70 65% 8%
60
50
40
30
20
10
0
Radio Frequency Power supply Cooling equipment Signal processors Total
Equipment
Support system1
(1) From the power consumption point of view, the elements of a base station can be divided into two groups: radio frequency equipment (that includes power amplifiers transceivers), and
support system, which includes AC/DC power conversion modules, air conditioning elements, and analog and digital signal processors.
Source: Conte, Alberto, “Power consumption of base stations”, Alcatel-Lucent Labs France (2012); Dalberg analysis
Historically, populations in developing countries, in particular within rural regions, have suffered from poor access to
electricity. As can be surmised from Figure 10, large parts of rural areas in the developing world do not have quality access to
electricity.
18
BTSs are the primary radio equipment at a tower site that is responsible for generating the majority of the demand for electricity.
19
Interviews with Tower Industry stakeholders (March-April 2014)
20
The core radio equipment that is responsible for broadcasting mobile phone signals to users. Passive infrastructure, on the other hand,
includes the non-electronic equipment including the tower itself, energy infrastructure, etc.
16Figure 10: Rural under-electrification rates in developing regions
% of rural population that has no access to electricity (2011)
80%
30%
20%
Sub-Saharan Africa Developing Asia LatAm
Population without 550-600 million 600-650 million 15-20 million
electricity access
Source: IEA, World Energy Outlook (2011); Dalberg analysis
Telecom towers in these areas with unreliable electric grids face the constant threat of downtime i.e. when BTSs go offline due
to lack of electricity access. The cost of downtime is prohibitively high for MNOs. Towers in these areas require additional or
backup power to make up for the lack of grid-based electricity, and to ensure uptime.
While most governments do have plans to expand their national electric grid over the next six years, the rate of grid expansion
will be outpaced by the projected growth in mobile network coverage, as illustrated in Figure 11. Furthermore, a grid connection
does not automatically guarantee effective and consistent access to the grid. The situation is further exacerbated because most
tower growth will be concentrated in underpenetrated rural and semi-urban regions that are usually severely electricity-deficient.
17Figure 11: Growth
Accessin mobile coverage
to energy vs electrification
will continue to be rates for India
a major issue- Illustrative
for MNOs and TowerCos as
Percentage ofgrowth incovered
population mobile(2012-20)
coverage is expected to outpace grid expansion
Number of off-grid and bad-grid towers
ILLUSTRATIVE EXAMPLE FOR INDIA
Deep dive countries as a % of total region
100
Mobile coverage (%)
90
80
Most of the coverage expansion
70 will happen in rural regions, as
almost all urban areas have close
to 100% coverage already
60
50
40
30
Rural electrification (%)
20
10
0
2012 2013 2014 2015 2016 2017 2018 2019 2020
9
Source: GSMAi database; IEA World Energy Outlook; Dalberg analysis
As a result, operators’ demand for non-grid electricity is expected to grow. By 2020, all off-grid and bad-grid towers
globally are expected to require 7.2 TWh of non-grid electricity and consume almost 150 million barrels of diesel a year.21
21
Assuming 1.5 kW power requirement for a telecom site and 2.3 liters of diesel consumed per hour; 1 barrel = 119 liters
181. Major players and business models
Prior to discussing the telecom tower energy landscape (See Section 4), it is important to introduce the major players and
develop a solid understanding of the business models that prevail in the industry.
Major players
There are two primary decision makers in the global telecom tower energy landscape: Mobile Network Operators
(MNOs) and Tower Companies (TowerCos).
Mobile Network Operators (MNOs)
MNOs are the primary owners of the vast mobile networks and infrastructure that pass on wireless signals to mobile phone
users in a country. The lucrative core business of an MNO—its control over a national mobile network—leads to economies
of scale and easy access to financing. This then allows the MNO to fund the construction and operation of mobile network
infrastructure (including telecom towers), either through direct ownership or through other parties. Until about five years ago,
MNO maintained ownership of all active and passive infrastructures at telecom tower sites as a means of driving market share
and erecting high barriers of entry for new players.
Figure 12: Top 15 MNOs in the world and their key focus markets
Millions of subscribers
China Mobile 775 Asia focus
Asia and Africa focus
Vodafone 420
Other
China Unicom 285
Airtel 275
America Movil 270
Telefonica 255
Axiata 240
Orange 232
VimpelCom 209
China Telecom 185
MTN Group 176
Etilsat 167
Telenor 166
Teliasonera 160
T-Mobile 143
Source: International Telecommunications Union; MNO websites; Dalberg research
Tower Companies (TowerCos)
Tower-sharing is the practice of outsourcing the procurement, installation, management and maintenance of all passive
infrastructures at telecom tower sites to entities known as TowerCos. TowerCos were initially created by MNOs in order to
separate out the capital intensive telecom infrastructure component of their business from the consumer-facing service
orientated business.
19Figure 13: International telecom tower companies – TowerCos
Number of towers in thousands
India USA Africa Indonesia Other
Indus Towers 120
ATC 55
Reliance Infratel 55
Viom Networks 40
Bharti Infratel 35
Crown Castle 31
GTL Infra 30
Corner stone 18
SBA 17
Global Tower Partners 16
IHS Africa 11
Protelindo 10
Tower Bersama 7
Helios Towers 5
Eaton Towers 3
Gruppo Torre Sur 2
SWAP Technologies 1
STP Power 1
Torres Unidas 1
Source: “Hybrid Energy for Telecom Towers”, Saviva Research (2013); TowerXchange estimates (in particular for Africa) - www.towerxchange.com; Individual company websites; Dalberg research
and analysis
MNOs viewed the transition to tower-sharing as an imperative to secure the future sustainability of their business. Most
importantly, TowerCos enabled MNOs to reduce and stabilize the inflating costs of network deployment and growth in light of
sharply falling global average revenues per user (ARPUs) and a resulting margin squeeze.
Figure 14: International average revenue per user (ARPU) per month
US$/month (2008-12)
2008 2010 2012
14 -6%
-10%
12 12 -7% 12
11 11
10
9
8
Africa Asia Latin America
Source: Saviva Research Review (2013); GSMA; Dalberg research
MNOs have traditionally been the main decision-makers in matters related to energy generation at telecom tower
sites, while TowerCos have primarily been reactive forces. In the past five years, however, TowerCos have begun to
occupy a more central role. This has been driven by the growth of tower-sharing model globally, which transfers ownership
of telecom tower assets, including all energy generation equipment to TowerCos. Figure 15 shows the extent of tower-sharing
models in Africa and Asia.
20Figure 15: Estimated share of ownership of telecom towers in Africa and Asia
Directional
TowerCo-owned 15%
25-30%
MNO-owned 85%
70-75%
Africa Asia1
(1) Ownership share in Asia was estimated based on bottom-up information for the following countries: India, China, Indonesia, Pakistan, Bangladesh and Myanmar
Source: GSMA Country Assessments (2013); TowerXchange (2013); Dalberg analysis
Clearly, Asia is more advanced with 25-30% of its current tower estate in key countries already having adopted tower-
sharing business models. This has occurred primarily because large mobile phone markets such as India and Indonesia,
collectively home to almost 470k towers, were early adopters. In India, TowerCos own approximately 60% of all telecom
towers already; while in Indonesia they own about 40% of the approximate 70,000 towers in the country. China remains an
anomaly in Asia, since the three largest MNOs—China Mobile, China Unicom and China Telecom—have thus far retained
independent ownership of towers. However, recent media reports have indicated that a comprehensive shift toward tower-
sharing is imminent in the country. Earlier this year, the three national MNOs have started talks on setting up a joint-venture
indigenous TowerCo, to allow for infrastructure-sharing at telecom tower sites. Accordingly, a further 500,000 towers from
China are likely to transition to the tower-sharing business model by the end of 2014.22 This alone would increase the share
of TowerCo-owned towers in Asia to almost 50%.
Tower-sharing is more nascent in the African continent. Less than 20% of the current tower estate, or about 25,000 towers
are owned and operated by TowerCos. But, change is likely to occur rapidly. According to industry estimates, a further 40,000-
42,000 towers in Africa are likely to transfer from MNO-captive to TowerCo-owned and operated, by the end of 2014,
increasing their share across Africa to almost 40%.
The choices that MNOs and TowerCos make with regard to key issues such as self-generation and management of tower
energy versus outsourcing to dedicated power companies, defining incentive structures and sharing risk between the
contracting entities, etc., have a substantial impact on the structure and nature of the business models that are deployed in
the sector. These are discussed below.
22
“China telecoms operators see plenty to gain in sharing infrastructure”, South China Morning Post (May 2014); Dalberg research
21Tower energy business models
The main prevailing business models in the telecom tower infrastructure industry are defined and differentiated according to
how ownership of energy assets as well as the costs of energy generation are shared between energy buyers and sellers.
Ownership of assets signifies not only incurring substantial upfront capital investment, but also the attendant risks that could
potentially diminish the value of that investment, such as inefficiency, damage and obsolescence. Asset owners have the
power to upgrade or replace energy assets. This responsibility determines ability and incentives to switch to renewable energy
solutions.
Energy operations costs refer collectively to the recurring costs associated with generating electricity at telecom tower sites.
In off-grid and bad-grid tower sites, the primary component of plant-level energy operations costs is expenditure on diesel fuel,
accounting for almost 80% of the total. Other important cost items include maintenance, repairs and replacements, e.g. engine
replacements for the diesel generator, etc.
Figure 16: Business models deployed at telecom tower sites
ESCO business models
Energy Energy Incentive to
Model Energy buyer Energy seller asset ownership operations costs reduce energy costs
1
TowerCo ESCO MNO TowerCo TowerCo TowerCo Medium - High
2
Independent ESCO TowerCo/MNO 3rd Party 3rd Party 3rd Party High
3
Vertically-integrated
MNO MNO MNO MNO Limited
MNO
4
TowerCo pass-
MNO TowerCo TowerCo MNO None
through
Source: Interviews with MNOs, TowerCos and ESCOs (March-April 2013); Dalberg analysis
Figure 16 illustrates four main business models currently deployed in the industry. The first two are termed ESCO business
models and represent the primary focus of this report. In the third overarching model, vertically-integrated MNOs cater to
their own power needs. In the fourth and final model, MNOs outsource energy asset ownership, but TowerCos pass-through
all energy operating costs to partner MNOs.
A more detailed description of the four business models and the resulting incentives is found below.
ESCO business models
In the context of the telecom tower infrastructure industry, the Energy Service Company business model refers to the unique
way in which energy asset ownership and energy operations costs are structured and shared between buyers and sellers of
energy at telecom tower sites, so that the seller has a clear and substantial profit motive to focus on energy efficiency and
22reduce energy costs. Specifically then, ESCOs are entities that own, install, operate, maintain and bear all of the costs of
energy infrastructure at a telecom tower site, providing electricity to an independent buyer (either an MNO or a dedicated
TowerCo23) for a fee. 24
ESCO business models may be further bifurcated into two important categories: TowerCo ESCOs (TESCOs) and
Independent ESCOs (IESCOs).
TESCOs: These are entities that generate and provide electricity to their MNO tenants at telecom tower sites, generally for a
fixed monthly fee. TESCOs typically bundle their energy services with other standard functions of dedicated TowerCos e.g.
site security, monitoring of active equipment, upgrade of passive infrastructure, etc. This effectively means that TESCOs are
able to offer a comprehensive value proposition to MNOs for the complete set of telecom tower related activities and
responsibilities. Contracts between MNOs and TESCOs reflect this value proposition. TESCOs receive all-inclusive fixed
monthly payments from MNOs for their services. All operational risks, in particular the risk of downtime, i.e. the amount of time
per month that the telecom tower is offline, are borne by the TESCO. Most TowerCos globally are required to deliver 99.95%
to 99.99% uptime or Service Level Agreement (SLA) in a month to their MNO tenants. This effectively translates to anywhere
between 4-21 minutes of downtime per month. As can be imagined, this high level of performance is difficult to produce
continuously, especially when telecom towers are in rural regions and suffer an unreliable access to electricity.25
Figure 17: Illustration of the TESCO business model
MNO TESCO
Energy role Mandate Facilitate and execute
Key responsibilities • Lease tower infrastructure/services • Set up and bear all capital costs for
from TowerCo for a monthly rental passive infrastructure including
per a long-term contract energy infrastructure
• Reimburse 100% of the cost of • Pass-through all energy costs to the
generation, including any fluctuations MNO
in prices
• Provide tenancy and energy to MNOs
for a fixed monthly fee
• Bear all downtime risks/penalties
Source: Interviews with MNOs, TowerCos and ESCOs (March-April 2014); Dalberg research
Critical to their function as TESCOs, these entities own, operate, and bear all operating costs for the tower’s energy assets.
Because energy generation and provision can constitute up to 60% of all annual operating expenses, TESCOs are incentivized
23
These are defined as TowerCos that outsource energy generation to IESCOs in order to focus purely on infrastructure management and
increasing tenancies.
24
This definition of an ESCO is inspired from but not entirely identical to the meanings ascribed to the term by other institutions, including
The World Energy Council, the European Commission’s Institute for Energy and Transport, the Lawrence Berkeley National Laboratory, and
NAESCO.
25
Indus Towers website
23to continuously seek long-term opportunities for energy efficiency, energy cost reduction, and cost predictability, even though
provision may not be the core activity of the company.
Figure 18: Share of a TowerCo's annual operating costs from energy and fuel expenses
Million US$ (2012-13)
+6%
450
420
20%
Other 21%
8%
Employee benefits 8%
9%
Rent 9%
Power and fuel 62% 63%
2012 2013
Source: Bharti Infratel Annual Report (2013); Dalberg analysis
Examples of TESCOs
Helios Towers Africa operates in Ghana, Tanzania and the Democratic Republic of Congo and boasts nearly
5,000 towers. Helios Towers leases sites to interested telecoms, remaining in control of tower and energy assets
and operations. The company was founded in 2005 and claims to be both the first and largest independent Tower
Company in the continent to date. Customers include Tigo, Bharti Airtel, Vodafone, MTN, Africell, Kasapa, as well
as various television and radio channels and non-telecom actors. A Nigerian sister company currently owns and
operates upwards of 1,000 towers in the country, for a wide customer list including MTN Nigeria, Airtel, Etisalat,
Globacom, and Visafone.
IHS Africa is an African TowerCo that owns and operates 3,500 towers in a TESCO model and further manages
another 4,750 in a Managed Service Provider (MSP) model in Cote D’Ivoire, Cameroon, Nigeria, Zambia and
Rwanda. Founded in 2001, the company offers three different contracts: Build-to-Suit (TESCO model), Buy-Lease-
Back (TESCO model) and Manage with License to Lease (MSP model).1or right with the text, and make this red
box narrower.
Te
24IESCOs: These are dedicated or pure-play energy companies that own and operate energy assets that power telecom tower
sites. IESCOs derive revenues from selling energy to the buyers—MNOs and dedicated TowerCos—and share similar drivers
and motivators as TESCOs to upgrade assets and reduce energy costs.
There are two potential avenues or channels for IESCOs to gain market share in the telecom tower industry. In the first
channel, MNOs decide to directly outsource energy infrastructure and operations of their towers to IESCOs. IESCOs own and
install the energy assets, and bear all operating costs. MNOs must pay an energy fee to partner IESCOs in lieu of their energy
generation services.
Contracts between MNOs and IESCOs can be of three types: fixed-fee, power-purchase agreements (PPAs) and energy
savings. Pros and cons of each contract type are explored in Figure 19.
Figure 19: Comparison of different IESCO contract types
Contract type Brief description Pros and cons
+ Simple contract; likely to be easily accepted by
Fixed Monthly Fee MNOs and dedicated TowerCos
Agreement • Fee is constant and independent of usage + Non-variable cash flows easy to use to prepare
budgets, source funding etc.
− No penalties for MNOs and TowerCos for excessive
electricity consumption
+ MNOs/TowerCos charged according to their
Power Purchase Agreement consumption of electricity, incentivizing them to also
(PPA) focus on energy efficiency
• Per kWh rate is fixed, and MNO is billed for
− Difficult to estimate/agree on a long-term per kWh
the units of electricity it consumes
rate; risk of cost fluctuations falls in the IESCO
− Unstable cash flows for all parties as consumption
may vary over time
+ Clear value proposition (can only save buyer money)
Energy Savings Agreement − Challenging to identify actual OPEX savings based
(ESA) • MNOs pay based on a portion of verified only on a notional base case
energy cost “savings” that is benchmarked
− If the energy requirement in a site increases,
to a “notional” status quo
recalculation of benefits is needed, which is
complicated
Source: www.gsma.com; Dalberg research and analysis
In the second channel, in Figure 20, dedicated TowerCos buy electricity from IESCOs, allowing them to focus on revenue-
generating efforts such as building out their tower base, and garnering additional tenants for existing towers. As shown in
Figure 20, MNOs outsource all activities and responsibilities related to tower deployment and operations to TowerCos, who
then further outsource all energy generation activities, e.g. the ownership, deployment and operations of all energy assets, to
IESCOs. As far as the IESCO is concerned, the TowerCo is the energy buyer. Contract arrangements between IESCOs and
dedicated TowerCos follow the same pattern as those for IESCOs and MNOs discussed above.
25Figure 20: Illustration of IESCO business model in which the TowerCo is the primary energy buyer
MNO TowerCo IESCO
Energy role Mandate Facilitate Execute
Key responsibilities • Lease tower • Set up and bear all costs • Set up and bear all costs
infrastructure/services for passive infrastructure for energy infrastructure
from TowerCo for a excluding energy
• Bear all energy operations
monthly rental
• Provide tenancy and costs
energy to MNOs, typically
• Provide energy to
for a fixed monthly fee
TowerCos, typically for a
• Outsource energy fixed monthly fee
generation to dedicated • Bear all downtime
power company
risks/penalties
Source: Interviews with MNOs, TowerCos and ESCOs (March-April 2014); Dalberg research
Examples of IESCOs
OMC: Omnigrid Micropower Company (OMC) is a Mumbai-based IESCO with 10 plants powering up to 40 towers in
India. The 3-year-old company, with under 50 employees, sets up power plants which are based on a variety of
renewable energy sources (with a strong bias towards solar). These power plants can power 2-4 telecom towers as
well as rural households. The company diversifies its revenues by providing power to telecom users as well as
supplying a variety of rentable charged lanterns, fans and chargers for use by retail consumers. The company’s main
client is Bharti Infratel.
Applied Solar Technologies (AST): AST is a New Delhi-based IESCO that provides power to 1,000 towers in India.
This 6-year-old company with approximately 100 employees installs, operates and owns solar and solar-diesel
generator hybrid assets for clients including Bharti Infratel, Indus Tower, and Idea. Media reports indicated that the
company has received funding from the IFC and OPIC in order to extend its operations to 10,000 towers by 2015.
26Non-ESCO business models
Vertically-integrated MNOs: This refers to the traditional model of an MNO as a single firm controlling all aspects of network
deployment, operations and growth, including energy generation. This business model flourished during the initial stages of
the global mobile phone revolution, but has diminished in importance due to the advent of tower-sharing models.
Pass-through TowerCos: In this model, MNO’s are tenants to a TowerCo’s infrastructure—i.e. the energy assets are
completely owned by the TowerCo—but are contractually bound to reimburse all energy-related expenditures. An illustration
of this model is provided in Figure 21.
Figure 21: Illustration of a pass-through TowerCo business model
MNO Pass-through TowerCo
Energy role Mandate Facilitate and execute
Key responsibilities • Lease tower infrastructure/services • Set up and bear all capital costs for
from TowerCo for a monthly rental passive infrastructure including
per a long-term contract energy infrastructure
• Reimburse 100% of the cost of • Pass-through all energy costs to the
generation, including any fluctuations MNO
in prices
• Provide tenancy and energy to MNOs
for a fixed monthly fee
• Bear all downtime risks/penalties
Source: Interviews with MNOs, TowerCos and ESCOs (March-April 2014); Dalberg research
This arrangement was common in the first stages of the transition to tower-sharing. At the time, contracts between TowerCos
and MNOs were designed to minimize all energy-generation-related risks for TowerCos and to ensure predictable cash flows
for them. MNOs, who are the primary consumers of energy at telecom tower sites via their BTSs, agreed at the time to
reimburse all energy expenditure of the TowerCo as per consumption, over and above other fixed rental charges.
272. Energy supply landscape and trends
Market share of business models
Vertically-integrated MNOs continue to dominate the energy supply landscape in telecom towers in Asia and Africa.
TESCO models are on the rise.
In about six of the ten countries of focus in this study, vertically-integrated MNOs retain a majority share of the telecom tower
energy landscape. However, the static picture shown in Figure 22 is more a result of obsolete industry priorities and structures,
which tends to underplay key emerging trends.
Most important amongst these trends is the industry transition to TESCO models. In most developing mobile phone markets
this has happened in two stages. In the first stage, MNOs transfer tower assets to TowerCos and adopt pass-through energy
models. In the second stage, pass-through models are dropped in favor of fixed price energy models, or TESCO business
models that incentivize energy cost reductions.
Figure 22: Current market share of different tower energy business models in key African and Asian mobile-phone
markets
% of total towers (2012-13)
IESCO Vertically-integrated MNO TESCO Pass through
33,000 400,000 70,000 2,000 35,000 2,500 6,000 25,000 3,500 4,800
1%
24%
37%
48%
64%
83% 82%
100% 100% 100%
76%
62%
36%
17% 18%
Bangladesh India Indonesia Myanmar Pakistan Cameroon Kenya Nigeria Senegal Tanzania
Asia Africa
Source: GSMA Country Assessments (2013); TowerXchange (2013); Dalberg analysis
In Asia, India is the most advanced TESCO market. Tower-sharing and pass-through models emerged in India about five
years ago, earlier than in most other developing countries. The transition to TESCO models has mainly occurred in the last
two-three years as MNOs increasingly prioritized reduction of energy costs. For example, even in early 2013, less than 10%
of TowerCo-managed towers were under the TESCO model.26 Currently, all towers owned by TowerCos, which is about two-
thirds of the total domestic estate, operate under the TESCO model. Over the next six years, practically all telecom towers in
India are expected to adopt the TESCO business model. Among other focus countries in Asia, Bangladesh and Myanmar are
26
Saviva Research 2013
28You can also read