Financing FOR development - Investment in renewable energy, fossil fuel prices and policy implications for Latin America and the Caribbean - Cepal
←
→
Page content transcription
If your browser does not render page correctly, please read the page content below
ISSN: 1680-8819

S E R I E S

              financing FOR
              development

              Investment in renewable energy, fossil
              fuel prices and policy implications for
              Latin America and the Caribbean

              Stephany Griffith-Jones
              Stephen Spratt
              Rodrigo Andrade
              Edward Griffith-Jones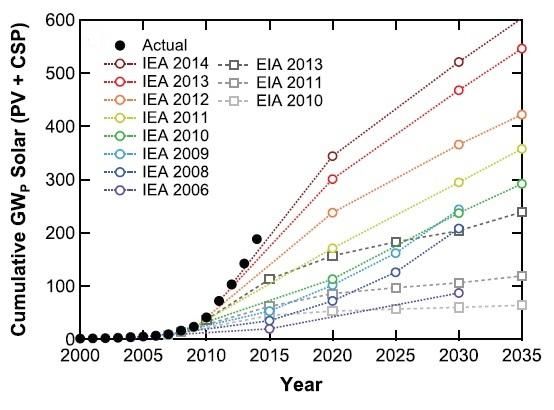
264

Investment in renewable energy, fossil
fuel prices and policy implications for
Latin America and the Caribbean
Stephany Griffith-Jones
Stephen Spratt
Rodrigo Andrade
Edward Griffith-Jones
This document has been prepared by Stephany Griffith-Jones, Stephen Spratt, Rodrigo Andrade, Edward
Griffith-Jones, consultants of the Financing for Development Unit, Economic Development Division, Economic
Commission for Latin America and the Caribbean (ECLAC).
The views expressed in this document, which has been reproduced without formal editing, are those of the
authors and do not necessarily reflect the views of the Organization.

United Nations publication
ISSN: 1680-8819 (electronic version)
ISSN: 1564-4197 (print version)
LC/TS.2017/27
Distribution: Limited
Copyright © United Nations, May 2017. All rights reserved
Printed at United Nations, Santiago
S.17-00188

Applications for authorization to reproduce this work in whole or in part should be sent to the Economic Commission for
Latin America and the Caribbean (ECLAC), Publications and Web Services Division, publicaciones@cepal.org. Member States
and their governmental institutions may reproduce this work without prior authorization, but are requested to mention the source
and to inform ECLAC of such reproduction.
ECLAC – Financing for Development Series N° 264                                        Investment in renewable energy, fossil fuel prices and policy...

Table of contents

Abstract ..................................................................................................................................................... 5
Introduction............................................................................................................................................... 7
I.         Key economic background ............................................................................................................. 11
      A.     Renewable production increase impressive .................................................................................. 11
      B.     Costs of renewable energy ........................................................................................................... 13
      C.     Fluctuating oil prices and their linkages with natural gas ............................................................ 17
      D.     Subsidies for fossil fuels............................................................................................................... 19
      E.     The structure of energy production in Latin America and the Caribbean .................................... 21
      F.     Policies to support renewable energy in Latin America and the Caribbean ................................. 29
           1. Renewable electricity targets ................................................................................................... 29
           2. Renewable energy auctions ...................................................................................................... 29
           3. Feed-in tariffs ........................................................................................................................... 30
           4. Quota obligations ..................................................................................................................... 30
           5. Net metering ............................................................................................................................. 31
           6. Fiscal incentives ....................................................................................................................... 31
           7. Public funds for renewable energy projects ............................................................................. 31

II.          The impact of different levels of future oil prices and evolution of the cost
             of renewables on future private investment in renewables ...................................................... 33

III.          Chile case study .......................................................................................................................... 37
      A.     Latin American renewable energy background ............................................................................ 37
      B.     Chilean case study ........................................................................................................................ 40
           1. Challenges for renewables and policy responses for Chile........................................................ 41

IV. Conclusions and policy recommendations.................................................................................... 43

                                                                               3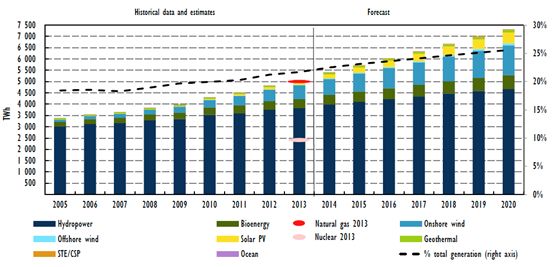
ECLAC – Financing for Development Series N° 264 Investment in renewable energy, fossil fuel prices and policy...
Bibliography ............................................................................................................................................ 45
Annex ..…..………………………………………………………………………………………………49
Financing for Development Series: Issues published ...………………………………………………51
Tables
Table 1 Cost ranges for renewables and fossil fuels in Latin America, as of 2014 .............................. 17
Table 2 Electricity production from different sources ......................................................................... 22
Table 3A Electricity production from oil sources ................................................................................... 23
Table 3B Energy imports, net in 2012 .................................................................................................... 24
Table 4 Electricity production from renewable sources, excluding hydroelectric ............................... 25
Table 5 Renewable energy potential in Latin America and the Caribbean countries .......................... 27
Table 6 Renewable electricity targets in selected Latin America and the Caribbean countries........... 29
Table 7 Fiscal incentives for renewable energy in Latin America and the Caribbean countries ......... 32
Table 8 Top 10 PV projects in Chile.................................................................................................... 41
Table A.1 Electricity production from oil sources ................................................................................... 50
Figures
Figure 1 Greenhouse gas emissions by economic sectors ..................................................................... 11
Figure 2 Global renewable electricity production, historical and projected .......................................... 12
Figure 3 Solar capacity growth compared to projections....................................................................... 13
Figure 4 The levelized cost of electricity from utility-scale renewable technologies,
2010 and 2014 .......................................................................................................................... 14
Figure 5 Weighted average cost of electricity by region for utility scale renewable technologies,
compared with fossil fuel power generation costs, 2013/2014 ...…………………………....15
Figure 6 Energy prices ─ oil and solar .................................................................................................. 18
Figure 7 Brent crude oil and natural gas spot prices .............................................................................. 18
Figure 8 NCRE investment in Latin America and the Caribbean, 2008-2014....................................... 38
Figure 9 Installed capacity and the total share of renewable clean energy generation
in Latin America, 2014 ........................................................................................................... 38
Figure 10 NCRE investments in Latin America, 2006-2014 ................................................................... 39
Diagram
Diagram 1 Matrix on electricity production and oil production for Latin America.................................. 26
Map
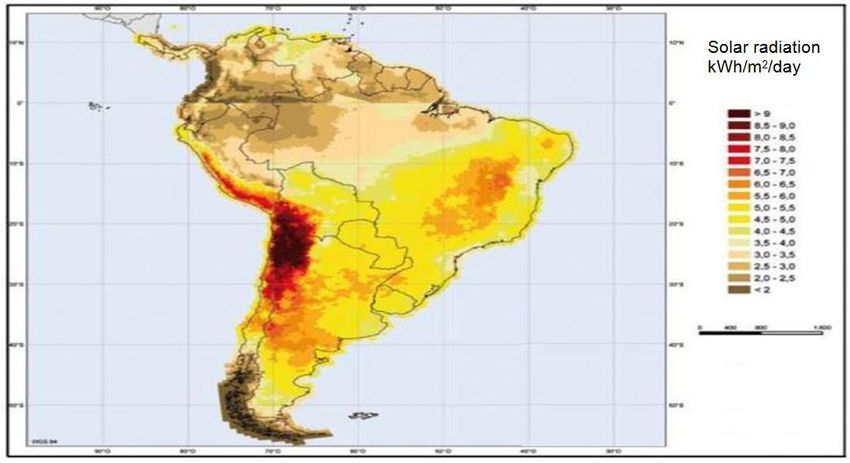
Map 1 Solar radiation in Chile and South America ............................................................................ 40
4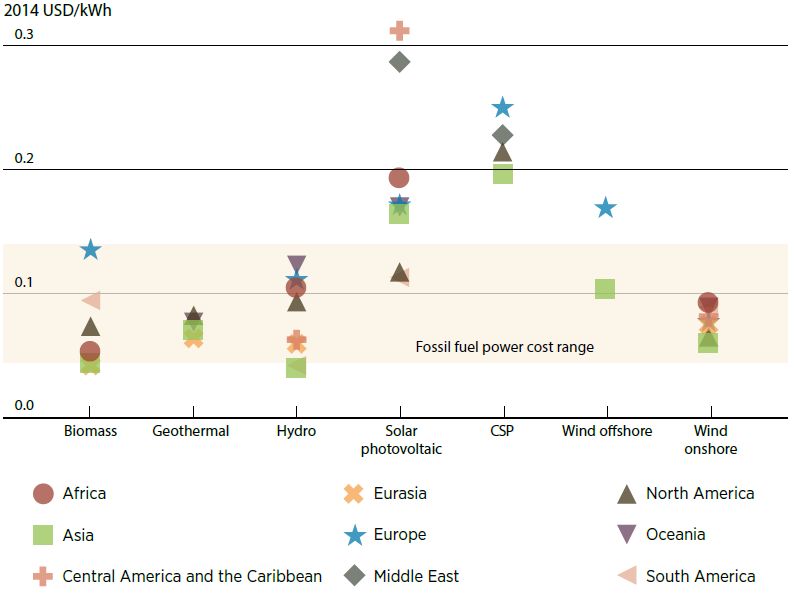
ECLAC – Financing for Development Series N° 264           Investment in renewable energy, fossil fuel prices and policy...

Abstract

This paper examines if recent sharp declines in the price of oil and other fossil fuels will discourage
private investment in renewable energy, which is key for climate change mitigation.

      The increase in private renewables investment in the Latin America and the Caribbean (LAC)
region have been driven by sharp declines in costs alongside supportive policies.

       The sharp fall in the price of oil and other fossil fuels since 2014 risks disrupting continued
private investment in renewables if they becomes insufficiently profitable.

      The decline in oil and other fossil fuel prices presents an opportunity for governments to reduce
subsidies to them. For countries without such large subsidies, governments could increase taxes on them.
This would alleviate their negative effects on climate change. However, it may require carefully
designed fiscal measures to compensate low-income consumers. Where profitability of renewables was
damaged by the fall in cost of fossil fuels, some of the resources could be used both for temporary
subsidies on renewables as well as funding research on reducing their costs.

      Public development banks can play a valuable role supporting technological innovation for
renewables and providing cheaper finance for them.

        Policies of taxes and subsidies on fossil fuel production need to be counter-cyclical and linked to
the level of oil or natural gas price. Thus when the price of the particular fossil fuel fell - which is the
main competitor of renewables in the country - taxes on them could rise, and/or subsidies on them could
be lowered. The resources could be used to subsidize renewables, and/or for research in them, as well as
compensate poor consumers hurt by those measures. When the price of the fossil fuel rises, taxes on
them could be lowered. A very attractive feature of this counter-cyclical mechanism is that it would fund
itself, not requiring additional fiscal expenditure.

                                                     5
ECLAC – Financing for Development Series N° 264 Investment in renewable energy, fossil fuel prices and policy...
Introduction
Mitigating climate change requires a large shift of electricity production from fossil fuels to renewable
energy. This applies for all countries and regions. If the future is powered to a far greater extent by
renewable energy, in part to reduce greenhouse gas (GHG) emissions, it makes sense to transition sooner
rather than having to make costly shifts at a later stage.
The question is how to encourage renewable energy projects at scale, in the context of volatile
fossil fuel prices, particularly when fossil fuel alternatives may become cheaper at current market prices.
Given the scale of the investment required, it is clear that a large proportion of investment in
renewables will need to come from the private sector. However, private investors are often not motivated
by environmental concerns, but by the relative risk-adjusted returns available from different potential
investments. A key factor to assure significant levels of private investment is whether renewable energy
investments are competitive with alternative investments. If not, a key question, which must be asked is
how can this situation be changed?
The international community has increasingly understood that there are huge environmental
negative externalities linked to anthropogenic greenhouse gas emissions, including their impacts on
climate change. Governments have supported private investment in renewable energy to reduce
emissions through a number of measures, such as Feed-in Tariffs, other subsidies and auctions. These
measures implicitly allocate a higher price for carbon (the main greenhouse gas emission) than the
market price to take account of environmental externalities, though fixing a higher carbon price, if
politically feasible, would be a better solution. However, the cost of many renewable technologies has
reduced drastically over the last few years, which has allowed some reduction of subsidies whilst
investment in renewables has continued to expand.
Recent sharp movements in oil and other fossil fuel prices (including gas and coal), and
particularly the sharp fall in the price of oil and other fossil fuel prices since 2014, remind us that very
large price shifts are possible. This raises the issues of commercial returns for renewables and that of
volatile fossil fuel prices. If the profitability of investment in renewables is lowered, and if there is
increasing uncertainty about such profitability in the future, this could discourage investment in
renewables. This seems to require additional and complementary policy tools to the ones mentioned
above to deal with the issue of volatility of fossil fuel prices.
7ECLAC – Financing for Development Series N° 264 Investment in renewable energy, fossil fuel prices and policy...
Some counter-cyclical tools may need to be incorporated into energy policies, linked to the price
of fossil fuels. Thus when the price of oil or other fossil fuels fall significantly, it may be desirable to cut
subsidies and/or raise taxes on such fossil fuels and use those revenues to subsidize renewables - for
example through Feed-in Tariffs or other mechanisms - as well as funding research to lower their cost
and increase their reliability. When the price of fossil fuels, and especially oil, goes up significantly,
taxes on fossil fuels could be reduced, as would subsidies to renewables, as renewables would become
again commercially competitive without or with less support. It would be best to apply such counter-
cyclical measures to fluctuations in prices of the fossil fuel(s) which is/are most important in the
particular country. Rules could be defined ex-ante, to increase predictability, but adjusted to the scale of
fluctuation to prices of oil, or other fossil fuels, as well as to other major changes, such as evolving cost
of renewables. A key positive aspect of such a mechanism is that it would be fully funded in that any
additional costs borne by governments in one sector, for example in renewables, would be financed by
the other sectors, such as oil and other fossil fuels.
To date the impact of large price shifts of oil as well as other fossil fuels, on the commercial
incentives to invest in renewable energy have not been sufficiently explored, nor their possible
implications for policy. This is surprising as the relative price of renewables vis-à-vis fossil fuels is
perhaps one of the most important factors influencing private investors. Only a few analysts have
focused on this important issue; for example, the Global Commission on Economy and Climate (GCEC,
2014) has analyzed the issue and concluded that if lower fossil fuel prices were to persist, this would
drive renewable energy sources further away from “parity” with fossil fuel options, and private investors
may then choose to give renewables a smaller role in their future energy choices. However, some
supporters of renewable energy seem to merely project continued expansion of renewables, without
taking account of the changes in relative prices, as well as the likely need for a policy response to
maintain the right incentives for increased investment in renewables.
As this is a relatively new area of work, this paper first explores how fossil fuels prices could
affect renewable energy investment decisions under a range of price scenarios, given their impact on
the relative risk-adjusted returns of renewables. As country context is all-important in this area, we
particularly apply this question to Latin America and Caribbean countries, where oil and other fossil
fuels represent a significantly higher proportion of the production of electricity. We then expand on this
with the case study of Chile, looking especially at renewable energy powering large copper mines in the
north of Chile.
We look at how different oil and fossil fuel price scenarios (current and expected future prices),
would affect the relative attractiveness of different renewable energy options, and measures by policy-
makers, to encourage investment in renewables. This includes the potential role of development banks
and the mechanisms they could use to fund renewable energy to provide sufficient length of maturity of
loans as well as to reduce costs. We also briefly touch on other policy areas that are important, such as
ensuring sufficient capacity in grids, as well as institutional aspects, such as the role of energy co-
operatives. More broadly we evaluate the possibility of using counter-cyclical mechanisms, for example
via subsidies and/or taxes on fossil fuels and possible subsidies to renewables to vary with the price of
fossil fuels, so as to ensure the profitability of renewables in ways that can be fully funded.
Section I sets the scene for our analysis. It outlines trends in production in renewables as well as
their projections. It then examines the past evolution of costs of different renewables and the likely
future trends of such costs. Next it refers to the scale of fossil fuel subsidies worldwide. We then
examine the structure of energy supplies in different Latin American and Caribbean countries to reflect
their diversity, and categorize those countries according to their main features of supply structure. We
then briefly examine the different Latin American and Caribbean public schemes available for
encouraging investment in renewables.
Section II examines the impact of different future levels of oil and other fossil fuel prices and the
effect that would have on future private investment in renewables. This is examined under three
scenarios: a) current oil and fossil fuel prices or slightly higher, b) lower prices than currently
8ECLAC – Financing for Development Series N° 264 Investment in renewable energy, fossil fuel prices and policy...
experienced and c) a return of significantly higher prices. It does so in a broader context of different
conditions and risks that influence private investment
Section III presents the case study on Chile, with an emphasis on solar energy where Chile has a
clear comparative advantage in the north of the country.
Section IV concludes with a summary, policy recommendations and suggestions for future research.
9ECLAC – Financing for Development Series N° 264 Investment in renewable energy, fossil fuel prices and policy...
I. Key economic background
A. Renewable production increase impressive
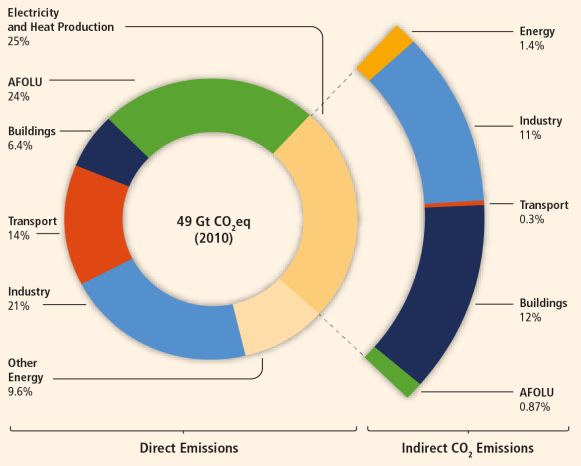
Transitioning energy production is extremely important to mitigate climate change, as according to the
Intergovernmental Panel on Climate Change it accounted for around twenty five percent of global
greenhouse emissions (GHG) in 2010.
Figure 1
a
Greenhouse gas emissions by economic sectors
Source: IPCC 2014: 8
a
Total anthropogenic GHG emissions (GtCO2eq / yr) by economic sectors. Inner circle shows direct GHG emission shares (in
% of total anthropogenic GHG emissions) of five economic sectors in 2010. Pull-out shows how indirect CO2 emission shares
(in % of total anthropogenic GHG emissions) from electricity and heat production are attributed to sectors of final energy
use. ‘Other Energy’ refers to all GHG emission sources in the energy sector as defined in Annex II other than electricity and heat
production [A.II.9.1]. The emissions data from Agriculture, Forestry and Other Land Use (AFOLU) includes land-based CO2
emissions from forest fires, peat fires and peat decay that approximate to net CO2 flux from the Forestry and Other Land Use
(FOLU) sub-sector as described in Chapter 11 of the report. Emissions are converted into CO2-equivalents based on GWP100
6 from the IPCC Second Assessment Report. Sector definitions are provided in Annex II.9.
11ECLAC – Financing for Development Series N° 264 Investment in renewable energy, fossil fuel prices and policy...
To reach targets consistent with a maximum increase of 2 degrees C (Carbon Brief 2014), or even
below that (Shaw 2013), it is urgent to limit the increases in GHG arising from energy. For this reason,
renewable energy needs to be expanded, in part through substituting fossil fuel energy production, as
well as to provide access to electricity to those that still do not have, nor have enough.
As we can see in figure 2 below, worldwide renewable energy production (broadly defined to
include hydroelectric power) has increased significantly in recent years, both in absolute terms and as a
percentage of total energy production, growing to 20 percent of total energy production by 2013. The
key concern expressed in this paper is whether such a rising trend can be maintained if fossil fuel prices
were to remain significantly lower.
Figure 2
Global renewable electricity production, historical and projected
Source: Waldron 2015: 6.
As Schmalensee, R. et al. (2015) show in some detail, expansion of renewables has till the time of
writing often surpassed expectations. The real world expansion of solar energy has been far larger than
the Energy Information Administration’s (EIA) and the International Energy Agency’s (IEA) projections
in their energy outlook reports. As can be seen in figure 3, the growth of solar power –photovoltaic (PV)
and concentrated solar power (CSP)– has consistently outstripped their projections. The 2006 IEA
projection for cumulative solar capacity in 2030 was surpassed in 2012 and the 2011 EIA projection for
2025 was surpassed in 2014.
Latin America has led the way in some aspects of renewables expansion. For example, from 2002
to 2012 electricity generated by wind increased on average by 26 percent worldwide. In South America,
during that same period, it increased 51 percent, and in Central America 42 percent, according to Tabare
Arroyo, a WWF energy specialist based in Mexico (Abiven 2015). In December 2014, the WWF
declared Latin America the leading region in the world on renewable energy, naming five top
performers, with Costa Rica being on its way to becoming "the first Latin American country with 100
percent renewable electricity", as well as Brazil, Chile, Mexico and Uruguay being on the list (Abiven
2015). It should be noted that 100% renewable electricity could be obtained only if hydro-electricity is
included, as renewables such as wind and solar do not currently provide continuous supply at large
enough scale (low cost battery storage and grid upgrades ccould change this picture).
12ECLAC – Financing for Development Series N° 264 Investment in renewable energy, fossil fuel prices and policy...
Figure 3
a
Solar capacity growth compared to projections
Source: Schmalensee, R. et al. 2015: 127.
a
International Energy Agency (IEA) and Energy Information Administration (EIA) projections for cumulative PV and CSP
installed capacity are represented by empty coloured circles and squares; actual historical data for cumulative PV and CSP
installed capacity are represented by filled black circles. Dotted lines are given as guides to the eye. Projections are from the
IEA World Energy Outlook reports over the period from 2006 to 2014 and the EIA Annual Energy Outlook reports over the
period from 2010 to 2013; actual data for cumulative PV capacity are from EPIA4 and IHS, Inc.; actual data for cumulative
CSP capacity are from REN21.
Many project a strong continued investment and the increased production of renewable
electricity, both globally and in Latin America. For example Waldron (2015) projects renewable
electricity to increase globally by 45% from 2013 to 2020. The MIT study by Schmalensee, R. et al.
(op cit.) also projects continued and large expansion of different renewables. Similarly, other
sources (e.g. Flavin et al. 2014) argue that renewables have entered mainstream energy markets and
have become economically competitive, sometimes by wide margins in relation to fossil fuels.
Whilst this was true when the price of oil and natural gas were high, it is far less evident
─particularly in certain countries and contexts─ when the price of oil (and other fossil fuels) is so
much lower. This is especially the case if these prices were to remain so low as time of writing,
unless policy measures are taken to compensate this where appropriate.
B. Costs of renewable energy
A major reason for the increase in investment in renewables in recent years has been the significant
reduction in their costs. As can be seen in Figure 4, according to IRENA (2015), an institution
specialized in detailed and in-depth evaluation of costs of renewables, the cost competiveness of
renewable power generation technologies had significantly improved by 2014, due to significant
reductions of the cost of renewables, compared to fossil fuel power generation. However, it is important
to note that the recent fall in the price of oil and other fossil fuels since 2014, as well as recent reductions
in renewable power generation costs, are not fully reflected in the latest graphs by IRENA.1
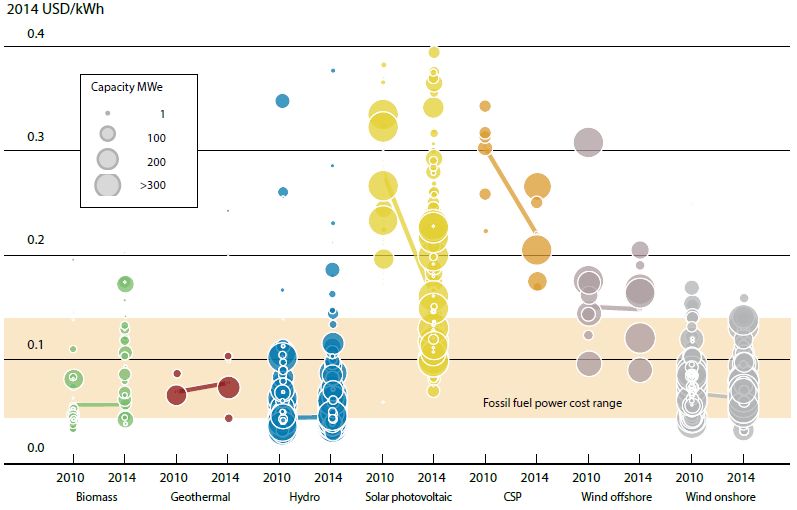
As figure 4 and others below show, the cost-competitiveness of renewable energy generation
technologies had reached historically low levels. Biomass, hydropower, geothermal and onshore wind
can all now provide electricity competitively compared to fossil fuel-fired power generation at previous
levels. Most impressively, as figure 4 shows, the levelised cost of electricity (LCOE) of solar
1
According to interviews with IRENA experts in Bonn with one of the authors.
13ECLAC – Financing for Development Series N° 264 Investment in renewable energy, fossil fuel prices and policy...
photovoltaics (PV) has halved between 2010 and 2014, so that solar PV became increasingly
competitive at the utility scale.
Figure 4
a
The levelized cost of electricity from utility-scale renewable technologies, 2010 and 2014
Source: IRENA 2015: 27.
a
Size of the diameter of the circle represents the size of the project. The centre of each circle is the value for the cost of each project
on the Y axis. Real weighted average cost of capital is 7.5% in OECD countries and China; 10% in the rest of the world.
The levelized cost of electricity (LCOE) of a power generation technology reflects several factors:
resource quality, equipment cost and performance, the balance of project costs, fuel costs (if any),
operation and maintenance costs, the economic lifespan of the project, and the cost of capital.
Most estimates of costs, however, assume the same cost of capital for all renewable facilities
across countries. This can be somewhat misleading as the cost of finance can be much higher in
emerging and developing countries, so that actual LCOE of many types of renewables is often much
higher than the headline figure, as the cost of renewables is far more front-loaded than for fossil fuel
generation. This problem is amplified by the fact that financing can be a larger component of total
project costs for renewables than fossil fuels, so that a higher cost of finance in a developing country
context has a larger negative effect on a renewables than a fossil fuel project (Pueyo et al. 2015).
However, we can see there is a continual decline in the cost of electricity from renewable-based
technologies, due to falling renewable power generation equipment costs, increasingly efficient
technologies as well as other factors.
Installed costs for onshore wind power, solar PV and CSP have continued to fall, while their
performance has simultaneously improved. Particularly impressive has been the decline of solar PV
module prices, which in 2014, according to IRENA (op cit.), were around 75% lower than their levels at
the end of 2009. Other sources also report similar dramatic reductions in the cost of solar PV module
prices (for a review of different sources for estimates of costs, see Pueyo et al., op cit). It should,
however, be borne in mind that the total costs of solar panels may be the minority portion of total costs
of energy produced by them.2 Between 2010 and 2014 the total installed costs of utility-scale PV
systems have fallen by 29% to 65%, depending on the region. The LCOE of utility-scale solar PV has
fallen by half in four years. The most competitive utility scale solar PV projects are now regularly
2
According to interviews, PV panel costs remain approximately half of total construction costs for utility-scale generation – so are not
a small part of overall costs of energy. From a lifetime cost perspective, construction costs typically comprise 90% of capital costs
and annual operating costs generally in the range 1-2% of capital costs. Construction costs therefore dominate lifetime generation
costs after discounting.
14ECLAC – Financing for Development Series N° 264 Investment in renewable energy, fossil fuel prices and policy...
delivering electricity for just USD 0.06 per kilowatt-hour (kWh) without financial support, compared to
a range of USD 0.045 to 0.14 per kWh for fossil fuel power plants. Examples of USD 0.06 per kilowatt-
hour solar tariffs are now seen in Chile, Africa, China, India and the Middle East, as of late 2016.
Even lower costs for utility-scale solar PV, down to USD 0.03/kWh, are possible where excellent
resources and low-cost finance are available.3 However, as pointed out above, a problem in emerging
and developing countries with abundant renewable resources can often be the cost of finance, which is
not fully reflected in these estimates. This increases the disadvantages of renewables vis-à-vis fossil
fuels, as financing costs can be a larger proportion of total project costs with renewables.
Onshore wind can now be one of the most competitive sources of electricity available and its
costs continue to decline, albeit more slowly than for solar PV (see Figures 4 and 5). Technology
improvements alongside installation cost reductions now mean that the LCOE of onshore wind was
within the same cost range, or even lower, than for fossil fuels, especially before recent oil price
reductions. The best wind projects around the world are consistently delivering electricity for USD
0.05/kWh without financial support, as of 2014 (see IRENA, op cit.).
LCOEs of the more mature renewable power generation technologies –biomass, geothermal and
hydropower– have been broadly stable since 2010. However, where under-utilized, these mature
technologies could provide some of the cheapest electricity of any source.
Regional, weighted average costs of electricity from biomass, geothermal, hydropower and
onshore wind were in the range, or even span a lower range, than estimated fossil fuel-fired electricity
generation costs. Because of LCOE reductions, solar PV costs also increasingly fell within that range.
Given current installation costs and the performance of today’s renewable technologies, as well as the
costs of conventional technologies, renewable energy generation is increasingly competing with fossil
fuels, according to IRENA, without financial support (figure 5, below).
Figure 5
Weighted average cost of electricity by region for utility scale renewable technologies, compared with
fossil fuel power generation costs, 2013/2014
Source: IRENA 2015:14.
a
Real weighted average cost of capital of 7.5% in OECD countries and China; 10% in the rest of the world.
3
The reverse auctions for the Al Maktoum phases 2 and 3 plants in Dubai and the Sweihan plant in Abu Dhabi came in around
USD 0.03 per kilowatt-hour (kWh) in 2016. These are well-publicisied but unusual cases because the land and AC electrical system
was provided by the government, there are exceptional solar resources, low-cost capital was provided and because of huge
economies of scale (plants of up to 1,000 MW).
15ECLAC – Financing for Development Series N° 264 Investment in renewable energy, fossil fuel prices and policy...
According to IRENA (op cit.), the weighted average LCOE of utility-scale solar PV in China
and North America (the world’s two largest power-consuming markets overall) and in South
America, had also fallen into the range of fossil fuel-fired electricity costs. For utility-scale solar
PV projects installed in 2013 and 2014, the weighted average LCOE by region ranged from a low of
around USD 0.11 to USD 0.12/kWh in South and North America respectively to over USD
0.31/kWh in Central America and the Caribbean. However for individual projects, the range of
costs is much wider. In various countries with good solar resources, projects are now bein g built
with an LCOE of USD 0.06/kWh without public financial support, while recent tenders in Abu
Dhabi and Dubai, in the United Arab Emirates, resulted in successful bids for a solar PV power
purchase agreement (PPA) for just USD 0.03/kWh. See also table 1, which provides the LCOE for
renewables compared to fossil fuels, focussing just on Latin America.
Where good resources exist and low-cost financing is available, utility-scale solar PV
projects that are now being built (for example in Dubai, Chile and other parts o f the world) were
estimated to provide electricity at a lower cost than fossil fuels, without any financial support,
before the decline of fossil fuel prices.
The story of the reduced cost and growing competiveness of renewables remains very much a
nuanced one, even before the recent fall in fossil fuel prices. This is because renewable energy
generation LCOEs costs have a wide range due to site and country specific factors, such as resource
availability, availability of supporting infrastructure, grid connection costs, cost of finance and labour.
What matters in the end are comparative costs and risk adjusted returns on investments in specific
locations, which vary tremendously.
To summarize, regional, weighted average costs of electricity from biomass, geothermal,
hydropower and onshore wind were in the range, or even a lower range, than estimated fossil fuel-
fired electricity generation costs. Thanks to LCOE reductions, solar PV costs also increasingly fell
within that range. Given the installation costs and the performance of today’s renewable technologies,
and the costs of conventional technologies, renewable power generation was increasingly competing
head-to-head with fossil fuels, without financial support. However, as pointed out above, the key is
the comparative cost and risk adjusted return of renewables and fossil fuels in particular locations.
Furthermore, the fall in the price of fossil fuels, especially if prices continue at their present level or
similar, can alter this trend.
As reflected in figure 5, there are still wide price disparities not just among renewable
energy technologies, but also between different countries and regions. For example, according
to the IRENA research, South America and North America had the lowest costs in Solar PV, and
was competitive with fossil fuel power. Central America and the Caribbean were amongst those
having the lowest costs for wind offshore. The differences reflected amongst regions sometimes
relate to resource availability, but also reflect market conditions, for example for financing,
balance-of-system costs and regulations. Table 1, based on an IADB report, provides the LCOE for
renewables compared to fossil fuels, focussing just on Latin America. Again, these do not fully
reflect the decline in the price of fossil fuels since 2014.
Another key issue is the impact of expanding renewables at the system level. This is particularly
important where the renewable technology in question is ‘intermittent’, meaning that it cannot be turned on or
off at will, but is dependent on whether the wind is blowing or the sun is shining. There are currently4
technical limits to what proportion of a total energy mix can be constituted in this way, which can create
major barriers to capacity expansion, and need to be factored in when comparing headline LCOE estimates.
4
Low cost battery storage and grid upgrades could change this picture. Lithium ion battery systems are seeing a similar cost reduction
profile to PV modules at around 12% compound annual cost reductions.
16ECLAC – Financing for Development Series N° 264 Investment in renewable energy, fossil fuel prices and policy...
Table 1
Cost ranges for renewables and fossil fuels in Latin America, as of 2014
Levelized Cost of Electricity
(LCOE)
Utility-scale 0.04-0.20
Gasification:
0.06-0.24
Anaerobic digestion:
Industrial co-generation or (biogas)
Biomass
self-generation
0.06-0.19
(landfill gas)
0.04-0.07
Off-grid 0.06-0.24
Geothermal Utility-scale 0.05-0.14
Large hydro:
0.02-0.12
Utility-scale Small hydro:
Hydropower
0.03-0.23
Off-grid 0.05-0.40
Distributed (rooftop) 0.16-0.55
Solar PV Utility-scale 0.09-0.40
Off-grid 0.20-0.45
Concentrating solar power (CSP) Utility-scale 0.12-0.38
Marine Utility-scale 0.21-0.28
Utility-scale onshore 0.04-0.16
Wind Utility-scale offshore 0.15-0.23
Off-grid 0.15-0.20
Fossil fuels 0.04-0.13
Source: (IADB, 2014: 10).
C. Fluctuating oil prices and their linkages with natural gas
Figure 6 shows the clear decline of the levelized cost (LCOE) of photovoltaic solar electricity generation
in recent years, which has significantly increased the competitiveness of solar. Further cost reductions
can still be expected in the future, which will further lower the weighted average LCOE (Fraunhofer
ISE, 2015). Many potential future cost reductions will be driven by reduced balance-of-project costs,
lower operation and maintenance as well as finance costs. Indeed, as we will discuss below, one of the
areas of public policy can be to support reduction of the cost of finance, for example by greater use of
public development banks.
Figure 6 also illustrates how much the price of oil has dropped during the latter part of 2014, in
comparison with the cost of solar. Indeed, in 2016 there have been further falls in the price of oil (Brent
$ per barrel), when it has hovered well below $50 per barrel. The fall in the price of oil has also been
accompanied by a decline in the price of natural gas and of coal, which often competes more directly
with renewables. In many Latin American countries, such as Mexico, Bolivia, and Argentina,
natural gas is a significant contributor to electricity production; for the region as a whole, it contributes
around 23% of total energy production. For Chile, coal is a very significant contributor to electricity
production (see table 2, page 22).
The historical price observations for oil and gas set the context. Below, figure 7 shows two graphs
charting the prices of Brent crude oil (a type of oil that provides a benchmark for world oil prices) and
natural gas, respectively, between 2012 and 2015. They show how recently both oil and gas prices have
fallen sharply in approximately the same period.
17ECLAC – Financing for Development Series N° 264 Investment in renewable energy, fossil fuel prices and policy...
Figure 6
a
Energy prices ─ oil and solar
300
250
200
150
100
50
0
Jan 2010
Jan 2011
Jan 2012
Jan 2013
Jan 2014
Jan 2015
Jan 2016
Jul 2010
Jul 2011
Jul 2012
Jul 2013
Jul 2014
Brent Crude Oil Spot Price (current US$/bbl) World Solar PV Electricity Cost (US$/mWh - LCOE)
Sources: Bloomberg; Thomson Reuters Datastream.
a
Levelised cost of thin-film photovoltaic electricity generation.
Figure 7
Brent crude oil and natural gas spot prices
A. Crude oil brent
130
120
110
100
90
80
70
60
50
40
M03
M04
M05
M06
M07
M08
M09
M10
M11
M12
M01
M02
M03
M04
M05
M06
M07
M08
M09
M10
M11
M12
M01
M02
M03
M04
M05
M06
M07
M08
M09
M10
M11
M12
M01
M02
M03
2012 2013 2014 2015
B. Natural gas
6
5
4
3
2
1
M03
M04
M05
M06
M07
M08
M09
M10
M11
M12
M01
M02
M03
M04
M05
M06
M07
M08
M09
M10
M11
M12
M01
M02
M03
M04
M05
M06
M07
M08
M09
M10
M11
M12
M01
M02
M03
2012 2013 2014 2015
Source: Seth 2015.
18ECLAC – Financing for Development Series N° 264 Investment in renewable energy, fossil fuel prices and policy...
Indeed, the above graphs show that from November 2014 to March 2015, Brent crude oil and
natural gas prices both fell dramatically. This seems to indicate a high level of dependency and similar
price movement for the two commodities, at least in the recent period.
However, expanding the study period changes the picture somewhat. Between January 2013 and
July 2014, Brent crude oil prices have remained stable in the range of $100-$115. Natural gas prices
varied much more widely over the same period. Similarly, a clear uptrend is visible in the natural gas
prices from March 2012 to December 2012 (around a 60 percent increase), while crude oil prices have
dipped in the initial period and then remained stable.
From the above observations, there seems to be relatively little correlation between crude oil and
natural gas prices, but a look at other data sources may offer a different view. The U.S. Energy
Information Administration (EIA) provides historical data looking at the correlation between crude oil
other energy products. Looking at this EIA data between Q1 of 2003 to Q3 of 2014, Seth (2015) found
the average correlation between oil and gas prices was 26.53 percent.
However, it is important to note that the extent of this correlation has varied widely, influenced by
factors such as which time period is selected, the extent of volatility in natural gas price changes,
fluctuating global energy markets and policies, location in the world as well as many other factors
(Hartley et al. 2008; Ramberg, D. et al 2010; EIA 2015).
There are good reasons, however, to think that this correlation may increase in the future,
especially as both oil and natural gas are increasingly traded as financial assets. Also, when the price of
oil falls, demand for natural gas is more likely to decline. Furthermore, the price of some contracts for
natural gas are fixed, in terms of the price of oil, making the link more direct.
We have focused in this section, as well as in the previous one, on the relative costs of renewables
and fossil fuel, as well as the varying price of fossil fuel inputs (in the case of renewables the cost of
inputs tend to be zero, for example for solar or wind). However, other factors will also affect the
decision to invest in renewables, as compared to fossil fuels for electricity, beyond the relative
profitability. One of these other factors is risk; this relates for example to technological risk, if the
technology is new. A second type of risk is whether the renewable energy (if it needs transporting to
where it will be used) can be connected or not to the grid. This relates to the existence of enough grid
capacity and the technical issues that need to be overcome for this purpose given, for example, the
variability of the supply of renewables and the willingness of existing grid operators to allow the output
of new renewables to be transported on their grid (interview material).
Therefore, the key variable we have defined for encouraging sufficient investment in renewables
is getting a sufficient risk-related commercial return for them. Whether returns are considered
‘sufficient’ depends on how they compare with alternatives. In the energy sphere, the main ‘competitor’
for renewables is fossil fuels, which is the subject of the next section.
D. Subsidies for fossil fuels
One of the important determinants of fossil fuel versus renewables profitability are the massive subsidies
allocated worldwide to fossil fuels. This is especially important under current conditions as such
subsidies are even less justified with low fossil fuel prices. Indeed the current economic situation is
perfect to reduce such subsidies for fossil fuels, and using some of those freed-up resources to ─ where
necessary ─ increase subsidies for the production and installation of renewables and/or increase the
spending on research to make renewables cheaper and more efficient. Cheaper renewables could in part
compensate poor consumers who may be affected by the lower fossil fuel subsidies, and these
consumers should also be benefiting from some pass-through from lower prices of oil to electricity. In
this sense we broadly agree with the IMF when they stated: “Low international energy prices have
opened a window of opportunity for countries to move towards more efficient pricing of energy” (IMF
2015a). Such cuts in fossil fuel subsidies should be linked to an overall policy framework of enabling
more stable commercial returns for renewables, as proposed in this paper.
19ECLAC – Financing for Development Series N° 264 Investment in renewable energy, fossil fuel prices and policy...
However, it is key to carry out a careful evaluation of the economic and social impact of large
cuts in fossil fuel subsidies, and carefully design mechanisms that compensate in a reliable way and in
advance, those poor consumers, who will suffer from any increase in prices of electricity resulting from
cuts in fossil fuel subsidies; resources should be available from the cuts in subsidies to fossil fuel
production of electricity to fund such compensation.
According to the Global Commission on Economy and Climate Report, total annual subsidies to
fossil fuels in 2014 were estimated to be around US $600 billion (GCEC 2014: 9), of which most are
provided by developing and emerging economies. Based on IEA estimates, around US $540 billion
annually are provided by developing and emerging economies and $55-90 billion annually are provided
by OECD member economies (GCEC 2014: 41).
However, the IMF (2015a) has estimated a far larger amount when it includes the negative
externalities associated with the fossil fuel subsidies. Energy subsidies are projected, according to this IMF
study, at US$5.3 trillion in 2015, or 6.5 percent of global GDP. Most of this arises from countries setting
energy taxes below levels that fully reflect the environmental damage associated with energy consumption.
According to this latter IMF study, worldwide the countries that subsidize the most (as % of GDP
or per capita) are those which are major producers and exporters of oil and natural gas.
As regards Latin America and the Caribbean (LAC), the scale of subsidies is smaller than in other
regions, though still important. Indeed, the IMF (2015b) argues that in LAC high oil prices since the
second half of the 2000s had increased pressures on countries to provide energy subsidies. Their
negative implications for macroeconomic management, fiscal sustainability and the environment
heightened policymakers’ interest in this issue. As pointed out, the current low price environment for
fossil fuels makes it important to cut fossil fuel subsidies now.
A dataset by the IMF (2015b) estimates that LAC subsidies amounted to about 1.8 per cent of
GDP on average in 2011–13, with fuel subsidies representing about 1 per cent of GDP and those for
electricity about 0.8 per cent of GDP. This measurement of subsidies is a lower level than given in other
IMF reports (2015a), as it does not include forgone tax revenues or the cost of negative externalities.
Inclusion of (broad brush) estimates of these costs would, according to IMF (2015a, 2015b) bring the
LAC energy subsidy bill to around 3.8 per cent of GDP.
There is considerable variation in the size and types of energy subsidies across the LAC region.
Fuel subsidies tend to be larger and more entrenched in oil-rich countries, where they are seen as a way
of sharing resource wealth with the public. Given their importance in the production of energy, there will
be more opposition to reducing them; however, the fact they are often an important part of those
countries’ government budgets, it may make it attractive for governments to cut, especially at a time of
declining fiscal revenues linked to oil. In contrast to fuel subsidies, electricity subsidies are more
common in low-income countries and particularly in Central America and in the Caribbean. In these
countries, it may be more desirable to focus more on shifting any subsidies to renewables, when fossil
fuel prices decline.
At a country level in the LAC region, one country ─Trinidad and Tobago─ is amongst the
10 largest subsidizers per capita in the world. The four largest subsidizers per capita in the LAC region,
according to the IMF study (2015a), are Trinidad and Tobago, Venezuela, Ecuador and Argentina.
However, no LAC country is amongst the 10 largest subsidizers in the world, if calculating it by looking
at percentage of GDP. The four largest subsidizers as percentage of GDP used for subsidies in the region
are similar to the above list: Venezuela, Trinidad and Tobago, Bolivia and Argentina. These are
therefore the countries where there is both more space to cut subsidies, but there may be both more
opposition from vested interests, and more need to compensate poor consumers, that may suffer from
such subsidy cuts.
The IMF argues it is generally in countries’ own interest to move ahead unilaterally with energy
subsidy reform, though in practice issues like competitiveness, as well as other issues discussed
above, need to be considered in the case of unilateral reduction. According to the IMF (2015b) top
subsidizers stand to gain the most, as measured in terms of per cent of GDP and in per capita
20ECLAC – Financing for Development Series N° 264 Investment in renewable energy, fossil fuel prices and policy...
subsidies. The IMF (2015b) also claims benefits will mostly accrue at the local level, by reducing
local pollution and generating much needed revenues. However, energy subsidy reform can, perhaps
most importantly, also contribute to greenhouse gas emissions reductions and help countries make
international climate pledges. Of course globally, the largest subsidizers in dollar terms are not from
the LAC region, and those are the ones which need the most urgent reforms.
Along such lines, in October 2015, the IMF (IMF 2015c) urged and stressed that: “Lower oil
prices provide a golden opportunity to reduce inefficient energy subsidies in favour of more productive
and equitable spending. Energy tax reform could help reduce negative externalities caused by energy
consumption, such as pollution and global warming”
E. The structure of energy production in Latin America
and the Caribbean
A major determinant of the impact of fluctuations in oil prices (and other fossil fuels) on the renewables
sector is the existing structure of energy production in different countries. This is linked to economic
factors, for example the existing natural resources, productive capacity and the “lock-in” or path-
dependency of major investments in technologies. It is also due to political economy factors as countries
with large oil (or other fossil fuel) sectors have strong vested interests and lobbies in continuing down a
fossil fuel powered path, and may be more likely to resist a policy framework which encourages
renewables. Furthermore, countries with large oil sectors, both for exports and for local production, face
important “lock-in” or path dependency issues that make it more difficult to change the structure of
production towards renewables as easily and quickly as others. Countries without large fossil fuel
sectors, and which have already embarked on important renewable programs, can often more easily
maintain or expand frameworks favourable to renewables (Lütkenhorst et al.: 2014).
As a consequence, though the need to shift to renewables applies to the whole LAC region, its
effectiveness and the measures that need to be taken - including through counter-cyclical policies on prices to
maintain commercial returns for renewables - have to be adapted to country circumstances and realities
It is also important to stress that the LAC region is a net oil energy exporter (see Table 3B).
Indeed, in 2012, for the LAC region net energy exports (mainly fossil fuels) represented almost 25% of
total energy use. Using this indicator, the largest net exporters of energy were Colombia, Venezuela,
Bolivia, Trinidad and Tobago, Ecuador - and far below - Mexico (see Table 3B).
In 2012 use of oil products represented 11 % of all electricity production for Latin America and
Caribbean (LAC) overall, compared to around 4% for the world, 2% for the European Union, and 1%
for North America (see Annex 1). Therefore, the impact of the price of oil on the production and
installation of renewables in LAC was likely to be much larger than in those regions, if everything else is
equal. As we can see in Table 4A, the overall share of production of oil in the total production of energy
has been decreasing in the LAC region, though with important country variations.
Meanwhile the total electricity production from fossil fuels in the LAC region averaged around
40% in 2012, with natural gas representing around 23% of the total, and coal almost 6% (see Table 2).
Therefore, given the significance of fossil fuels in total production, fluctuations in the price of fossil
fuels can have a considerable impact on incentives for investing in renewables, unless an appropriate
policy framework is adopted which contains counter-cyclical elements, as we discuss above and below
The region has been increasing the share of renewables, in the total production of energy, quite
significantly, albeit from a low base. As can be seen in Table 4, the share of renewables for the LAC region
grew systematically from 2.2% in 1990 to 4.8% in 2012. Furthermore, as can be seen clearly in table 2, the
countries with the highest proportion of renewables (excluding hydro-electric) in total electricity production
are El Salvador, Nicaragua, Costa Rica, Guatemala, Uruguay, Chile, Brazil and Jamaica.
21ECLAC – Financing for Development Series N° 264 Investment in renewable energy, fossil fuel prices and policy...
Table 2
b
Electricity production from different sources
(Percentage of total in 2012)
From
From natural gas From coal renewables, From hydro-
Country Name From oil sources
sources sources excluding electric sources
hydroelectric
Latin America
and the
11.2 23.3 5.6 4.8 49.2
Caribbean
(average)
Argentina 14.9 53.9 2.7 2.0 21.7
Bolivia
(Plurinational 2.0 64.2 0.0 3.1 30.7
State of)
Brazil 3.5 8.5 2.6 7.3 75.2
a
Chile 8.0 16.0 41.9 7.4 26.6
Colombia 0.6 14.4 5.5 3.2 76.3
Costa Rica 8.2 0.0 0.0 20.7 71.1
Cuba 45.6 11.3 0.0 3.1 0.6
Dominican
51.6 24.8 12.9 0.2 10.5
Republic
Ecuador 34.9 10.2 0.0 1.3 53.6
El Salvador 36.0 0.0 0.0 32.6 31.5
Guatemala 20.0 0.0 13.2 19.5 47.4
Haiti 86.1 0.0 0.0 0.0 13.9
Honduras 54.6 0.0 1.7 7.0 36.7
Jamaica 91.2 0.0 0.0 5.3 3.5
a
Mexico 16.0 55.6 10.8 4.4 9.4
Nicaragua 57.2 0.0 0.0 32.4 10.4
Panama 29.0 0.0 8.1 0.3 62.6
Paraguay 0.0 0.0 0.0 0.0 100.0
Peru 3.6 39.2 2.0 1.7 53.5
Trinidad and
0.3 99.7 0.0 0.0 0.0
Tobago
Uruguay 38.2 0.1 0.0 10.6 51.1
Venezuela
(Bolivarian 15.5 19.7 0.0 0.0 64.8
Republic of)
Source: World Development Indicators database. IEA Statistics.
a
Data from 2013.
b
Oil refers to crude oil and petroleum products. Gas refers to natural gas but excludes natural gas liquids. Coal refers to all
coal and brown coal, both primary (including hard coal and lignite-brown coal) and derived fuels. Hydropower refers to
electricity produced by hydroelectric power plants. Electricity production from renewable sources includes geothermal, solar,
tides, wind, biomass, and biofuels.
22ECLAC – Financing for Development Series N° 264 Investment in renewable energy, fossil fuel prices and policy...
Table 3A
a
Electricity production from oil sources
(Percentage)
Country name 1990 2000 2006 2007 2008 2009 2010 2011 2012 2013
Latin America and
the Caribbean 17.1 15.9 11.3 11.8 12.0 11.3 10.6 10.5 11.2 n/a
(average)
Argentina 9.8 3.2 7.5 10.2 11.8 11.7 13.3 15.1 14.9 n/a
Bolivia
(Plurinational 8.6 0.8 1.7 1.8 1.7 1.7 1.9 1.6 2.0 n/a
State of)
Brazil 2.2 4.3 3.0 3.0 3.8 3.1 3.1 2.8 3.5 n/a
Chile 9.6 4.3 4.9 25.3 26.9 20.0 14.0 9.7 8.8 8.0
Colombia 1.0 0.2 0.2 0.3 0.3 0.6 0.8 0.2 0.6 n/a
Costa Rica 2.5 0.9 6.1 8.0 7.1 4.8 6.7 8.8 8.2 n/a
Cuba 87.5 57.1 45.3 40.9 44.1 38.6 39.5 44.5 45.6 n/a
Dominican
88.7 88.1 64.5 61.4 63.1 62.2 57.7 56.5 51.6 n/a
Republic
Ecuador 21.5 28.3 35.9 31.2 29.5 38.5 43.2 35.0 34.9 n/a
El Salvador 6.8 41.9 42.6 43.8 37.5 43.7 35.0 34.0 36.0 n/a
Guatemala 8.4 39.4 31.2 39.5 31.5 42.8 23.0 22.6 20.0 n/a
Haiti 20.6 48.3 52.5 67.1 62.8 71.3 69.8 87.3 86.1 n/a
Honduras 1.7 38.1 63.1 62.4 62.0 55.2 52.2 54.9 54.6 n/a
Jamaica 92.4 95.2 96.1 95.0 93.9 92.6 92.3 91.3 91.2 n/a
Mexico 53.6 46.2 22.1 20.7 18.9 17.5 16.2 16.4 18.9 16.0
Nicaragua 38.6 78.6 69.9 71.0 64.5 69.1 63.0 66.0 57.2 n/a
Panama 14.7 29.6 39.8 43.1 37.9 43.6 43.2 41.1 29.0 n/a
Paraguay 0.0 0.0 0.0 0.0 0.0 0.0 0.0 0.0 0.0 n/a
Peru 21.5 12.3 6.1 3.0 6.0 5.4 5.8 6.0 3.6 n/a
Trinidad and
0.1 0.1 0.2 0.2 0.3 0.3 0.3 0.3 0.3 n/a
Tobago
Uruguay 5.1 6.6 35.1 12.9 39.0 31.0 11.7 27.1 38.2 n/a
Venezuela
(Bolivarian 11.5 9.0 12.6 11.5 12.5 13.0 15.2 14.3 15.5 n/a
Republic of)
Source: World Development Indicators database. IEA Statistics.
a
Sources of electricity refer to the inputs used to generate electricity. Oil refers to crude oil and petroleum products.
23You can also read