Scoping Study on a Cost Benefit Analysis of Bushfire Mitigation - Australian Forest Products Association
←
→
Page content transcription
If your browser does not render page correctly, please read the page content below
Scoping Study on a
Cost Benefit Analysis
of Bushfire Mitigation

Australian Forest Products
Association

May 2014
Scoping Study on a Cost Benefit Analysis of Bushfire Mitigation

Contents
Glossary ..................................................................................................................................... i
Executive Summary................................................................................................................... 1
1        Introduction .................................................................................................................... 5
         1.1       Background....................................................................................................................... 5
         1.2       Purpose of the Scoping Study ............................................................................................ 6
         1.3       Structure of this paper ...................................................................................................... 7
2        Bushfire risks in Australia ................................................................................................ 8
         2.1       The cost of recent bushfires .............................................................................................. 9
         2.2       Total bushfire costs ......................................................................................................... 10
3        The North American experience .................................................................................... 13
         3.1       The 2002 and 2003 wildfire seasons ................................................................................ 13
         3.2       Policy response ............................................................................................................... 15
4        Two approaches to mitigation ....................................................................................... 18
         4.1       Baseline approach ........................................................................................................... 18
         4.2       Alternative policy approach............................................................................................. 19
5        CBA Methodology ......................................................................................................... 20
         5.1       Overview of CBA ............................................................................................................. 20
         5.2       Defining costs ................................................................................................................. 21
         5.3       Estimating baseline costs ................................................................................................ 22
         5.4       Estimating policy costs .................................................................................................... 26
         5.5       Compare costs ................................................................................................................ 29
         5.6       Approach to valuing particular costs................................................................................ 30
6        Potential case study regions .......................................................................................... 34
         6.1       Blue Mountains............................................................................................................... 34
         6.1       The Pilliga ....................................................................................................................... 36
         6.2       North Coast .................................................................................................................... 36
         6.3       Melbourne fringe ............................................................................................................ 37
         6.4       Gippsland........................................................................................................................ 38
         6.5       South-west Western Australia ......................................................................................... 39
         6.1       Other potential case study sites ...................................................................................... 40
7        Applying the methodology ............................................................................................ 42
8        Next steps ..................................................................................................................... 46
References .............................................................................................................................. 47
Appendix A : National forecasting methodology...................................................................... 52
Appendix B : Non Market Valuations ....................................................................................... 53

Liability limited by a scheme approved under Professional Standards Legislation.

Deloitte refers to one or more of Deloitte Touche Tohmatsu Limited, a UK private company limited by guarantee, and its networ k
of member firms, each of which is a legally separate and independent entity.
Please see www.deloitte.com/au/about for a detailed description of the legal structure of Deloitte Touche Tohmatsu Limited an d
its member firms.

© 2014 Deloitte Access Economics Pty Ltd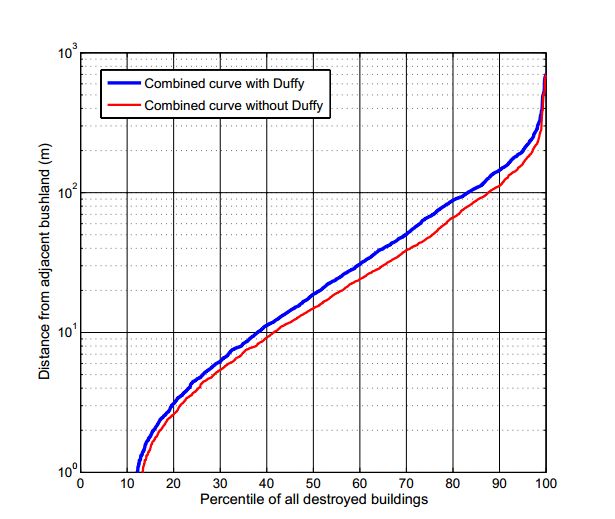
Scoping Study on a Cost Benefit Analysis of Bushfire Mitigation

Limitation of our work ............................................................................................................ 59

Charts
Chart 2.1 : Forecast total economic costs of bushfires ($2011) ................................................ 12
Chart 4.1 : Prescribed burn area by state ................................................................................ 19
Chart 5.1 : Relationship between distance to bushfire and building destruction ...................... 23
Chart 5.2 : Relationship between planned and unplanned fires from Boer et al (2009) ............ 26
Chart 5.3 : Relationship between planned and unplanned fires from Attiwil and Adams (2013)27

Tables
Table 2.1 : Forecast total economic costs of bushfires ($2011, million).................................... 12
Table 5.1 : Economic costs of a natural disaster ...................................................................... 21
Table 5.2 : Relationship between distance and PM10 level...................................................... 32
Table 5.3 : Prevalence of selected health conditions ............................................................... 32
Table 5.4 : Estimated annual health costs from 10ug/m3 of PM10 in Sydney............................. 33
Table 6.1 : Summary of proposed case study areas ................................................................. 34
Table 7.1 : Estimating baseline costs ....................................................................................... 43
Table 7.2 : Total policy cost ..................................................................................................... 44
Table 7.3 : Net Benefits ........................................................................................................... 44
Table 7.4 : Cost benefit ratio ................................................................................................... 44
Table B.1 : Estimates for Social Cost of Carbon ........................................................................ 53
Table B.2 : Annual health costs of air pollution across selected regions, per tonne of PM10
- with 7.5 µg/m3 threshold ($ 2003)........................................................................................ 55
Table B.3 : Annual health costs of air pollution across selected regions, per tonne of PM10
– no threshold ($ 2003) ........................................................................................................... 55
Table B.4 : Annual health costs of air pollution across selected regions, per 10 µg/m 3 increase
in PM10 annual average concentrations – with 7.5 µg/m3 threshold ($m 2003) ...................... 55

Deloitte Access Economics                                                                         Commercial-in-confidence
                                                                                                                                     ii
Scoping Study on a Cost Benefit Analysis of Bushfire Mitigation
Figures
Figure 2.1 : Insured costs of recent major bushfires in Australia ................................................ 9
Figure 5.1 : Overall CBA process .............................................................................................. 20
Figure 5.2 : Using GIS to measure the number of houses within a given distance of bushland . 24
Figure 5.3 : Comparing costs in a CBA...................................................................................... 29
Errata
Deloitte Access Economics would like to acknowledge an error contained in the
final report sent to AFPA dated February 2014. The error is contained in Chapter 7
and is in relation to the calculation of net benefits. This version of the report
acknowledges and updates these figures accordingly.
In Chapter 7 of the previous report (pg. 44), the calculated incremental benefit
was $31,505,166 with a corresponding CBR of 4.9. The correct figures should be
$40,591,770, with the corresponding CBR as 6.0. The revised benefits and costs
figures ($40,591,770-$6,808,443) are now consistent with the reported net
benefit figure of $33,783,328.
The discrepancy is due to the erroneous treatment of the output generated from
mechanical treatment. Previously, this was treated as a cost rather than a benefit
in the calculation of the cost benefit ratio.
Deloitte Access Economics Commercial-in-confidence
iiiScoping Study on a Cost Benefit Analysis of Bushfire Mitigation Glossary ABS Australian Bureau of Statistics ACT Australian Capital Territory AFPA Australian Forest Products Association BTE Bureau of Transport Economics CBA Cost Benefit Analysis CFA Country Fire Authority CFLRP Collaborative Forest Landscape Restoration Programme CRC Cooperative Research Centre CSIRO Commonwealth Scientific and Industrial Research Organisation DAE Deloitte Access Economics DCCEE Department of Climate Change and Energy Efficiency DEPI Department of Environment and Primary Industries DPAW Department of Parks and Wildlife EMA Emergency Management Australia FFDI Forest Fire Danger Index GIS Geospatial Information System HFI Healthy Forests Initiative ICA Insurance Council of Australia IPCC Intergovernmental Panel on Climate Change NSW New South Wales OBPR Office of Best Practice Regulation PM Particulate Matter SA South Australia US United States USA United States of America USD US Dollars USDA United States Department of Agriculture VSL Value of Statistical Life WA Western Australia Deloitte Access Economics Commercial-in-confidence
Scoping Study on a Cost Benefit Analysis of Bushfire Mitigation

Executive Summary
Bushfire and fuel reduction policies

The 2013 NSW bushfires, and more recently the Western Australian and Victorian bushfires
in early 2014, highlighted the potential for widespread burning of significant forest areas.
These fires, which can be of varying scale and intensity, can cause significant economic and
environmental costs, including changes in vegetation structure, soil erosion and loss of local
fauna and flora.

The current policy approach is to focus on suppression activities during the bushfire season
and fuel reduction burning in the cooler months of the year. Fuel reduction burning is
often conducted at relatively low levels and has risks as well as environmental and social
costs associated with it.

In contrast to the Australian situation, policy in both the United States and Canada has
recently shifted towards an increase in fuel reduction activities through the use of both fuel
reduction burning and the mechanical removal of fuel. Importantly, the recent shift in
policy responses, and the associated data and research, provides a basis for understanding
how policies pioneered in North America may be applied in an Australian context.

Despite the ever present risk of bushfire in Australia, there is a paucity of research and data
analysis around the relative costs and benefits of alternative approaches to bushfire
management in Australia.

Purpose of this study

As a result, the aim of this report is to begin the process of establishing a robust set of
information to inform the debate on the most appropriate bushfire management policy in
Australia. The scoping study provides the background for undertaking a full Cost-Benefit
Analysis (CBA) of a policy of greater use of fuel burning in combination with the mechanical
removal of trees and understorey biomass.

The current work is being undertaken in the context of increasing attempts to quantify the
relative costs and benefits of different policy initiatives prior to a natural disaster taking
place. Most notably, in 2013 Deloitte Access Economics undertook research for the
Australian Business Roundtable for Disaster Resilience and Safer Communities that
surveyed the costs and benefits of a range of approaches to building resilience to natural
disasters.

                                                                                             1
Research findings
As part of the scoping study we have undertaken a range of research that would inform a
full CBA. For example, we have:
Identified that the base case would involve continued use of fuel reduction burning at
current activity levels and that the policy case would involve an increase in treatment
up to around 5% of the landscape a year. Treatment would also involve a mix of fuel
reduction burning and mechanical removal.
Outlined the range of costs associated with bushfires and identified sources for valuing
those costs. It does not appear that there are any costs without a reasonable source of
information available. In general the costs related to a bushfire can be categorised as
follows:
Table i: Economic costs of a natural disaster
Direct Indirect
Tangible Damage to buildings Emergency response costs
Damage to infrastructure Household costs
Damage to crops and livestock Commercial costs
Damage to natural resources Loss of production
(e.g. timber)
Intangible Death Psychological
Injury Inconvenience and stress
Personal items and memorabilia
Source: BTE (2001)
• These costs would most likely be modelled using a combination of historical
data, bushfire spread modelling, or custom modelling depending on the
budget and timelines of a full CBA and on the cooperation of other parties
(such as CSIRO or insurers).
• Costs associated with fuel reduction would also be estimated, this would be
based on information gathered from industry, land managers and other
experts or, alternatively, could rely on general per hectare costs reported in
the literature.
Undertaken specific research on some cost items that are particularly important for a
CBA relating to bushfires. These are:
• Death and injury: which can be readily valued using the value of statistical life.
• Carbon emissions: which can be valued using data on emissions from bushfires
and the costs of carbon, although more detailed work is required to
appropriately measure the cost of carbon emissions.
• Particulate matter: which can be valued using data on the value of emissions,
although more detailed work is required to appropriately measure the cost of
particulate emissions.
• Ecological benefits: are generally not valued quantitatively in a CBA although,
in some cases, it may be possible to value the loss of certain ecological areas if
they align with areas that are used as part of BioBanking schemes.
Deloitte Access Economics Commercial-in-confidence
2Potential case study regions
We have also reviewed the data that could be used to support a number of case study
regions. Overall, potential case studies should be judged according to their attributes
against a set of criteria. This will help ensure that the CBA is relevant and informative.
Criteria for selection include:
it is an area where there is a current and ongoing threat from bushfire;
the area is important, for social or economic reasons, that is home to a number of
people, or where there is a significant amount of infrastructure;
there is access to data sources and other literature; and
there is the potential to implement different bushfire management policy options.
We considered a range of areas within Australia against these criteria and came to the
following conclusions on their areas of particular strength. In summary, case studies based
on the Blue Mountains, Melbourne fringe or South-west WA appear to be most
prospective. While other regions may be relevant, such as the North-Coast and South-
Coast of New South Wales and the drier forest areas of Tasmania, further scoping analysis
would be needed.
Table ii: Summary of proposed case study areas
Region Threat High socio-economic impact Data Policy incentive
Blue Mountains
The Pilliga
North Coast
Melbourne Fringe
South-west WA
Gippsland
The final task of the scoping study involved the development of an indicative example for
the Blue Mountains region. It should be noted that this is an indicative example to
demonstrate that, with the available data and research, it is possible to make some
estimates of the relative costs and benefits of different bushfire policy approaches. While
this is not a full CBA it is designed to illustrate the public policy merits of undertaking a
detailed CBA. The indicative analysis provides evidence which suggests there is a sound
case to invest in a full CBA.
Indicative example
The chosen example indicated that current costs of bushfires in the Blue Mountains
average around $72 million a year while, if fuel reduction was undertaken on about 5% of
the landscape, this could reduce total costs to around $39 million a year. These results
indicate that increased fuel reduction activity in the Blue Mountains could generate net
benefits of up to $34m a year (equivalent to around $483m in perpetuity).
These results include the additional costs of treatment, potential revenue from the sale of
mechanically recovered matter and costs related to particulate matter and carbon
emissions. It should be noted that there are a number of areas of uncertainty in these
Deloitte Access Economics Commercial-in-confidence
3results. For example, the overall reduction in area burnt is based on a single source rather
than drawing on the full range of literature discussed in this scoping study. Further, the
value of carbon emissions does not take into account the full lifecycle of emissions from
forest growth and is highly variable depending on the value of carbon used. Areas of
uncertainty such as these would be a particular focus in a full CBA.
Table iii: Blue Mountains example: Net Benefits
Average annual cost ($m)
Total average annual baseline costs 72
Total average annual alternative policy costs 39
Net benefits 34
Given the small incremental cost of the alternative policy, these results indicate a large
benefit cost ratio of around 6.0:
Table iv: Cost benefit ratio
Average annual cost ($)
Incremental benefits 41
Incremental costs 7
BCR 6.0
Given the uncertainty surrounding the inputs into this indicative example, it is likely that, in
a full CBA, that BCR would decline. For example, the relationship between area burnt and
insured losses is likely to be weaker than in the example while the cost of fuel reduction
may be higher.
Summary and next steps
This report is a scoping study into the feasibility of conducting a full cost benefit analysis of
alternative fuel reduction policies. Our literature review indicates that there is large
amount of information available to support a full CBA. Further, the indicative example
demonstrates that this information can be combined in a meaningful way to provide policy
guidance as well as providing some prima facie evidence of the potential value of
alternative policy approaches.
As a result, we believe that there is a strong case for undertaking a detailed CBA. This CBA
could also be conducted in conjunction with a small field trial program to further
investigate the operational aspects of fuel reduction treatments. Information gathered
during the trial program could provide relevant data for the CBA.
Deloitte Access Economics
Deloitte Access Economics Commercial-in-confidence
41 Introduction
The Australian Forest Products Association (AFPA) has commissioned Deloitte Access
Economics (DAE) to undertake a scoping study to explore the costs and benefits of a policy
of increased fuel reduction, using a combination of the mechanical removal of trees and
biomass, and fuel reduction burning. This has the potential to reduce the extent and
severity of future fires.
1.1 Background
The 2013 NSW bushfires, and more recently the Western Australian and Victorian bushfires
in early 2014, highlighted the potential for widespread burning of large forest areas and
destruction of economic infrastructure (e.g. roads, bridges, homes). The effect of such
intense, widespread fires can include: large insured losses; killing trees, wildlife and other
vegetation; air and water quality issues; and significant, non-quantifiable personal and
emotional costs. It can take many years before the forest regenerates and the
environment, community and economy fully recover.
In addition to the direct bushfire reduction benefits, a policy of mechanical removal of trees
and other combustible biomass (e.g. understory, fallen branches etc.) would provide some
material for use in the forest products and other relevant industries. This would allow for a
valuable resource to be generated out of bushfire fuel that would otherwise be burnt
during fuel reduction burning or during a bushfire.
Recently, there has been increased interest in establishing a robust basis for decision
making around the current and future impacts of natural disasters in Australia. Most
notably, in 2013 DAE undertook research for the Australian Business Roundtable for
Disaster Resilience and Safer Communities which enlivened this debate. DAE found that
while different resilience measures showed a wide range of benefit-cost ratios (BCRs),
investments that target high-risk locations using appropriate combinations of
infrastructure, policy and procedure carry the highest BCRs. A detailed assessment of how
bushfire management policy impacts outcomes would build on this existing knowledge.
Deloitte Access Economics Commercial-in-confidence
51.2 Purpose of the Scoping Study
There is a paucity of research and data analysis around the relative costs and benefits of
alternative approaches to bushfire management. The current policy approach is to focus
on fuel reduction burning in the cooler months of the year and suppression to protect high
value assets during the bushfire season. This is described qualitatively in the National
Bushfire Management Policy Statement for Forests and Rangelands:
It is clear that in forest and rangeland ecosystems, reducing the fuel reduces
bushfire risk. Many techniques are available to reduce fuel (such as
slashing, grazing, physical removal) and overall bushfire risk (such as
reducing ignitions, rapid response, community preparedness), but this
statement focuses on the role of planned fire which is the only technique
available for the wider reduction of fuels in fire prone and fire adapted
communities (i.e. those suitable for treatment). (Forest Fire Management
Group 2012).
As a result, the aim of this report is to begin the process of establishing a robust set of
information to inform the debate on the most appropriate, evidence based bushfire
management policy. In particular, it provides the background to undertaking a full CBA of a
policy of increased fuel reduction using a combination of mechanical removal of fuels and
fuel reduction burning. An investigation of this issue is warranted as there are likely to be a
number of operational and economic advantages in adopting a policy that incorporates the
mechanical removal of fuels, including:
community concerns over smoke and air quality;
the narrow window of weather days for undertaking fuel reduction burning; and
managing fuel loads from a risk management perspective, particularly in bushland areas
that are in close proximity to population centres or other important assets.
This report aims to undertake an initial review of the available data and other literature
which is currently available in Australia and globally. In particular this scoping study will
focus primarily on understanding the availability of data and research for the proposed case
study areas of the proposed larger CBA.
This scoping study will assess the possible approaches to undertaking a full CBA of this
nature. As part of this, the scoping study will identify the quantitative analysis that would
be undertaken in the full CBA, and will describe how this analysis could be applied in one of
the case study areas. The policy case would be heavily reliant on establishing the scale of
potential mitigation expenditure that could take place in Australia, over what time period it
could be completed and how it would reduce the severity of bushfire events.
Finally, this report will outline the next steps required to progress from this Scoping Study
to completing a full CBA. We would work with industry and related stakeholders to develop
a detailed “next steps” in order to undertake the requirements of a full study.
Deloitte Access Economics Commercial-in-confidence
61.3 Structure of this paper
The remainder of this paper is structured as follows:
Chapter 2 provides a high level summary of bushfire risk in Australia;
Chapter 3 details the North American experience with mechanical removal of fuels as
bushfire mitigation;
Chapter 3 describes the two approaches to bushfire policy, business as usual and the
alternative policy case;
Chapter 4 outlines the potential CBA methodology;
Chapter 5 outlines the regions which could be modelled in the CBA; and
Chapter 6 demonstrates, in more detail, how the CBA approach could be applied to a
particular region – the Blue Mountains.
Deloitte Access Economics Commercial-in-confidence
72 Bushfire risks in Australia
Living with the threat and consequences of bushfires is not a new phenomenon for
Australians. In recent decades, extended periods of drought and the complex effects of
climate change have heightened the threat of bushfires in Australia; Australia’s bushfire
season has been longer and bushfires have been observed more frequently and with
greater costs than before. This trend is expected to continue, the Intergovernmental Panel
on Climate Change believes that climate change will increase the frequency and severity of
very hot days in Australia (IPCC, 2012; 2013) increasing the chance of very high fire danger
weather and associated bushfires.
Bushfires in Australia today impact on, and have significant costs for a range of aspects of
the Australian community (Climate Council 2013):
Human health: fires pose significant risk to human health, including the threat of death
and respiratory impacts, since 1850 more than 800 people have died as a result of
bushfires.
Built environment and infrastructure: the Climate Council estimates that between
1925 and 2009 around 300 houses were lost each year as a result of bushfires.
Agriculture: bushfires cause significant damage to livestock and farming areas in
Australia, Keating and Handmer (2013) estimate that bushfires directly cost the
Victorian agriculture industry around $42 million each year. If the costs to business
interruptions are included the cost of bushfires increases to around $92 million
annually.
Forestry: bushfires cause significant damage to forestry and wood processing. For
example, Keating and Handmer (2013) estimate that the direct cost to the Victorian
timber industry from bushfires is $74 million per year.
Water: bushfires have long lasting impacts on the quality and quantity of water in
catchments, Melbourne Water estimates that the Black Saturday bushfires in 2009
affected 30% of the catchments, with recovery and ongoing water monitoring costs
exceeding $2 billion.
There are additional financial costs directly associated with bushfires including, the
opportunity costs for volunteer fire firefighters, and the fixed cost of fighting the bushfires
and government contributions for rebuilding efforts and compensation.
Beyond the economic and financial costs of bushfires outlined above, bushfires have other
costs that are far more difficult to quantify. Costs such as social disruption, trauma for
people living in bushfire affected areas, the ongoing impacts on health and effects on
ecosystems, while more difficult to measure are no less real.
Deloitte Access Economics Commercial-in-confidence
82.1 The cost of recent bushfires
The increased frequency and severity of bushfires in Australia over the last decade has
meant that the number of bushfires categorised as major events has risen dramatically.
This is arguably reflective of climate change increasing the number of very hot days in
Australia and increasing the chance of very high fire danger weather.
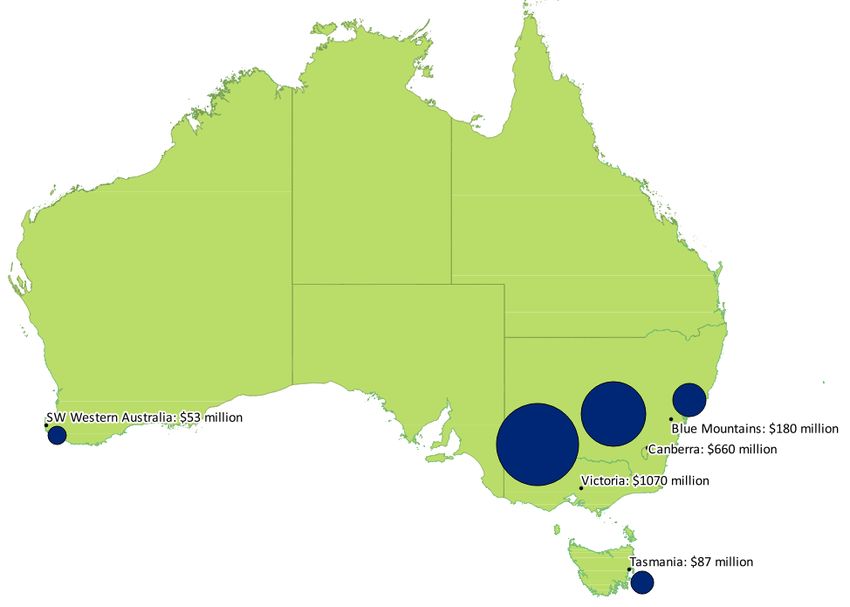
The recent fires in New South Wales in October 2013, for example, were preceded by the
warmest September on record for the state, and the warmest 12 months on record for
Australia. In addition, below average rainfall in forested areas increased the quantity of dry
fuels, further contributing to the size and severity of the bushfire event. More than 200
properties were destroyed, and the bushfires indirectly caused the deaths of two people in
the Blue Mountains. Early estimates from the Insurance Council of Australia (ICA), have
estimated that total insured costs will exceed $180 million. The bushfires in the
Wurrumbungles (Wambelong) earlier in 2013 destroyed around 55 homes and the Siding
Spring Observatory and burnt a large area of the National Park and surrounding areas.
Looking elsewhere in the country, the bushfires in Tasmania in late 2012 and early 2013
resulted in the loss of more than 200 homes, and around 10,000 livestock. The bushfires
caused the evacuation of around 1,000 residents. The ICA estimates that the total costs
from these bushfires were around $87 million. The fire season in the state over 2012/13
summer was particularly bad, with some bushfires starting as early as November 2012 and
continuing through until April of the following year.
Figure 2.1: Insured costs of recent major bushfires in Australia
Deloitte Access Economics Commercial-in-confidence
9The Bushfire Front, an independent bushfire research centre in Western Australia (WA),
highlighted the vulnerability of South Western WA to fire prior to the fires in 2011. The
report highlighted population density in the region; availability of fire fighters; location of
residences within unburnt bushland; and weather conditions as areas of concern. The
bushfires destroyed around 32 homes and 13 buildings and impacted many business
operations in the South Western tourism region of WA. The total cost of the bushfire has
been estimated to be around $53 million (Emergency Management Australia 2013).
Black Saturday in Victoria during February 2009 is among the worst bushfires (in terms of
total number of deaths) in Australia’s, and indeed the world’s, recent history. The weather
conditions directly before the bushfire were among some of the hottest days on record in
Australia; the Forest Fire Danger Index (FFDI) ranged from 120 to 190 (the highest values
ever recorded) on Black Saturday (Climate Council 2013). The costs of Black Saturday are
well documented, but worth re-emphasising. More than 2,000 properties were destroyed
and between 8,000 and 11,800 livestock were lost. Overall, ICA estimates that the
bushfires resulted in insured losses of $1.07 billion. Most significantly, 173 lives were lost
directly as a result of the fires with a further 414 people injured.
The bushfires that affected the Canberra and Alpine regions during January 2003 directly
caused the deaths of five people, with a further 490 people injured. The bushfires
destroyed more than 500 homes, more than 17,000 livestock, and impacted on around 70%
of the Australian Capital Territories (ACT) pastures, forests and reserves. ICA estimates that
insured losses from the bushfires were $660 million.
2.2 Total bushfire costs
The insured losses discussed above represent only a proportion of the total economic costs
of natural disasters for society. Total economic costs include broader social costs which
would not otherwise have been incurred had a disaster not taken place. As these costs are
borne by many parties, from individuals, communities and businesses, to all levels of
government and insurers, the magnitude of total economic costs can be hard to measure.
Research conducted by the Bureau of Transport Economics (BTE) in 2001 attempted to
estimate the total economic costs borne by Australians due to natural disasters. Using data
from disaster events which occurred between 1967 and 1999, and restricting the analysis to
cases where the total estimated cost exceeded $10 million, it was found that the average
annual economic cost was $1.1 billion, in 1999 prices. In general, it was found that total
economic costs were around 2-3 times greater than insured costs for most natural
disasters.
Deloitte Access Economics Commercial-in-confidence
10There has been a strong trend of increases in natural disaster costs over time;
this is attributable to both demographic and environmental factors. In
particular, the size and density of Australia’s major cities has increased, due to
a combination of population growth, domestic migration and international
migration. As population density has increased, settlements and
industrialisation have reached previously uninhabited areas of greater
exposure to natural disaster risks. Given that these areas are at higher risk of
fire, flood, storm and cyclone events, the magnitude of damage caused by such
disasters has been further compounded. Strong economic growth leading to
the concentration of high value assets has also contributed to the rising
damage bills.
Using data on the incidence of past Australian natural disasters, we have developed an
estimate of the current average cost of bushfires in Australia as well as forecasts of their
likely future costs. The process undertaken to generate these forecasts is described in
Appendix A.
The forecasts presented attempt to capture the total economic cost of the natural
disasters, not just the insured losses. As described earlier, insured costs represent the
payouts made by companies in response to eligible policy claims. Total economic costs are
inclusive of these insured losses, along with broader social costs which would not otherwise
have been incurred had a disaster not taken place.
At present, the total economic cost of bushfires in Australia is estimated to average around
$337 million per year. In real terms, this total is forecast to grow by 2.2% annually. This is
primarily due to the likely impact of further population growth and concentrated
infrastructure density. With this growth rate, the annual total economic cost of bushfires in
Australia is expected to reach $800 million by 2050, these forecasts are shown in the chart
below.
Looking on a state by state basis, Victoria accounts for the largest component of total costs
(accounting for almost half of all bushfire related natural disaster costs). NSW, SA, ACT and
Tasmania all account for roughly similar shares of the total cost (between 11-15%). WA has
a much lower share of the cost (only around 2%). The Northern Territory and Queensland
do not have any significant bushfires recorded in the Insurance Council of Australia’s
database of natural disasters and so do not contribute to the forecasts.
Deloitte Access Economics Commercial-in-confidence
11Chart 2.1: Forecast total economic costs of bushfires ($2011)
$m
900,000,000
800,000,000
700,000,000
Tas
600,000,000
ACT
500,000,000 SA
WA
400,000,000
Vic
300,000,000 NSW
200,000,000
100,000,000
-
2011 2016 2021 2026 2031 2036 2041 2046
Table 2.1: Forecast total economic costs of bushfires ($2011, million)
2014 2020 2030 2040 2050
NSW 43 50 64 81 103
Vic 172 196 244 304 378
WA 8 9 11 13 16
SA 44 48 57 67 79
ACT 53 62 79 101 129
Tas 40 45 57 73 92
Total 360 411 512 639 797
Source: DAE
Deloitte Access Economics Commercial-in-confidence
123 The North American experience
The many similarities between the North American and Australian experience with
bushfires, means that discussion of the policy responses to bushfires in North America are
relevant to the policy response in Australia.1
The significant increase in the number of properties and homes which are located in an
urban-bush setting in the east coast of Australia and south-west Western Australia is
similar to what has occurred in many parts of North America.
A similar history of bushfire management including a previous focus on fire suppression
has resulted in similar issues with high forest fuel loads.
There has been a similar trend in the increase in the frequency and severity of bushfires
in North America, particularly in the western United States and many climate
predictions suggest this is likely to continue.
Importantly, the recent shift in policy responses, and the associated data and research
provides a basis for understanding how policies pioneered in North America may be applied
in an Australian context. The outcomes of the policy response in North America may
provide Australia with the impetus to move towards adopting a contemporary approach to
bushfire management.
3.1 The 2002 and 2003 wildfire seasons
Prior to the beginning of this decade the policy response to the threat from bushfire in
North America emphasised fire suppression as the predominant bushfire management tool.
A series of particularly bad fire seasons beginning in 2000 resulted in a shift in
governments’ and policy makers’ approach to addressing the challenge of bushfire
management.
The 2002 bushfires were particularly damaging, in terms of area burnt and the severity of a
number of fires. Bushfires burnt 485,000 hectares along the Pacific North West and
Western United States including in Arizona, Colorado, Oregon and New Mexico. Indeed it
was immediately after this that the term ‘mega-fire’ was used to describe the emerging
trend of large bushfires (Williams 2012).
Similar to the recent bushfires in Australia, the 2002 bushfires in the Western United States
were largely the result of an extended period of drought and hot conditions in Western and
Mid-Western USA. A further compounding factor was the build-up of fuel loads – the result
of past policy responses to bushfires which focussed primarily on fire suppression activities
(Stephens 2014).
While bushfires in California during the hot and dry months of September and October are
relatively common, a series of particularly bad fires took place in 2003. The largest single
fire burning in California during October 2003 was the Cedar Fire in San Diego County. This
1
In North America, bushfires are known as wildfires.
Deloitte Access Economics Commercial-in-confidence
13single fire is among the largest bushfires to have taken place in California and it was only
one of 15 other fires burning in Southern California during one week in October 2003.
Overall these fires resulted in the deaths of 26 people and destroyed a significant amount
of property (including 3,361 homes). The fires burnt more than 742,000 hectares across
Southern California, cost more than $250 million to contain and caused around $2.04 billion
worth of damage (Keely et al 2004). Review of the policy in the lead up to and immediately
following the fires indicated that fire management policy was ineffective at preventing
these mega-fires.
Fires in western Canada, the Yukon, Quebec and Ontario in the early 2000s caused a shift in
the policy response to bushfire management in Canada. As in the Western United States,
and southern Australia, bushfires in Canada over the last decade have increased in
frequency and severity. At the same time, the policy approach to bushfire management
focussed largely on fire suppression contributing to the rising trend in bushfires in the
region over the early part of this decade.
Bushfires in 2003 in British Columbia were among the most catastrophic in recent times. As
in Southern California, the climate conditions in the lead up to the bushfire season, in
particular the extended drought across the Pacific North West resulted in severe fire
weather conditions. At the same time, the bushfires were taking place in an environment
of changing population densities with bushfires increasingly affecting homes located close
to forests and National Parks. Generally each year there is one instance of “interface”
bushfires, this year alone there were eight, highlighting the impact of increased frequency
of bushfires in the changing urban-bush setting.
Across Western Canada, bushfires during the summer months of 2003 cost around
$1 billion to contain, destroying hundreds of homes and leading to the evacuation of
thousands of people. The cost of containing bushfires in British Columbia alone was around
$500 million. In addition, the Insurance Bureau of Canada estimates that the cost of
insured property damage was around $250 million, this was estimated to be the largest
insurance loss from bushfire in Canada.
Deloitte Access Economics Commercial-in-confidence
143.2 Policy response
3.2.1 United States
Following particularly bad bushfire seasons in the early 2000s there was a shift in the policy
response to bushfire management in the United States. This shift took place within a
context of a broader shift in the policy of forest management. This policy response is based
around cooperation, collaboration and planning involving multiple groups to achieve a
landscape-scale response to bushfire management.
The United States Department of Agriculture Forest Service is responsible for restoring,
enhancing and maintaining the national forests. The Department administers a number of
programs to achieve this objective; those relevant to bushfire management are outlined
below.
The Healthy Forests Initiative (HFI) was enacted in 2003. The Initiative aimed to restore
forest landscapes to historical fire-resilient ecological conditions. The HFI allowed the
USDA Forest Service to plan and conduct fuel reduction treatments across the breadth
of the national forest system. This was to be achieved through combined use of
prescribed burning and mechanical harvesting.
The HFI was followed by the Collaborative Forest Landscape Restoration Programme
(CFLRP). The CFLRP was created in 2009 to, amongst other aims, reduce emergency
wildfire costs and risks. This program is reflective of the broader policy shift which
emphasises landscape-scale planning, collaboration, monitoring and restoration. The
holistic approach of the program objectives included demonstrating that costs could be
lowered through re-establishing natural fire regimes and showing that the commercial
value of restoration by-products could support local economies (Schultz et al; 2011).
Projects included in the CFLRP were conducted at scales which could influence fire
behaviour and were able to address larger scales than had been achievable previously.
Fuel treatments included mechanical thinning, prescribed fire, harvesting woody
biomass and managing lightning-caused fire for restorative purposes. For example, in
the Selway-Middle Fork Clearwater Project, 90-100% of the treatments will take place
within the wildland-urban interface. Other projects such as the Four Forests
Restoration Initiative (4FRI) in Arizona aim to restore forests to more fire-resistant
ecological conditions and strategically place treatments in areas adjacent to and farther
from communities to reduce the risk of uncharacteristic wildland fire in the future.
Deloitte Access Economics Commercial-in-confidence
15Analysis of outcomes has focused on modelling the impacts of alternative fuel
reduction policy initiatives.
Hartsough et al (2008) analysed seven sites in the western United States, to
determine the costs of different fuel reduction treatments (prescribed fire,
mechanical treatment, mechanical plus fire) against the impact of these
treatments on fuel and other factors. The authors found that the net costs of
mechanical treatment (after considering the value of harvested products)
were less than those of fire alone (with the exception of one site), and that
the mechanical plus fire treatment was the most effective in reducing the
severity of fires under extreme weather conditions.
Thompson et al (2013) quantified the impact of fuel reduction practices on
bushfire size and suppression costs. The modelling analysed bushfire
simulation outputs against suppression costs and fuel treatment cost impacts
to compare expected suppression costs with and without fuel treatments. The
authors found that with fuel reduction treatments the distribution of wildfire
size and suppression costs decreased both in the treated areas and in the
broader landscape study area.
3.2.2 Canada
The Canadian response to bushfire management since the early 2000s has been broadly
similar to that taking place within the United States, with an emphasis on managing
bushfires as part of a more comprehensive approach to forest management.
The approach to bushfire management is a direct response to the perceived changing
climate conditions facing Canada (including the hotter and drier weather conditions) and
public concern for the rising trend of ‘mega fires’ and the impact of these fires on people
and property (Canadian Council of Forest Ministers 2005). There are also expectations that
developments in climate conditions apparent in Western Canada will result in a longer fire
season and more frequent and increased severity of bushfires in Canada. In response to
these concerns and the apparent declining effectiveness of fire suppression policy, policy
makers have focussed on addressing the risks of large scale fires with a more active
approach to bushfire management which incorporates both fuel reduction and biomass
utilisation (Stephens 2012).
The change in the policy response has been the most apparent in the development of the
Canadian Wildland Fire Strategy, which focusses on developing a national risk management
framework. The policy response is based around a framework of mitigation, preparation
and response. The increased use of fuels management and other mitigation activities are
intended to reduce the severity of fire behaviour in forest lands.
The policy response in British Columbia has focussed on responding to the increased
severity of bushfires apparent in the region. The Wildfire Management Brach is responsible
for bushfire policy in the region. Recent strategies have emphasised proactive planning as
an appropriate response to the increased threat of bushfires.
Fuel management to reduce loss and damage from bushfires through community
wildfire protection and fuel hazard reduction.
Deloitte Access Economics Commercial-in-confidence
16 Landscape level management planning, to lead to landscape fire management planning
that results in fire-adapted communities and fire-resilient ecosystems.
Wildfire management practices to develop and promote innovative wildfire
management science, practices, technology and decision support models.
Further, the Ministry of Forests, Lands and Natural Resource Operations in British Columbia
has identified a range of treatments to promote reduced fire risks (Stephens 2014). These
include:
Harvesting and commercial thinning
Line corridor fuel breaks
Increased prescribed fire
Large scale fuel breaks
Alternative silviculture regimes
Energy / biomass use; and
Better initial attack (access, response and resources).
Deloitte Access Economics Commercial-in-confidence
174 Two approaches to mitigation
With the emergence of more active forest management internationally and the increased
reliance on mechanical removal of combustible biomass, a cost benefit analysis of its
application in Australia is warranted. To undertake a cost benefit analysis we would need
to define a baseline scenario and an alternative policy approach. This chapter outlines the
likely information that would be used to inform both scenarios.
4.1 Baseline approach
The baseline scenario would be a business as usual scenario. This is described qualitatively
in the National Bushfire Management Policy Statement for Forests and Rangelands:
It is clear that in forest and rangeland ecosystems, reducing the fuel reduces
bushfire risk. Many techniques are available to reduce fuel (such as
slashing, grazing, physical removal) and overall bushfire risk (such as
reducing ignitions, rapid response, community preparedness), but this
statement focuses on the role of planned fire which is the only technique
available for the wider reduction of fuels in fire prone and fire adapted
communities (i.e. those suitable for treatment). (Forest Fire Management
Group 2012).
That is, the baseline would involve continued reliance on planned fire as the only fuel
reduction treatment conducted at current levels.
From a quantitative point of view, data is available on the prescribed burn area in Australia.
As is shown in the chart below, there has been a strong decline in the average prescribed
burn area in most Australian states when comparing 2000-2010 to 1990-2000. It is this
lower level of prescribed burning that has been the norm over recent decades that would
be used as the baseline approach to fuel reduction.
In a full CBA this prescribed burn area would be converted to a percentage and the
percentage would be used as the baseline from which fuel reduction is increased in the
policy scenario. Recent analysis indicates that NSW is likely burning around 0.5% of
bushland in any given year (McCaw 2012; Price and Bradstock 2011).
Deloitte Access Economics Commercial-in-confidence
18Chart 4.1: Prescribed burn area by state
Ha
350,000
300,000
250,000
200,000
150,000
100,000
50,000
0
NSW TAS WA SA VIC QLD ACT
Average 1990-2000
Average 2000-2010
Source: DCCEE (2012).
4.2 Alternative policy approach
The alternative policy approach involves both an increase in the level of fuel reduction
activity taking place and a change in the way that fuel reduction is undertaken – from the
use of prescribed burning only to an optimal mix of prescribed burning and mechanical
removal.
Considering the appropriate increase in the level of fuel reduction activity, there appears to
be consensus that treating at least around 5% of the landscape each year is needed to
provide an effective level of activity from a hazard reduction perspective. Support for this
level of activity is given in:
Florec et al (2012) find that treatment of 5% of the landscape is economically optimal in
Western Australian conditions.
McCaw (2012) notes that treatment of 5% of the landscape around Sydney would halve
the extent of unplanned fires.
The Climate Council (2013) notes that the Victorian Royal Commission into the Black
Saturday fires recommended treating at least 5% of public land per year in Victoria.
Deloitte Access Economics Commercial-in-confidence
195 CBA Methodology
This chapter provides an outline and potential data sources for conducting a full benefit-
cost analysis of increased fuel reduction activity and mechanical removal of fuel in
Australia. In practice, the overall methodology would be applied to specific case studies;
the likely areas that could be used for case studies are outlined in Chapter 6.
5.1 Overview of CBA
In the context of a policy intervention such as fuel reduction, the purpose of a CBA is to
provide a structured approach to assessing whether or not the policy is likely to result in
overall benefits to the economy. A CBA considers the economy in a broad way and should
take into account non-monetary factors such as the environment, health and leisure time.
Conducting a CBA that relates to natural disasters is somewhat different to a standard CBA
as it focuses almost entirely on costs and associated risks. A natural disaster related CBA
considers the expected costs of natural disasters in a baseline case and the costs of natural
disasters in a policy case. The difference between the two cases is created by expenditure
on a resilience measure – another cost. The CBA is therefore weighing up the costs of
investment in resilience compared to the reduction in natural disaster costs (see Figure
5.1).
Figure 5.1: Overall CBA process
In a more stylised sense, the overall process of a natural disaster resilience CBA is to:
1. Estimate baseline natural disaster costs
2. Identify and cost resilience measures
3. Re-estimate natural disaster costs
4. Compare costs of resilience to reduction in natural disaster costs
An outline of each of these steps will be provided below but, first, a clear definition of the
range of costs and benefits considered will be given.
Deloitte Access Economics Commercial-in-confidence
205.2 Defining costs
When conducting a CBA for a resilience measure the total economic costs are used, rather
than insured costs. Insured costs of natural disasters only capture the losses accruing to
insured assets – they do not pick up uninsured assets or broader economic costs (such as
emergency response costs and loss of life).
The main source for how to estimate total economic costs of natural disasters is a report
from the Bureau of Transport Economics (2001) “Economic Costs of Natural Disasters in
Australia” (BTE is now known as the Bureau of Infrastructure, Transport and Regional
Economics). This source provides an overall framework which allows an item by item
quantification of costs and benefits where possible or their qualitative consideration where
quantification is not possible.
Under BTE’s approach, the total economic costs of a natural disaster are broken down into
four broad categories based on a combination of whether the costs are directly and
indirectly caused by the natural disaster and whether the costs are tangible or intangible:
Table 5.1: Economic costs of a natural disaster
Direct Indirect
Tangible Damage to buildings Emergency response costs
Damage to infrastructure Household costs
Damage to crops and livestock Commercial costs
Damage to natural resources Loss of production
(e.g. timber)
Intangible Death Psychological
Injury Inconvenience and stress
Personal items and
memorabilia
Source: BTE (2001)
The total economic costs of a natural disaster can then be estimated by considering each of
these cost categories in turn.
In addition to the costs defined by BTE, we would add:
carbon emission costs from bushfires;
particulate matter costs;
the net costs of fuel reduction treatments; and
the potential ecological benefits from active forest management.
Deloitte Access Economics Commercial-in-confidence
215.3 Estimating baseline costs
The first step in undertaking the CBA is to estimate the expected costs of bushfire under the
base case with current levels of fuel reduction activity using burning only.
5.3.1 Bushfire costs
There are a number of ways in which estimating the bushfire costs could be achieved. Each
method listed below has a different mix of positives and negatives and the appropriate
method would need to be selected in the context of a full CBA:
Estimate based on historical data
This is the most basic approach to estimating bushfire costs. This approach would use
the historical data from the Insurance Council of Australia database (ICA 2014) to
provide an estimate of average annual insured bushfire costs in any given region of
Australia.
This insured cost could then be turned into a total economic cost by use of the
multipliers reported in BTE (2001). A more detailed approach would merge the ICA
database with the EMA database (2014). The EMA database contains information on
factors such as the number of buildings damaged, number of fatalities and the
number of people evacuated that can be added on to the insured costs to determine
a total economic cost.
Estimate based on an existing bushfire model
This approach relies on the use of modelling by an outside agency and so may have a
higher cost but could significantly improve the detail of the analysis that can be
undertaken. If results from a model can be readily sourced then this is our preferred
method for estimating the costs of a bushfire.
There are a number of bushfire models currently in use around Australia. For
example:
• the Australis model is maintained by George Milne at the University of
Western Australia.
• CSIRO has a Bushfire Dynamics and Applications group which develops models
of bushfire spread. Some of their models (such as SiroFire) are freely available.
• The Bushfire CRC has developed a fire simulation model.
• AIR Worldwide, a private risk modelling consultancy, maintain a model of
bushfire spread for Australia.
These bushfire models focus on the spread of fire within a landscape, not the
economic damage caused by the fire. The results of the model would need to be
combined with analysis of how fire affects households. The best research in this area
has been undertaken by RiskFrontiers (2010) which provides a detailed analysis of
how proximity to a bushfire relates to the probability of damage. This relationship is
shown in the figure below.
Deloitte Access Economics Commercial-in-confidence
22You can also read