SMART RENEWABLE HUBS FOR FLEXIBLE GENERATION SOLAR GRID STABILITY D7.3 - Power System Impact and GRIDSOL potential
←
→
Page content transcription
If your browser does not render page correctly, please read the page content below
SMART RENEWABLE HUBS

 FOR FLEXIBLE GENERATION

 SOLAR GRID STABILITY

 D7.3

Power System Impact and GRIDSOL potential

 The project has received funding from the European Union’s Horizon 2020
 research and innovation programme under grant agreement No 727362
DOCUMENT HISTORY

ID & Title : D7.3 - Power System impact and GRIDSOL potential Number of pages : 84
Version V3
Short Description (Max. 50 words):
Long-term analysis on the integration of CSP and SRH in the European interconnected power system
and in an isolate system, Crete. Potential future role of CSP-based concepts as well as optimal
configuration of SRH are assessed until 2050, on the background o EU decarbonization ambitions.

Revision History

Version Date Modifications’ nature Author
v1 27.8.19 Document setup ADR
V2 29.10.19 Draft report ADR
V3 29.11.10 Final report ADR
Accessibility:
The document is open

If restricted, please specify here the
group:
Owner / Main responsible:

Alberto Dalla Riva, Andrea Pasquali

Reviewer (s):

DTU, CESI, Cobra

Power System impact and GRIDSOL potential D7.3 0
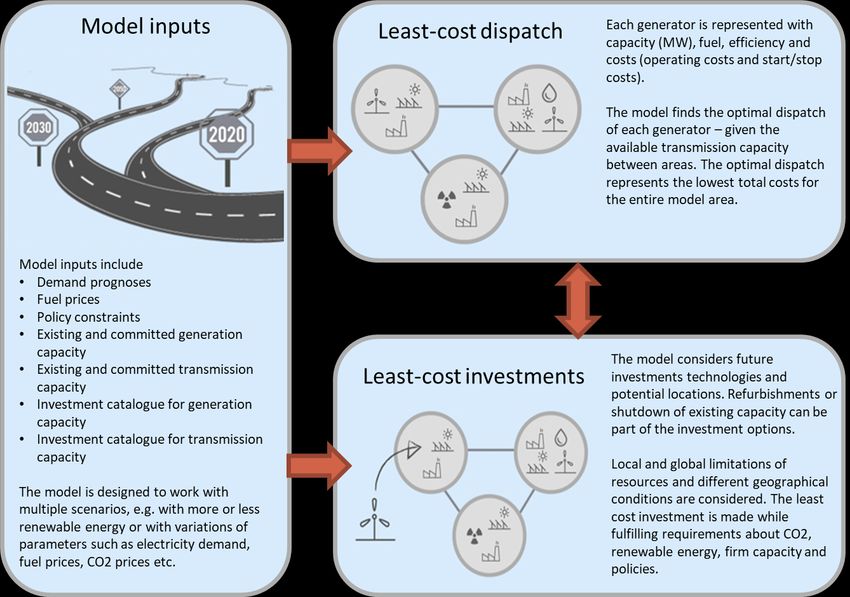
TABLE OF CONTENTS

DOCUMENT HISTORY ............................................................................................................................. 0
LIST OF FIGURES AND TABLES ................................................................................................................... 2
LIST OF ACRONYMS AND ABBREVIATIONS .................................................................................................... 5
EXECUTIVE SUMMARY AND KEY FINDINGS .................................................................................................... 6
1. INTRODUCTION & OUTLINE .................................................................................................................. 9

 1.1. WHAT ARE SMART RENEWABLE HUBS AND GRIDSOL? ..................................................................................9
 1.2. SCOPE OF THE ANALYSIS ........................................................................................................................ 11
 1.3. EU 2050 SCENARIOS AND DECARBONISATION PATHWAYS ....................................................................... 12

2. INTERCONNECTED EUROPEAN SYSTEM ................................................................................................... 14

 2.1. STATUS OF THE POWER SYSTEM IN EUROPE .............................................................................................. 14
 2.2. STATUS OF CONCENTRATED SOLAR POWER (CSP) IN EUROPE AND THE WORLD ............................................. 17
 2.3. ANALYSIS AND SCENARIO SETUP ............................................................................................................. 20
 2.4. RESULTS FOR THE EUROPEAN POWER SYSTEM ........................................................................................... 25

3. SMART RENEWABLE HUBS ........................................................................................................... 54

 3.1. STATUS OF SRH AND HYBRID PLANTS ...................................................................................................... 54
 3.2. SMART RENEWABLE HUBS MODELLING.................................................................................................... 55
 3.3. SRHS RESULTS..................................................................................................................................... 56

4. ISLAND SYSTEMS: THE CASE OF CRETE .............................................................................................. 61
5. CONCLUSIONS ............................................................................................................................. 72
6. REFERENCES ................................................................................................................................... 73
GLOSSARY ....................................................................................................................................... 75
APPENDIX: MODEL SETUP AND DETAILED ASSUMPTIONS ................................................................................ 77

Power System impact and GRIDSOL potential D7.3 1
LIST OF FIGURES AND TABLES
Table 1. GHG reduction and renewable energy targets for 2030 and 2050. ............................................. 16
Table 2. Scenario characterisation. ............................................................................................................ 22
Table 3. CO2 emissions reduction in 2050 with respect to 1990 and 2015. .............................................. 25
Table 4.Renewables and nuclear generation shares across scenarios (2050). .......................................... 27
Table 5. Installed solar PV capacity in the four scenarios. ......................................................................... 30
Table 6. Net exports in the Gridsol countries. Scenario 1.5 degrees - 2050. ............................................. 32
Table 7. Cost for volume and capacity of thermal and electric storage. ................................................... 48
Table 8. Technical features of CSP installations in Spain over the years – CSP+ scenario. ........................ 50
Table 9. Heat Curtailed in Spain - CSP+ scenario........................................................................................ 52
Table 10. Capacity and generation shares for Crete – existing system...................................................... 63
Table 11. Generation and capacity shares in Crete (2050). ....................................................................... 65
Table 12. Submarine cable utilisation factor [%]. ...................................................................................... 68
Table 13. Operational features of CSP units in the two scenarios. ............................................................ 71
Table 14. Technical features of the Gridsol hub (2018 values). NG/BG: natural gas/biogas [18]. ............ 80
Table 15. Costs of Smart Renewable Hub technologies. All costs are in million EUR15/MWel, except for
storage (EUR15/MWHel). ........................................................................................................................... 81

Figure 1. Gridsol hub. ....................................................................................................................................9
Figure 2. CSP-gas hybrid group................................................................................................................... 10
Figure 3. SRH concept................................................................................................................................. 10
Figure 4. Development of EU28 generation overtime. Source: [3]............................................................ 14
Figure 5. Status of coal phase-out in Europe. Elaboration based on data from (Europe Beyond Coal, 2019b).
.................................................................................................................................................................... 15
Figure 6. Evolution of the carbon price in the EU ETS system (2008-2019)............................................... 16
Figure 7. Auctions in 2017-18: winning technologies per region. Source: Irena. ...................................... 17
Figure 8. Auction results for CSP. ............................................................................................................... 18
Figure 9. Reduction in the Value Factor (VF) for wind and solar technologies. Source: [25]. ................... 19
Figure 10. Scenario overview. .................................................................................................................... 21
Figure 11. CSP cost assumptions in the scenarios under study. ................................................................ 22
Figure 12. Geographical scope of the model. ............................................................................................ 23

Power System impact and GRIDSOL potential D7.3 2
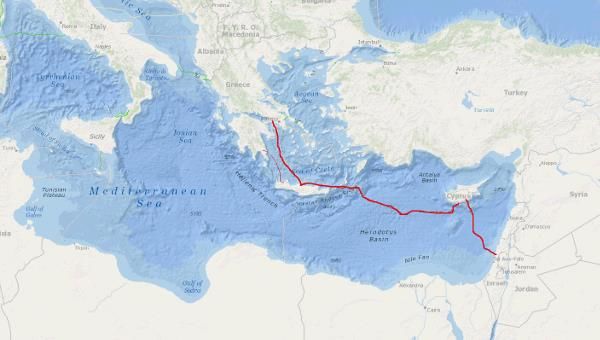
Figure 13. CO2 emissions reduction in the three pathways (above) and assumed CO2 quota price over the
years (below). ............................................................................................................................................. 26
Figure 14. Electricity generation in Europe in the Baseline scenario. ........................................................ 27
Figure 15. Annual demand in 2050 compared to 2018. ............................................................................. 28
Figure 16. Average annual buildout of wind and solar capacity. ............................................................... 28
Figure 17. Historical decline in cost of PV. ................................................................................................. 29
Figure 18. Development of PV costs and system penetration. .................................................................. 29
Figure 19. Share of solar PV generation in selected countries in the baseline scenario. .......................... 30
Figure 20. Development of the wholesale market price in the Gridsol countries and EU average - 1.5
degrees scenario. ....................................................................................................................................... 31
Figure 21. Wholesale prices in 2050 across scenarios for the Gridsol countries and EU average. ............ 32
Figure 22. Price duration curves for Spain over the time horizon - CSP+ scenario. ................................... 33
Figure 23. Power price and electricity flow in interconnectors. Scenario 1.5 degrees - 2050................... 34
Figure 24. Expansion of transmission capacity per scenario...................................................................... 35
Figure 25. Evolution of power flow dynamics between European macro regions. 1.5 degrees scenario. 36
Figure 26. Average daily cross-border flows between Italy and France (imports from and exports to France)
- CSP+ scenario, 2050. ................................................................................................................................ 37
Figure 27. Battery storage capacity and volume across scenarios. ........................................................... 39
Figure 28. Battery storage capacity with respect to solar installations. .................................................... 39
Figure 29. Loading and unloading of battery storage. Spain (left) and France (right) – CSP+ scenario, 2050.
.................................................................................................................................................................... 40
Figure 30. Cumulative installed capacity for CSP-based generation units. ................................................ 41
Figure 31. Left: difference in installed power capacity between 1.5 degrees and CSP+ scenarios (Spain).
Right: capacity ratio between ST and GT in the CSP-gas groups (2050). ................................................... 42
Figure 32. Generation mix in the five Gridsol countries - 1.5 degrees and CSP+ scenarios, 2050. ........... 43
Figure 33. LCoE projections for CSP under different FLH assumptions...................................................... 44
Figure 34. Equivalent number of cycles per year for electric and thermal storage. scenario CSP+ - 2050.
.................................................................................................................................................................... 45
Figure 35. Weekly pattern of solar PV generation. .................................................................................... 46
Figure 36. Price duration curves for Spain, France and Italy - CSP+ scenario, 2050. ................................. 46
Figure 37. Average hourly market price - CSP+ scenario, Spain, 2050....................................................... 47
Figure 38. Average hourly market price - CSP+ scenario, Italy, 2050. ....................................................... 47
Figure 39. LCoE of solar PV and CSP technologies for different values of the storage ratio (Italy, 2050). 49
Figure 40. Comparison between LCoE and Market Value (MV) of CSP and PV (2050). ............................. 49

Power System impact and GRIDSOL potential D7.3 3
Figure 41. Difference in the weekly dispatch of CSP units for Spain in 2030 and 2050 - CSP+ scenario. .. 51
Figure 42. Generation duration curve for CSP in 2030 and 2050 - CSP+ scenario. .................................... 51
Figure 43. Seasonal dispatch from the steam and gas turbines in CSP hybrid groups - CSP+ scenario, Italy,
2050. ........................................................................................................................................................... 52
Figure 44. Example of the hybrid group hourly dispatch - CSP+ scenario, Italy, 2050............................... 53
Figure 45. Average hourly electricity price in Italy - CSP+ scenario, 2030 and 2050. ................................ 53
Figure 46. Overview of SRH technologies. ................................................................................................. 55
Figure 47. Smart Renewable Hubs configurations across the four scenarios. ........................................... 56
Figure 48. SRHs composition by geography - CSP+ scenario. .................................................................... 57
Figure 49. Evolution of capacity factors for the five Gridsol locations. ..................................................... 58
Figure 50. Hub duration curve - CSP+ scenario, 2050, Italy. ...................................................................... 59
Figure 51. Average weekly behaviour for thermal and electric storage in SRHs – CSP+ scenario, Italy, 2050.
.................................................................................................................................................................... 60
Figure 52. The EuroAsia interconnector will link Crete and mainland Greece from 2022. Source: 4C
Offshore...................................................................................................................................................... 61
Figure 53. Yearly load profile for Crete (2025). .......................................................................................... 62
Figure 54. Annual electricity generation per fuel type – existing system. ................................................. 63
Figure 55. Electricity dispatch for a summer week - existing system. ....................................................... 63
Figure 56. Evolution of the installed capacity in Crete until 2050. ............................................................ 64
Figure 57.Capacity buildout and decommissioning until 2050 (oil units excluded). ................................. 65
Figure 58. Top: electricity generation on a weekly basis (2050). Bottom: average daily load profile. ...... 66
Figure 59. Technical characteristics of CSP installations on Crete. ............................................................ 66
Figure 60. Average daily dispatch – non-interconnected system, 2050. ................................................... 67
Figure 61. Full load hours of CSP and biomass power plants. The expansion of the storage volume is
reported as well.......................................................................................................................................... 67
Figure 62. Capacity increase (per fuel type) in the interconnected scenario. ........................................... 69
Figure 63. Electricity curtailment in the two scenarios for Crete. ............................................................. 70
Figure 64. Cross-border physical flows from Crete's perspective – 2025. ................................................. 70
Figure 65. Average yearly electricity prices in the two scenarios. ............................................................. 71
Figure 66. Gridsol hub schematic. .............................................................................................................. 79
Figure 67. Gas prices in the simulations. .................................................................................................... 82
Figure 68. Hydrogen demand prognoses for the decarbonisation pathways envisioned in the EU Climate
Strategy. ..................................................................................................................................................... 83

Power System impact and GRIDSOL potential D7.3 4
LIST OF ACRONYMS AND ABBREVIATIONS

 ACRONYM MEANING

 BESS Battery Energy Storage System
 CCS Carbon Capture and Storage
 CF Capacity Factor
 CSP Concentrated Solar Power
 DNI Direct Normal Irradiation
 ETS Emission Trading System
 EU European Union
 FIT Feed-In Tariff
 FLH Full load hours
 GHG Greenhouse gas
 GT Gas Turbine
 H2 Hydrogen
 HFO Heavy Fuel Oil
 HPP Hybrid Power Plant
 LCoE Levelised Cost of Electricity
 NG Natural Gas
 NTC Net Transfer Capacity
 PPA Power Purchase Agreements
 PPP Public-Private Partnership
 SM Solar Multiple
 SRH Smart Renewable Hub
 VF Value Factor
 VRES Variable Renewable Energy Sources

Power System impact and GRIDSOL potential D7.3 5

EXECUTIVE SUMMARY AND KEY FINDINGS
The growing market share of renewable energy technologies in the European power sector and the
compelling long-term climate mitigation targets taken on by the EU and its Member States require a
well-thought-out planning and grid integration of new generation facilities as well as an appropriate
expansion of the grid infrastructure.

The undersigning of the Paris Agreement led to the formulation of a renewed European Climate Strategy
in November 2018. With the aim of being at forefront of climate change mitigation, Europe pledged to
act for a prompt transition towards a carbon-neutral economy. The power sector is already well-underway
with its specific environmental targets as emissions have been cut by more than 40% with respect to 1990.

Wind and solar PV are fully mature technologies and they are set to provide bulk generation in the future.
Other renewables hold a smaller market share, but can fulfil an essential role in guaranteeing system
stability and firm electricity provision. Among these, Concentrating Solar Power (CSP) is expanding in
regions of the world where a high DNI resource is available; at the end of 2018, the global installed
capacity settled at 5.5 GW.

Despite being a technology in the early development stage, CSP has seen notable cost reductions in recent
years due to improved design and efficiency of the solar field and industrial advancements. In locations
characterised by good solar resources, the LCoE of new plants is falling under 100 EUR/MWh. With sites
where the DNI overreaches 2000 kWh/m2, Southern Europe and islands in the Mediterranean hold the
potential for deployment of new solar thermal capacity.

New technology concepts for CSP have recently been developed and can enhance the further penetration
of CSP units in the European power fleet, including off-grid systems. In the Gridsol hub, a CSP-powered
steam turbine with thermal storage is combined with a gas turbine with heat recovery. The motivations
to add several units together into one single hybrid power plant are manifold including dispatchability,
reduction of grid connection cost and provision of balancing and other ancillary services. Smart Renewable
Hubs (SRHs) and Gridsol are among these hybrid solutions, where CSP-based generation, variable
renewable energy sources (VREs) and energy storage are coordinated by an intelligent dispatch manager.

The evolution of the European power sector, the potential of CSP-based generation and the
composition of Smart Renewable Hubs until 2050 are assessed from a socio-economic perspective, in a
market setting without subsidies and under different possible decarbonisation pathways based on the
European Commission’s Strategic long-term vision for a prosperous, modern, competitive and climate
neutral economy by 2050: the Baseline (continuation of current policies); the 2.0 and 1.5 degrees (with
reference to the objectives rolled out in the Paris Agreement). An additional scenario (CSP+) hypothesizes
a fast development of the CSP industry and has a further cost reduction for the related components.
Moreover, the potential for CSP in a non-interconnected power system is analysed based on the example
of simulations for Crete, including an assessment of the impact of a potential interconnection to mainland
Greece.

Power System impact and GRIDSOL potential D7.3 6
KEY FINDINGS VRES will cover more than 70% of the 2050 gross electricity demand in all scenarios. Hydro, nuclear and other renewables will contribute with around 20-25% whereas conventional generation (mainly from natural gas) will account for 0-3% of the total supply. A large uptake of CSP in Europe is possible only with bigger cost reductions than expected by the industry. For new installations to be competitive in 2020-30, the price of CSP power plants needs to be reduced by over 1 million EUR/MW. Solar PV and batteries are the main competitors to CSP and Gridsol. PV is expected to more-than- halve its investment costs from 2018 to 2050 and electric storage can defer dispatch to evening and night hours as does thermal storage in CSP plants. Despite the lower DNI, CSP is more competitive in France and Italy, better interconnected countries in which the electricity price is higher and the competition with PV and batteries less pronounced. CSP and Gridsol have a higher cost but the value of the electricity generated (Market Value) is much higher than PV, therefore they can still be competitive concepts. 90 80 70 LCoE and MV [EUR/MWh] 60 50 40 30 20 10 0 Spain Italy Greece France Spain Italy Greece France CSP PV CSP+ cost 2050 Reference cost 2050 Market Value C OMPARISON BETWEEN LC O E AND M ARKET V ALUE (MV) OF CSP AND PV (2050). The gas (or biogas) turbine plays a marginal role in the CSP-gas groups and is mainly installed as a backup for times of supply shortage. The use of the turbine in the hub is however more competitive compared to a normal combined cycle or a peaker, since the cost of the steam turbine is shared with the CSP and can take advantage of the storage system. The configuration of new CSP power plants must include large solar fields and thermal storage to allow intra- and inter-day shifting of power production. Storage volumes for more than 20 hours of generation ensure continuous, nearly-nominal evening and night dispatch with the possibility of Power System impact and GRIDSOL potential D7.3 7
extending operations on cloudy days. The steam turbine operates as an intermediate/base-load unit, with full load hours up to 6400. Thermal storage inside CSP plants have a much lower cost per volume installed compared to batteries. Therefore, thermal storage is cost efficient when large amounts of solar energy has to be stored for an extended time horizon beyond 4-10 hours. The strong need for firm and dispatchable generation makes CSP hybrid groups extremely competitive in island systems. Simulations for the isolated power system on Crete show shares of CSP in the generation of 35% in 2040. Interconnection to mainland Greece reduces the competitiveness of CSP and diminishes the optimal CSP capacity by over 200 MW. Interconnection lowers electricity prices and reduces curtailment in off-grid systems. On Crete, the electricity price drops by 24 EUR/MWh in 2050 if interconnection is established. Moreover, solar curtailment falls below 5% and wind curtailment is cut by 40% with respect to an off-grid scenario. Smart Renewable Hubs are predominantly large PV plants in the short-term and semi-dispatchable groups composed of PV and batteries in the long-term. CSP-based generation can be part of the hubs under the hypothesis of large cost reductions. In a Smart Renewable Hub, PV benefits the most from sharing the cost of grid connection, as its investment and operational costs are proportionally reduced more than for other technologies. The integration of storage facilities and the overplanting of PV boosts the hybrid power plant’s capacity factors, which reaches values around 80% in 2050. 500 450 400 350 Power output [MW] 300 250 200 150 100 50 0 1276 4591 1 256 511 766 1021 1531 1786 2041 2296 2551 2806 3061 3316 3571 3826 4081 4336 4846 5101 5356 5611 5866 6121 6376 6631 6886 7141 7396 7651 7906 8161 8416 8671 Hours of the year Hub duration curve Gridsol GT Gridsol ST Net production from solar PV Gross generation from PV (incl. curtailment) H UB DURATION CURVE - CSP+ SCENARIO , 2050, I TALY . Power System impact and GRIDSOL potential D7.3 8
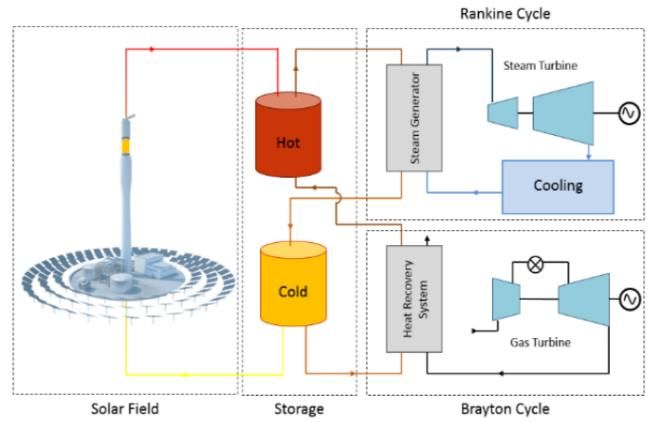
1. INTRODUCTION & OUTLINE
The present analysis is part of the H2020 Project “GRIDSOL - Smart Renewable Hubs For Flexible
Generation: Solar Grid Stability”. The overall objective of the project is to develop a new solution
combining synchronous and asynchronous-like generators at a power plant level, which will allow the
increase of renewable energy sources (RES) share in electricity generation using a new approach: Smart
Renewable Hubs. The proposed core of these hybrid hubs is a concept called Gridsol.

1.1. W HAT ARE S MART R ENEWABLE H UBS AND G RIDSOL ?
Smart Renewable Hubs (SRHs) are hybrid power plants coordinated by an intelligent dispatch manager
(DOME, Dynamic Output Manager of Energy). The Gridsol concept (Figure 1) is a specific type of Smart
Renewable Hub that incorporates both synchronous and non-synchronous generators. The synchronous
component (Figure 2) is constituted by a Concentrated Solar Power (CSP) power cycle and one or more
Gas Turbines (GT) with heat recovery. The solar field is composed of many heliostats which concentrate
the Direct Normal Irradiation (DNI) into one or more central towers, depending on the field size. The heat
medium is a molten salt mixture, which flows into a hot and cold tank system where sensible heat can be
stored. The thermal energy contained into the GT exhaust gas is also recovered through a heat exchanger
and contributes to heating up the salt mixture in the hot tank. The power block of the CSP cycle consists
of a sub-critical Rankine cycle, where steam is generated from the high-temperature salt mixture. The gas
turbine can be fed by either natural gas or biogas and gives flexibility to the Gridsol hub. The Rankine cycle
is ultimately the bottoming section of a combined cycle, where the gas turbine serves as the topping part.
When fed with biogas, the CSP-gas group relies entirely on renewable energy.

 DOME

 F IGURE 1. G RIDSOL HUB .

SRH is therefore a general term to identify a hybrid power plant which may or may not integrate the CSP-
gas hybrid group. The other technologies that can be installed in the hub are PV arrays and wind turbines
along with electric storage (BESS); the latter reduces the energy curtailed from the VRES generators and
shifts production to hours with higher prices, in order to boost revenues. The units are coordinated by an
intelligent Domestic Output Manager of Energy (DOME), which minimises the revenue loss endured by
non-dispatchable generators and optimises the system functioning.

Power System impact and GRIDSOL potential D7.3 9
F IGURE 2. CSP- GAS HYBRID GROUP .

Altogether, the SRHs are able to ensure dispatchability and firmness with high Capacity Factors (CF) and
minimum balancing penalties. In addition, the hub relies only on renewable energy sources when biogas
is available. The increasing presence of VRES in the system, which are characterised by uncertain
generation prognoses, supports the attractiveness of a firm, dispatchable plant such as Gridsol (Figure 3).

 Gridsol
 Multi-technology hybrids:
 CSP-gas group PV and Wind provide bulk,
 low-cost energy. Batteries
 provide short-term
 regulation
 CSP and (bio) GT create a
 hybrid system which can work
 as a classic CSP power plant
 or in combined cycle mode. Internal dispatch
 management (DOME)

 F IGURE 3. G RIDSOL CONCEPT .

Power System impact and GRIDSOL potential D7.3 10
1.2. S COPE OF THE ANALYSIS The work carried out in this study complement and add on other analyses performed in previous work packages. Work package 5 (WP5) focused on analysing whether Gridsol and SRHs can be a solution in terms of adequacy of the transmission grid and included both a profitability assessment in 2030 and an analysis of the grid impact. Work package 6 (WP6) looked at the case of non-interconnected European islands and whether Gridsol can be an alternative supply of electricity. An analysis of Gridsol in the current power system in Crete was carried out for the year 2017 and several islands were analysed for 2030. This work package (WP7) explores how CSP-based power plants, i.e. the distinctive component of Gridsol, may contribute to the long-term decarbonisation of the European power system; the study therefore investigates the optimal evolution of the generation fleet under technical and market constraints that reflect the ambitious and compelling targets set for the year 2050. It is in this changing landscape that the potential of Gridsol and Smart Renewable Hubs is assessed specifically: the long-term transition of the European energy sector towards a system that entirely relies on renewable technologies demands the strategic reorganisation and expansion of the power fleet. The analyses takes a socio-economic perspective and disregards national taxation schemes, renewable energy subsidy and differences in cost of capital among between European countries. The CO2 costs are internalized by using a quota price that represents the different potential evolutions of the EU ETS system. The analytical focus is twofold, as it covers both continental Europe and an island system. Crete is chosen in the latter case due to its favourable solar conditions and in order to study how a potential interconnection with the mainland (Greece) would affect the role and profitability of CSP. In continental Europe, France, Greece, Italy, Spain, Portugal are found to have a sufficient solar resource to consider the installation of large CSP units. However, the model analyses cover a much greater geographic area in order to properly account for the power flows between countries. The analysis develops on two levels: the future potential of CSP-based power plants and the evaluation of their impact on both the European interconnected grid and on off-grid systems; the optimisation of the composition of Smart Renewable Hubs including an assessment of their strengths and operational features. The distinctive features of CSP generation are clarified. In particular, the identification of directly competing technologies allows to shed light on the conditions that make CSP more attractive in the years to come. The thermal energy storage transforms CSP into a dispatchable technology and it is the most reliable, cheap and feasible solution to decouple resource availability and power dispatch for renewable generators. A thorough comparison between CSP with thermal storage and PV with BESS is part of the assessment. Power System impact and GRIDSOL potential D7.3 11
1.3. EU 2050 SCENARIOS AND DECARBONISATION PATHWAYS
Following on the undersigning of the Paris
Agreement in 2015, the European Commission
agreed upon revising the Union’s Climate Strategy to
commit to the ambitious “well-below two degrees”
and “1.5 degrees” targets.

In November 2018, the new EU Climate Strategy was
published presenting different pathways envisioned
to achieve a decarbonised economy by 2050. These
trajectories ensure the development of such an
economy in a socially-fair but cost-efficient manner
[1]. The scenarios outlined in the new strategy lead
to a more robust emissions cut than projected in the
Baseline, which represents the mere continuation of
current policies (65% reduction with respect to
1990).

This document represents a new reference when
looking at the future development of power system
in Europe and will set the framework for discussions
on the future climate and energy policy. In addition,
it is a relevant source of assumptions for analyses and will be the starting point for evaluating energy
investments going forward.

The five “well-below two degrees” pathways feature reductions up to 80% (from 1990), while the two
“1.5 degrees” trajectories deliver a fully carbon-free economy by 2050. The COMBO framework serves as
a bridge between the two targets and combines elements of the other pathways.
The power sector is expected to continue to be on the forefront with respect to decarbonisation. Due to
the tightening of the EU ETS rules, progress in the efficiency of energy conversion systems and refined
market models for the renewables’ integration, emissions are expected to fall more rapidly than in any
other sector. No matter the final decarbonisation target, the power sector shall be nearly decarbonised
by 2050, with any residual emissions neutralized by Carbon Capture and Storage (CCS) [2].

While the soaring CO2 prices provide the right signals for investments in renewable energy technologies,
the substitution of fossil fuels with hydrogen and other synthetic products guarantees a progressive
switch also in the heavy industry and in the transport sector. The ongoing improvements in the efficiency
of electrolysers and fuel cells allow clean hydrogen to be a viable, scalable and cost-effective option for
the future. Depending on the specific pathway, the deployment of a hydrogen infrastructure and economy
is more or less pronounced. The Commission foresees at least 57 GW of electrolysers capacity installed
by 2050, with the possibility of reaching 500 GW in case of a massive uptake of the H2 economy.

The EU commission scenarios are used as a starting point and the main assumptions included in the design
of the scenarios to be analysed. The main parameters considered from the decarbonisation scenarios,
which creates the framework for this analysis are the following:

Power System impact and GRIDSOL potential D7.3 12
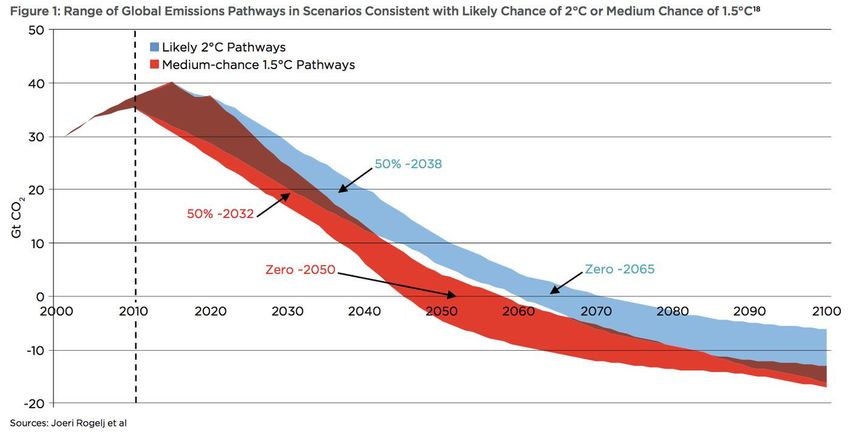
Price of CO2 Evolution of power demand Level of hydrogen production To simplify the setup, a synthesis of the different assumptions across scenarios has been carried out, given the large number of scenarios in the EU commission report. T EXT BOX . T HE DECARBONISATION OF THE ENERGY SYSTEM IN RELATION TO GLOBAL WARMING The Paris Agreement, for the first time, brought all nations into a common cause to undertake ambitious efforts to combat climate change and adapt to its effects, with enhanced support to assist developing countries to do so. Its central aim is to strengthen the global response to the threat of climate change by keeping a global temperature rise this century well below 2 degrees Celsius above pre-industrial levels and to pursue efforts to limit the temperature increase even further to 1.5 degrees Celsius [23]. Experts from the Intergovernmental Panel on Climate Change (IPCC) expects climate-related risks for natural and human systems are higher for global warming of 1.5°C than at present, but consistently lower than at 2°C [24]. In order to stay in line with a scenario having a medium chance of limiting the temperature increase to 1.5 degrees, net zero emissions have to be achieved by 2050. Conversely, a less ambitious target of keeping a 2 degree likely trajectory would mean achieving zero emissions by 2065. Power System impact and GRIDSOL potential D7.3 13
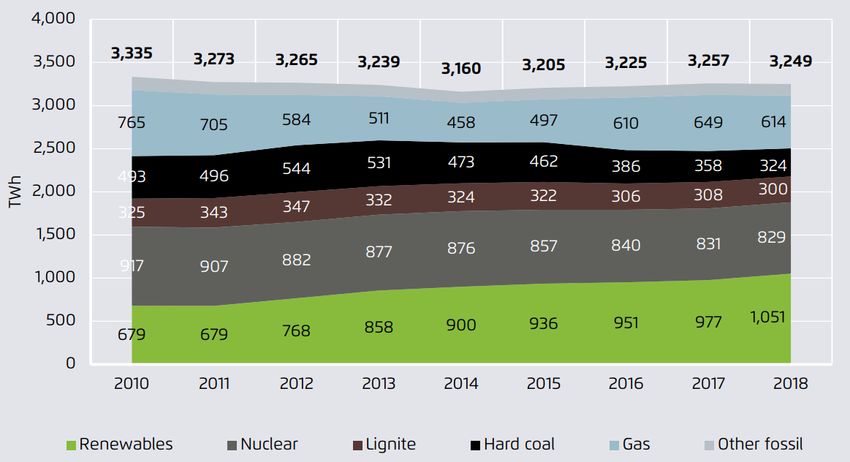
2. INTERCONNECTED EUROPEAN SYSTEM

2.1. S TATUS OF THE P OWER SYSTEM IN E UROPE

G ROWING RE IN THE MIX , SLOWLY DECLINING COAL
In the EU 28, the gross electricity consumption settled at 3,249 TWh in 2018. The largest share of
generation came from conventional thermal units (46%), followed by nuclear reactors (25%). The
electricity production from renewable sources was 28% (hydro, wind, solar and geothermal combined).
Renewable energy generation has increased by 74 TWh compared to 2017, at the expense of coal and
natural gas generation (Figure 4). In particular, coal and lignite generation slowly but steadily declined in
the last few years, driving down CO2 emissions from the power sector.

 F IGURE 4. D EVELOPMENT OF EU28 GENERATION OVERTIME . S OURCE : [3].

Europe plans on abating carbon dioxide emissions by 40% in 2030 with respect to 1990 levels. Specifically,
the sectors covered by the EU ETS must meet a stringent 43% reduction with respect to 2005, where
greenhouse gas emissions were 1711 Mt. According to a recent report by Agora Energiewende [3] the
power sector has already met this requirement. In 2018 the emissions level fell down to 985 Mt, marking
a 43% reduction relative to 2005.

E LECTRIFICATION OF END - USE SECTORS AND DIVERSIFICATION OF THE POWER DEMAND
While the electricity demand has been growing for the fourth year in a row, the level is still lower than it
was in 2010, testifying that conventional demand growth has reached a phase in which it is overall
stagnant in the continent [3]. The final demand for electricity is expected to grow in the coming years due
to the electrification of sectors like transport and the light industry. The booming market for heat pumps
in conjunction with electric heating will foster the electricity use in households and data centres will
account for an increasingly larger share of electricity use in the tertiary sector. The expectation from the

Power System impact and GRIDSOL potential D7.3 14
Deep decarbonisation scenarios of the European Commission is that by 2030 the demand rise 18% [2].
The rise in demand will be met mostly by VRES, due to the aforementioned limits related to conventional
generators and the price of carbon dioxide emissions.

M ORE AMBITIOUS TARGETS FOR 2030 AND COAL PHASE - OUT
The EU Regulation and task force mandate 32% renewable generation in gross total energy consumption
by 2030 and carbon neutrality by 2050. The power sector is set to continue driving the emission cut in the
EU ETS thanks to more and more variable renewable energy in the European system. Moreover, through
national programmes, many Member States have planned for the phase-out of lignite-fired and coal-fired
units. Figure 5 shows that a number of countries are already coal-free at present (Switzerland, Belgium,
Luxembourg, the Baltic region) with Norway having only a small Combined Heat and Power (CHP) unit in
operation, which is likely to be replaced in the near future. The rest of Europe splits into Western and
Eastern (including Balkan) countries; the latter have not discussed any coal phase-out,
except in a few cases (Slovakia, Hungary). Hungary in particular is considering a possible
shut-down of lignite power plants first, and a complete coal phase-out by the end of 2031. Overall, roughly
40 GW of installed coal capacity is going to be replaced in the countries that
have announced the coal phase-out [4].

 F IGURE 5. S TATUS OF COAL PHASE - OUT IN E UROPE . E LABORATION
 BASED ON DATA FROM (E UROPE B EYOND C OAL , 2019 B ).

Power System impact and GRIDSOL potential D7.3 15
The specific emission reduction targets and the renewable energy goals for the five Gridsol countries
(France, Greece, Italy, Portugal, Spain) are reported in Table 1.

 T ABLE 1. GHG REDUCTION AND RENEWABLE ENERGY TARGETS FOR 2030 AND 2050.

 Goals1

 France Greece Italy Portugal Spain

 2030 GHG reduction (compared to 2005 level) 40% 43% 33% 45-55% 32%

 2030 Final energy consumption from RES 32% 32% 30% 47% 42%

 2030 Electricity generation from RES 40% 56.4% 55.4% 80% 74%

 2050 GHG reduction (compared to 2005 level) 100% 100% 100% 100% 100%

 2050 Electricity generation from RES 100% 100% 100% 100% 100%

S OARING CO 2 PRICES IN THE EU ETS SECTOR
A paramount means to achieve the medium and long-term decarbonisation targets is the European
Emission Trading System (EU ETS). The fourth phase (2021-2030) is going to see the implementation of a
tighter linear reduction factor for the carbon cap, up from 1.74% to 2.20%. The system will act in
conjunction with the newly designed Market Stability Reserve, which progressively lessens the number of
allowances available for trade. As a consequence, the CO2 quota price is set to substantially jack up in the
years to come so as to provide the right signals for the phase-out of conventional generators and their
replacement with renewable technologies. The new reforms affecting the EU ETS are expected to limit
price oscillations and collapses, as recorded after the 2008 financial crisis (Figure 6).

 35
 30
 Carbon price [EUR/t]

 25
 20
 15
 10
 5
 0
 abr.-08 abr.-10 abr.-12 abr.-14 abr.-16 abr.-18
 F IGURE 6. E VOLUTION OF THE CARBON PRICE IN THE EU ETS SYSTEM (2008-2019).

1
 Source: National Energy Plans.

Power System impact and GRIDSOL potential D7.3 16
2.2. S TATUS OF C ONCENTRATED S OLAR P OWER (CSP) IN E UROPE AND THE WORLD
Over 2017-2018, 97.5 GW of renewable energy capacity were auctioned globally. Winning bids were
almost exclusively solar PV and wind projects, accounting in total for more than 97% of the total volume
[5]. As a not-yet-mature concept, CSP had a hard time keeping with the increased competitiveness of
more established technologies. Less than 1% of the auctioned volume went for CSP capacity,
predominantly in America and Asia, where the abundance of natural resources drive the generation costs
down and, consequently, let CSP compete with other renewables (Figure 7). In these countries different
types of public support have incentivised the spread of CSP and convenient financial frameworks have
been adopted for renewables (including CSP) to achieve grid parity: they all aim at mitigating the risk
connected to the realisation of a new CSP project and they include Power Purchase Agreements (PPA),
Public-Private Partnerships (PPP) and other types of market-based tariffs and incentives. The size of
recently built solar thermal power plants has increased to take advantage of economy of scale; it is in this
framework that the solar tower concept is gaining momentum, particularly in sites with great solar
potentials and devoid of land-use constraints. On the contrary, most of the existing CSP plants in Europe
rely on the parabolic trough concept, though scattered installations lean on linear Fresnel and solar tower
fields. The vast majority of these plants are found in Spain, where the installation of CSP units was
incentivised through the use of a Feed-in Tariff (FIT) and lead to the rapid evolution of an industry with no
prior experience in Europe. Among the Spanish solar thermal fleet, the Gemasolar plant constitutes an
example of the central tower concept, with a remarkable storage volume (15 hours) that guarantees
capacity factors up to 55%2.

 F IGURE 7. A UCTIONS IN 2017-18: WINNING TECHNOLOGIES PER REGION . S OURCE : I RENA .

In Europe, most Member States have used tenders to ensure new renewable energy installations.
Different tendering designs have been put into place. In some contexts (the Netherlands, Spain, Poland,
Portugal, the UK) technology-neutral auctions have been mandated, whereas in other cases governments
have awarded the right to build new generation capacity to specific technologies. Solar PV and onshore
wind have been the most widely auctioned technologies [6]. CSP was reserved a minor role in the
integration of new capacity and the few recent technology-based tenders in France and Italy (below 100

2
 Source: NREL.

Power System impact and GRIDSOL potential D7.3 17
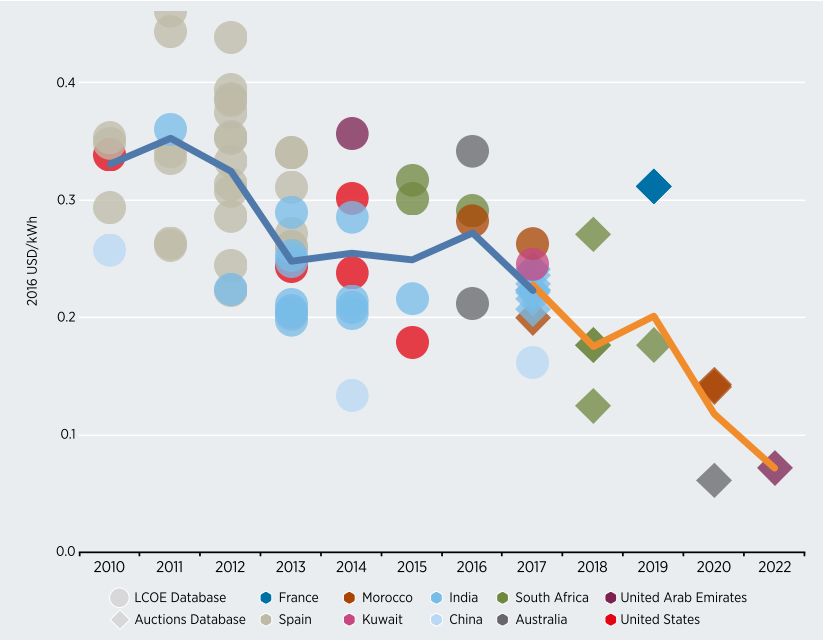
MW) led to scant bid volumes, insufficient to cover the assigned capacity. In the case of France, winning
projects have had low realisation rates. Concentrated Solar Power suffers from the competition with more
mature and established technologies, especially in locations characterised by a medium-low solar
potential such as Europe. However, the current European CSP industry established in the course of few
years and achieved a notable degree of maturity. New business models have seen the light, such as
integrated, hybrid plants that incorporate solar thermal technologies into innovative plant layouts. Gridsol
and Smart Renewable Hubs are an example.

ENABLERS FOR G RIDSOL AND C ONCENTRATED SOLAR POWER
Despite the fierce competition with more mature technologies, the evolving European power sector sets
potentially favourable conditions for the spreading of CSP and SRHs. The ambitious climate targets the
European Union undersigned and the possible development of new markets (ancillary services) call for a
faster replacement of conventional technologies and at the same time for a progressive need for more
capacity; these are driven by the electrification of other energy and end-use sectors, namely the gas
supply and the industry, in addition to the rising demand for new fuels (hydrogen and other P2X gases).
Provided that sufficient cost reductions are achieved and new business models and financial frameworks
are designed, CSP represents a competitive alternative in Southern Europe as it addresses market
segments that traditional VRES do not fill.

Figure 8 shows that CSP auction prices are falling below 100 EUR/MWh in the world, due to technological
advancements and a rather fast industrial uptake. As of 2019, the lowest bid on CSP technologies was set
in the United Arab Emirates, where the Levelized Cost of Electricity (LCoE3) was estimated to be 72
USD/MWh [5]. Sites with an average DNI between 2000 and 2500 kWh/m2 are expected to see notable

 F IGURE 8. A UCTION RESULTS FOR CSP.

3
 The Levelized Cost of Electricity (LCoE] expresses the cost of the megawatt-hours generated during the lifetime of
the plant, and it represents a life cycle cost. A definition is available in the Glossary.

Power System impact and GRIDSOL potential D7.3 18
LCoE cost reductions in future years; by 2035, these locations could host CSP power plants with average
costs of generation under 60 EUR/MWh [7]. While locations with higher solar resources are certainly
favoured, it is uncertain to which extent the industry will develop in future years. Little literature on the
solar tower technology development exists, and learning rates (LRs) are difficult to identify with accuracy.
Researchers envision LRs of 5 up to 20% [7], [8], but the ongoing standardisation of industrial processes
may speed up the cost cut.

Competitiveness is the result of the progress within the industry and the evolution of system surrounding
it. The aforementioned decommissioning of conventional power plants and the progressive nuclear
shelving will leave a big room for new dispatchable technologies such as CSP and Smart Renewable Hubs.
Indeed, the intelligent management and complementarity of the hub units can ensure a higher degree of
flexibility compared to wind and solar. System operators across the continent will also see increased
requirements in terms of system services and inertia of the fleet; these are nowadays provided by
conventional fossil-fuel generators but their replacement can be a key-driver for CSP in both
interconnected and island systems.

An additional enabler for concentrated solar power in the system will be the increasing exposure of wind
and solar to market dynamics, which makes investments riskier and the lifelong coverage of financial
layouts more uncertain. This is due to the abandonment of Feed-In Tariff (FIT) systems in favour of
premiums or contract for differences awarded through auctions [9]. Flexible generators such as CSP with
thermal energy storage are able to decouple resource availability and dispatch and can therefore profit
from higher power prices.

Another consideration related to the market
exposure is that when one type of variable
renewable technology acquires large market
shares, the average economic returns are
progressively reduced. This is a consequence of
VRES not being able to dispatch. The resulting
low wholesale market prices in hours of high
production challenge the competitiveness of
solution that might be cheaper in terms of LCoE,
like solar PV will be in the next future. Figure 9
stresses the dependence of the Value Factor
(VF) on the renewables market shares. VF is
defined as the ratio between the market value
of a generator and the average wholesale F IGURE 9. R EDUCTION IN THE V ALUE F ACTOR (VF) FOR WIND AND
market price. As the market penetration of a SOLAR TECHNOLOGIES . S OURCE : [25].

certain type of renewable increases, the VF
drops.

Power System impact and GRIDSOL potential D7.3 19
2.3. A NALYSIS AND SCENARIO SETUP R ESEARCH QUESTIONS The analysis identifies the key-drivers at the basis of a long-term CSP deployment in continental Europe. The technology can be integrated into the electric grid in the following manners: As a single-source technology; Combined with a gas turbine with heat recovery; Installed alongside other renewable units to form a hybrid power plant (Gridsol as a particular type of Smart Renewable Hub). This work gives an overall picture of what is the market attractiveness of each of the previous concepts, when applied to decarbonisation pathways. More in detail, this deliverable answers to the ensuing questions: What is the role of CSP and Gridsol in the decarbonisation of the future European power sector? What are the factors influencing the profitability of CSP and Gridsol in different years and geographies? What role does CSP have in the electricity dispatch? What are the main competing technologies? What is the added value of flexible generation in a high VRES system and who can provide the flexibility? S CENARIO ANALYSIS In order to answer the research questions and take into account a range of possible developments of the power system in the future, a scenario analysis is conducted. In a scenario analysis, different possible outcomes are analysed considering potential “alternative futures” based on a range of input parameters. The main focus for the choice of the scenarios in this analysis is related to the extent of decarbonisation of the energy system, measured with respect to the degrees of global warming. Specifically, the framework draws on the aforementioned Deep decarbonisation pathways from the European Commission (ref) presented in Section 1.3. Given the uncertainty in the evolution of CSP and Gridsol costs in the medium- to long-term future, due to the lack of a solid number of projects and the relatively novel nature of the technology, the cost of CSP represents another dimension of the scenario framework. Specifically, a scenario with a further cost reduction compared to the baseline cost development is analysed. The scenarios chosen for the analysis are the following (Figure 10): Baseline: represents a development of the European system with relatively moderate decarbonisation efforts and consequently a low price of CO2. It follows the main assumptions from the EU commission Reference scenario from 2016 [10]; Power System impact and GRIDSOL potential D7.3 20
2.0 degrees: follows main assumptions from the 2 degrees scenarios of the Deep decarbonisation study and aims at limiting the greenhouse gas emissions of Europe in order to be in line with a global temperature rise of “well-below” 2 degrees; 1.5 degrees: follows main assumptions from the 1.5 degrees scenarios of the Deep decarbonisation study and aims at limiting the greenhouse gas emissions of Europe in order to be in line with a global temperature rise of no more than 1.5 degrees (corresponding to a close to 100% reduction of CO2 emission in Europe by 2050); CSP+: has the same overall framework as the 1.5 degree scenario, but considers a further 40% reduction of the OPEX and CAPEX of CSP compared to the rest of the scenarios (which use the Gridsol project reference cost projections). F IGURE 10. S CENARIO OVERVIEW . Another important parameter related to the decarbonisation ambitions of the European energy sector is the utilization of electricity to produce hydrogen and other synthetic gases. These gases can be used to substitute fossil fuels in sectors that are harder to electrify or to convert to renewables, such as heavy transport, aviation and industry. Not surprisingly, the more decarbonized the energy sector is, the more the demand for hydrogen increases, and so does the electricity demand needed for its production through electrolysis processes. While in the Baseline, for the EU-28 countries alone, it reaches a value of 4 Mtoe in 2050, this increases to 20 and 80 Mtoe respectively for the 2.0 degrees and the 1.5 degrees scenarios respectively. To give an idea of the magnitude of the power demand top-up, 80 Mtoe of hydrogen correspond to a minimum power demand increase of around 1200 TWh, corresponding to roughly 38% of today’s European electricity consumption. As a consequence, the amount of power plants needed to fulfil this demand greatly increases in the more extreme decarbonisation scenarios. Table 2 gives an overview and a recap of the main assumptions in the four scenarios analysed. Power System impact and GRIDSOL potential D7.3 21
T ABLE 2. S CENARIO CHARACTERISATION .

 GHG reduction CO2 price H2 demand in
 Scenario target (2050) EU-28 (2050) CSP cost projections
 (all sectors) [EUR/t] [TWh]

 Baseline 65% 91 47

 2.0 degrees 80-85% 251 233
 Gridsol project reference
 1.5 degrees
 ~ 100% 366 930
 -40% CAPEX and OPEX
 CSP+
 compared to reference

 T EXT BOX . CSP COST PROJECTIONS
 The CSP+ scenario assumes a 40% cost reduction with respect to projections foreseen by the CSP
 industry. The literature available on the topic reflects these assumptions, but a rapid uptake of CSP
 could reduce and totally bridge the existing gap. Concretely, this means technological
 advancements should cut costs for 1.2 million EUR per MWe installed already by 2030, assuming a
 solar multiple of 2.5 (Figure 11). Automation, improved technical design and an efficient industrial
 supply chain can contribute to this drop (in the figure, future costs are normalized with respect to
 2018 costs).

 1,0 1,8

 1,6
 0,8
 Cost gap [MEUR18/MWe]

 1,4
 Reduction factor [-]

 1,2
 0,6
 1,0

 0,8
 0,4
 0,6

 0,2 0,4

 0,2

 0,0 0,0
 2018 2020 2025 2030 2040 2050

 Literature Cost gap Gridsol project CSP+

 F IGURE 11. CSP COST ASSUMPTIONS IN THE SCENARIOS UNDER STUDY .

Power System impact and GRIDSOL potential D7.3 22
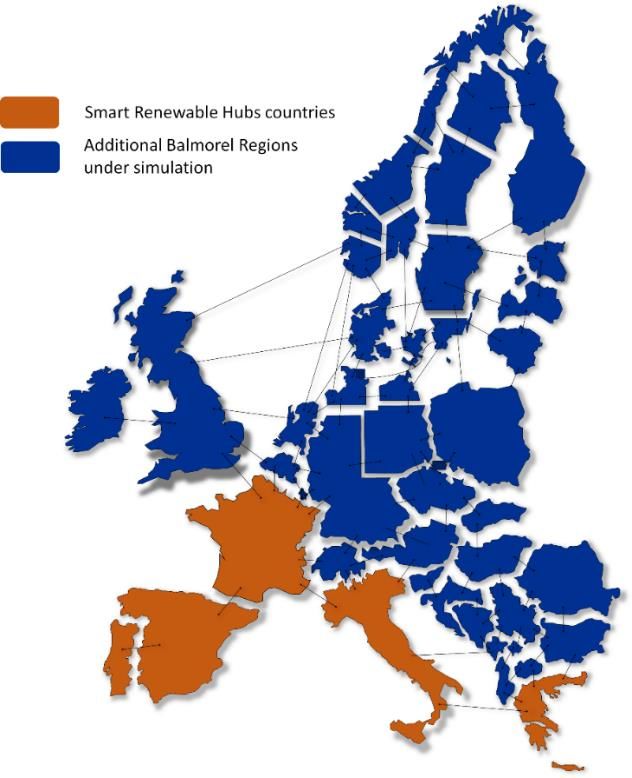
T HE MODEL : B ALMOREL
To carry out the analysis, the Balmorel model4 is
used. It is an open-source, bottom-up, fundamental
model which optimises the investments and the
operations of large-scale energy systems, more
specifically in the power and heat sectors, with a
resolution down to the hourly level.

The simulations cover the years between 2020 and
2050, with 2018 being the reference year and
intermediate simulations for 2030 and 2040. For
each year the model optimized the development of
the system in terms of generation fleet, as well as
the dispatch of power plants to fulfil demand at the
lowest cost.

The geography considered in this study comprises
the EU 28 plus Bosnia, Kosovo, Macedonia,
Montenegro, Norway, Serbia and Switzerland
(Figure 12). The five Gridsol countries, in which
investment in the CSP and SRHs are allowed, are
highlighted. Countries can be divided into several
Regions reflecting the local structure of the
electricity market or to better represent conversion
 F IGURE 12. G EOGRAPHICAL SCOPE OF THE MODEL .
technologies and the grid infrastructure.

4
 More details on the model characteristics can be found in the text box below. The Appendix include a more detailed
overview of the assumptions behind the modelling.

Power System impact and GRIDSOL potential D7.3 23
T EXT BOX . T HE B ALMOREL M ODEL
 Balmorel is an open-source, bottom-up, fundamental model which optimises the investments and the
 operations of large-scale energy systems, more specifically in the power and heat sectors; it is coded
 in GAMS (Generalised Algebraic Modelling System) and converges to the optimal solution by means
 of linear programming techniques. For unit commitment problems, integer variables can be
 introduced as well. Balmorel requires a set of quantities to be defined exogenously: these are demand
 prognoses, fuel prices, the existing and committed generation fleet, existing and committed
 transmission capacity, policy constraints and the technology catalogue from which the model chooses
 the future generation units. The goal of the optimisation process is to find the structures s (i.e. the
 size of the energy system) and the relative operations o so that they minimise the total system costs.
 These can be decomposed into capital and operational expenditures (CAPEX and OPEX) plus any other
 cost the system incurs:

 min = min( ⋅ , + , + ℎ , )
 , ,

 where z represents the problem’s objective function and a the factor the annualises capital
 expenditures. The optimal solution yields the least-cost dispatch and the least-cost investments, both
 generation- and transmission-wise. Finally the model is deterministic and perfect foresight is assumed
 in the various optimisation/simulation modes.

Power System impact and GRIDSOL potential D7.3 24
You can also read